Article

Decomposition Analysis of the Carbon Emissions of the Manufacturing and Industrial Sector in Thailand †

by
Jaruwan Chontanawat
1,*,
Paitoon Wiboonchutikula
2 and
Atinat Buddhivanich
3
1
Department of Social Sciences and Humanities, School of Liberal Arts, King Mongkut’s University of Technology Thonburi, Bangkok 10140, Thailand
2
Faculty of Economics, Chulalongkorn University, Bangkok 10330, Thailand
3
Bureau of Industrial Sectors Development, Iron and Steel Institute of Thailand, 1st-2nd Fl., Bangkok 10110, Thailand
*
Author to whom correspondence should be addressed.
This paper is an extended version of our paper published in 6th International Conference on Energy and Environment Research, ICEER 2019, 22–25 July, Aveiro, Portugal.
Energies 2020, 13(4), 798; https://doi.org/10.3390/en13040798
Submission received: 31 December 2019 / Revised: 1 February 2020 / Accepted: 4 February 2020 / Published: 12 February 2020
(This article belongs to the Special Issue Challenges Towards Sustainable Energy)

Abstract

:
Since the 1990s, CO2 emissions have increased steadily in line with the growth of production and the use of energy in the manufacturing sector in Thailand. The Logarithmic Mean Divisia Index Method is used for analysing the sources of changes in CO2 emissions as well as the CO2 emission intensity of the sector in 2000–2018. On average throughout the period, both the amount of CO2 emissions and the CO2 emission intensity increased each year relative to the baseline. The structural change effect (effect of changes of manufacturing production composition) reduced, but the intensity effect (effect of changes of CO2 emissions of individual industries) increased the amount of CO2 emissions and the CO2 emission intensity. The unfavourable CO2 emission intensity change came from the increased energy intensity of individual industries. The increased use of coal and electricity raised the CO2 emissions, whereas the insignificant change in emission factors showed little impact. Therefore, the study calls for policies that decrease the energy intensity of each industry by limiting the use of coal and reducing the electricity used by the manufacturing sector so that Thailand can make a positive contribution to the international community’s effort to achieve the goal of CO2 emissions reduction.

1. Introduction

Greenhouse gas (GHG) concentrations in the atmosphere causing global warming have become an increasingly serious environmental problem. The concentrations rose rapidly after 1990, with no current sign of slowdown, let alone a decline, and the adverse impacts are numerous and evident to all. For example, the global temperature is set to rise by 1.8–4 °C. There are more hot days and fewer cold days. Ice sheets at the North and South Poles are melting and the sea level is rising. Extreme weather events and all types of natural disasters, such as earthquakes, floods, storms, drought, and bushfires, are happening more frequently and the impacts have become increasingly destructive. Aerosols of all forms also rise rapidly, putting human health at long-term risk. Over 80% of the GHG concentrations come from carbon dioxide (CO2) emissions, with most of the rest from methane and forest fires. CO2 emissions are not only the most common type of GHG but have recently risen at a rate above the average of the past decades. The emissions lead to GHG concentrations because, although they are partly absorbed by seas, land and forests, a large part is trapped in the atmosphere for a long time and creates CO2 concentrations that produce drastic climate change, affecting all regions around the world [1].
In 2018 the CO2 concentrations increased to 407.8 parts per million (ppm), which was an increase of 47% from the pre-industrial level in 1750, or 41% from 1990. During 1990–2018, over half of the CO2 emissions came from the burning of fossil fuels for use in the production of manufactured goods, electricity, and construction, followed by transportation, agricultural and residential and commercial activities. In terms of country source, the emissions were mostly from China, followed by the USA, the Asia Pacific countries, and the EU. However, the countries with the most rapid rise in emissions were China (11.4% a year), followed by India (11.1%), the Middle East (8.3%), and Asia Pacific (2.5%) (computed from the World Meteorological Organization (WMO) database [2] and Our World in Data [3]).
Thailand is one of the top carbon emitters in Asia Pacific. Although the CO2 emissions level of Thailand is not large relative to the world total, it was ranked among the top 20 emitters in 2018. It also had a high emissions growth of 10% during 1990–2018, resulting in Thailand being among the top 30 countries with the highest CO2 emissions per unit of production [4,5]. The rapid rise of the CO2 emissions level and the CO2 emissions per unit of production in Thailand, as well as in other emerging markets such as China and India, is due to their rapid industrialization. Since the 1980s, the industrial sector of these countries has grown exceptionally rapidly, and each country has used enormous energy and electricity in the production process, resulting in an increased burning of fossil fuels. Developed countries in Europe and North America, which industrialized early, emitted a large amount of CO2 emissions after the Industrial Revolution in the 19th century, but found ways to reduce CO2 emissions per unit of production (decarbonisation or reduced CO2 emission intensity) in recent decades by mitigating the use of energy in each unit of production, changing the fuel mix from more to less carbon-intensive fuels, and facilitating the structural change of manufacturing production from more to less energy-intensive industries (see [1]).
Our study aims to determine the source of the rapid rise of CO2 emissions of an emerging market, with special reference to Thailand, and to find out what can be done to reduce both the level of emissions and the emission intensity while the manufacturing sector is still growing. The structure of our paper is as follows. Section 1 introduces the study. Section 2 provides a review of the literature and its contribution on the topic. Since CO2 emissions come with industrialization, Section 3 provides a background on Thailand’s growth and the structural change of the manufacturing sector by dividing the period 1990–2018 into subperiods in accordance with changes in the economic conditions of the country and the world. Section 4 measures the CO2 emission level and CO2 emission intensity of the industries and compares them with those of other major economic sectors during the period of 1990–2018 (when the complete database for our study is available). The section also investigates the CO2 emissions problem of the manufacturing sector in detail by measuring the amount and intensity of CO2 emissions at the subsectoral level, including their changes over time. Section 5 highlights the analysis of the source of changes of CO2 emission level and CO2 emission intensity through the Divisia index decomposition approach. In this section we first describe the decomposition method, and next interpret the computed results. Finally, Section 6 reports on our findings and draws policy implications for reducing CO2 emissions in the manufacturing sector.

2. Literature Review and Contribution

The use of the decomposition method for studying energy and environmental problems began in the 1970s when energy prices jumped and developed to an energy crisis. During that period, researchers attempted to help policy-makers find effective channels to reduce energy usage by using the decomposition method to separate the changes of energy consumption and energy intensity (energy consumption per unit of production) into different sources in order to correct the problems at the source. An earlier study by Chontanawat et al. [6] incorporates a good literature survey conducted by Ang [7] and Ang and Zhang [8] on the use of the decomposition method for analysing energy consumption and energy intensity problems during the 1970s to late 1990s. In the survey, works by Boyd et al. [9], Park [10], Ang [11], and Ang and Liu [12] are found to be seminal studies that led to other researchers still widely using the decomposition method today. Since the 1990s, when climate change and greenhouse gas (GHG) emissions became a global issue, the method has further been applied to study the source of growth in CO2 emissions and the change in CO2 emission intensity in various economic sectors of both developed and developing countries [8,13].
In studies on the source of growth in CO2 emissions, Ang [14,15] used the decomposition method to break down the growth into five sources, namely, output expansion, structural change of production, change of energy intensity of subsectors, mixture of energy sources of subsectors, and the change of emission factors (CO2 emission per energy use). In the study of the source of the change of CO2 emissions, the change is separated into two parts: the structural change effect and the intensity change effect. The method for decomposing the source of the growth or the change can be done by using either the Laspeyres index or the Divisia Index computation method. In turn, each computation method can be calculated by using either the additive or the multiplicative approach. Our study will use the most widely used method, namely, the one based on the logarithmic mean Divisia Index (LMDI), because it has the advantage of removing unexplained residuals, together with the ability to manage the zero value problem. In fact, Ang [16] explicitly advocates the LMDI decomposition method. That study details the development of the approach by presenting eight LMDI methods based on additive and multiplicative approaches to decompose energy and energy intensity. The findings indicate that the results of an additive decomposition analysis and those of a multiplicative decomposition analysis are closely related. Generally, the additive method is appropriate when used along with a quantity indicator, whereas the multiplicative method is more appropriate when used together with the intensity indicator. His study provides a guideline on the choice of an appropriate decomposition method and the foundation for using the LMDI method for finding the source of changes in the amount of CO2 emissions and CO2 emission intensity of various countries.
Empirical studies on either the change of the amount of CO2 emissions or the change of CO2 emission intensity are conducted mostly for developed countries at the economy-wide level. There are studies by Kisielewicz et al. [17], Drastichová [18], Moutinho et al. [19], González et al. [20], and Bhattacharyya and Matsumura [21] for the EU; Shahiduzzaman et al. [22] for Australia; Casino et al. [23,24] for Spain; O’Mahony [25] and O’Mahony et al. [26] for Ireland; Sun [27] for Finland and Sweden; and Oh et al. [28] for South Korea. Most results show that economic activity and population growth are the main sources of the change in the amount of CO2 emissions in these countries. Efforts to reduce the energy intensity and change the fuel mix are helpful for mitigating the CO2 emission intensity. The recent interesting work by Mountinho et al. [19] breaks down the CO2 emissions of 15 European Union countries during 1995–2007 into six effects and finds that the negative contribution of the effects of total energy consumption, renewable capacity productivity, changes in capacity of renewable energy per capita, and changes in population exceeded the positive contribution of the effects of carbon intensity reduction and changes in energy intensity, leading to an increase in CO2 emissions. Therefore, in order to reduce the CO2 emission intensity, it is crucial to increase the capacity of renewable energy and energy generation through a decrease in the share of fossil fuel consumption. Studies on the sources of the change in the amount of CO2 emissions for developing countries are scarce. There are, for example, Chong et al. [29] for Malaysia; Qi et al. [30], Lv et al. [31], Xu et al. [32], Ning et al. [33] and Wang et al. [34] for China; Sheinbaum et al. [35] for Latin American countries; and Charlita de Freitas and Kaneko [36] for Brazil. Most of these studies conclude that both economic activity and structural change play a dominant role in the change of CO2 emissions at the economy-wide level.
The research on the decomposition of the change of the amount of CO2 emissions or the CO2 emission intensity using the LMDI method at the industry level is sparser than the studies at the economy-wide level. The most recent studies in developed countries include Hammond and Norman [37] for the UK; O’Mahony et al. [26] for Ireland; and Jeong and Kim [38] for South Korea. Their main findings are as follows. Hammond and Norman [37] indicate that the carbon emissions in the UK manufacturing sector dropped by about 2% in 1990–2007 because of the reduced energy intensity, influenced by fuel switching towards electricity and natural gas, together with more efficient technology. O’Mahony et al. [26] used a multisectoral framework to decompose Ireland’s energy-related CO2 emissions in the industrial sector during 1990 to 2007. The decomposition results show that the change in CO2 from industry generally came from production expansion and benefited from the country’s industrial development policy. Energy intensity reduction is the major factor decreasing industry emissions in all subperiods and over the entire time period. Jeong and Kim [38] investigated greenhouse gas (GHG) emissions in the South Korean manufacturing sector from 1991 to 2009 and decomposed the GHG emissions into five different effects, namely, the activity effect, structural change effect, intensity change effect, fuel mix effect and emission factor effect. Their main finding was that both structural change and intensity change were crucial for decreasing GHG emissions, but structural change played a greater role than the intensity change. The GHG emissions were increased by the fuel mix effect but reduced by the emission factor effect. Furthermore, the study found that the GHG emission pattern changed after the 1997 economic crisis in South Korea. The structural change and intensity change helped reduce the amount of CO2 emissions at a rate greater after than before the crisis. In addition, after oil prices rapidly rose in the early 2000s, both the structural change and the intensity were strengthened and became the major source of CO2 emissions reduction in South Korea.
An early study on the source of the change in CO2 emissions or CO2 emission intensity at the industry level in developing countries in the 1990s is the work by Ang and Pandiyan [39]. They decomposed energy-related CO2 emissions in the manufacturing sector using the Divisia Index method for China, South Korea and Taiwan. The results confirm that the intensity effect most influences the change in CO2 intensity in these countries. More recent works are, for example, Qi et al. [30] and Yan and Fang [40] for China at the national level; Shao et al. [41] for the city level of Tianjin, China; and Akbostanci et al. [42] for Turkey. Qi et al. [30] analysed the driving factors of energy-related CO2 emissions reduction in China for the period 2005–2013 using the LMDI method, and found that the primary contribution to emissions reduction was from the reduction of energy intensity in the industrial sector. Yan and Fang [40] analysed the source of CO2 emission change in the manufacturing sector in China and found that CO2 emissions increased enormously in 1993–2011 due to the use of coal as the energy source. Furthermore, while the industrial growth increased the CO2 emissions, the energy intensity effect diminished it. For future CO2 emission mitigation, policies should be designed to reduce the energy intensity and emission factors of coal and electricity in China’s industrial sector. Shao et al. [41] investigated the source of carbon emissions from energy consumption at the industry and city levels in Tianjin, China. They analysed the factors that influence industrial carbon emissions in the region by decomposing the emissions into four drivers: economic scale, industrial structure, energy efficiency and energy structure. The results show that, between 1999 and 2010, total carbon emissions from the use of energy in industries in Tianjin grew steadily at an average rate of 11.4%. Industrial energy intensity declined, implying the successful achievement of an industrial low-carbon transition in Tianjin. Both a growth in production and the energy structure significantly contributed to the total carbon emissions. The results suggest that an improvement in energy efficiency is crucial for conserving industrial energy and reducing carbon emissions in Tianjin. The study by Akbostanci et al. [42] used the LMDI method to analyse the CO2 emissions of the Turkish manufacturing industry in 1995–2001. They decomposed the changes in CO2 emissions into five parts, namely, changes in industrial activity, sectoral energy intensity, sectoral fuel mix and emission factors, and confirmed that changes in industrial activity and energy intensity are determinants of changes in CO2 emissions in the industrial sector.
In the case of Thailand, the studies on CO2 emission decomposition are very limited. The most recent one by Chontanawat [43] studies the main driving factors of CO2 emissions at the economy-wide level for four selected ASEAN countries (including Thailand) using the IPAT model. The studies at the industry level are very few. They mostly focus on the source of energy intensity changes, for example, Ussanarassamee and Bhattacharyya [44] for industries before 2000, Wiboonchutikula et al. [45] for the steel industry, and Chontanawat et al. [6] for the manufacturing sector in the 2000s. The only study on the decomposition of CO2 emissions at the industry level is that by Bhattacharyya and Ussanarassamee [46]. They decomposed both the energy and the CO2 emission intensity of Thai industries between 1981 and 2000 and found that the CO2 emission intensity declined during 1981–1986, mostly due to both energy intensity change and structural change. In the following period (1986–1996), the CO2 emission intensity increased because the negative contribution of the energy intensity and fuel mix effects prevailed over the positive structural change effect. During the economic crisis of 1997 to 1998, CO2 emission intensity decreased with the help of the reduction of energy intensity, but the structural change effect did not help. During the recovery period (1998–2000), the reduction in CO2 emission intensity was due to the structural change and fuel mix effects, although the energy intensity showed an increasing trend. Our study seeks to add to the literature by explaining, and exploring the policy implications of, the increased CO2 emissions and CO2 emission intensity of an emerging market at the sectoral level, emphasizing the industrial sector, which is among the top CO2 emitters in the economy.

3. Background on Thailand’s Industrial Growth and Structural Change

Thailand developed from an agriculture-based economy in the 1960s to a newly industrialized country in the 1980s. From the middle of the 1980s to the present, the manufacturing sector grew rapidly. However, growth has slowed down in the current decade due to global economic turbulence, combined with domestic political uncertainty. On the whole, industrial production expanded, as did energy consumption and CO2 emissions in the sector. In fact, among the major economic sectors, the manufacturing sector released the most CO2. During the past three decades, as the manufacturing production grew at an average rate of 4.4% a year, the energy consumption of the sector also grew as high as 10% a year, leading the CO2 emissions to increase by 9% (computed by DEDE [47]). Below we will provide the background on Thailand’s industrial growth and structural change during 1990–2018 before studying the CO2 emissions of the sector.
Industrialization in Thailand began in the 1960s under the import-substitution policy and a buoyant world economy. The growth of the country’s manufacturing sector was the most rapid in the decade from the mid-1980s to the mid-1990s, when policy shifted towards increased opening to international trade and investment. However, in 1997 the country was caught off guard by an unexpected economic crisis after it opened the economy further in 1990 by fully liberalizing the international financial sector. As a result of the crisis, industrial growth declined for a few years before recovering and growing satisfactorily again in the first half of the 2000s. After the mid-2000s, the growth rate of the sector declined in response to the financial crisis in developed countries, which led to the Great Recession of 2007 to 2009, along with Thailand’s domestic political crisis, which ended with the coup of 2014. Table 1 shows the fluctuation in annual growth rates between 1990 and 2018. When we separate the whole period into five subperiods corresponding to the economic and political changes described above, namely, 1990–1997, 1997–2000, 2000–2007, 2007–2010 and 2010–2018, the table shows that the growth was high, at 7.4% and 6.3%, in the first and the third subperiods, but reduced to 1.3%, 3.3% and 1.7% in the second, fourth and last subperiods. A more detailed explanation of the fluctuation in growth rates and the structural change at both the economy-wide and the manufacturing sector levels will be given below.
During the first subperiod (1990–1997), the manufacturing sector grew by 7.4%, following the spectacular growth of 14% per year of the sector in the late 1980s. From 1986 to the mid-1990s, the sector benefited from high export growth of almost 20% a year and a huge wave of foreign direct investment in the second half of the 1980s. In 1990 the government opened up the country further by liberalizing the international financial sector, expecting to become a financial centre in the region. In retrospect, the new policy was not so beneficial to industrial development as the liberalization of international trade and foreign direct investment. As a result of the financial liberalization, foreign loans in U.S. dollars increased the speculation on investment in equity and reality instead of increased foreign direct investment. The speculative investment gave rise to bubbles in the equity and realty sectors, which eventually burst in 1997 and pushed the economy into twin financial and currency crises, followed by a deep recession in the next two years [49].
During the second subperiod (1997 to 2000), the average annual growth of the manufacturing sector was reduced to merely 1.3%. The sectors that suffered the most from the crises were highly capital-intensive industries that financed their investment with foreign currency debt. Meanwhile, the sectors that survived the crises were the ones producing food products and labour-intensive manufactured goods for export. They gained from the large depreciation of the domestic currency in the aftermath of the collapse of the country’s essentially fixed exchange rate system, in addition to the favourable world market.
In the third subperiod (2000–2007), the Thai economy quickly recovered from the 1997 crises due to the country’s relatively sound economic foundation. The manufacturing sector growth returned to a high level of 6.3% a year. Table 2 shows that the proportion of manufacturing production to the total production of the economy steadily increased from 26% and 28% in the first and second subperiods to almost 29% in the this third subperiod. The rapid growth was largely thanks to the manufactured export growth of 12% a year and a steady increase in foreign direct investment in Thailand’s global value-chain-related industries, namely, the electrical and electronics industry and the motor vehicle industry.
During the fourth subperiod (2007–2010), both exports and foreign direct investment declined as the Great Recession took its toll on the world’s economy. During this subperiod, production in the manufacturing sector was reduced to 3.3% a year, a rate high enough for the proportion of manufacturing output to total production to further increase to about 30%. In the most recent subperiod (2010–2018), while the world economy remained volatile and had not yet fully recovered from the Great Recession, the Thai economy suffered another period of slow growth due to unresolved political conflicts simmering from the previous subperiod that eventually culminated in a coup in 2014. The growth of the manufacturing sector declined further to 1.7% a year and the proportion of manufacturing production to total production dropped to 28% (see Table 2).
On the whole, although the growth of Thailand’s manufacturing industrial sector fluctuated from 1990 to 2018due to a series of economic and political crises, Thailand has undergone a fundamental change in economic structure from an agriculture-based society to a newly industrialized country. Table 3 shows that, besides the structural change at the economy-wide level, within the manufacturing sector there was also an upgrading of its production structure. In fact, Wiboonchutikula [50] has shown that the rapid growth and structural change in the manufacturing sector had taken place earlier during the second half of the 1980s. During that period there was a shift in production composition from the traditional natural-resource-based goods (such as food products and basic rubber products) to labour-intensive goods (such as textiles and textile products, apparel, and leather and leather products).
Table 3 updates the evidence on the growth and structural change in the manufacturing sector from 1990 to 2018 by separating the total period into four subperiods: 1990–2000, 2000–2007, 2007–2010 and 2010–2018. The proportion to total production of food products and beverages continued to decline from about 26% in the first subperiod to 21% in the last subperiod. However, the decline became slower during 2000–2018 (from 22% in the 2000s to 21% in the 2010s) compared to labour-intensive industries, namely, textiles and clothing (from 18% to 9%), wood products and furniture (from 2% to 1%) and other miscellaneous products (from 6% to 4%). The above labour-intensive industries went from high-growth industries in the 1980s and early 1990s to declining industries after 2000. The decline was mainly due to competition after the entry into the world economy of low-wage countries such as China, India and Vietnam. Another group of industries with declining production share in total production, particularly after 2000, was basic metal products, paper and paper products and nonmetal mineral products. The proportion to total production of this group of industries was relatively small because their production was constrained by the limited domestic market. In contrast to the above industries, the one with high growth and a steady increase in its production share was the machinery and equipment industry, which produces electrical goods, electronic parts and components and motor vehicles. The growth of this group of industries benefited from direct foreign investment under the international production sharing networks.
Overall, within Thailand’s manufacturing sector the structural change of production, particularly during the recent decades of 2000 to 2018, was from labour-intensive industries and domestic market-oriented industries such as nonmetal minerals, basic metal and paper and paper products to the export-oriented and foreign direct investment-related machinery and equipment industry, which produces electrical and electronic goods as well as motor vehicles.

4. Amount of CO2 Emissions and CO2 Emission Intensity of Thailand’s Industries

In Thailand, the sector that emitted the greatest amount of CO2 was the manufacturing sector. Table 4 and Table 5 show the average annual growth rates and percentage distribution of CO2 emissions of major economic sectors by both total and subperiods during 1990–2018. In all subperiods, the manufacturing sector emitted the most carbon dioxide. On average, for the total period, it released about 41% of the total CO2 emissions of the whole economy, with the transportation sector emitting about 28% and other sectors 31%. The CO2 emissions of the manufacturing sector also grew faster than the rest of the sectors. The growth of CO2 emissions of the manufacturing sector was average at 5% per year, whereas the CO2 emissions of the rest of the sectors increased at an average rate of about 3.5%. Clearly, the industrial sector not only released the most CO2, but its emissions also increased the fastest during 1990–2018.
The carbon dioxide emitted by the manufacturing sector comes from its direct and indirect use of fossil fuels in the production process. The production of manufacturing goods directly uses fossil fuels, namely, oil, coal and natural gas, as its inputs. In addition, it uses them indirectly in the form of electricity, which in turn uses them in its production process. Table 6 shows that, during the whole period of 1990 to 2018, the CO2 emissions mostly came from the fossil fuels used in the production of electricity (45% of total emissions), followed by the use of coal (28%), oil (16%) and natural gas (11%). The table also shows changes in CO2 emissions in the manufacturing sector based on the fuel mix across the subperiods. While the shares of CO2 emissions from coal and natural gas were increasing, the share from electricity did not decrease until 2007, when the economy was slowing down. The share of emissions from oil was decreasing over time, but it was not the major fossil fuel used in the manufacturing production. Given that both coal and electricity emitted more CO2 per unit of energy consumption than oil and gas (in Thailand, from 1990 to 2018, the average CO2 emission coefficients (emission factor) of electricity and coal were 7.6 and 4.6 kton CO2 per kton while the coefficient of oil was stable at 2.6 kton CO2 per kton and natural gas 3.2. The energy consumption data used in calculating the coefficient do not include renewable energy since it is assumed to release zero carbon dioxide. See DEDE (2018) [47] and EPPO (2019) [51] for the database used for computing the coefficients), the table implies that the high growth of CO2 emissions in the manufacturing sector was most likely coming from an increased use of coal and an insufficient decrease in the use of electricity. For the growth of CO2 emissions to be effectively reduced in the manufacturing sector, both the direct and indirect use of fossil fuels of all kinds should be reduced in the production of each unit of output.
Before measuring the CO2 emissions from the use of fossil fuels per unit of output, we will first find out which industries emitted the most CO2 and which industries’ emissions grew most rapidly. Table 7 shows the annual growth rate and structural change of CO2 emissions by individual manufacturing industries during 2000–2018, the period for which the complete disaggregated database by industry is available. The industries that emitted the most CO2 were nonmetal mineral products (32% of total CO2 emissions in the manufacturing sector), food and beverages (14%), chemicals and chemical products (14%) and machinery and equipment (11%). In terms of CO2 emissions growth, the industries with the highest growth rate of 7% were food and beverages, followed by approximately the same growth rate of 5% from paper and paper products and nonmetal mineral products industries. The findings show that the composition of CO2 emissions by individual industries was not consistent with the structure of manufacturing production shown in Table 3. The industries with the largest production share were not the ones that released the most CO2, whereas the industries that emitted the most CO2 were not the largest industries in terms of production share. This leads to a need for measuring CO2 emissions per unit of output (called CO2 emission intensity) across industries in order to examine the side effects of manufacturing production in terms of the environmental problems in each industry and the changes over time. The following tables show the CO2 emission intensity by both major economic sector and individual subsector.
Table 8 and Table 9 show the CO2 emission intensity of major economic sectors and average annual rates of change by subperiod in Thailand. Over the period 1990–2018, the sector with the largest CO2 emissions per unit of output or CO2 emission intensity was the transport sector (133 kton per billion Baht), followed by the manufacturing sector (39 kton per billion Baht). Regarding the average rate of change of all sectors, the CO2 emission intensity increased by 0.2% a year. While the CO2 emission intensity of the transport sector declined over time, that of the manufacturing sector increased by 1% a year. Among all the subperiods after the 1997 economic crises, Table 9 shows that the CO2 emission intensity of the manufacturing sector grew the most rapidly from 2010 to 2018 (2.4% a year).
The CO2 emissions of the manufacturing sector come from the use of energy in its production process. Figure 1 shows the synchronized movements between the CO2 emission intensity and the trend of energy intensity of the manufacturing sector from 1990 to 2018. It also highlights the problem of the increase in the sector’s CO2 emission intensity in recent years. From the figure, we see that the CO2 emission intensity rose rapidly in the first half of the 1990s, prior to the 1997 economic crises. However, it was stable from 1997 to 2010 before rising again, along the upward sloping trend of 2010 to 2018. In the next sections we will use the decomposition method to find out why the CO2 emission intensity of the manufacturing industries has been on an increasing trend in recent years and what can be done to expedite the CO2 emissions intensity reduction. However, let us first examine the CO2 emission intensity of individual manufacturing industries as well as their annual rates of change from 2000 to 2018 in order to identify the industries that brought about the increased emission intensity.
In Thailand, the industries with the highest CO2 emission intensity were not the ones with the highest shares in total manufacturing production. From Table 10, during 2000 to 2018, within the manufacturing sector the industries with the highest CO2 emission intensity were nonmetal mineral products (277 kton per billion Baht), followed by basic metal products (140 kton per billion Baht), and paper and paper products (111 kton per billion Baht). However, the industries with the lowest CO2 emission intensity were the major industries of the country, namely, machinery and equipment (12 kton per billion Baht), textiles and clothing (23 kton per billion Baht), food and food products (27 kton per million baht) and chemical and chemical products (31 kton per million baht). Furthermore, the production of industries with low CO2 emission intensity grew much faster than that of those with high CO2 emission intensity. It is shown in Table 3 that, during 2000–2018, the growth of production of the industries with low CO2 emission intensity, namely machinery and equipment, chemical and chemical products, and food and food products, was all higher than that of the industries with relatively high CO2 emission intensity, which were nonmetal mineral products, basic metal products and paper and paper products. The above finding, that the growth rates of industries with low CO2 emission intensity were higher than the ones with high CO2 emissions intensity, should imply an overall decline in CO2 emission intensity in manufacturing sector over the period. However, it did not happen the way it should. The structural change of manufacturing production described above was conducive to a decline in the CO2 emission intensity of the whole industrial sector over time. Table 10 shows that the average growth of the CO2 emission intensity of industries with high CO2 emission intensity during 2000 to 2018 was so high that it offset the positive contribution of the structural change effect, resulting in an increase in CO2 emission intensity of the total manufacturing sector.
According to Table 10, during 2000–2018, while the CO2 emission intensity of major low CO2 emission intensity, namely, machinery and equipment and chemical and chemical products, experienced a decline or very low growth, that of high CO2 emission intensity, namely, nonmetal mineral products, paper and paper products and basic metal products, grew at the rates much higher than the overall industries. As a result, the growth of CO2 emission intensity of the high CO2 emission intensity industries offset the structural change of manufacturing production from industries with high CO2 emission intensity (such as nonmetal mineral products, and basic metal products) to industries with low CO2 emission intensity (the electronic and electrical machinery and equipment). Ultimately, the CO2 emission intensity of the total manufacturing sector increased by 0.42% a year during 2000–2018.
The above findings highlight the need to decompose the change of the CO2 emission intensity into different sources in order to identify exactly which factors led to the above change and to prescribe remedial policies. Now we are ready to proceed to the next section on the use of decomposition analysis to determine the source of change of the CO2 emission intensity as well as that of the CO2 emission level of the manufacturing sector from 2000 to 2018.

5. Decomposition of Changes of CO2 Emissions Intensity and the Amount of CO2 Emissions in the Manufacturing Sector

5.1. Decomposition of Changes in CO2 Emission Intensity

To analyse the source of annual changes of CO2 emission intensity from the reference year, the changes in the CO2 emission intensity were decomposed into two parts, namely, the structural change effect and the intensity change effect. The structural change effect refers to the change of production composition among subsectors with different levels of CO2 emission intensity. The intensity change effect denotes the change of CO2 emission intensity of individual subsectors. If the change is negative, it means individual subsectors are able to decrease their CO2 emission intensity. In our study we follow Ang [14,15] and use the logarithmic mean Divisia decomposition index in both additive and multiplicative forms to analyse the source of annual changes in CO2 emission intensity in Thailand’s manufacturing industry during 2000–2018. The method was also used in Chontanawat et al. [52].
The aggregated industrial CO2 emission intensity can be defined as follows:
CI = C Y ,
where
  • CI = CO2 emission intensity (kton/billion Baht)
  • C = CO2 emissions from manufacturing industry (kton)
  • Y = Value added of manufacturing output at constant 2002 prices (billion Baht).
The change in the CO2 emission intensity mentioned above is decomposed into two main parts, namely, the structural changes effect and the intensity change effect. The expression of each effect, including the definitions of terms in each expression, is presented in the equations below.
D tot = D str × D int = CI t CI 0
D str = exp i n [ L [ w i , t , w i , 0 ] i n L [ w i , t , w i , 0 ] ln [ S i , t S i , 0 ] ]
D int = exp i n [ L [ w i , t , w i , 0 ] i n L [ w i , t , w i , 0 ] ln [ CI i , t CI i , 0 ] ]
L [ w i , t , w i , 0 ] = w i , 0 w i , t ln [ w i , 0 w i , t ] = C i , 0 C 0 C i , t C t ln [ C i , 0 C 0 C i , t C t ]
S i = Y i Y ,
where
  • Dtot is the total change in CO2 emission intensity in year t relative to the baseline
  • Dstr is the change in total CO2 emission intensity due to the structural change effect
  • Dint is the change in total CO2 emission intensity due to the intensity change effect
  • Si is the ratio of production of the i-th subsector to aggregate manufacturing production.
In our study of the decomposition of the changes of CO2 emission intensity of the Thai manufacturing industries we use the CO2 emissions data from DEDE [47] and the production data from NESDB [48]. The CO
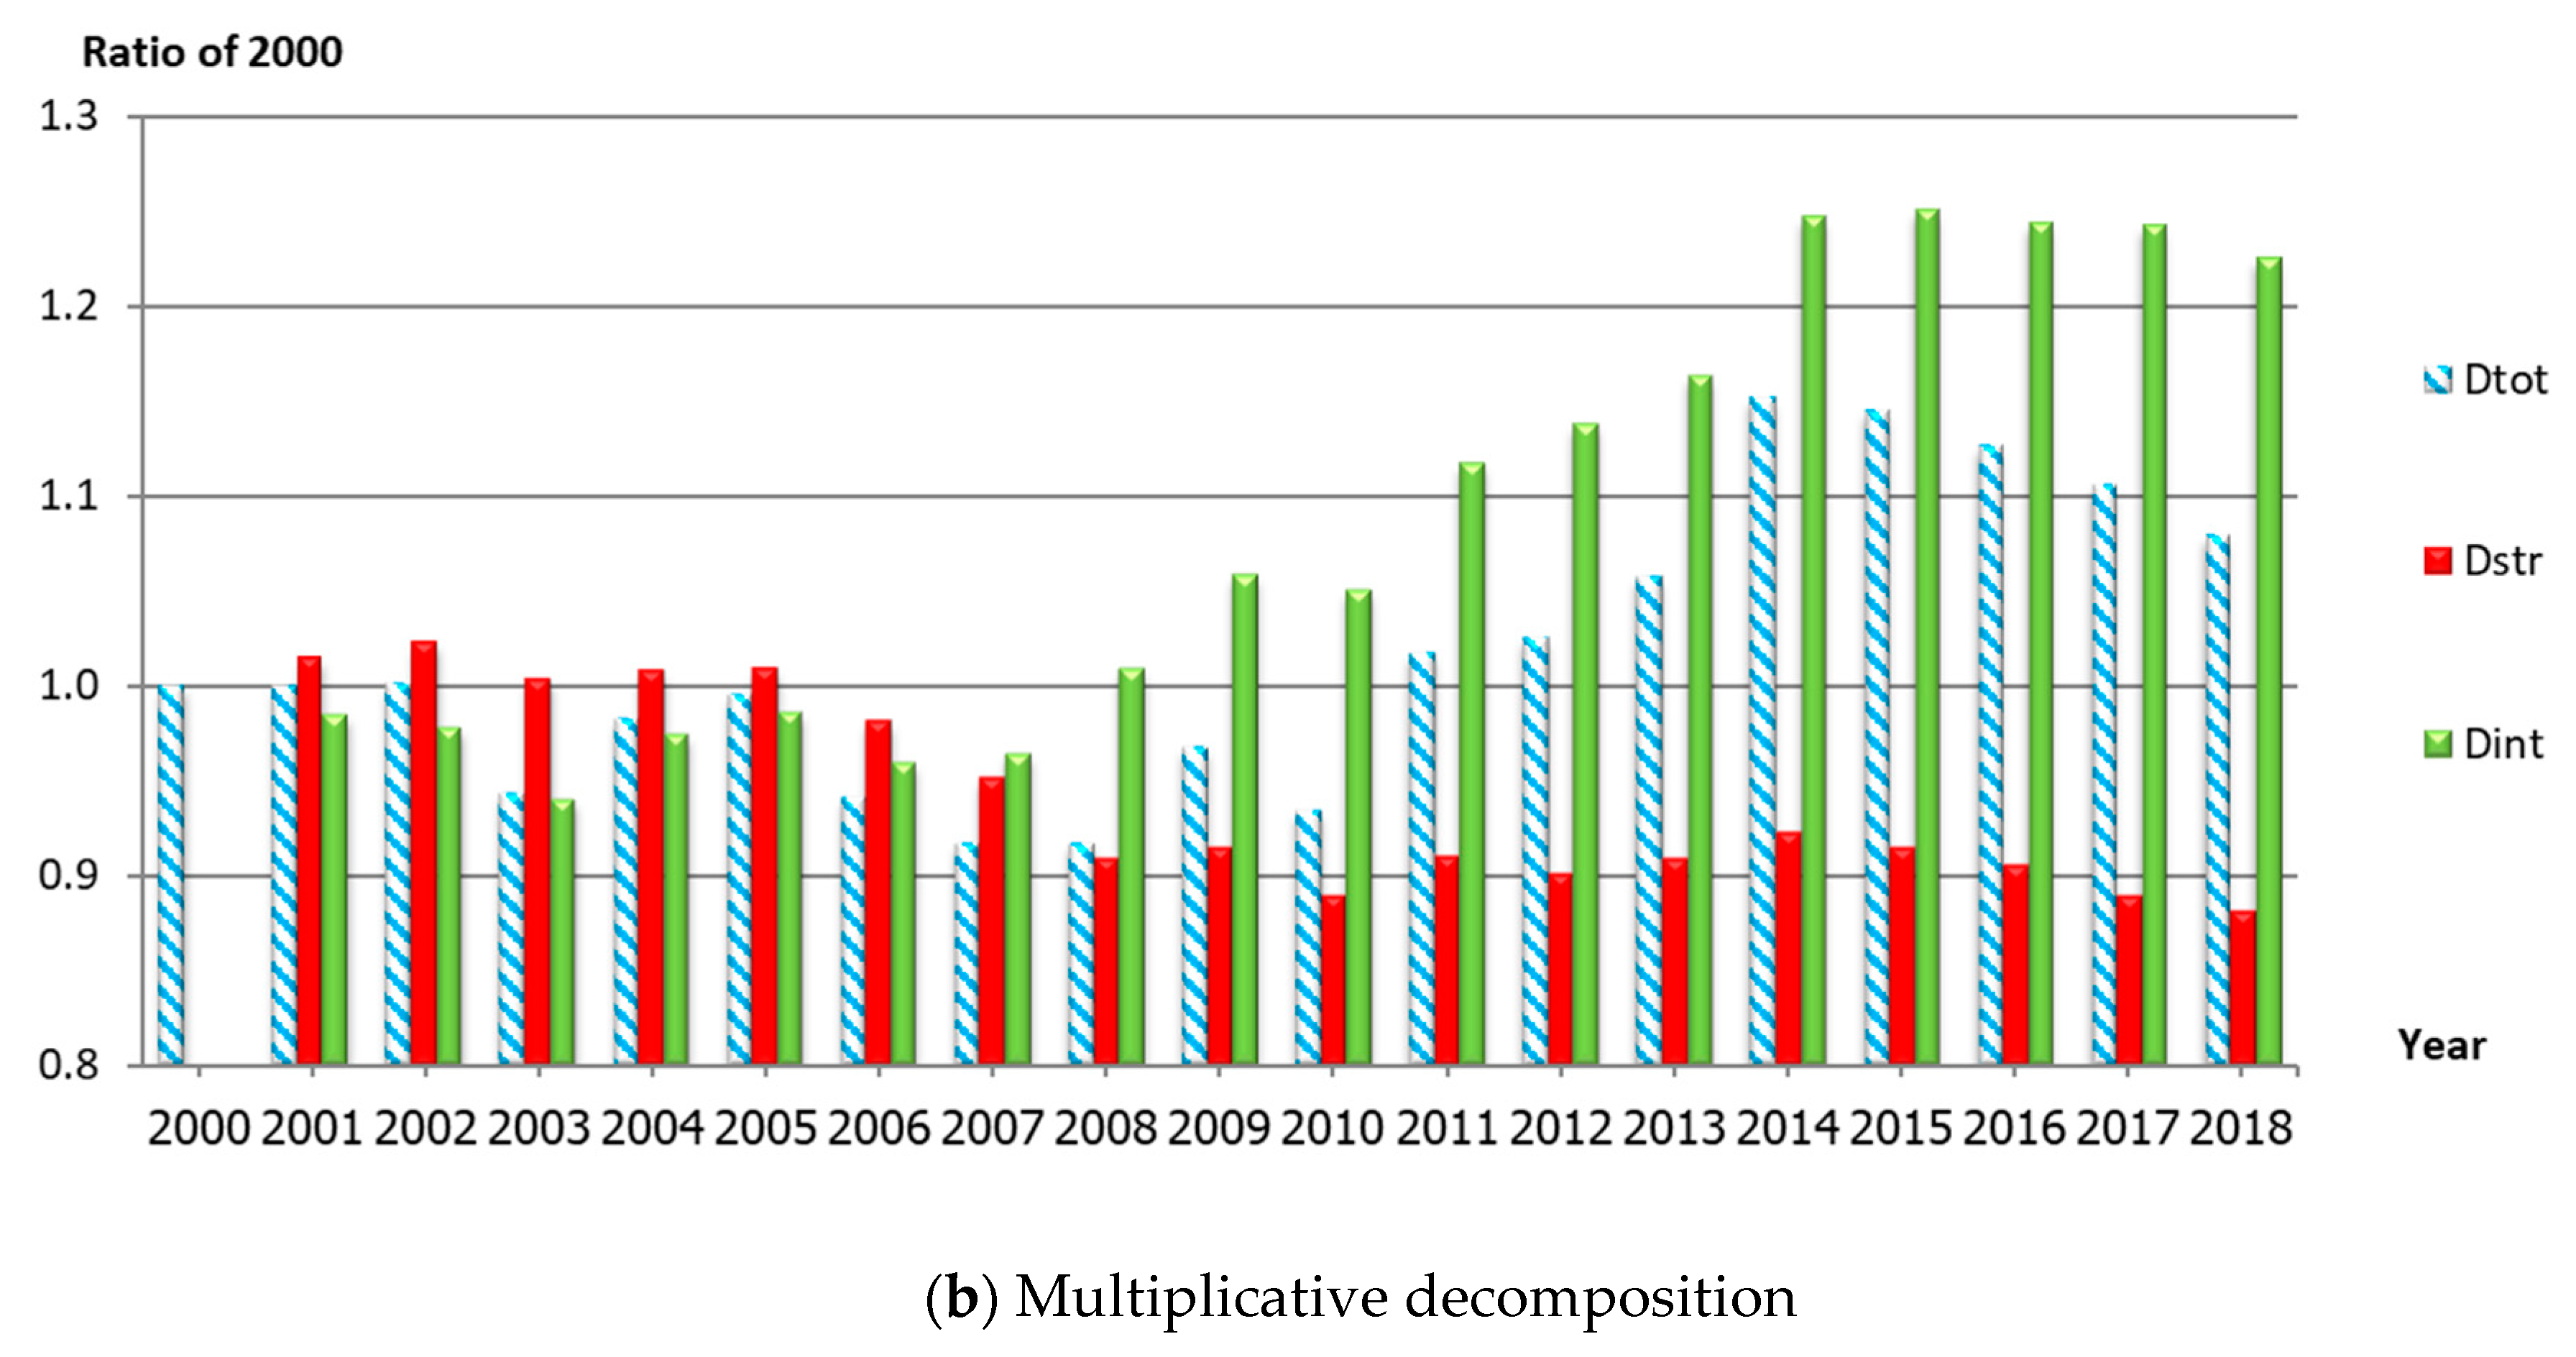
2 emissions data are yearly and available only for 2000 to 2018, precisely the period we focus on in our decomposition study. The computed results are illustrated in Figure 2 and the findings are discussed below.
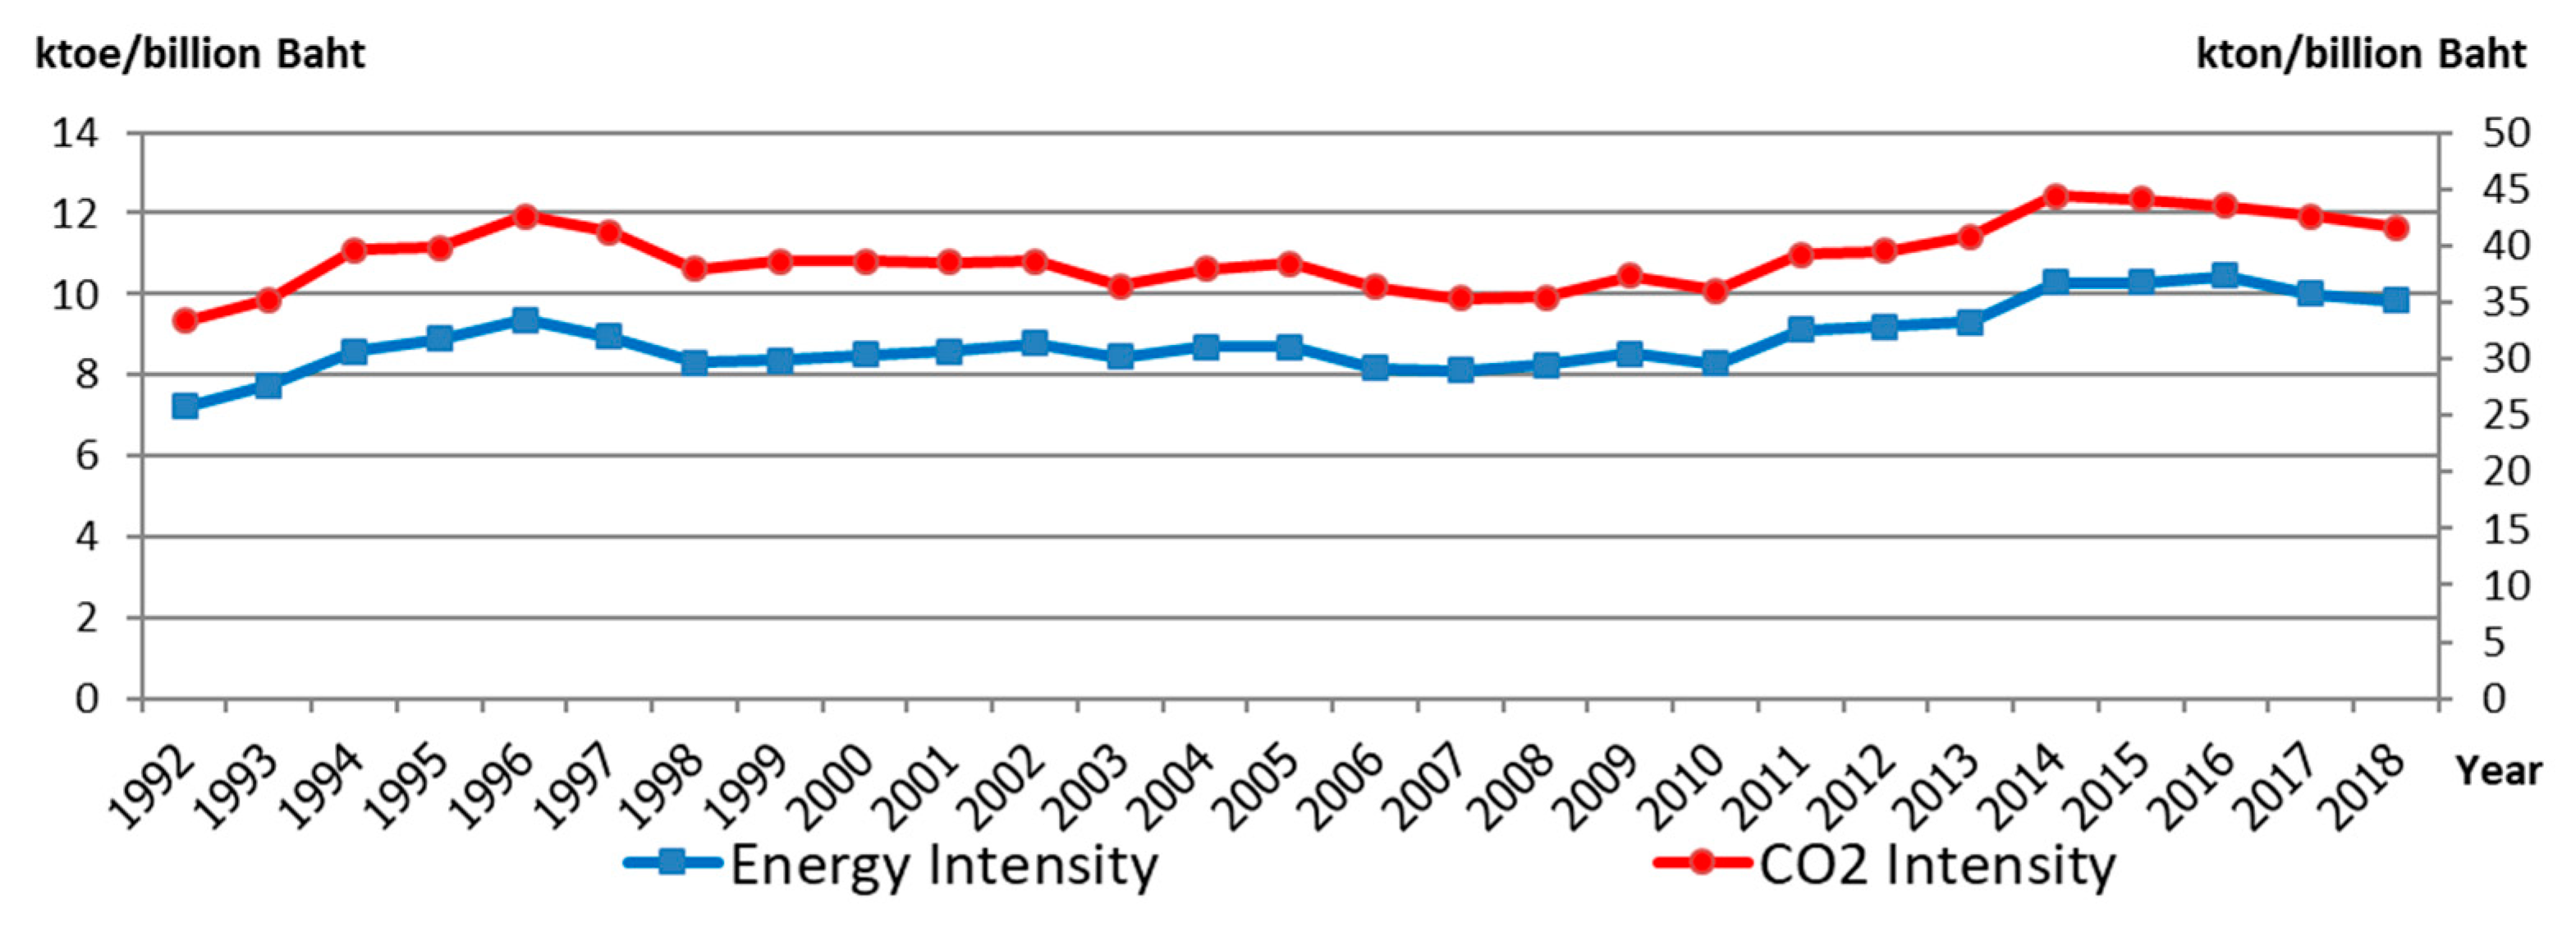
Figure 2 shows that the CO2 emission intensity of Thailand’s manufacturing sector has become a matter of concern in the past decade. Although during 2000–2010 it decreased yearly relative to the base year of 2000, it increased every year from 2011 to 2018. The emission intensity decreased insignificantly, on average by about 1.6% each year from 2000 to 2005, but the reduction became larger (about 6.4%) during 2006 to 2010. From 2011 to 2018, the CO2 emission intensity increased yearly as follows: 2011 (1.7%), 2012 (2.5%), 2013 (5.7%), 2014 (15.1%), 2015 (14.4%), 2016 (12.6%), 2017 (10.5%) and 2018 (7.8%). For the entire period between 2000 and 2018, the CO2 emission intensity rose on average 1.7% per year. The sources of the emissions changes can be identified as follows.
During 2001 to 2005, the decline of the CO2 emission intensity, albeit small, was augmented by the subsectoral CO2 emission intensity effect. During 2006 to 2008, the greater reduction in the CO2 emission intensity was due to the combined contribution of the structural change and the subsectoral CO2 emission intensity effects. We noted that, from 2006 to 2018, while the structural change effect contributed to the decline in CO2 emission intensity for the entire period, the subsectoral intensity effect was changing—from decreasing in the first few years of the period to increasing the CO2 emission intensity for the rest of the period. As a result, during 2008 to 2010 the structural change effect helped reduce the CO2 emission intensity of the sector, whereas the intensity effect (measuring the change in CO2 emission intensity of individual industries) had the opposite result. However, since the structural change effect was stronger than the intensity effect, the CO2 emission intensity of the sector decreased. After 2010, the positive contribution of the structural change effect was not strong enough to offset the negative intensity effect. Thus, the CO2 emission intensity of the sector increased each year from 2011 to 2018. This implies that, if only individual industries were able to reduce their CO2 emission intensity, it would be possible for the intensity effect to strengthen the beneficial structural change effect so that both could provide a combined effect of reducing the CO2 emission intensity of the overall manufacturing sector. The structural change effect that led to the decline in the CO2 emission intensity in all years from 2006 to 2018 came from the declined shares in total manufacturing production of high CO2 emission intensity industries, namely nonmetal mineral products, basic metal products and paper and paper products industries. On the contrary, the industries with low CO2 emission intensity, which were machinery and equipment, and chemical and chemical products, showed increased shares in total production. In other words, from 2006 to 2018, Thailand’s industries with low CO2 emission intensity expanded but the ones with high CO2 emission intensity either grew slowly or had negative growth.
In contrast to the positive role of the structural change effect in reducing the CO2 emission intensity, the intensity effect in almost all years after 2007 increased the CO2 emission intensity of the overall industries. This is because some industries, particularly ones with high CO2 emission intensity, were not able to reduce their CO2 emission intensity over time. It is true that there were some industries with declining CO2 emission intensity; most of them were the ones with low CO2 emission intensity, namely machinery and equipment. However, there were other industries with high CO2 emission intensity, namely nonmetal mineral products and basic metal products, the CO2 emission intensity of which was growing almost every year. Since the decline of the CO2 emission intensity of the industries with low CO2 emission intensity was not strong enough to offset the high growth of CO2 emission intensity of the industries with high CO2 emission intensity, the intensity effect in most years was hindering instead of helping the structural change effect to reduce the overall CO2 emission intensity of industry.
In summary, from 2001 to 2005 the CO2 emission intensity of Thailand’s manufacturing sector changed little; from 2006 to 2010, it decreased steadily relative to the base year of 2000. However, in each year from 2011 to 2018, it increased at an average rate of 8.8%. In all years from 2001 to 2007 the subsectoral CO2 emission intensity effect was the single factor that helped reduce the CO2 emission intensity of the whole manufacturing sector. However, from 2006 to 2018 the structural change effect either combined with the subsectoral CO2 emission intensity of the sector or was the single factor that contributed to the sector’s CO2 emissions reduction. In 2006 to 2007, both the structural change and intensity effects reduced the CO2 emission intensity. From 2010 to 2018, the intensity effect began to contribute negatively to the CO2 emission intensity reduction of the sector. Moreover, its negative contribution was so strong that it outweighed the positive contribution of the structural change effect; as a result, the CO2 emission intensity of the total manufacturing sector rose from the base level. In aiming to decrease the CO2 emission intensity of the sector, attempts should be made by individual industries, especially ones with high CO2 emission intensity, to reduce their CO2 emission intensity (intensity change effect). In the next section we will use the decomposition method to separate the sources of the change in the CO2 emissions level in order to detect factors accounting for the increased CO2 emission intensity of individual manufacturers. The computed results will enable us to find out more about how to turn the intensity effect from a negative to a positive contribution and strengthen the positive contribution of the structural change effect so as to reduce both the CO2 emission level and intensity.

5.2. Decomposition of Changes in the Amount of CO2 Emitted by the Manufacturing Industry

To further analyse the source of the change of CO2 emission intensity of the manufacturing sector, we studied the source of the change of the amount of CO2 emissions in the sector by using another version of the decomposition approach. The computed results will be useful for further identifying the origin of the difficulty of reducing the CO2 emission intensity of individual industries. The decomposition method will follow Ang [15]. The method has also been used by Chontanawat et al. [52].
Let
CI i = C i Y i
S i = Y i Y
I i = E i Y i
M ij = E ij E i
U ij = C ij E ij ,
where
  • C = Amount of CO2 emissions in manufacturing industry (kton)
  • E = Energy consumption (kton)
  • Y = Manufacturing output at constant 2002 prices (billion Baht)
  • Q = Total industrial production level (billion Baht)
  • Si = Ratio of production of the i-th subsector to total production
  • I = Energy intensity (kton/billion Baht)
  • Mij = Fuel mix
  • Uij = CO2 emission factor (kton/kton)
The change in the amount of CO2 emissions can be decomposed into changes of five elements, namely, total production in the manufacturing sector (activity effect), composition of subsectoral production (structural change effect), subsectoral energy intensity (energy intensity effect), subsectoral energy composition (fuel-mix effect), and CO2 emission factor (emission factor effect). The expression of each effect in the CO2 emissions decomposition analysis is presented in the equations below.
D tot = D act × D str × D int × D mix × D emf = C t C 0
D act = exp ij n [ L [ w ij , t , w ij , 0 ] i n L [ w i , t , w i , 0 ] ln [ Q t Q 0 ] ]
D str = exp ij n [ L [ w ij , t , w ij , 0 ] i n L [ w i , t , w i , 0 ] ln [ S i , t S i , 0 ] ]
D int = exp ij n [ L [ w ij , t , w ij , 0 ] i n L [ w i , t , w i , 0 ] ln [ I i , t I i , 0 ] ]
D mix = exp ij n [ L [ w ij , t , w ij , 0 ] i n L [ w i , t , w i , 0 ] ln [ M ij , t M ij , 0 ] ]
D emf = exp ij n [ L [ w ij , t , w ij , 0 ] i n L [ w i , t , w i , 0 ] ln [ U ij , t U ij , 0 ] ]
L [ w i , t , w i , 0 ] = w i , 0 w i , t ln [ w i , 0 w i , t ] = C i , 0 C i , t ln [ C i , 0 C i , t ]
L [ w ij , t , w ij , 0 ] = w ij , 0 w ij , t ln [ w ij , 0 w ij , t ] = C ij , 0 C ij , t ln [ C ij , 0 C ij , t ] ,
where
  • Dtot = Total change of CO2 emissions in year t relative to the base year
  • Dact = Change in total CO2 emissions due to activity effect
  • Dstr = Change in total CO2 emissions due to structural change effect
  • Dint = Change in total CO2 emissions due to energy intensity change effect
  • Dmix = Change in total CO2 emissions due to fuel mix effect
  • Demf = Change in total CO2 emissions due to emission factor effect.
We see from Figure 2 that from 2000 to 2018 there were periods of increase and decrease of the CO2 emission intensity of Thailand’s manufacturing sector. However, in terms of the CO2 emissions level, Figure 3 shows that the amount of emissions increased every year compared to the base year of 2000 (the database used to analyse the source of the changes of CO2 emissions level in the manufacturing industrial sector comes from the same source as the one used for studying the change in CO2 emission intensity). The increase was small before 2010 but grew during 2011 to 2014 before stabilizing at a high level in 2018. The increase in the amount of CO2 emissions arose from five sources, namely, activity (production effect), structural effect, energy intensity effect, subsectoral fuel mix effect, and emission factor effect. Among the above sources, the annual increase in CO2 emissions mostly came from the growth of manufacturing production, followed by the energy intensity effect and the fuel mix effect. In comparison, the structural change effect helped reduce the CO2 emissions in the manufacturing sector most years, whereas the emission factor effects had little influence on the change in the CO2 emissions of the manufacturing industries in Thailand.
It is quite common for the production growth to be the main source of a rise in CO2 emissions in the manufacturing sector. This is because the production of manufactured goods requires energy as an input and CO2 emissions result from the use of fossil fuels as the source of energy. Figure 3 shows that the effect of the growth of manufacturing production on increasing the CO2 emissions level in the industrial sector was very strong during the early period of 2000 to 2010 when the production growth was relatively high, but weakened during 2011 to 2018 when the production growth declined. For the early period of 2000 to 2007, the energy intensity effect slightly increased the amount of CO2 emissions in almost all years. The negative effect of increasing the emissions intensified from 2008 to 2018 when energy prices decreased and the energy intensity of the manufacturing sector increased. The fuel mix effect, albeit small relative to the industrial production and energy intensity effects, increased the CO2 emission level. Furthermore, the effect became pronounced during 2005–2014, when there was an increase in the use of coal in the production of industrial goods and electricity. The structural change effect had little effect on increasing the CO2 emissions level before 2006, but helped reduce the CO2 emissions in all years from 2006 to 2018. Finally, the emissions factor effect, however small, contributed to the CO2 emissions reduction because there was not much change in the CO2 emission coefficients.
In summary, although increased industrial production was the main factor increasing the amount of CO2 emissions released by the manufacturing sector, particularly during the strong growth period before 2006, the effect increased at a slower rate than the growth of the energy intensity and the fuel mix effects from 2006 to 2018. In contrast to the energy intensity effect, the structural change effect contributed to a reduction in the amount of CO2 emissions in all years after 2006. The emission factor effect was small but helped toward the CO2 emissions reduction. On the whole, since the findings show that the CO2 emissions rose as the manufacturing sector expanded, it would be beneficial if each industry could decrease its CO2 emissions per unit of production (CO2 emission intensity).
In the previous section we showed that, conceptually, the CO2 emission intensity of the manufacturing sector can be reduced through either the structural change effect or the CO2 emission intensity effect, or both. In the case of Thailand, while the structural change effect mostly contributed to the reduction of the CO2 emission intensity, the intensity effect was not able to help it. Based on the decomposition analysis in the present section, we will be able to understand more clearly why the CO2 emission intensity effect was not helpful at reducing the CO2 emissions in Thailand. However, before analysing the negative contribution of the intensity effect, let us first find out what Figure 3 tells us about the structural change effect based on the present method. Figure 2 in the previous section has already shown that the structural change effect helped reduce the CO2 emission intensity after 2005. Figure 3 in this section confirms the positive role of the structural change effect by showing that it helps reduce the amount of CO2 emissions as well. We have shown in the last section that from 2005 to 2018 the composition of the manufacturing production changed in such a way that the share of output of industries with low CO2 emissions in total manufacturing output increased, while the share of output of industries with high CO2 emissions declined. In other words, the structural change was helpful for decreasing CO2 emissions simply because less energy-intensive industries with low CO2 emission intensity such as machinery and equipment and food and beverages grew faster than highly energy-intensive industries with high CO2 emission intensity such as nonmetal mineral products and basic metal products.
In Figure 2 and Section 5.1, we have also already showed that, in contrast to the positive contribution of the structural change effect to the CO2 emissions reduction in the manufacturing sector, the CO2 emission intensity effect led to the opposite result. Below we list the factors that hinder the intensity effect to reduce the CO2 emissions by dividing the source of the CO2 emission intensity effect into three separate components. They are (1) the energy intensity effect, (2) the subsectoral fuel mix effect and (3) the emission factor effect. From Figure 3 we see that, from 2008 to 2018, the energy intensity effect was the major source of the increased CO2 emissions of the manufacturing sector compared to the base year of 2000. Similar findings on the negative contribution of the energy intensity effect on the change of CO2 emissions were also found in several other countries [30,39,40,41,42,46]. The subsectoral fuel mix effect resulting from the increased use of coal increased the CO2 emissions level during 2005–2012, whereas the emission factor effect had little impact on the emissions in most years.
The negative impact of the energy intensity effect on the amount of CO2 emissions was due to the yearly increases in the energy intensity of individual industries (the findings are from our computed results of decomposing the source of changes of energy intensity of the manufacturing sector (not shown). We found that the energy intensity of the sector increased steadily from 2008 to 2018, and the increase was due to the positive subsectoral energy intensity effect (negative contribution to energy intensity) outweighing the negative structural change effect (positive contribution). Our computed results are available upon request. While coal, which had a rather high emission factor, remained heavily used in CO2 emission-intensive industries such as nonmetal mineral products and basic metal products, electricity is also increasingly used in almost all industries, resulting in a rise in the direct and indirect use of fossil fuels in all manufacturing industries. In Thailand, although the production of electricity has shifted from the use of imported crude oil to natural gas since the early 1980s, the CO2 emission factor (CO2 emissions per energy consumption) of electricity is still higher than that of fossil fuels. Thus, there is room for further reduction of the emission factor of electricity in order to increase its contribution to the CO2 emissions mitigation effort by industry. There are many studies in Asian countries that show that a decrease in the emission factor of electricity, achieved by increasing the use of non-fossil fuels and renewable energy in electricity generation, can lower the CO2 emissions in the manufacturing industry. For instance, Ang [39] found that, from 1982 to 1992, South Korea and Taiwan used nuclear power and hydropower in their electricity generation and the CO2 emissions of the manufacturing sector was reduced. Yan and Fang [40] used a scenario analysis to project the CO2 emissions and mitigation potential of the Chinese manufacturing sector and concluded that the CO2 emissions of the sector can be reduced by optimizing the use of coal-fire power and increasing the use of hydro, wind and solar energy and other renewable resources in electricity generation. Finally, Jeong and Kim [38] studied the GHG emissions in South Korea’s manufacturing industry during 1991–2009 and found that the use of natural gas in combination with nuclear power and renewable energy in electricity generation could reduce both its CO2 emission factor and the amount of CO2 emissions of the industries. Today nuclear power is used in a limited number of countries. There are many other alternative non-fossil fuels and renewable energy resources that countries can choose to use in their electricity generation.
On the whole, Figure 3 shows that, from 2001 to 2018, the CO2 emissions of the manufacturing sector in Thailand increased every year compared to the base year of 2000. The increase was almost entirely due to manufacturing production growth during 2000 to 2010. From 2008 to 2018, the structural change effect helped reduce the CO2 emissions. However, the positive effects could not compensate for the adverse effects of the energy intensity effect, which came from the increased use of coal in some industries and electricity in almost all industries. As a result, the amount of CO2 emissions increased when the manufacturing production increased. These findings are consistent with the conclusions of most CO2 emissions studies in emerging markets and developing countries found in Section 2. Thus, the case of Thailand confirms the studies in the literature in that the increased use of fossil fuels, particularly coal, in the production of manufactured goods and electricity hindered the effort to reduce CO2 emissions. Without a reduction in the energy intensity of individual industries by changing the fuel mix from coal to natural gas or non-fossil fuels in manufacturing goods production and electricity generation, it will be difficult to balance the benefits of industrial growth with the social costs of environmental deterioration in the future.

6. Conclusions and Policy Implications

As Thailand’s manufacturing industries grew, a greater volume of CO2 was emitted by the sector, to the detriment of the environment. We applied Ang’s [14,15] methods to identify sources of the change in the CO2 emissions level and the CO2 emission intensity of the country’s manufacturing sector using the data available for 2000 to 2018. The computed results show that, from 2000 to 2018, the amount of CO2 emissions per year increased at an average rate of 61%, while the CO2 emission intensity rose by 1.7% compared to the reference year of 2000. The structural change effect helped reduce it, but the energy intensity effect, which increased steadily almost every year, increased both the CO2 emission intensity and the amount of CO2 emitted by the manufacturing sector. The increased use of coal in the production process increased the amount of CO2 emissions, whereas the emission factor of each energy source had little impact on the change in carbon emissions from the manufacturing sector. The findings call for policies to reduce the CO2 emission intensity of individual industries by reducing their energy intensity through curbing the use of fossil fuels in the production of manufactured goods and electricity. The CO2 emitted from electricity generation can be limited by increasing the use of renewable energy.
Ultimately, extra effort and fiscal and financial incentives should be provided for industries to find technology to reduce the energy intensity; or otherwise, to increase the use of alternative energy sources and decrease the use of fossil fuels. Moreover, the country should cooperate with the international community to achieve the global goal of CO2 emissions reduction. In fact, Thailand has already signed the Paris Agreement and submitted its intended nationally determined contribution (INDC) in 2015 to the United Nations Framework Convention on Climate Change (UNFCCC). The government, through the Ministry of Energy, proposed to balance Thailand’s economic growth with the need to address climate change. Among several energy plans, the Power Development Plan (PDP) sets the target to achieve a 20% share of electricity generation from renewable energy sources in 2036. The Alternative Energy Development Plan (AEDP) aims to achieve a 30% share of renewable energy in total energy consumption by 2036. The Energy Efficiency Plan (EEP) aims to reduce the energy intensity of transportation, industry, power generation and construction by 30% compared to the 2010 level by 2036 [53]. The next step is for the government to ensure that the INDC is actively implemented within the proposed timeframe. The benefit will be that Thailand can maintain high industrial growth without having to bear the burden of emissions, which adversely affect the environment worldwide through climate change.

Author Contributions

P.W. and J.C. conceived the idea of the study, carried out the analysis and drafted the manuscript. A.B. collected data. All authors have read and agreed to the published version of the manuscript.

Funding

The research was funded by King Mongkut’s University of Technology Thonburi: School of Liberal Arts, grant number 2562102 and the Research and Intellectual Property Promotion Centre (RIPPC), grant number T630042.

Acknowledgments

The paper is the result of collaborative research between the School of Liberal Arts, King Mongkut’s University of Technology Thonburi, and the Faculty of Economics, Chulalongkorn University, Bangkok, Thailand. We would like to thank the School of Liberal Arts, and the Research and Intellectual Property Promotion Centre (RIPPC), King Mongkut’s University of Technology Thonburi, for the research fund for this project. We are grateful to the anonymous referees for their comments and suggestions, which significantly improved our paper. We are also indebted to advice from scientific committee members and participants in the 6th International Conference on Energy and Environment Research, (ICEER 2019).

Conflicts of Interest

The opinions, estimates and analysis presented in this article are the responsibility of the authors, and should not be considered as reflecting the views of the funders.

References

  1. Nordhaus, W.D. The Climate Casino: Risk, Uncertainty, and Economics for a Warming World; Yale University Press: New Haven, CT, USA, 2015. [Google Scholar]
  2. World Meteorological Organization (WMO). Greenhouse Gas Concentrations in Atmosphere Reach Yet Another High; World Meteorological Organization: Geneva, Switzerland, 2019; Available online: https://public.wmo.int/en/media/press-release/greenhouse-gas-concentrations-atmosphere-reach-yet-another-high (accessed on 25 November 2019).
  3. Ritchie, H.; Roser, M. CO2 and Greenhouse Gas Emissions. Our World In Data. 2019. Available online: https://ourworldindata.org/co2-and-other-greenhouse-gas-emissions (accessed on 25 November 2019).
  4. Oliver, J.G.J.; Schure, K.M.; Peters, J.A.H.W. Trends in Global CO2, and Total Greenhouse Gas Emissions; PBL Publication Number 2671; Netherlands Environmental Assessment Agency: Amsterdam, The Netherlands, 2017. [Google Scholar]
  5. World Bank. Growth and CO2 Emissions: How Does India Compare to other Countries? In India—Strategies for Low Carbon Growth; World Bank: Washington, DC, USA, 2007. [Google Scholar]
  6. Chontanawat, J.; Wiboonchutikula, P.; Buddhivanich, A. Decomposition analysis of the change of energy intensity of manufacturing industries in Thailand. Energy 2014, 77, 171–182. [Google Scholar] [CrossRef]
  7. Ang, B.W. Decomposition methodology in industrial energy demand analysis. Energy 1995, 20, 1081–1095. [Google Scholar] [CrossRef]
  8. Ang, B.W.; Zhang, F.Q. A survey of index decomposition analysis in energy and environmental studies. Energy 2000, 25, 1149–1176. [Google Scholar] [CrossRef]
  9. Boyd, G.A.; Hanson, D.A.; Sterner, T. Decomposition of changes in energy intensity: A comparison of the Divisia index and other methods. Energy Econ. 1988, 10, 309–312. [Google Scholar] [CrossRef]
  10. Park, S.H. Decomposition of industrial energy consumption: An alternative method. Energy Econ. 1992, 14, 265–270. [Google Scholar] [CrossRef]
  11. Ang, B.W. Decomposition of industrial energy consumption: The energy intensity approach. Energy Econ. 1994, 16, 163–174. [Google Scholar] [CrossRef]
  12. Ang, B.W.; Liu, F.L. A new energy decomposition method: Perfect in decomposition and consistent in aggregation. Energy 2001, 26, 537–548. [Google Scholar] [CrossRef]
  13. Xu, X.Y.; Ang, B.W. Index decomposition analysis applied to CO2 emission studies. Ecol. Econ. 2013, 93, 313–329. [Google Scholar] [CrossRef]
  14. Ang, B.W. Decomposition analysis for policymaking in energy: Which is the preferred method? Energy Policy 2004, 32, 1131–1139. [Google Scholar] [CrossRef]
  15. Ang, B.W. The LMDI approach to decomposition analysis: A practical guide. Energy Policy 2005, 33, 867–871. [Google Scholar] [CrossRef]
  16. Ang, B.W. LMDI decomposition approach: A guide for implementation. Energy Policy 2015, 86, 233–238. [Google Scholar] [CrossRef]
  17. Kisielewicz, J.; Sobey, M.; Verstraeten, Y.; Marino, A.; Lavric, L.; Voigt, S.; Tallat-Kelpsaite, J. Decomposition Analysis of the Changes in GHG Emissions in the EU and Member States; ICF International: Fairfax, VI, USA, 2019. [Google Scholar]
  18. Drastichová, M. Decomposition Analysis of the Greenhouse Gas Emissions in the European Union. Probl. Ekorozw. Probl. Sustain. Dev. 2017, 12, 27–35. Available online: https://ssrn.com/abstract=3000380 (accessed on 25 November 2019).
  19. Moutinho, V.; Moreira, A.C.; Silva, P.M. The driving forces of change in energy-related CO2 emissions in eastern, western, northern and southern Europe: The LMDI approach to decomposition analysis. Renew. Sustain. Energy Rev. 2015, 50, 1485–1499. [Google Scholar] [CrossRef]
  20. González, P.F.; Landajo, M.; Presno, M.J. Tracking European Union CO2 emissions through LMDI (logarithmic-mean Divisia index) decomposition. The activity revaluation approach. Energy 2014, 73, 741–750. [Google Scholar] [CrossRef]
  21. Bhattacharyya, S.C.; Matsumura, W. Changes in the GHG emission intensity in EU-15: Lessons from a decomposition analysis. Energy 2010, 35, 3315–3322. [Google Scholar] [CrossRef]
  22. Shahiduzzaman, M.; Layton, A.; Alam, K. Decomposition of energy-related CO2 emissions in Australia: Challenges and policy implications. Econ. Anal. Policy 2015, 45, 100–111. [Google Scholar] [CrossRef]
  23. Cansino, J.M.; Román, R.; Ordóñez, M. Main drivers of changes in CO2 emissions in the Spanish economy: A structural decomposition analysis. Energy Policy 2016, 89, 150–159. [Google Scholar] [CrossRef]
  24. Cansino, J.M.; Sánchez-Braza, A.; Rodríguez-Arévalo, M. Driving forces of Spain’s CO2 emissions: A LMDI decomposition approach. Renew. Sustain. Energy Rev. 2015, 48, 749–759. [Google Scholar] [CrossRef]
  25. O’Mahony, T. Decomposition of Ireland’s carbon emissions from 1990 to 2010: An extended Kaya identity. Energy Policy 2013, 59, 573–581. [Google Scholar]
  26. O’Mahony, T.; Zhou, P.; Sweeney, J. The driving forces of change in energy-related CO2 emissions in Ireland: A multi-sectoral decomposition from 1990 to 2007. Energy Policy 2012, 44, 256–267. [Google Scholar] [CrossRef] [Green Version]
  27. Sun, J. An analysis of the difference in CO2 emission intensity between Finland and Sweden. Energy 2000, 25, 1139–1146. [Google Scholar] [CrossRef]
  28. Oh, I.; Wehrmeyer, W.; Mulugetta, Y. Decomposition analysis and mitigation strategies of CO2 emissions from energy consumption in South Korea. Energy Policy 2010, 38, 364–377. [Google Scholar] [CrossRef]
  29. Chong, C.H.; Tan, W.X.; Ting, Z.J.; Liu, P.; Ma, L.; Li, Z.; Ni, W. The driving factors of energy-related CO2 emission growth in Malaysia: The LMDI decomposition method based on energy allocation analysis. Renew. Sustain. Energy Rev. 2019, 115, 109356. [Google Scholar] [CrossRef]
  30. Qi, T.; Weng, Y.; Zhang, X.; He, J. An analysis of the driving factors of energy-related CO2 emission reduction in China from 2005 to 2013. Energy Econ. 2016, 60, 15–22. [Google Scholar] [CrossRef]
  31. Lv, Z.; Gu, A.; Liu, Y. CO2 emissions in China: Analysis based on factor decomposition method. Energy Procedia 2014, 61, 1119–1125. [Google Scholar] [CrossRef] [Green Version]
  32. Xu, S.C.; He, Z.X.; Long, R.Y. Factors that influence carbon emissions due to energy consumption in China: Decomposition analysis using LMDI. Appl. Energy 2014, 127, 182–193. [Google Scholar] [CrossRef]
  33. Ning, Y.; Zhang, Y.; Ding, T.; Tonooka, Y. Empirical Study of Decomposition of CO2 Emission Factors in China. J. Energy 2013, 2013, 747516. [Google Scholar] [CrossRef] [Green Version]
  34. Wang, C.; Chen, J.; Zou, J. Decomposition of energy-related CO2 emission in China: 1957–2000. Energy 2005, 30, 73–83. [Google Scholar] [CrossRef]
  35. Sheinbaum, C.; Ruiz, B.; Ozawa, L. Energy consumption and related CO2 emissions in five Latin American countries: Changes from 1990 to 2006 and perspectives. Energy 2011, 36, 3629–3638. [Google Scholar] [CrossRef]
  36. Charlita de Freitas, L.; Kaneko, S. Decomposition of CO2 emissions change from energy consumption in Brazil: Challenges and policy implications. Energy Policy 2011, 39, 1495–1504. [Google Scholar] [CrossRef]
  37. Hammond, G.P.; Norman, J.B. Decomposition analysis of energy-related carbon emissions from UK manufacturing. Energy 2012, 41, 220–227. [Google Scholar] [CrossRef] [Green Version]
  38. Jeong, K.; Kim, S. LMDI decomposition analysis of greenhouse gas emissions in the Korean manufacturing sector. Energy Policy 2013, 62, 1245–1253. [Google Scholar] [CrossRef]
  39. Ang, B.W.; Pandiyan, G. Decomposition of energy-induced CO2 emissions in manufacturing. Energy Econ. 1997, 19, 363–374. [Google Scholar] [CrossRef]
  40. Yan, X.; Fang, Y.-P. CO2 emissions and mitigation potential of the Chinese manufacturing industry. J. Clean. Prod. 2015, 103, 759–773. [Google Scholar] [CrossRef]
  41. Shao, C.; Guan, Y.; Wan, Z.; Guo, C.; Chu, C.; Ju, M. Performance and decomposition analyses of carbon emissions from industrial energy consumption in Tianjin, China. J. Clean. Prod. 2014, 64, 590–601. [Google Scholar] [CrossRef]
  42. Akbostancı, E.; Tunc, G.I.; Türüt-Asik, S. CO2 emissions of Turkish manufacturing industry: A decomposition analysis. Appl. Energy 2011, 88, 2273–2278. [Google Scholar] [CrossRef]
  43. Chontanawat, J. Driving Forces of Energy-Related CO2 Emissions Based on Expanded IPAT Decomposition Analysis: Evidence from ASEAN and Four Selected Countries. Energies 2019, 12, 764. [Google Scholar] [CrossRef] [Green Version]
  44. Ussanarassamee, A.; Bhattacharyya, S.C. Changes in energy demand in Thai industry between 1981 and 2000. Energy 2005, 30, 1845–1857. [Google Scholar] [CrossRef]
  45. Wiboonchutikula, P.; Chaivichayachat, B.; Chontanawat, J. Source of energy intensity change of Thailand’s steel industry in the decade of global turbulent time. Singap. Econ. Rev. 2014, 59, 1450027. [Google Scholar] [CrossRef]
  46. Bhattacharyya, S.C.; Ussanarassamee, A. Decomposition of energy and CO2 intensities of Thai industry between 1981 and 2000. Energy Econ. 2004, 26, 765–781. [Google Scholar] [CrossRef]
  47. Department of Alternative Energy Development and Efficiency (DEDE). Thailand Energy Situation, Annual Report (Various Years). Available online: http://www.dede.go.th (accessed on 24 December 2019).
  48. Office of the National Economic and Social Development Council (NESDB). National Account of Thailand 2018 Edition; Office of the National Economic and Social Development Council: Bangkok, Thailand, 2018. Available online: http://www.nesdb.go.th (accessed on 24 December 2019).
  49. Wiboonchutikula, P.; Kotrajaras, P.; Chaivichayachat, B. An analysis of Thailand’s net capital inflows surges after the 1997 crises. ASEAN Econ. Bull. 2011, 28, 281–314. [Google Scholar] [CrossRef]
  50. Wiboonchutikula, P. Industrial Performance and Policies in Thailand, in Emerging Asia’s Growth Practices; Chirathivat, S., Ng, C.Y., Eds.; Chulalongkorn University Press: Bangkok, Thailand, 2009. [Google Scholar]
  51. Energy Policy and Planning Office (EPPO). Energy Statistics of Thailand 2019. Available online: http://www.eppo.go.th (accessed on 24 December 2019).
  52. Chontanawat, J.; Wiboonchutikula, P.; Buddhivanich, A. An LMDI decomposition analysis of carbon emissions in the Thai manufacturing sector. Energy Rep. 2019, 62, 1245–1253. [Google Scholar] [CrossRef]
  53. Office of Natural Resources and Environmental Policy and Planning (ONEP). Thailand’s Third National Communication; Ministry of Natural Resources and Environment: Bangkok, Thailand, 2015.
Figure 1. CO2 emission intensity and energy intensity of the manufacturing sector, 1992–2018.
Energies 13 00798 g001
Figure 2. Decomposition of CO2 emission intensity of the manufacturing sector, 2000–2018: (a) Additive decomposition; (b) Multiplicative decomposition.
Energies 13 00798 g002aEnergies 13 00798 g002b
Figure 3. Decomposition of amount of CO2 emissions of the manufacturing sector, 2000–2018: (a) Additive decomposition; (b) Multiplicative decomposition.
Energies 13 00798 g003
Table 1. Average annual growth rate of production of major economic sectors, 1990–2018.
Unit: %
Major Sector1990–19971997–20002000–20072007–20102010–20181990–20002000–20181990–2018
Agriculture4.673.473.491.781.054.312.122.90
Manufacturing7.401.326.293.261.665.573.734.39
Transport6.463.494.741.704.845.574.284.74
Other services5.76−1.685.132.784.623.534.514.16
Total6.100.035.262.763.464.284.054.13
Source: Computed from NESDB (2018) [48].
Table 2. Percentage share of production of major economic sectors, 1990–2018.
Unit: %
Major Sector1990–19971997–20002000–20072007–20102010–20181990–20002000–20181990–2018
Agriculture10.6611.2310.9510.349.2410.909.9510.15
Manufacturing25.6527.7329.2430.3128.0926.3228.6828.08
Transport5.396.106.185.986.275.646.206.05
Other services58.3054.9553.6453.3856.4057.1455.1755.72
Total100.00100.00100.00100.00100.00100.00100.00100.00
Source: Computed from NESDB (2018) [48].
Table 3. Average annual growth rate and percentage share of subsectoral manufacturing production, 1990–2018.
Unit: %
Manufacturing SubsectorGrowth RateShare
1990–20002000–20072007–20102010–20182000–20181990–20181990–20002000–20072007–20102010–20182000–20181990–2018
Food & beverages3.615.011.252.353.203.3525.5221.5420.1321.1121.1822.21
Textiles & clothing2.561.92−0.80−3.25−0.830.3818.3414.3411.398.5010.8112.49
Wood & furniture−5.544.422.634.644.220.731.761.100.981.201.141.29
Paper & printing10.634.63−0.520.271.844.982.232.632.322.062.282.26
Chemical10.913.773.113.323.466.1215.4217.8416.2217.5017.4716.91
Nonmetal mineral4.006.34−0.101.543.133.445.404.914.284.314.514.72
Basic metal10.686.70−4.721.702.585.471.812.522.091.862.112.03
Fabricated metal & machinery & equipment7.7011.516.741.726.376.8423.9130.6038.4839.4336.2933.57
Others3.652.132.221.291.772.445.604.524.124.014.204.51
Total5.576.293.261.663.734.39100.00100.00100.00100.00100.00100.00
Source: Computed from NESDB (2018) [48].
Table 4. Average annual growth rate of CO2 emissions by major economic sector, 1990–2018.
Unit: %
Major Sector1990–19971997–20002000–20072007–20102010–20181990–20002000–20181990–2018
Manufacturing10.80−0.895.043.883.467.304.155.27
Transportation9.53−6.382.831.132.104.752.223.13
Others9.700.664.023.950.036.992.243.93
Total10.03−2.194.083.162.086.373.044.22
Source: Computed from EPPO (2019) [51].
Table 5. Percentage share of CO2 emissions by major economic sector, 1990–2018.
Unit: %
Major Sector1990–19971997–20002000–20072007–20102010–20181990–20002000–20181990–2018
Manufacturing36.9536.3639.3440.9844.7436.7542.4641.08
Transportation33.8132.0429.6526.6725.1032.9826.8328.36
Others29.2531.6031.0132.3530.1630.2730.7030.56
Total100.00100.00100.00100.00100.00100.00100.00100.00
Source: Computed from EPPO (2019) [51].
Table 6. Percentage share of CO2 emissions of the manufacturing sector by energy source, 1990–2018.
Unit: %
Energy Source1990–19971997–20002000–20072007–20102010–20181990–20002000–20181990–2018
Oil23.9120.5415.789.1014.9522.8714.6316.45
Coal26.1725.3126.6432.3429.2725.4128.8428.24
Natural Gas2.334.376.9111.3616.553.1112.8310.69
Electricity47.5849.7850.6747.2039.2348.6143.7044.62
Total100.00100.00100.00100.00100.00100.00100.00100.00
Source: Computed from EPPO (2019) [51].
Table 7. Annual growth rate and percentage share of CO2 emissions of the manufacturing sector by sub-sector, 2000–2018.
Manufacturing Subsector Unit: %
Growth RateShare
2000–20072007–20102010–20182000–20182000–20072007–20102010–20182000–2018
Food & beverages8.127.336.566.1112.7014.5515.7414.35
Textiles & clothing0.42−3.280.66−0.799.206.704.706.79
Wood & furniture5.143.274.804.071.461.331.501.46
Paper & printing10.8118.023.506.215.167.817.116.37
Chemical−0.411.025.273.3414.9311.9613.2613.84
Nonmetal mineral7.974.192.595.2030.7033.5032.4431.95
Basic metal3.125.463.463.147.557.247.617.49
Fabricated metal & machinery & equipment6.830.933.973.5811.4211.1010.6310.97
Others−2.601.703.932.736.885.827.006.79
Total5.044.003.884.15100.00100.00100.00100.00
Source: Computed from EPPO (2019) [51].
Table 8. CO2 emission intensity of major economic sectors, 1990–2018.
Unit: kton/billion Baht
Major Sector1990–19971997–20002000–20072007–20102010–20181990–20002000–20181990–2018
Manufacturing37.3239.0737.5336.0441.3337.6039.2038.62
Transportation162.72157.36133.87118.99105.02158.86118.68133.30
Others11.1114.2613.3713.5312.0712.0512.7812.46
Total26.0029.8227.8726.6526.0726.9726.8926.86
Source: Computed from EPPO (2019) [51] and NESDB (2018) [48].
Table 9. Average annual rate of change of CO2 emission intensity of major economic sectors, 1990–2018.
Unit: %
Major Sector1990–19971997–20002000–20072007–20102010–20181990–20002000–20181990–2018
Manufacturing3.41−2.21−1.240.472.391.720.440.92
Transportation3.06−9.87−1.90−0.43−3.65−0.82−2.18−1.67
Others4.121.49−0.831.00−5.453.33−2.03−0.05
Total3.93−2.22−1.190.30−1.852.08−1.070.10
Source: Computed from CO2 emission intensity figures in Table 8.
Table 10. Amount and annual rate of change of CO2 emission intensity of manufacturing industry by subsector.
Manufacturing SubsectorCO2 Emission Intensity (kton/billion Baht)Growth Rate (%)
2000–20072007–20102010–20182000–20182000–20072007–20102010–20182000–2018
Food & beverages22.0025.9830.9526.673.115.354.002.90
Textiles & clothing23.6421.0422.9423.02−1.50−2.262.880.04
Wood & furniture49.5749.0851.7350.510.73−1.08−1.09−0.14
Paper & printing73.21121.20141.75111.056.1717.572.794.38
Chemical31.0926.5831.3730.82−4.17−2.921.55−0.12
Nonmetal mineral234.52283.02310.80277.421.625.190.302.07
Basic metal112.50126.35168.34139.72−3.588.291.250.56
Fabricated metal & machinery & equipment14.5210.4211.1612.46−4.68−7.360.35−2.79
Others56.3250.8872.1662.90−4.73−4.162.500.95
Total37.5336.0441.3339.20−1.24−0.201.200.42
Source: Computed from NESDB (2018) [48] and EPPO (2019) [51].

