Analysis of the Dissolution of CH4/CO2-Mixtures into Liquid Water and the Subsequent Hydrate Formation via In Situ Raman Spectroscopy


Abstract
1. Introduction
2. Materials and Methods
2.1. Materials
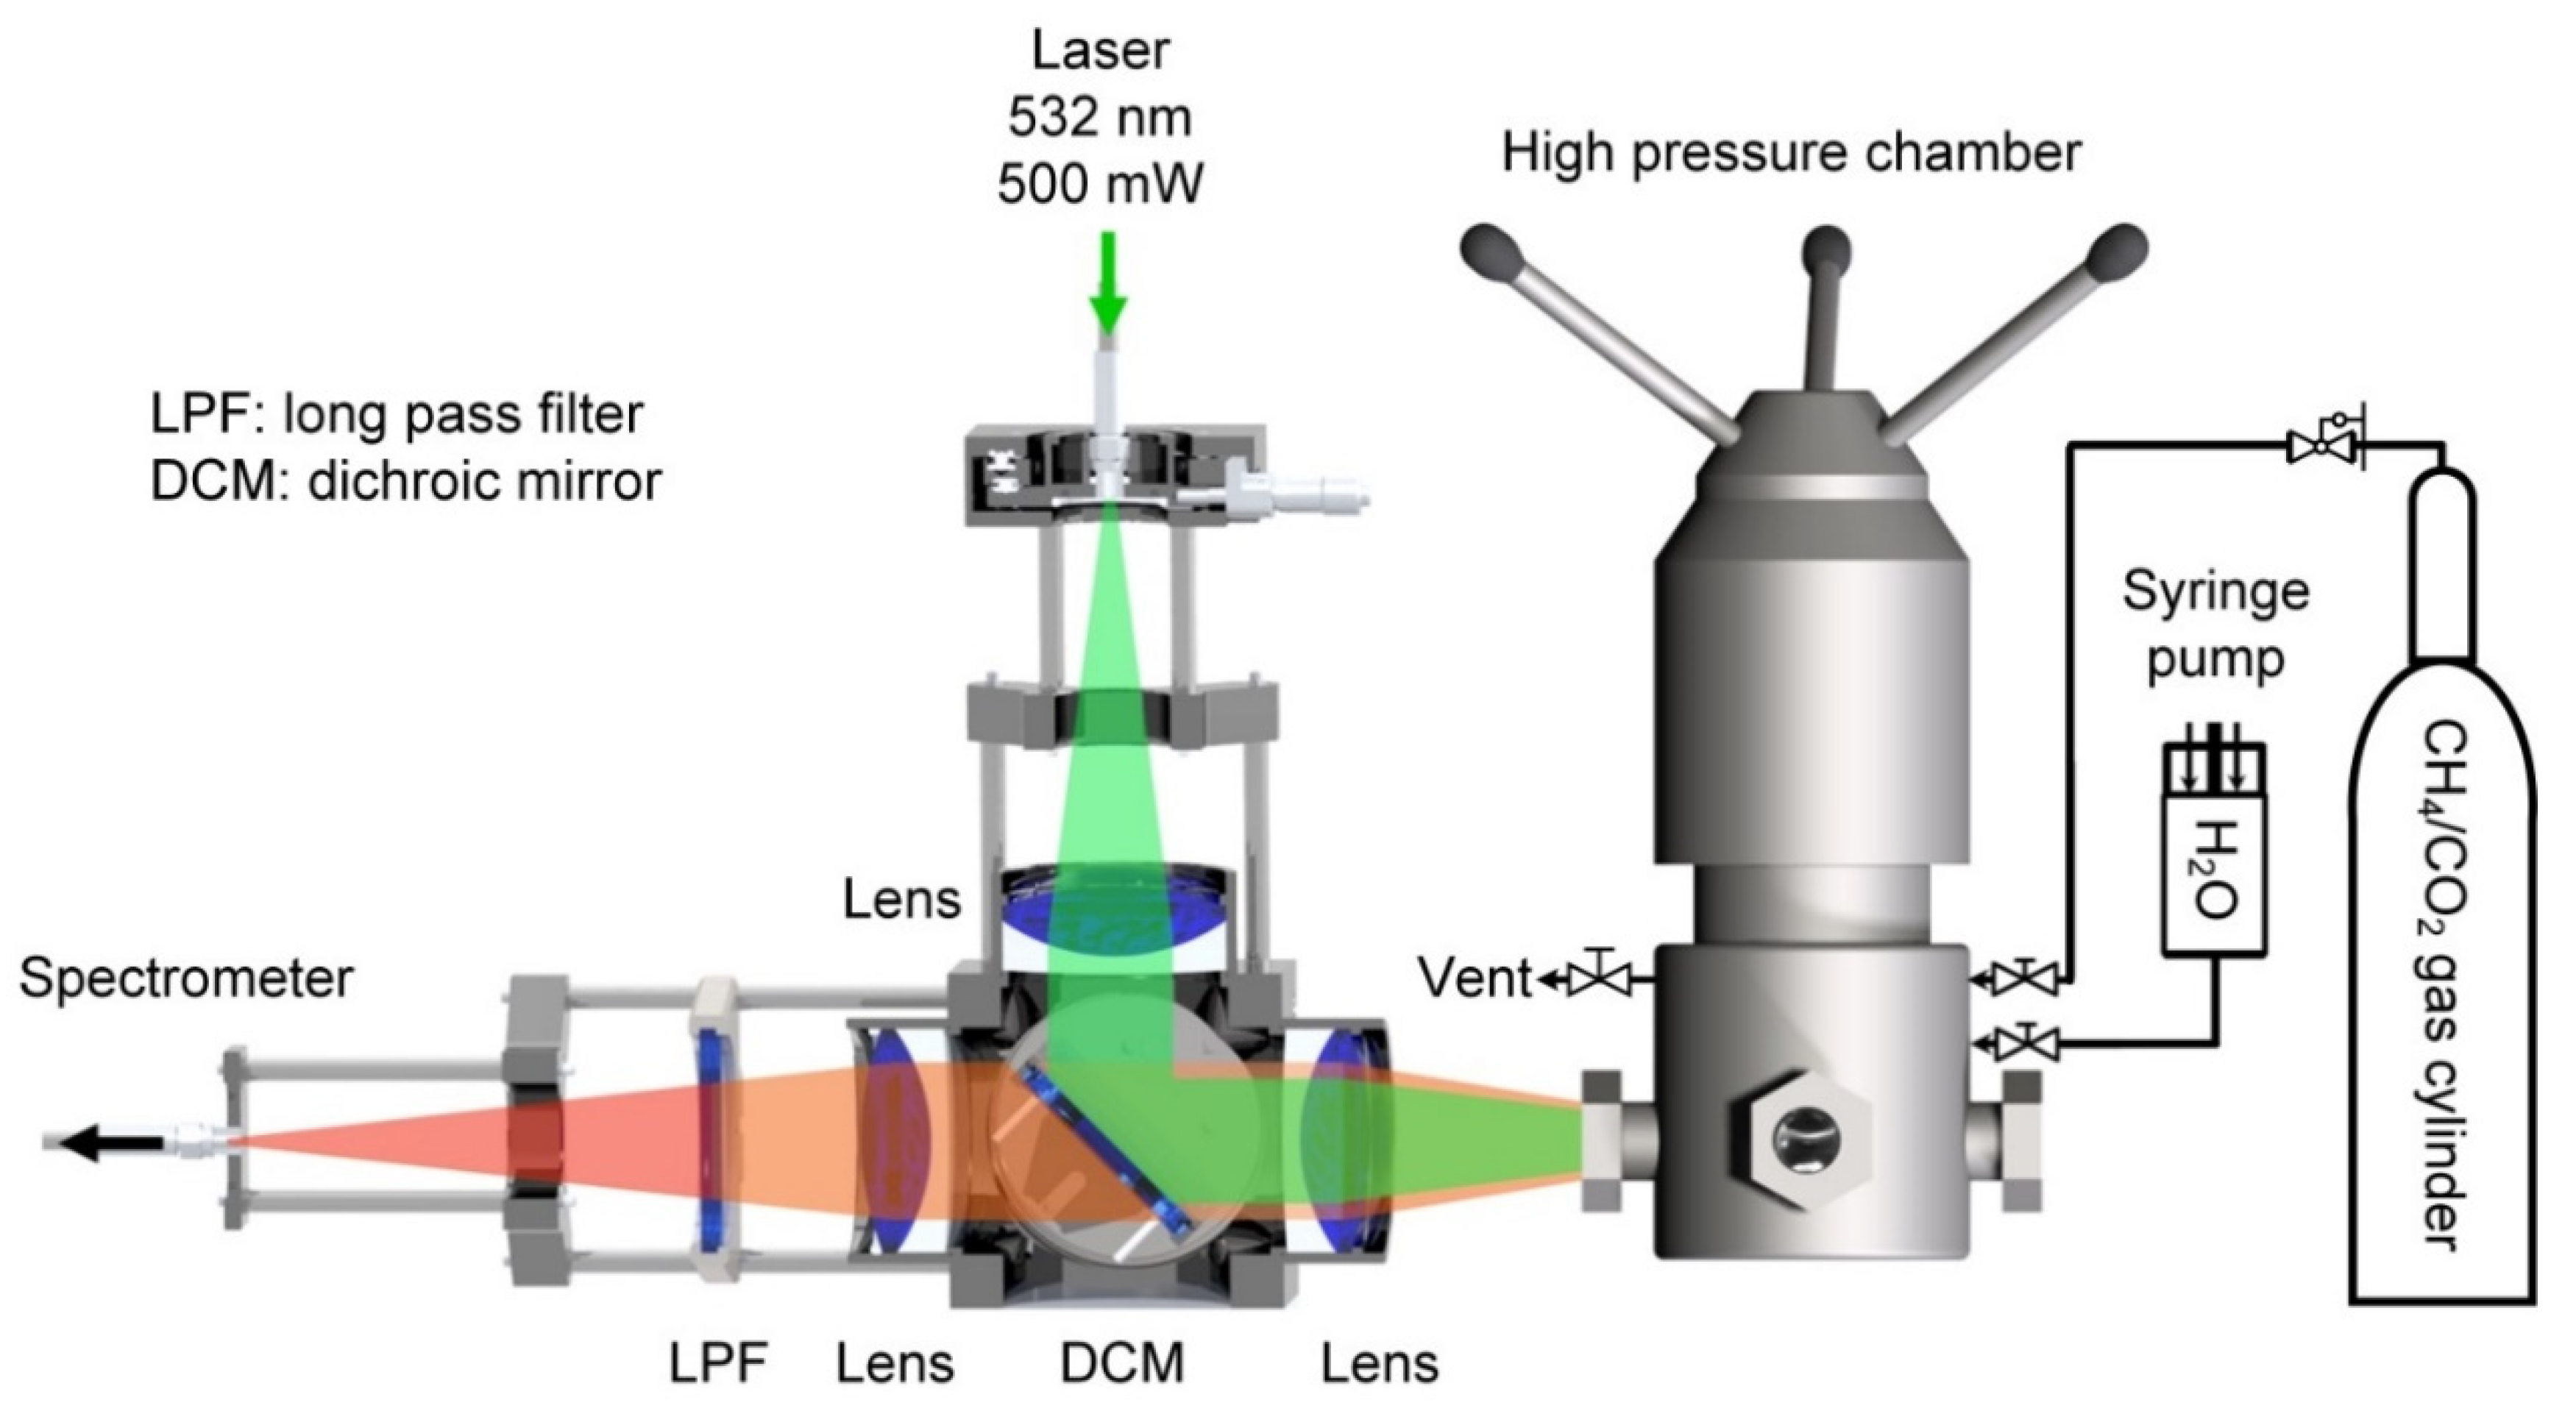
2.2. Apparatus
2.3. Procedures
3. Results
3.1. Raman Spectra of CH4/CO2-Mixtures in Vapor Phase, Liquid Water-rich Phase, and Hydrate Gel Phase
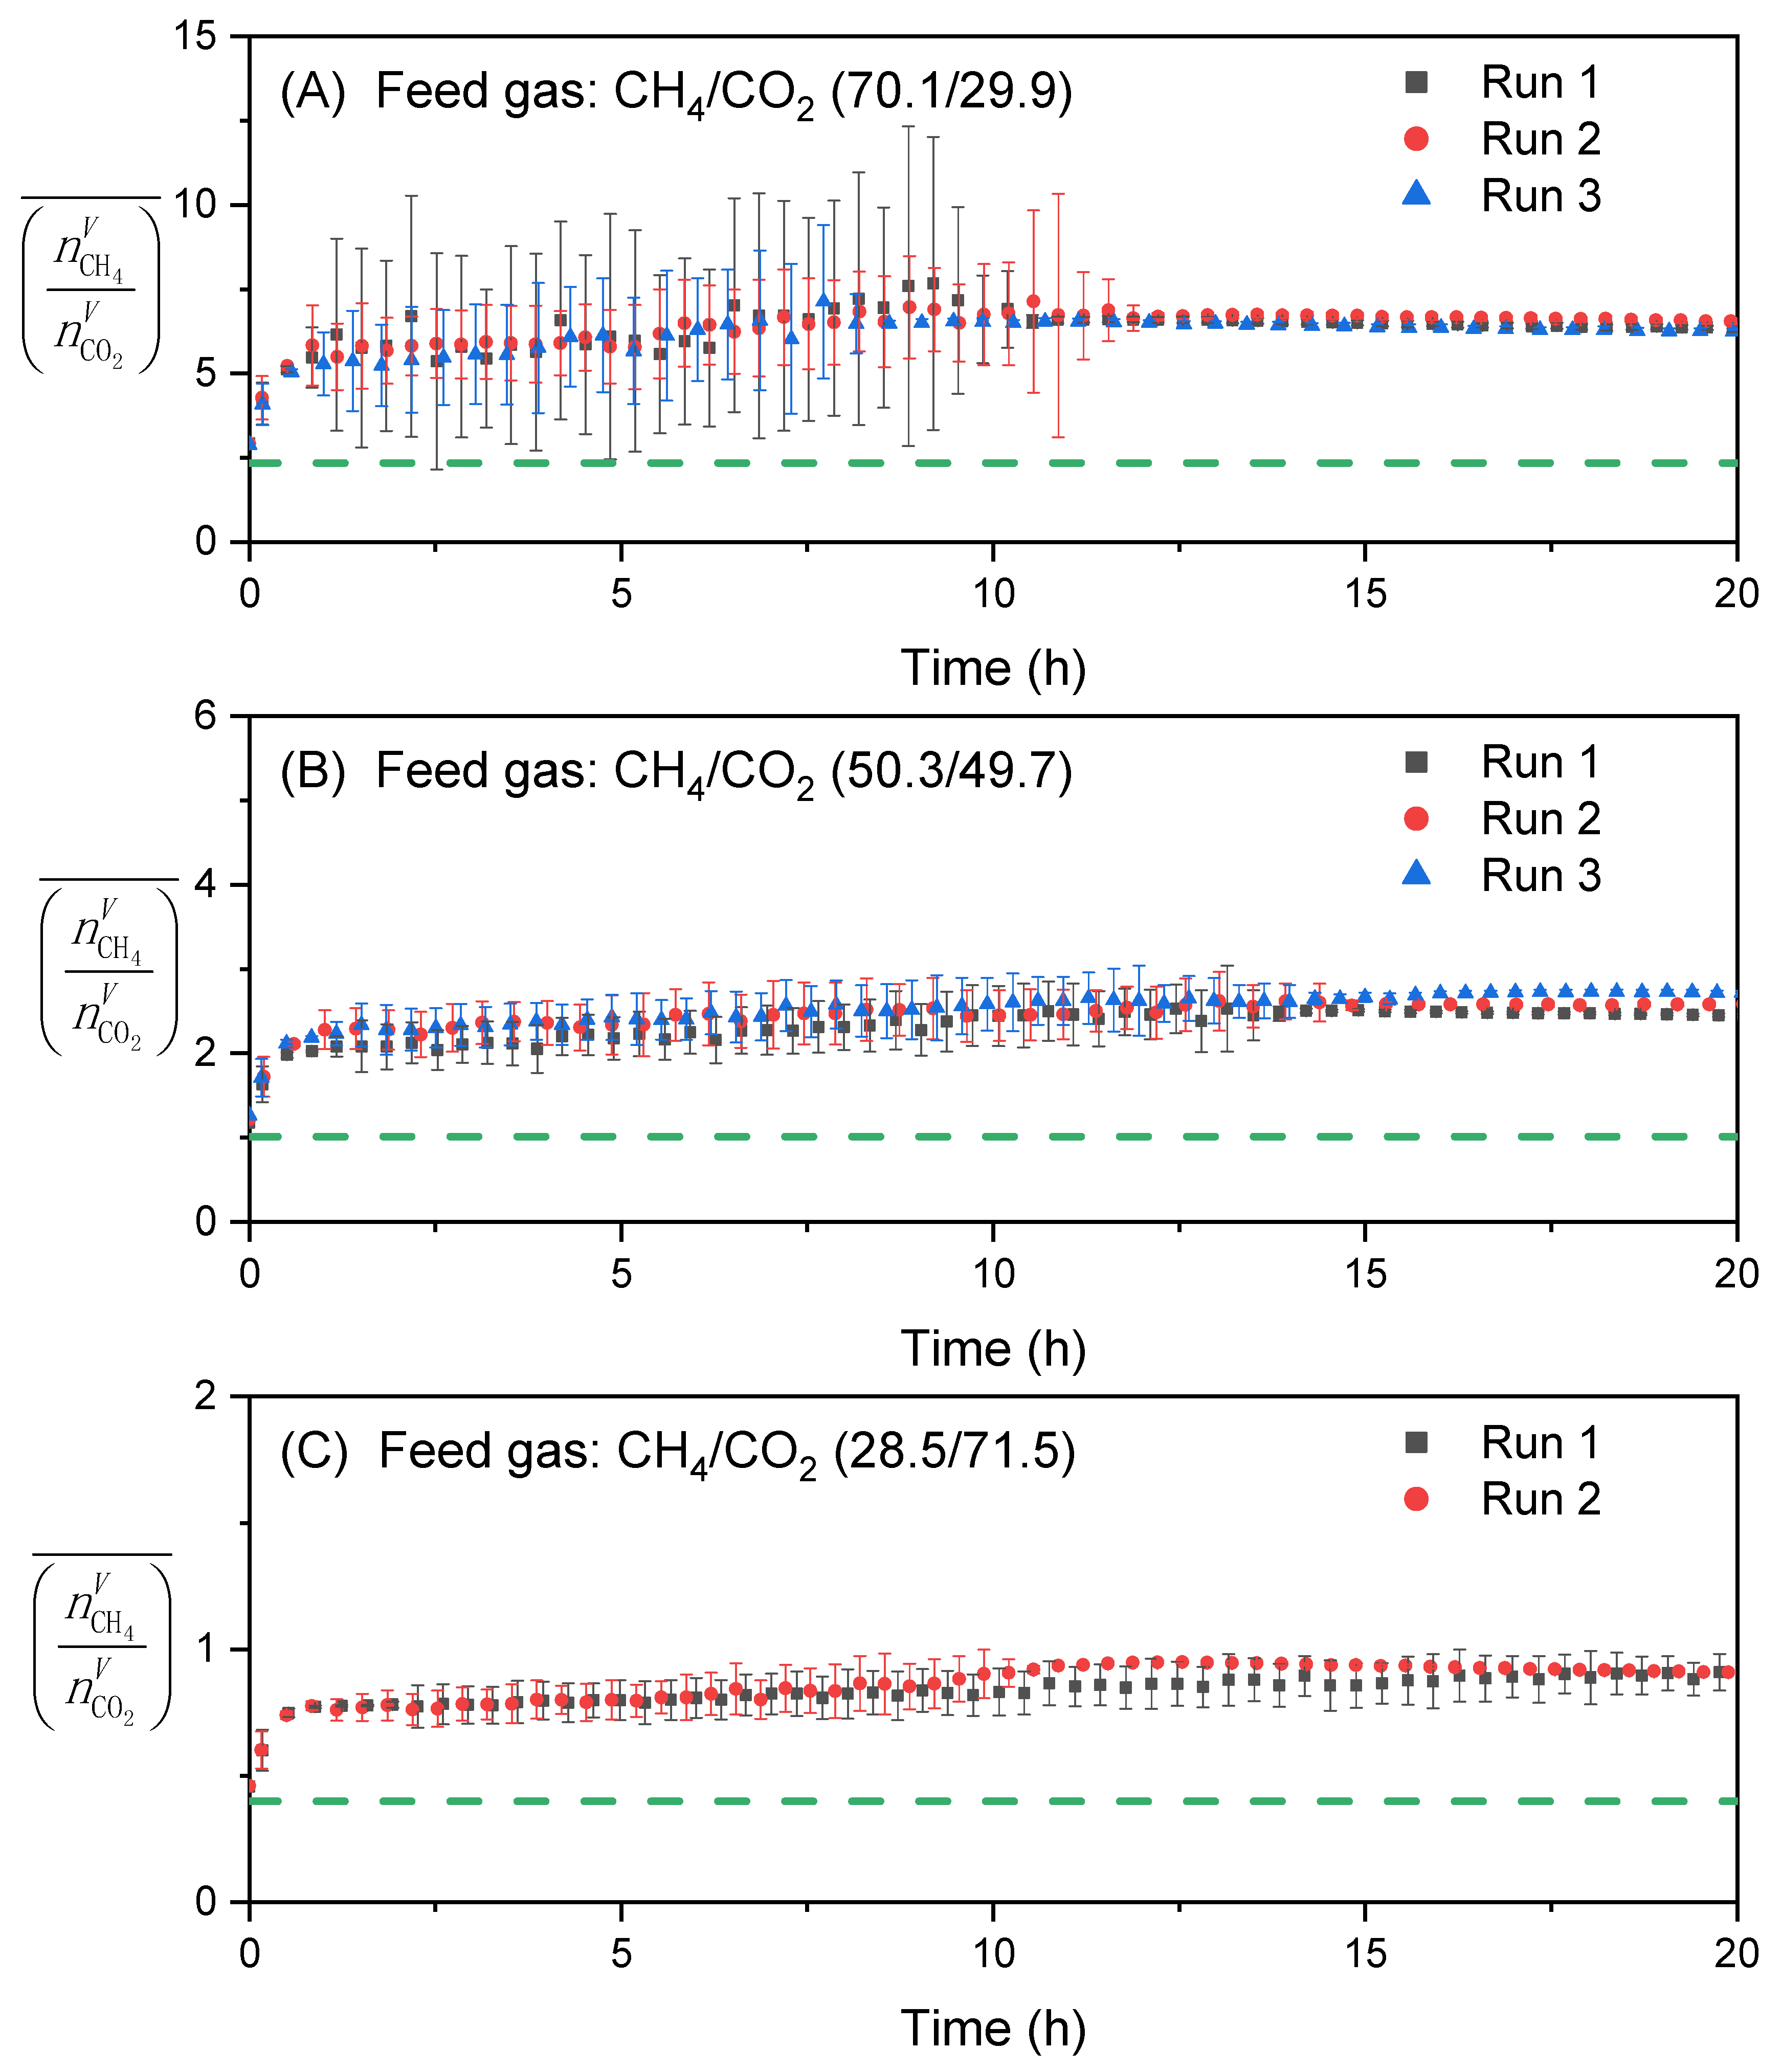
3.2. Effect of Feed Gas Composition on the Evolution of in the Vapor Phase
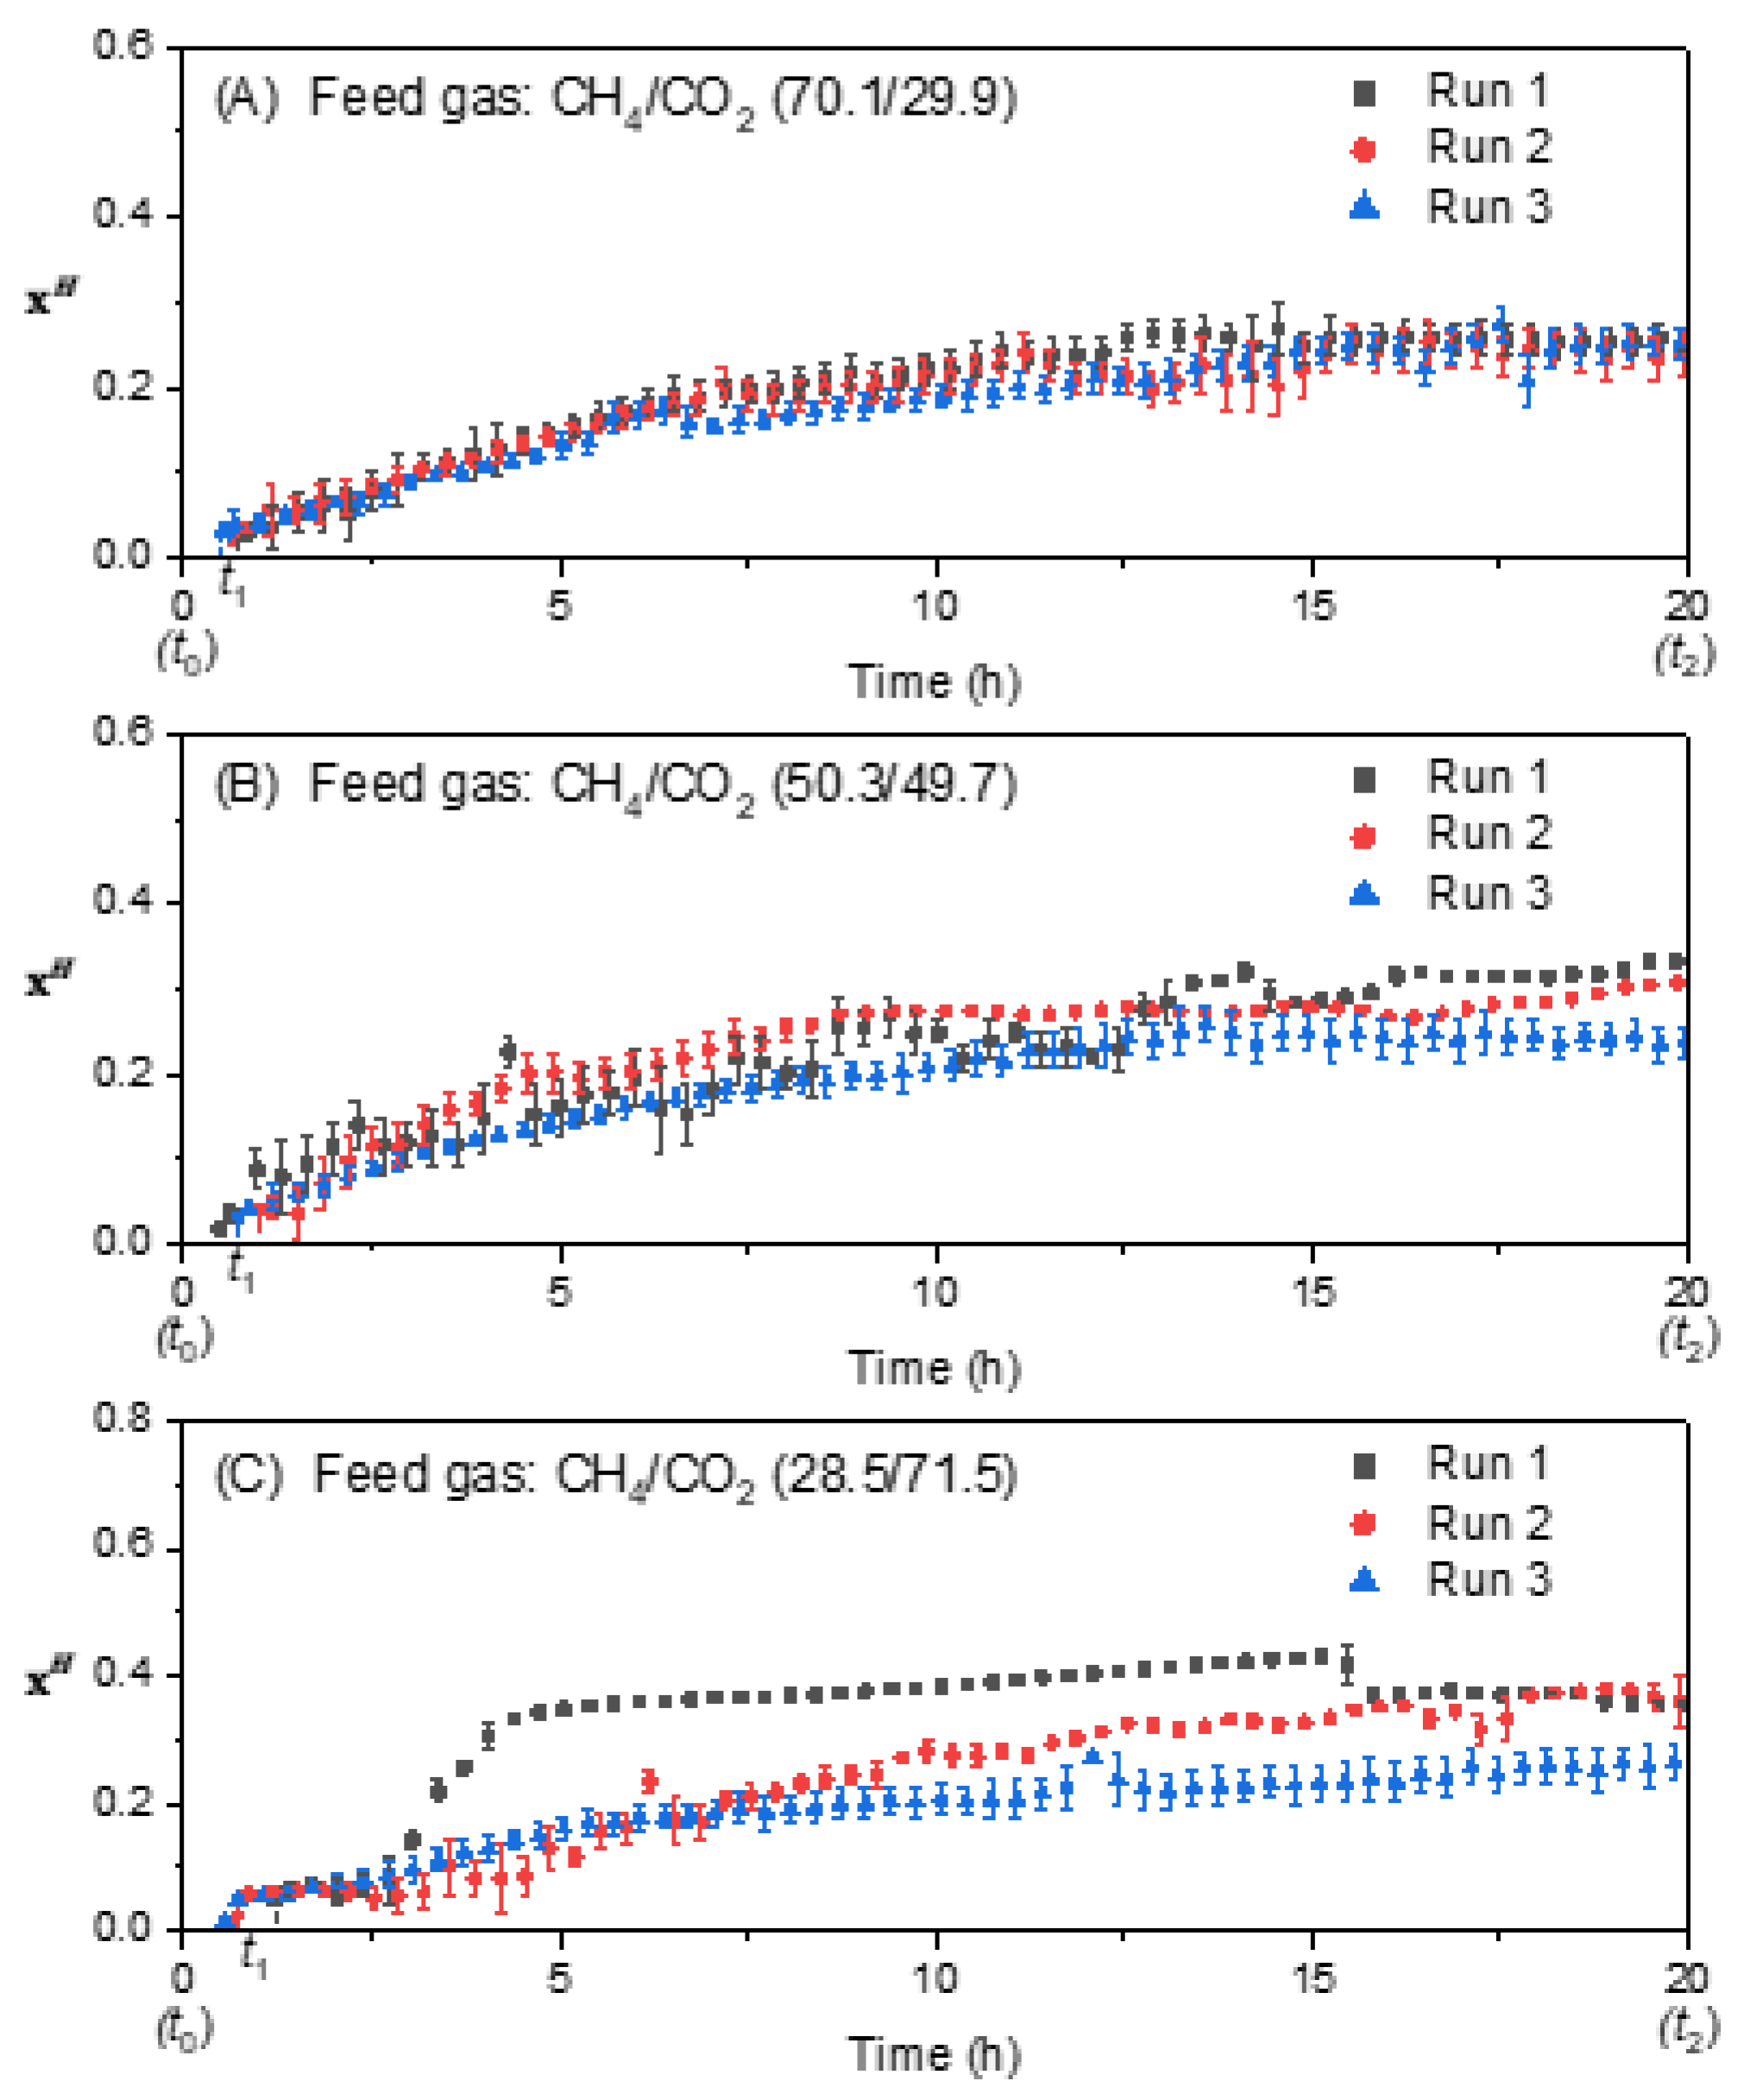
3.3. Effect of Feed Gas Composition on the Molar Fraction of Hydrate in the Hydrate Gel Phase
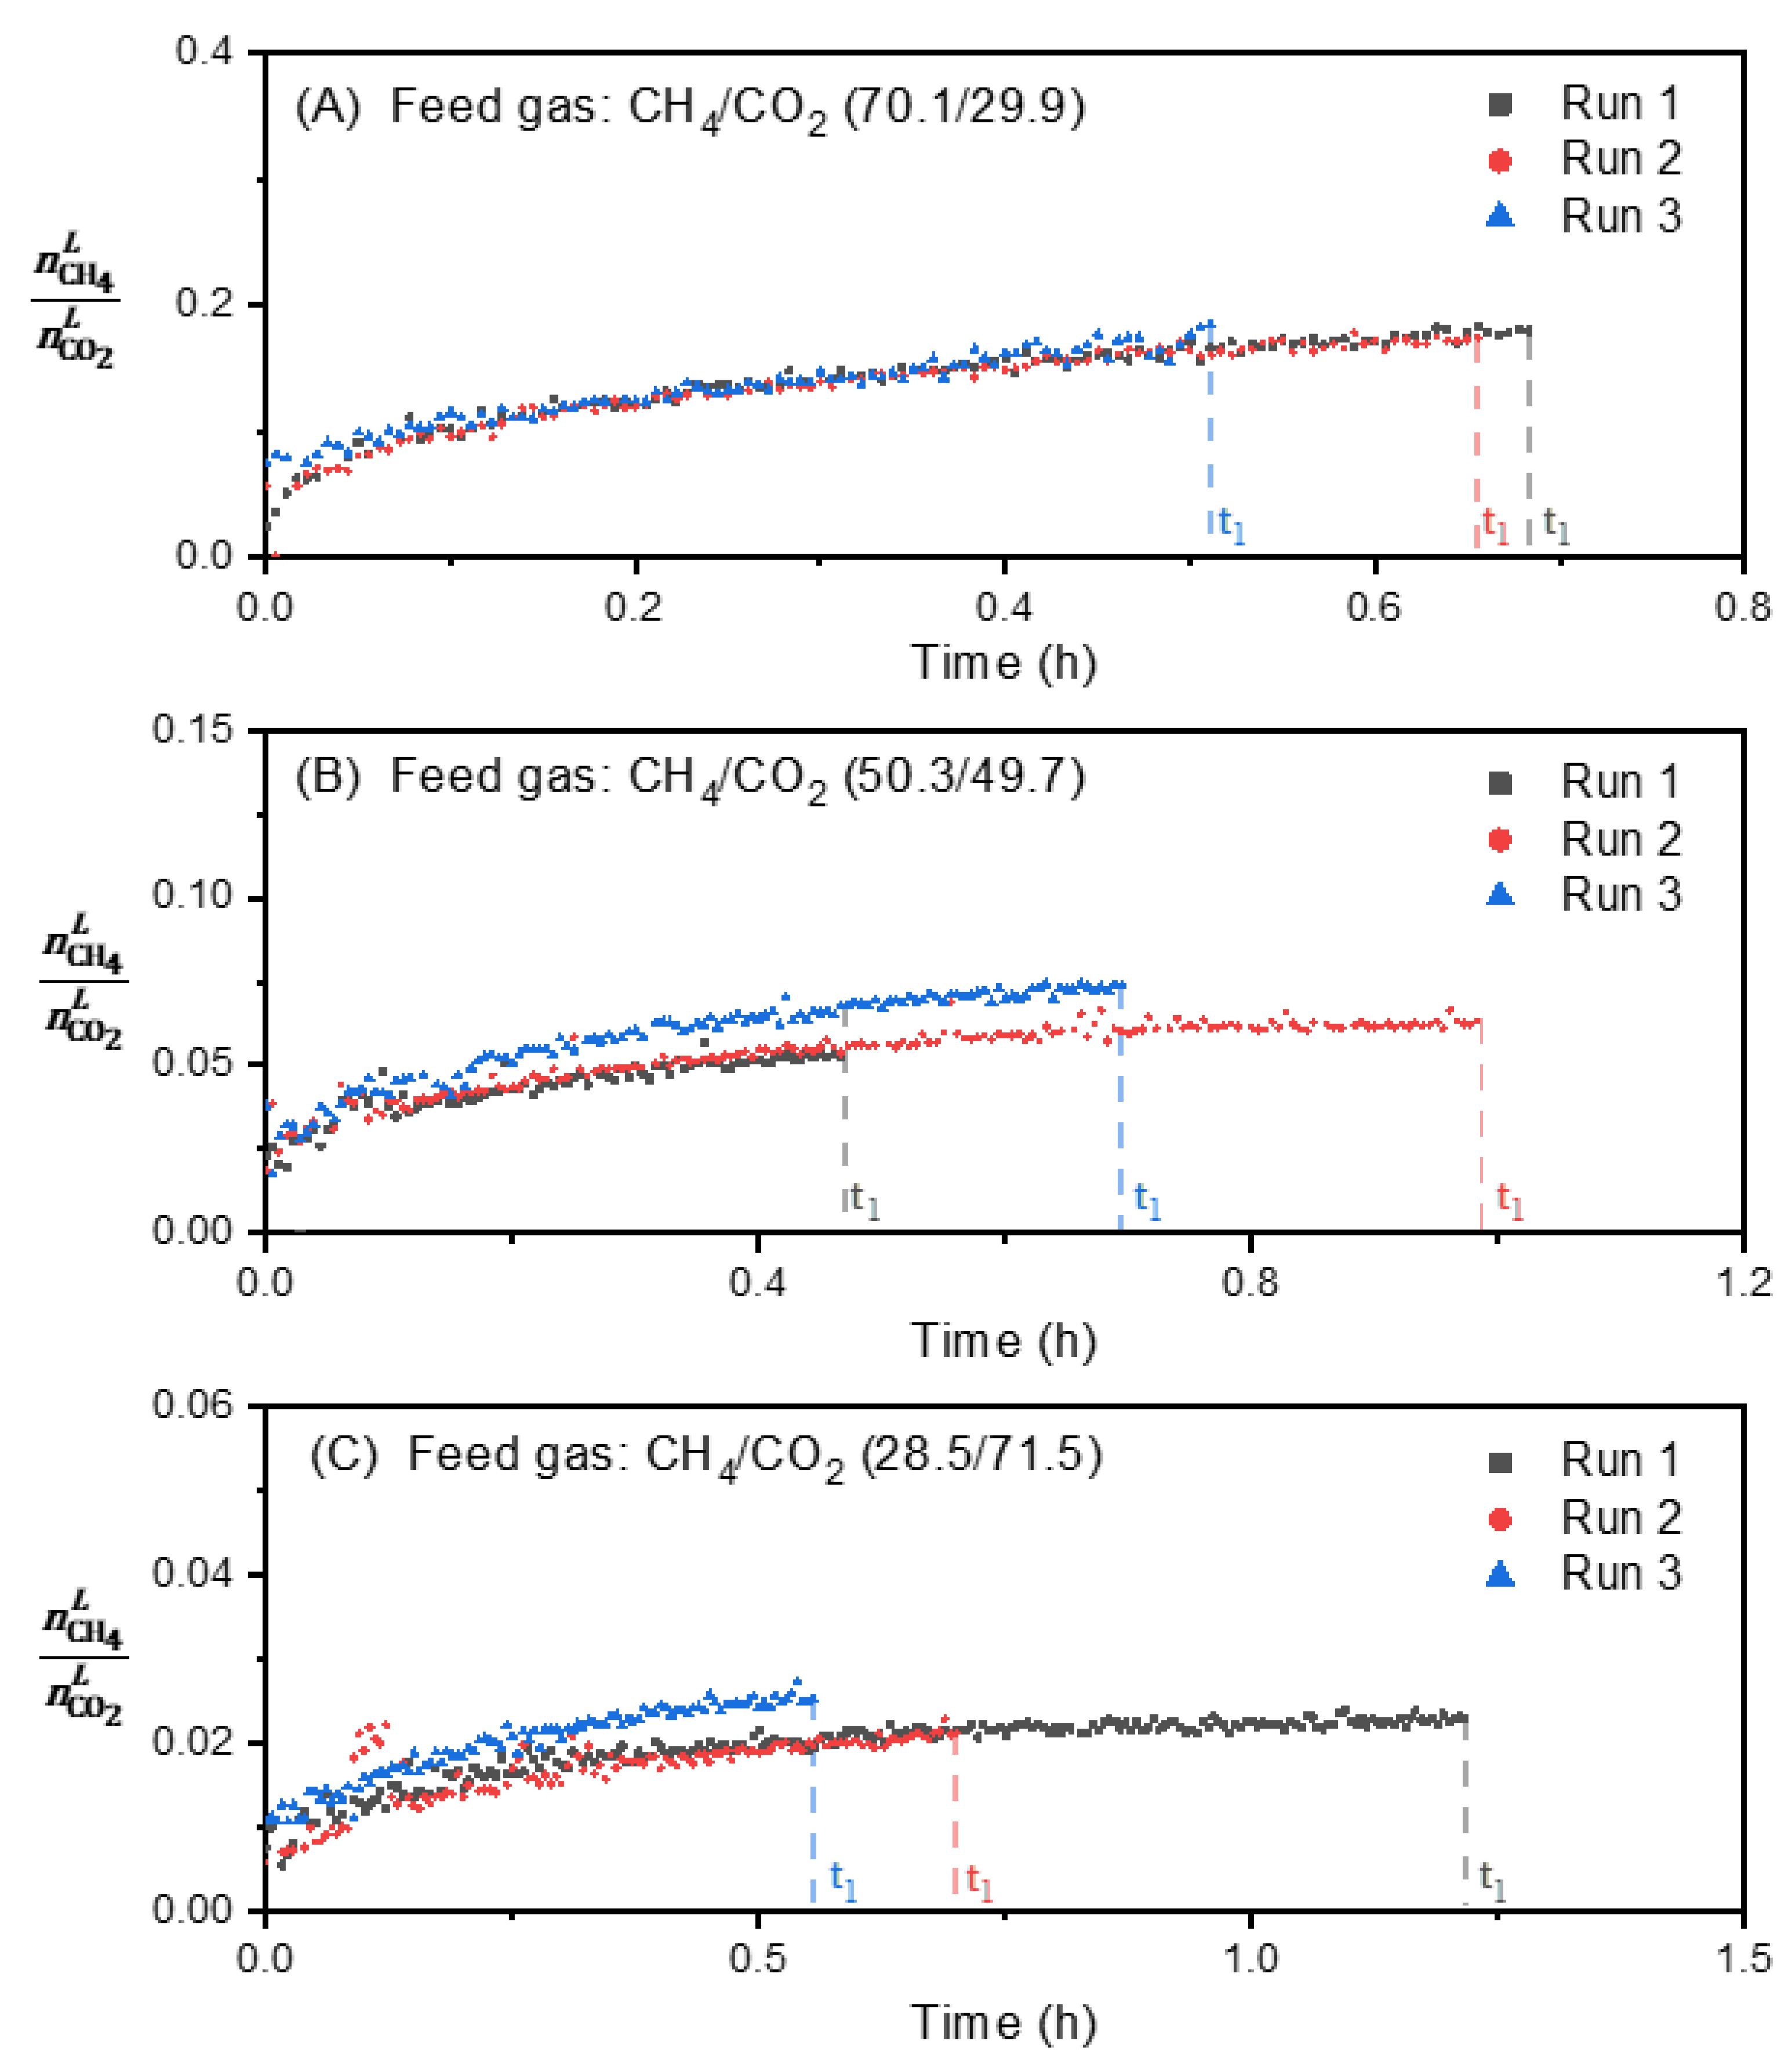
3.4. Effect of Feed Gas Composition on the Evolution of the Molar Ratio in the Liquid Water-Rich Phase and in the Solid Hydrate Phase
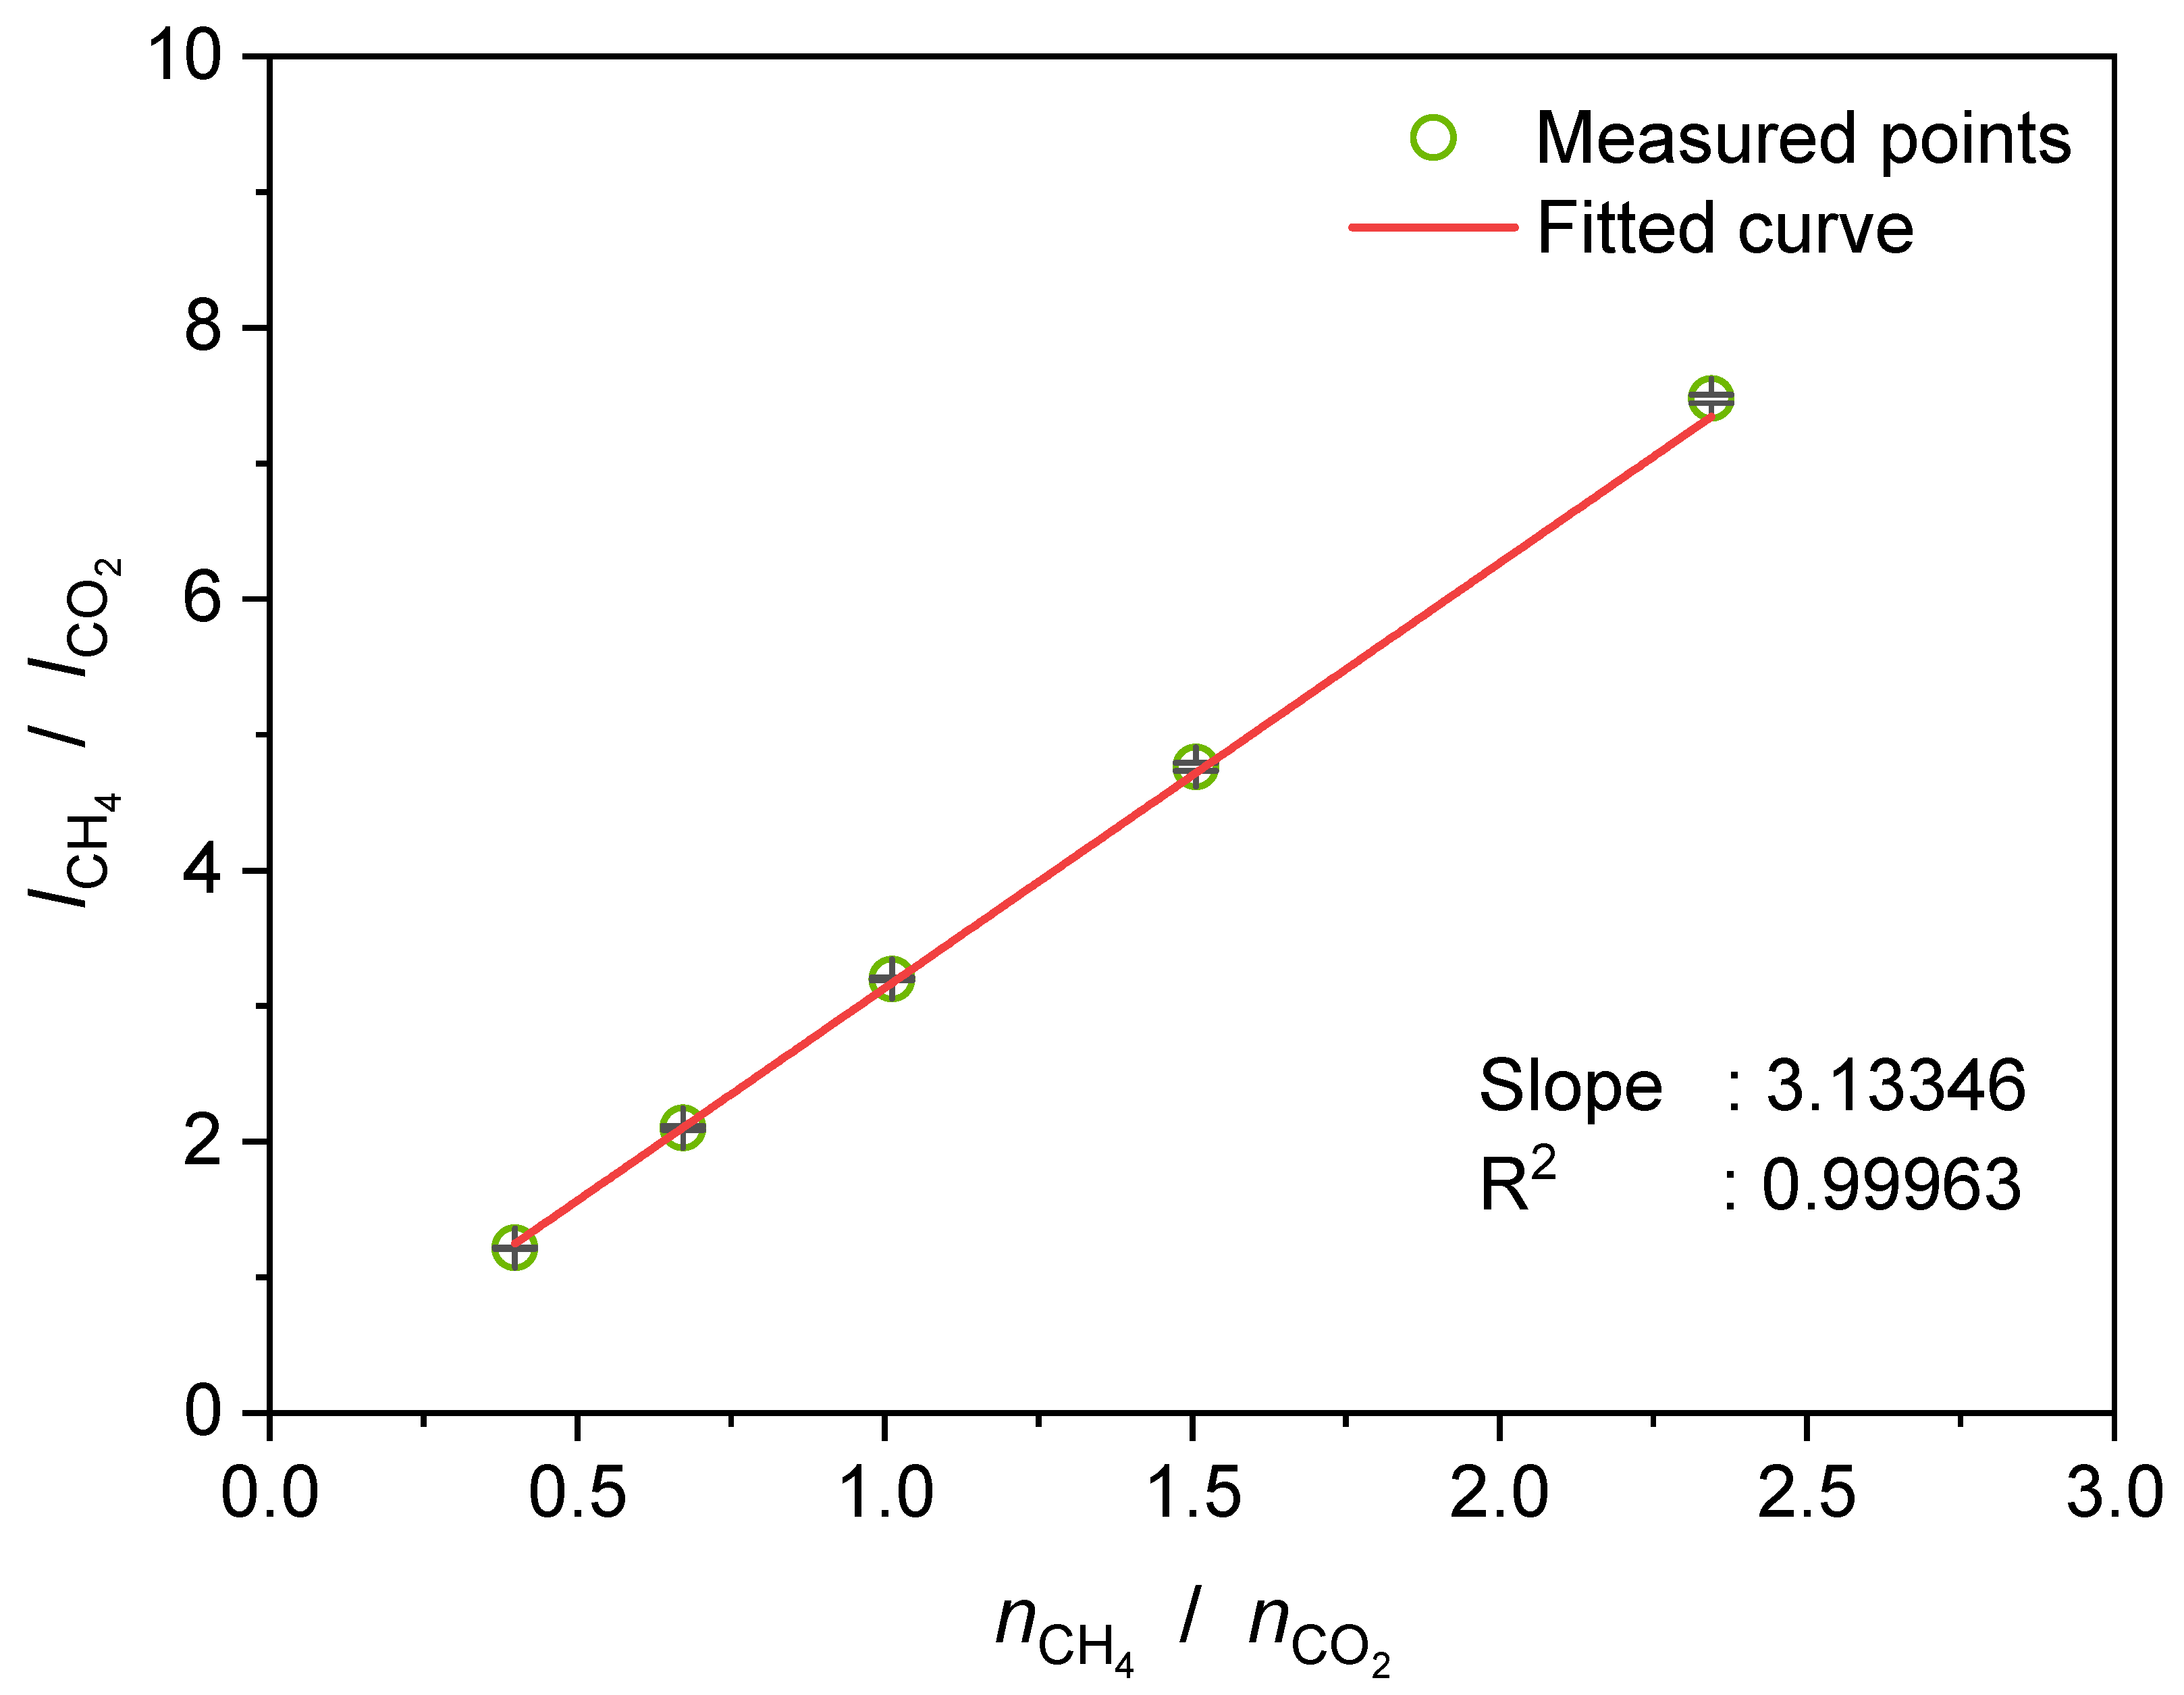
3.5. Determination of the Selectivity Factor
4. Conclusions
Author Contributions
Funding
Conflicts of Interest
References
- Sloan, E.D. Fundamental principles and applications of natural gas hydrates. Nature 2003, 426, 353–359. [Google Scholar] [CrossRef] [PubMed]
- Englezos, P. Cathrate hydrates. Ind. Eng. Chem. Res. 1993, 32, 1251–1274. [Google Scholar] [CrossRef]
- Ripmeester, J.A.; Tse, J.S.; Ratcliffe, C.I.; Powell, B.M. A new clathrate hydrate structure. Nature 1987, 325, 135–136. [Google Scholar] [CrossRef]
- Ripmeester, J.A.; Alavi, S. Some current challenges in clathrate hydrate science: Nucleation, decomposition and the memory effect. Curr. Opin. Solid State Mater. Sci. 2016, 20, 344–351. [Google Scholar] [CrossRef]
- Yin, Z.; Huang, L.; Linga, P. Effect of wellbore design on the production behaviour of methane hydrate-bearing sediments induced by depressurization. Appl. Energy 2019, 254, 113635. [Google Scholar] [CrossRef]
- Li, X.S.; Xu, C.G.; Zhang, Y.; Ruan, X.K.; Li, G.; Wang, Y. Investigation into gas production from natural gas hydrate: A review. Appl. Energy 2016, 172, 286–322. [Google Scholar] [CrossRef]
- Zheng, J.; Loganathan, N.K.; Zhao, J.; Linga, P. Clathrate hydrate formation of CO2/CH4 mixture at room temperature: Application to direct transport of CO2-containing natural gas. Appl. Energy 2019, 249, 190–203. [Google Scholar] [CrossRef]
- Wang, F.; Song, Y.-M.; Liu, G.Q.; Guo, G.; Luo, S.J.; Guo, R.-B. Rapid methane hydrate formation promoted by Ag&SDS-coated nanospheres for energy storage. Appl. Energy 2018, 213, 227–234. [Google Scholar]
- Seo, S.D.; Hong, S.Y.; Sum, A.K.; Lee, K.H.; Lee, J.D.; Lee, B.R. Thermodynamic and kinetic analysis of gas hydrates for desalination of saturated salinity water. Chem. Eng. J. 2019, 370, 980–987. [Google Scholar] [CrossRef]
- Dong, H.; Zhang, L.; Ling, Z.; Zhao, J.; Song, Y. The Controlling Factors and Ion Exclusion Mechanism of Hydrate-Based Pollutant Removal. ACS Sustain. Chem. Eng. 2019, 7, 7932–7940. [Google Scholar] [CrossRef]
- Zhong, D.L.; Englezos, P. Methane Separation from Coal Mine Methane Gas by Tetra-n-butyl Ammonium Bromide Semiclathrate Hydrate Formation. Energy Fuels 2012, 26, 2098–2106. [Google Scholar] [CrossRef]
- Cai, J.; Zhang, Y.; Xu, C.G.; Xia, Z.M.; Chen, Z.Y.; Li, X.S. Raman spectroscopic studies on carbon dioxide separation from fuel gas via clathrate hydrate in the presence of tetrahydrofuran. Appl. Energy 2018, 214, 92–102. [Google Scholar] [CrossRef]
- Chazallon, B.; Pirim, C. Selectivity and CO2 capture efficiency in CO2-N2 clathrate hydrates investigated by in-situ Raman spectroscopy. Chem. Eng. J. 2018, 342, 171–183. [Google Scholar] [CrossRef]
- Lee, D.; Go, W.; Seo, Y. Experimental and computational investigation of methane hydrate inhibition in the presence of amino acids and ionic liquids. Energy 2019, 182, 632–640. [Google Scholar] [CrossRef]
- Zerpa, L.E.; Salager, J.L.; Koh, C.A.; Sloan, E.D.; Sum, A.K. Surface Chemistry and Gas Hydrates in Flow Assurance. Ind. Eng. Chem. Res. 2011, 50, 188–197. [Google Scholar] [CrossRef]
- Van Denderen, M.; Ineke, E.; Golombok, M. CO2 Removal from Contaminated Natural Gas Mixtures by Hydrate Formation. Ind. Eng. Chem. Res. 2009, 48, 5802–5807. [Google Scholar] [CrossRef]
- Ricaurte, M.; Dicharry, C.; Broseta, D.; Renaud, X.; Torre, J.-P. CO2 Removal from a CO2-CH4 Gas Mixture by Clathrate Hydrate Formation Using THF and SDS as Water-Soluble Hydrate Promoters. Ind. Eng. Chem. Res. 2013, 52, 899–910. [Google Scholar] [CrossRef]
- Li, Z.; Zhong, D.L.; Lu, Y.Y.; Yan, J.; Zou, Z.L. Preferential enclathration of CO2 into tetra-n-butyl phosphonium bromide semiclathrate hydrate in moderate operating conditions: Application for CO2 capture from shale gas. Appl. Energy 2017, 199, 370–381. [Google Scholar] [CrossRef]
- Liu, J.; Ding, J.X.; Liang, D.Q. Experimental study on hydrate-based gas separation of mixed CH4/CO2 using unstable ice in a silica gel bed. Energy 2018, 157, 54–64. [Google Scholar] [CrossRef]
- Lim, J.; Choi, W.; Mok, J.; Seo, Y. Clathrate-Based CO2 Capture from CO2-Rich Natural Gas and Biogas. ACS Sustain. Chem. Eng. 2018, 6, 5627–5635. [Google Scholar] [CrossRef]
- Xia, Z.M.; Li, X.S.; Chen, Z.Y.; Li, G.; Yan, K.F.; Xu, C.G.; Lv, Q.N.; Cai, J. Hydrate-based CO2 capture and CH4 purification from simulated biogas with synergic additives based on gas solvent. Appl. Energy 2016, 162, 1153–1159. [Google Scholar] [CrossRef]
- Lim, J.; Choi, W.; Mok, J.; Seo, Y. Kinetic CO2 selectivity in clathrate-based CO2 capture for upgrading CO2-rich natural gas and biogas. Chem. Eng. J. 2019, 369, 686–693. [Google Scholar] [CrossRef]
- Yue, G.; Liu, Y.; Luo, Y.; Liu, A.X.; Chen, B.; Sun, Q.; Li, X.X.; Dong, B.; Yang, L.Y.; Guo, X.Q. Combining Different Additives with TBAB on CO2 Capture and CH4 Purification from Simulated Biogas Using Hydration Method. J. Chem. Eng. Data 2019, 64, 1622–1631. [Google Scholar] [CrossRef]
- Holzammer, C.C.; Braeuer, A.S. Raman Spectroscopic Study of the Effect of Aqueous Salt Solutions on the Inhibition of Carbon Dioxide Gas Hydrates. J. Phys. Chem. B 2019, 123, 2354–2361. [Google Scholar] [CrossRef]
- Holzammer, C.; Schicks, J.M.; Will, S.; Braeuer, A.S. Influence of Sodium Chloride on the Formation and Dissociation Behavior of CO2 Gas Hydrates. J. Phys. Chem. B 2017, 121, 8330–8337. [Google Scholar] [CrossRef]
- Braeuer, A.; Hankel, R.F.; Mehnert, M.K.; Schuster, J.J.; Will, S. A Raman technique applicable for the analysis of the working principle of promoters and inhibitors of gas hydrate formation. J. Raman Spectrosc. 2015, 46, 1145–1149. [Google Scholar] [CrossRef]
- Qin, J.; Kuhs, W.F. Quantitative analysis of gas hydrates using Raman spectroscopy. AIChE J. 2013, 59, 2155–2167. [Google Scholar] [CrossRef]
- Braeuer, A. In Situ Spectroscopic Techniques at High Pressure; Elsevier Science: Amsterdam, The Netherlands, 2015. [Google Scholar]
- Sloan, E.D.; Koh, C.A. Clathrate Hydrates of Natural Gases, 3rd ed.; CRC Press: Boca Raton, FL, USA, 2008. [Google Scholar]
- Kumar, R.; Lang, S.; Englezos, P.; Ripmeester, J. Application of the ATR-IR Spectroscopic Technique to the Characterization of Hydrates Formed by CO2, CO2/H2 and CO2/H2/C3H8. J. Phys. Chem. A 2009, 113, 6308–6313. [Google Scholar] [CrossRef]
- Uchida, T.; Hirano, T.; Ebinuma, T.; Narita, H.; Gohara, K.; Mae, S.; Matsumoto, R. Raman spectroscopic determination of hydration number of methane hydrates. AIChE J. 1999, 45, 2641–2645. [Google Scholar] [CrossRef]
- Chen, L.; Lu, H.; Ripmeester, J.A. Raman spectroscopic study of CO2 in hydrate cages. Chem. Eng. Sci. 2015, 138, 706–711. [Google Scholar] [CrossRef]
- Carey, D.M.; Korenowski, G.M. Measurement of the Raman spectrum of liquid water. J. Chem. Phys. 1998, 108, 2669–2675. [Google Scholar] [CrossRef]
- Ludwig, R. Water: From Clusters to the Bulk. Angew. Chem. Int. Ed. Engl. 2001, 40, 1808–1827. [Google Scholar] [CrossRef]
- Holzammer, C.; Finckenstein, A.; Will, S.; Braeuer, A.S. How Sodium Chloride Salt Inhibits the Formation of CO2 Gas Hydrates. J. Phys. Chem. B 2016, 120, 2452–2459. [Google Scholar] [CrossRef] [PubMed]
- Schuster, J.J.; Will, S.; Leipertz, A.; Braeuer, A. Deconvolution of Raman spectra for the quantification of ternary high-pressure phase equilibria composed of carbon dioxide, water and organic solvent. J. Raman Spectrosc. 2014, 45, 246–252. [Google Scholar] [CrossRef]
- Alsmeyer, F.; Koß, H.J.; Marquardt, W. Indirect Spectral Hard Modeling for the Analysis of Reactive and Interacting Mixtures. Appl. Spectrosc. 2004, 58, 975–985. [Google Scholar] [CrossRef]
- Kriesten, E.; Mayer, D.; Alsmeyer, F.; Minnich, C.B.; Greiner, L.; Marquardt, W. Identification of unknown pure component spectra by indirect hard modeling. Chemometr. Intell. Lab. Syst. 2008, 93, 108–119. [Google Scholar] [CrossRef]
- Adami, R.; Schuster, J.; Liparoti, S.; Reverchon, E.; Leipertz, A.; Braeuer, A. A Raman spectroscopic method for the determination of high pressure vapour liquid equilibria. Fluid Phase Equilib. 2013, 360, 265–273. [Google Scholar] [CrossRef]
- Luther, S.K.; Schuster, J.J.; Leipertz, A.; Braeuer, A. Non-invasive quantification of phase equilibria of ternary mixtures composed of carbon dioxide, organic solvent and water. J. Supercrit. Fluid. 2013, 84, 146–154. [Google Scholar] [CrossRef]
- Di Profio, P.; Canale, V.; D’Alessandro, N.; Germani, R.; Di Crescenzo, A.; Fontana, A. Separation of CO2 and CH4 from Biogas by Formation of Clathrate Hydrates: Importance of the Driving Force and Kinetic Promoters. ACS Sustain. Chem. Eng. 2017, 5, 1990–1997. [Google Scholar] [CrossRef]
- Uchida, T.; Ikeda, I.Y.; Takeya, S.; Kamata, Y.; Ohmura, R.; Nagao, J.; Zatsepina, O.Y.; Buffett, B.A. Kinetics and stability of CH4-CO2 mixed gas hydrates during formation and long-term storage. ChemPhysChem 2005, 6, 646–654. [Google Scholar] [CrossRef]
- Schicks, J.M.; Luzi-Helbing, M. Cage occupancy and structural changes during hydrate formation from initial stages to resulting hydrate phase. Spectrochim. Acta A Mol. Biomol. Spectrosc. 2013, 115, 528–536. [Google Scholar] [CrossRef] [PubMed]
- Lang, F.; Servio, P. Bulk liquid and gas mole fraction measurements during hydrate growth for the CH4 + CO2 + H2O system. J. Chem. Thermodyn. 2018, 117, 113–118. [Google Scholar] [CrossRef]
- He, Z.; Gupta, K.M.; Linga, P.; Jiang, J. Molecular Insights into the Nucleation and Growth of CH4 and CO2 Mixed Hydrates from Microsecond Simulations. J. Phys. Chem. C 2016, 120, 25225–25236. [Google Scholar] [CrossRef]
- Zhong, D.L.; Li, Z.; Lu, Y.Y.; Wang, J.L.; Yan, J. Evaluation of CO2 removal from a CO2+CH4 gas mixture using gas hydrate formation in liquid water and THF solutions. Appl. Energy 2015, 158, 133–141. [Google Scholar] [CrossRef]


© 2020 by the authors. Licensee MDPI, Basel, Switzerland. This article is an open access article distributed under the terms and conditions of the Creative Commons Attribution (CC BY) license (http://creativecommons.org/licenses/by/4.0/).
Share and Cite
Li, Z.; Holzammer, C.C.; Braeuer, A.S. Analysis of the Dissolution of CH4/CO2-Mixtures into Liquid Water and the Subsequent Hydrate Formation via In Situ Raman Spectroscopy. Energies 2020, 13, 793. https://doi.org/10.3390/en13040793
Li Z, Holzammer CC, Braeuer AS. Analysis of the Dissolution of CH4/CO2-Mixtures into Liquid Water and the Subsequent Hydrate Formation via In Situ Raman Spectroscopy. Energies. 2020; 13(4):793. https://doi.org/10.3390/en13040793
Chicago/Turabian StyleLi, Zheng, Christine C. Holzammer, and Andreas S. Braeuer. 2020. "Analysis of the Dissolution of CH4/CO2-Mixtures into Liquid Water and the Subsequent Hydrate Formation via In Situ Raman Spectroscopy" Energies 13, no. 4: 793. https://doi.org/10.3390/en13040793
APA StyleLi, Z., Holzammer, C. C., & Braeuer, A. S. (2020). Analysis of the Dissolution of CH4/CO2-Mixtures into Liquid Water and the Subsequent Hydrate Formation via In Situ Raman Spectroscopy. Energies, 13(4), 793. https://doi.org/10.3390/en13040793