Article

Multi-State Household Appliance Identification Based on Convolutional Neural Networks and Clustering

1
College of Information Science and Engineering, Ocean University of China, Qingdao 266000, China
2
Pilot National Laboratory for Marine Science and Technology, Qingdao 266000, China
*
Author to whom correspondence should be addressed.
Energies 2020, 13(4), 792; https://doi.org/10.3390/en13040792
Submission received: 4 November 2019 / Revised: 7 February 2020 / Accepted: 8 February 2020 / Published: 11 February 2020

Abstract

:
Non-intrusive load monitoring, a convenient way to discern the energy consumption of a house, has been studied extensively. However, most research works have been carried out based on a hypothetical condition that each electric appliance has only one running state. This leads to low identification accuracy for multi-state electric appliances. To deal with this problem, a method for identifying the type and state of electric appliances based on a power time series is proposed in this paper. First, to identify the type of appliance, a convolutional neural network model was constructed that incorporated residual modules. Then, a k-means clustering algorithm was applied to calculate the number of states of the appliance. Finally, in order to identify the states of the appliances, different k-means clustering models were established for different multi-state electric appliances. Experimental results show effectiveness of the proposed method in identifying both the type and the running state of electric appliances.

1. Introduction

Non-intrusive load monitoring (NILM) has been studied extensively in smart grids as a convenient way to discern the energy consumption of a house by analyzing aggregated signals [1]. Compared to the traditional intrusive load monitoring method, this method reduces the demand for a large amount of monitoring equipment. Hence, the cost of the smart grid is cut down. The key process is to accurately identify appliances and their statuses [2].
Generally, the NILM method includes several processes, such as switching event detection [3,4,5], non-intrusive load decomposition [6], non-intrusive load identification, and so on. The switching event detection process detects the on and off states of an electric appliance according to transient signal characteristics. The non-intrusive load decomposition process is used to decompose the total household signal into several sub-signals caused by different electric appliances [7]. The non-intrusive load identification process is used to achieve load identification by identifying all kinds of sub-signals obtained after the process of non-intrusive load decomposition [8]. In this paper, the non-intrusive load identification process is studied. There are already various non-intrusive load identification methods [9,10,11]; however, most research works have been carried out based on a hypothetical condition that each electric appliance only has one running state. In fact, with the development of science and technology, not only the type of electric appliance but also the running state of each electric appliance is increased; that is, lots of electric appliances have multiple states. In such a situation, electric appliance identification becomes more and more difficult.
In this paper, an identification method for distinguishing and identifying the types and stats of different electric appliances based on power time series is proposed. First, to identify the type of appliance, a convolutional neural network model that incorporates residual modules is constructed. In such a way, the recognition accuracy of electrical appliance types can be improved. The k-means clustering algorithm is then applied to calculate the number of states of the appliance. Finally, in order to identify the states of the appliances, different k-means clustering models are established for different multi-state electric appliances. This method is useful not only for electric appliances, but also for microfluidic systems modelling [12].
The structure of this paper is as follows. A brief introduction of the research work of single-state and multi-state electrical appliances is given in Section 2. Relevant theoretical knowledge involved in the article is elaborated upon in Section 3. The method and overall framework proposed in this paper are presented in Section 4. The detailed experimental process and experimental results are presented in Section 5. All abbreviations mentioned in this article are listed in Table 1.

2. Related Work

Most of the research work on non-intrusive load recognition methods has focused on feature extraction from data collected at transient states or during steady-state operations of the electric appliance. Yanchi Liu et al. [13] proposed an admittance-based load feature construction method called Resolution Enhanced Admittance (REA), which was shown by experiments to improve the accuracy of non-intrusive load identification. Current–voltage trajectory is another way to perform feature extraction. Leen De Baets et al. separated the voltage and current trajectories from aggregated signals by considering current changes before and after an event. They trained and tested the Reference Energy Disaggregation Data Set (PLAID) using two different classifiers of random forest and convolutional neural network algorithms [14]. In order to solve the problem of imbalanced multi-class classification data, Liu Hui and Haiping Wu proposed a hybrid equipment classification model that uses time series features and a random forest classifier to realize load identification. Compared to the previously proposed methods, the identification accuracy of different electric appliances has been improved [15]. Ghosh Soumyajit et al. proposed an improved NILM method in which the harmonic impedance of different loads on the load side is first determined, then a fuzzy rule-based method is used to identify different loads on the user side [16]. However, those non-intrusive load identification methods are mainly focused on the identification of single-state appliances.
There are few researchers that have focused on state recognition within multi-state appliances. Chinthaka Dinesh et al. proposed a non-intrusive load monitoring method that simultaneously determines the amount of solar inflow and the device information (such as transient state, operation state, and level of power consumption based on the spectral clustering method), to automatically classify different operating modes of multi-state appliances [17]. Kushan Ajay Choksi et al. [18] proposed a method of constructing a power matrix that converts different states to three different values of −1, 0, and +1, and then uses machine learning to realize the state recognition of electrical appliances. In order to improve the identification accuracy of multi-state electric appliances, this paper proposes a method of state recognition responding to specific electrical equipment types based on power time series.

3. Theory

3.1. Convolutional Neural Network Model

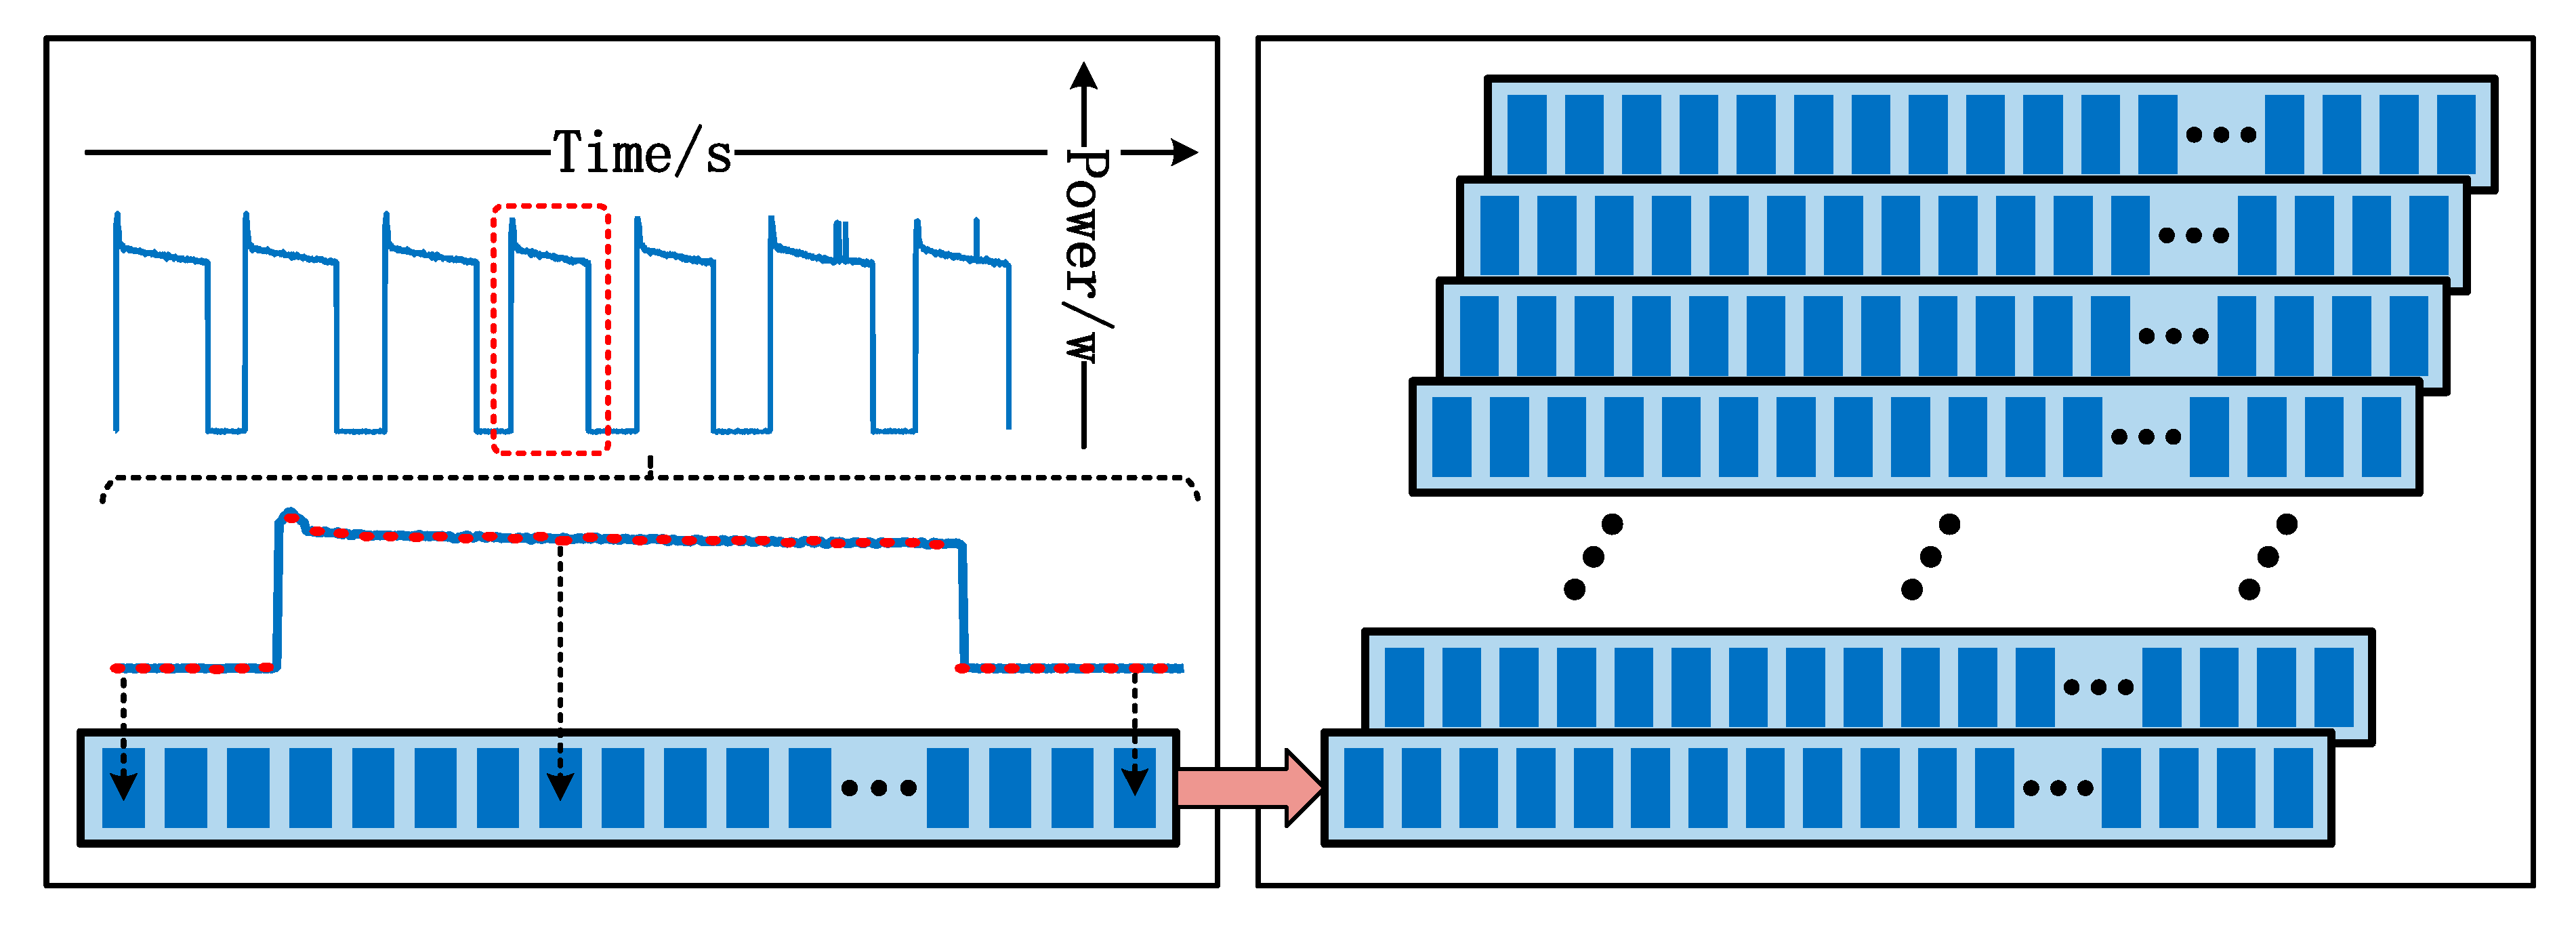
3.1.1. Data Preprocessing

The Reference Energy Disaggregation Data Set (REDD), which includes high- and low-frequency data, was published as a non-intrusive load monitoring study by J. Zico Kolter and Matthew J. Johnson, and has been used widely [19]. Most research works on non-intrusive load decomposition have been carried out based on high-frequency data. In this paper, low-frequency data are studied to realize load identification within multi-state appliances. In order to determine the characteristics of power time series, closed-state power in the dataset was first removed. The power time series of REDD was then segmented. Although it can be taken as a periodic signal, each data cycle of a power time series contains different data points. Hence, the cycle lengths of different devices were different. In order to extract all states of an appliance, 1000 data points were intercepted as a line and the category at the beginning of each line was labeled as an input to the one-dimensional convolutional neural network, as shown in Figure 1.

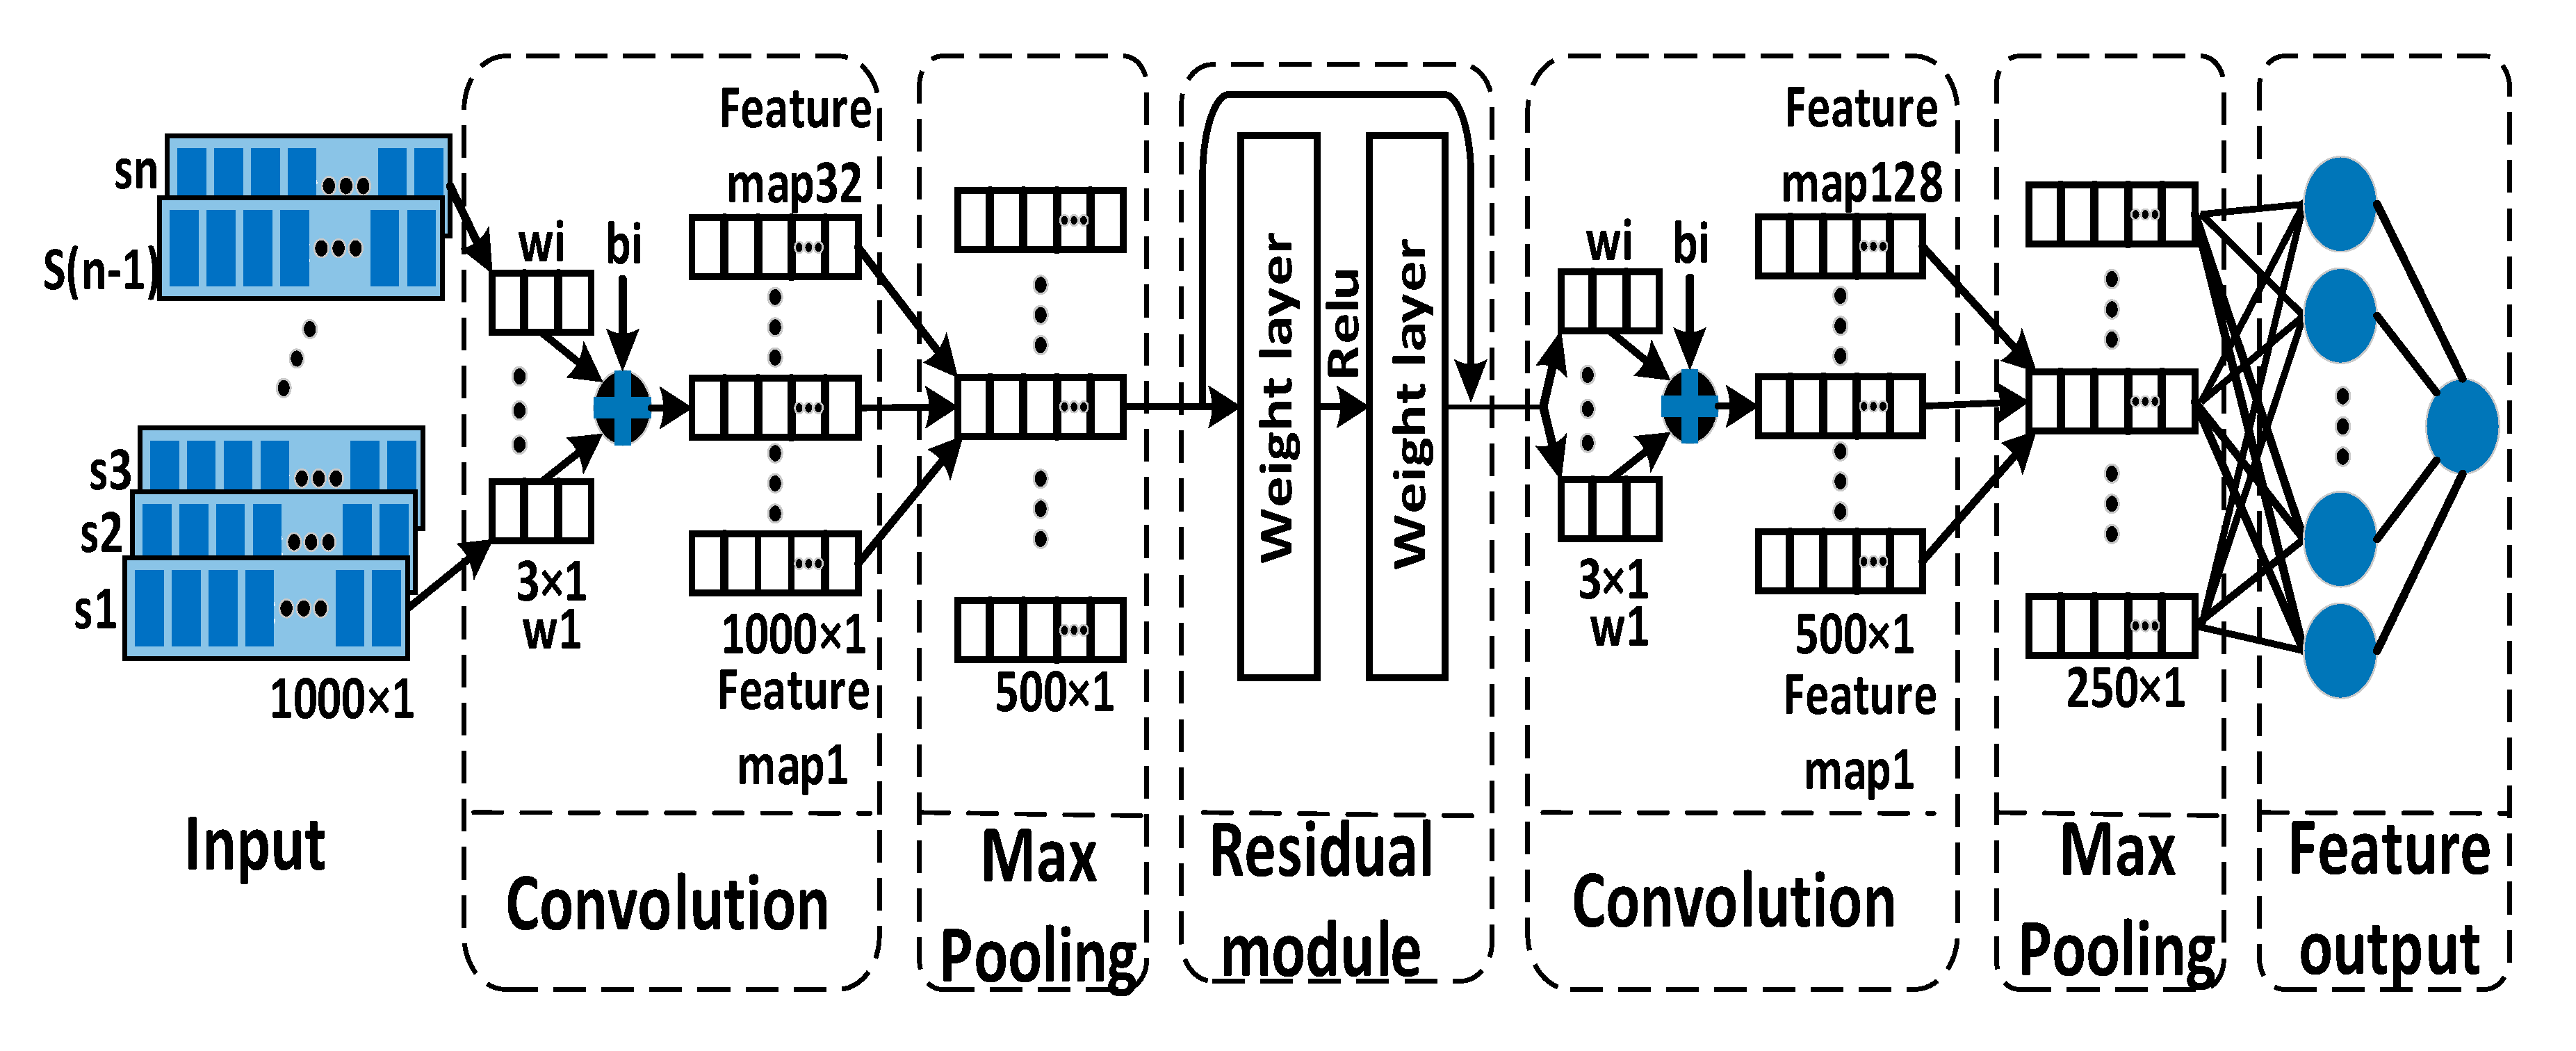
3.1.2. Convolutional Neural Network Model Structure

In 1998, Bengio, LeCun et al. proposed the first convolutional neural network model, called lenet-5, which classified numbers within a written number [20]. In this paper, a convolutional neural network is applied to identify the type of electrical appliance; that is, a convolutional neural network model was fused with a residual module to process a power time series. The model mainly consisted of three units. The first unit included a layer of convolution and a layer of pooling. In the convolution operation, the number of convolution kernels was set to 32, the size of the convolution kernels was set to 3 × 1, and the stride was set to 1. Pooling used the maximum pooling operation. The pool size was set to 2, and the stride was set to 1. The second unit was the residual module, which included two layers of convolution. Here, the number of convolution kernels was set to 64, the size of the convolution kernel was set to 3 × 1, the stride was set to 1, and an add operation was included. The final unit included a layer of convolution and a layer of maximum pooling. In the convolution operation, the number of convolution kernels was set to 128, the size of the convolution kernels was set to 3 × 1, and the stride was set to 1. In the pooling operation, the pool size was set to 2 and the stride was set to 2. In order to prevent overfitting caused by the convolutional neural network, a dropout layer was set up in the network. The latter unit included a fully connected layer and an output layer, which are shown in Figure 2.

3.2. Construction of the Cluster Model

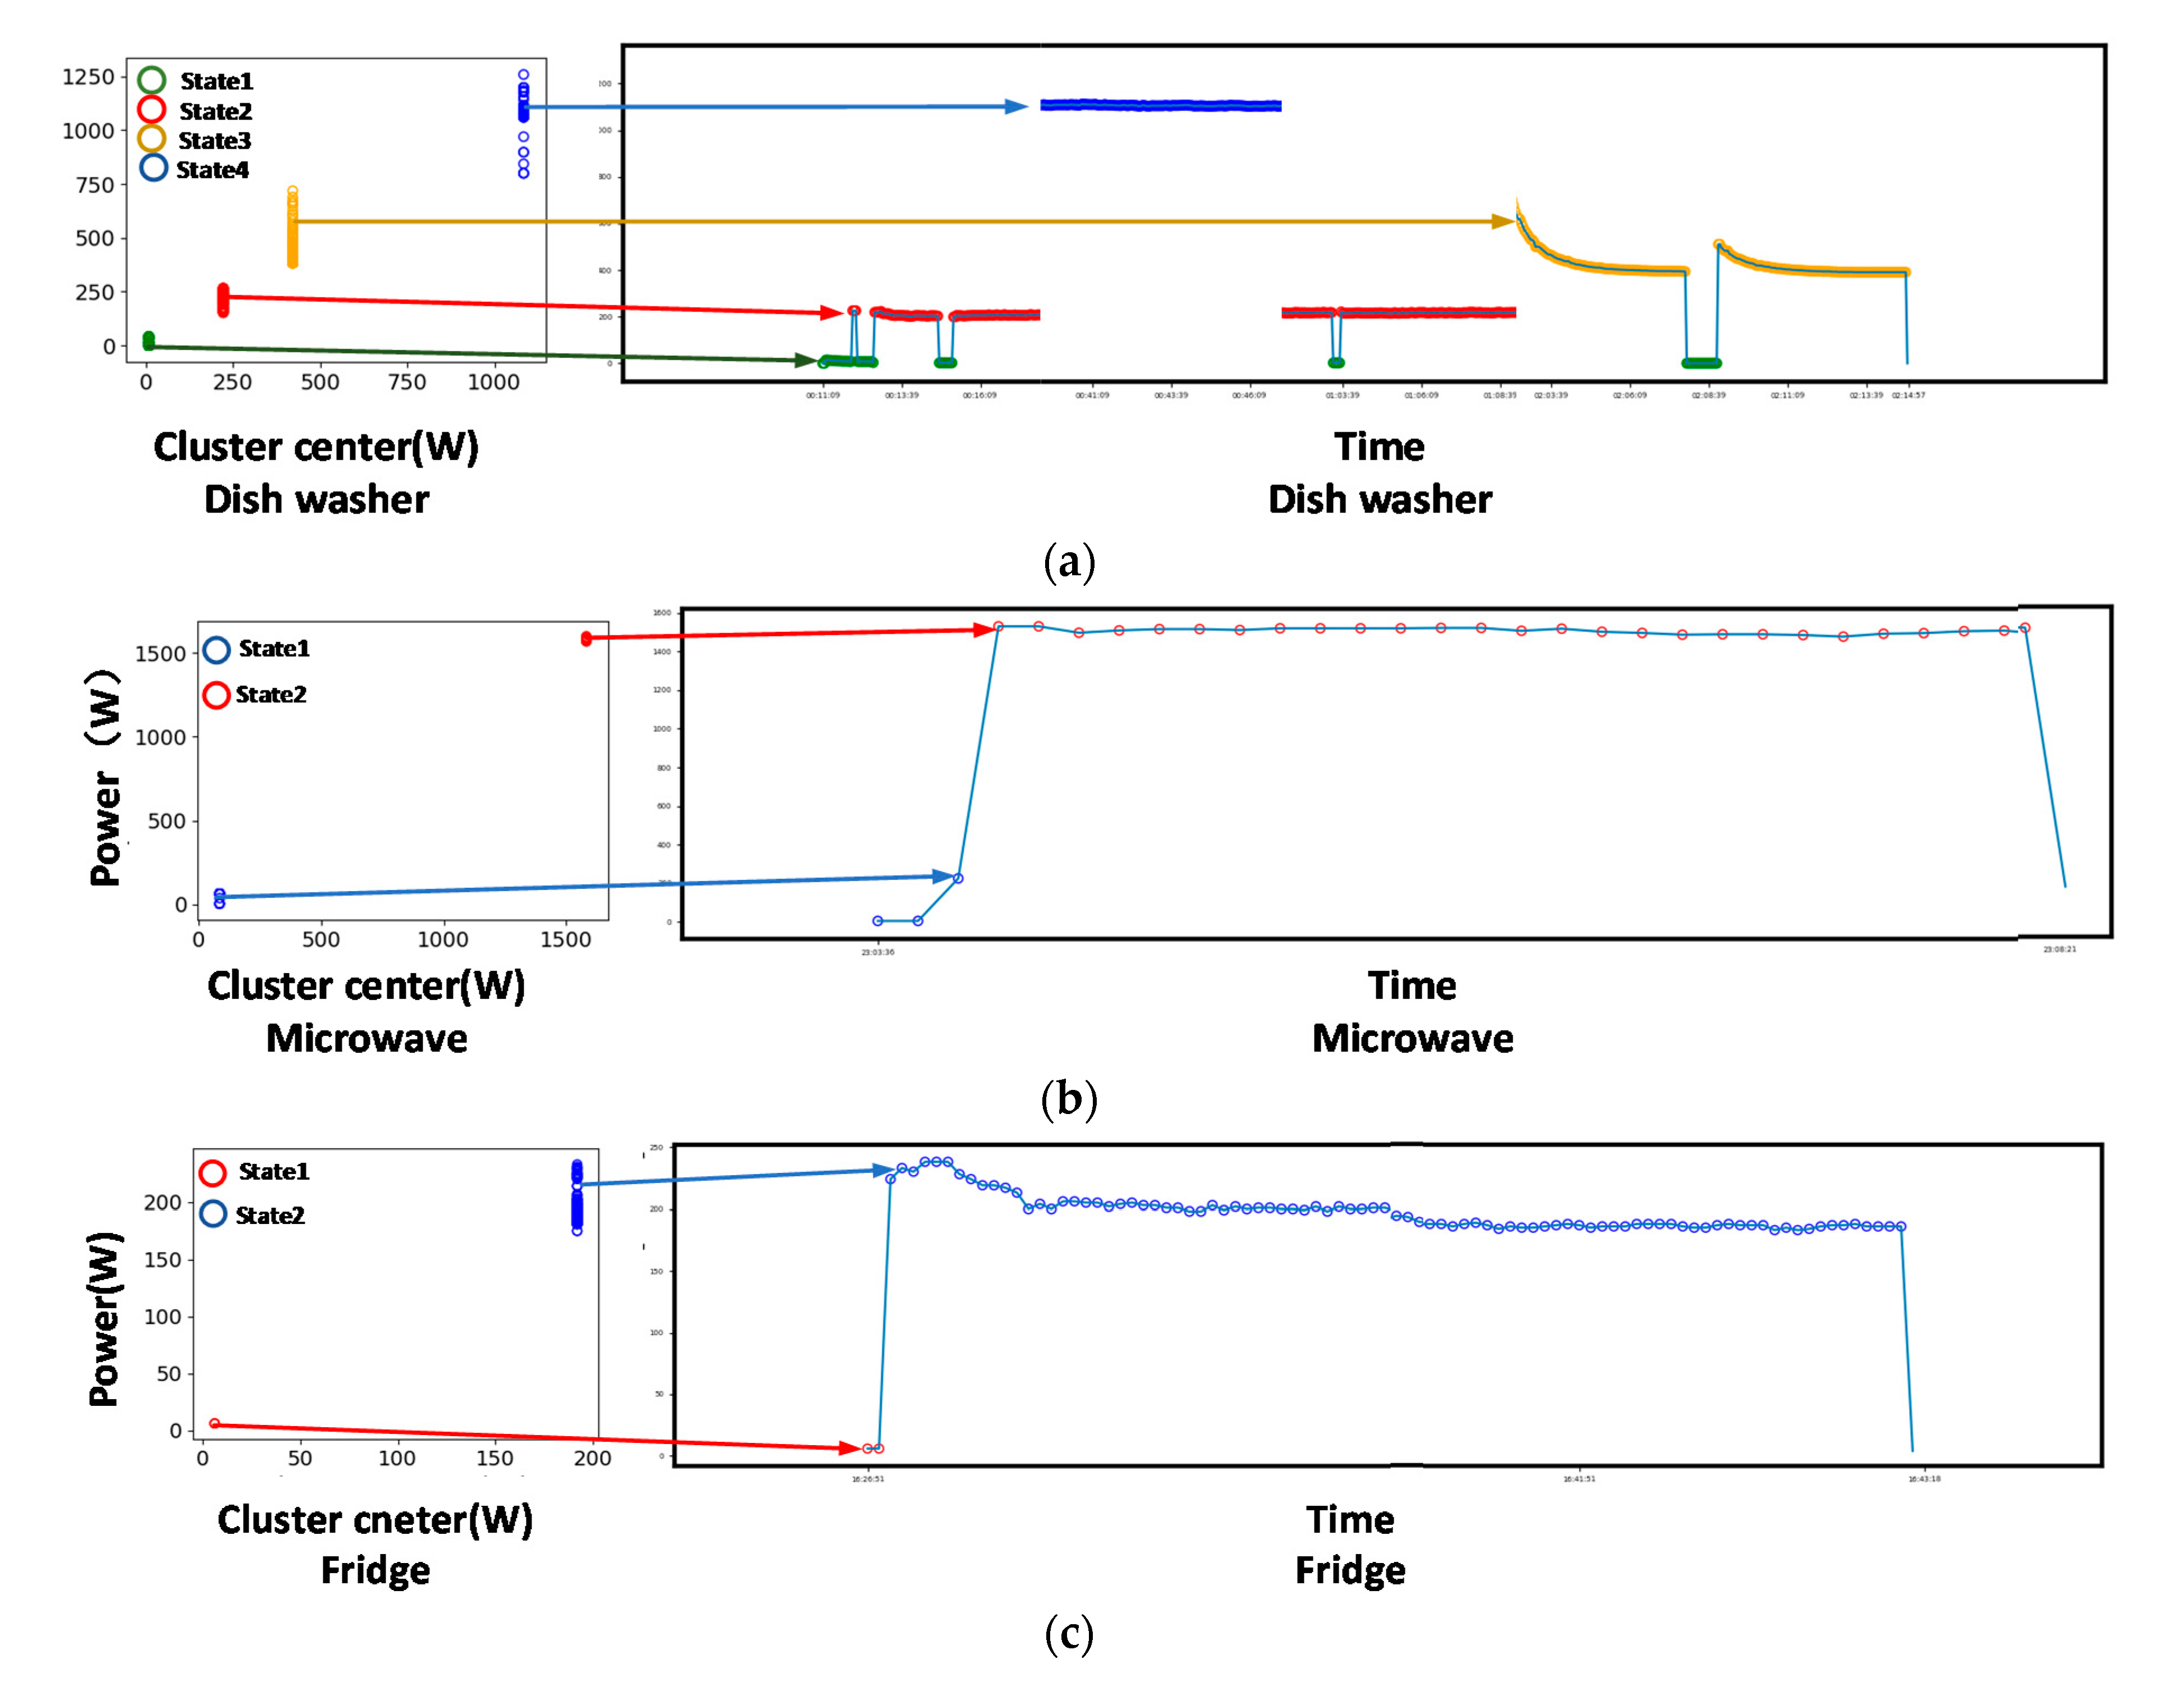
3.2.1. Load Multi-State Detection

Since different states of original data are not labeled in the REDD, the states of each electrical appliance were detected by constructing a clustering model. In this paper, k-means clustering models were constructed for electric appliances in house1 of the REDD. The electrical distribution diagram of house1 in the REDD is shown in Figure 3.
Non-intrusive load monitoring tool kit (NILMtk) [21] was installed on the pycharm platform and used to verify the states of the REDD. Each appliance contained a different cycle (the cycle here refers to the period of time from the opening to the closing of the appliance), and each cycle provided data of the appliance operating in different states. This article mainly records the different appliances in house1 of the REDD. Ten kinds of electrical data, including a bathroom gfi, dish washer, electric heater, fridge, kitchen outlets, light, microwave, oven, stove, and washer/dryer were collected for verification and identification. Different appliances had different states, as shown in Table 2.
Figure 4 shows the state diagrams for two different periods of the dish washer, fridge, and microwave in house1. The horizontal axis represents the clustering center, and the vertical axis represents the power of different states of each appliance. Figure 4 shows the two different periodic M and N state distributions of the different appliances. The k-means clustering algorithm was used for clustering. The Euclidean metric was used to measure the similarity between sample data. The samples are divided into different categories according to the similarities among samples. Since the k-means clustering algorithm is sensitive to isolated points and outliers, better results could be achieved. Obviously, there are four different states in the dishwasher. The microwave had a cycle with three different states and a cycle with two different states. The refrigerator had two different states. The states shown in the figure do not contain the shutdown states of the appliances. Experiments showed that REDD low-frequency data could be used as the basis for multi-state appliance identification.

3.2.2. Load Multi-State Identification

C. C. Yang et al. investigated switch detection using k-means clustering [22]. In the last section, the number of states of the appliance were calculated. In order to accurately identify the running state of an appliance, a corresponding k-means clustering model was established for appliances with a state number greater than 1. First, the value of parameter k was properly selected according to the actual situation, then k points were selected randomly from the dataset as the centroids. For each sample point in the dataset, the Euclidean distance between that point and different centroids was calculated. In such a way, all sample points should be grouped into k sets based on adjacency. If the distance between a newly calculated centroid and the original centroid was less than a set threshold, the clustering model had reached expectations. As a result, the threshold was set to −1. If the desired result was not achieved, the clustering model would continue to iterate. Different states were represented by different colors. Because of the close time points of sample collection, the time on the horizontal axis was set to be displayed at intervals. The status displays are shown in Figure 5 separately.

4. Model Fusion

In this paper, a clustering model and convolutional neural network were combined to realize the load identification of multi-state appliances. First, the data were periodically cut by the NILMtk tool. Although the opening and closing of the appliance could be detected through NILMtk, the switch between different operating modes of the appliance was still difficult to detect. To solve this problem, a processing framework for the multi-state identification of electric appliances was proposed. Firstly, a load type identification model based on a convolutional neural network was constructed. Then, a clustering model based on electrical multi-state switching identification was constructed, and a multi-state appliance list was extracted at the same time. In order to detect switching between different states of each electrical appliance, the state identification model and the electrical identification model were integrated into the electrical multi-state processing framework. When a switch event was detected, the load was then identified by the constructed convolutional neural network, and it was determined whether the current appliance was a multi-state appliance. When the appliance status was greater than or equal to 2, the multi-state recognition model was activated in order to judge the current state of the appliance in real-time. When the switch event occurred again and was recognized as the shutdown of the current multi-state appliance, the current real-time judgment process was ceased. A flow chart of the method is shown in Figure 6.

5. Experiment

5.1. Model Training

In order to detect the effect of the proposed model, the experiments were carried out based on REDD. A one-dimensional convolutional neural network that was fused with residual modules was then trained.
In order to increase the training speed, the convolution kernel was randomly initialized before convolution. In this paper, the dropout rate was set to 0.5. It has been verified that when the dropout rate is set to 0.5, the randomly generated network structure is at its best, which allows the model to better learn the characteristics of the input image or data and thus achieve better results. The batch was set to 64, and the epoch was set to 50. The training model aimed to reduce loss in the model during the training process and therefore improve the training accuracy of the model. In order to reduce loss, a cross-entropy loss function was applied.
The cross-entropy loss function is defined as follows:
Loss   =   - i = 1 n k = 1 m t i k log y i k
where the samples are labelled with their corresponding class t = ( t 1 , t 2 , , t n ) , n is the number of samples and m is the number of categories, y i is the predicted output, and t i is the real output. An Adam optimizer was selected to improve the identification accuracy of appliances. According to experimental verification, the accuracies of the Adam optimizer and the Stochastic gradient descent (SGD) optimizer were 97% and 86%, respectively.

5.2. Experiment Result

5.2.1. Evaluation Criteria

It was important to select performance evaluation indicators to comprehensively evaluate the classification model. Makonin et al. proposed a method for measuring and reporting accuracy, taking accuracy, recall, and F1-scores as the measure for each class [23], which is shown below:
Precision = TP TP + FP
Recall = TP TP + FN
F 1 - score = 2 TP 2 TP + FN + FP = 2 Precision Recall Precision + Recall
where True Positive (TP) predicts a positive class as a positive class, True Negative (TN) predicts a negative class as a negative class, False Positive (FP) predicts a negative class as a positive class, and False Negative (FN) predicts a positive class as a negative class.
It can be seen from Equation (2) that precision reflects the ability of the model to distinguish negative samples. The higher the precision, the stronger the ability of the model to distinguish negative samples. It can be seen from Equation (3) that recall represents the ability of the classification model to identify positive samples. The higher the recall, the stronger the recognition ability of positive samples by the model. The F1-score is a combination of precision and recall. The higher the F1-score, the more robust the classification model is. This paper also considers micro-averages and macro-averages. A micro-average takes all the one-times into account and calculates the accuracy of the category prediction. A macro-average considers each category separately, calculating the accuracy of each category separately and performing an arithmetic average to get the accuracy of the test set.

5.2.2. Appliances Type Identification Result

The experimental results obtained according to the above evaluation criteria are shown in Table 3, which proves the robustness of the proposed model.
A confusion matrix was used to observe the classification performance of the model in each category, and it summarizes the classification effectiveness of the classification model. Figure 7 shows the processing results of the one-dimensional convolutional neural network classification model, which uses data from 10 kinds of appliances, including a bathroom gfi, dish washer, electric heater, fridge, kitchen outlets, light, microwave, oven, stove, and washer/dryer. The x-axis represents the label predicted by the classification model, and the y-axis represents the true label of the category. The confusion matrix shows the probability of the model classifying items correctly or incorrectly. It can be seen from Figure 8 that the probability of model classification error is small.
Figure 8 is the loss and accuracy curves obtained from the experiment. From the figure, we can clearly see that the classification accuracy of the model tended to increase gradually, and gradually moved closer to 1. However, the loss of the classification model tended to gradually decrease, and gradually approached 0.15.

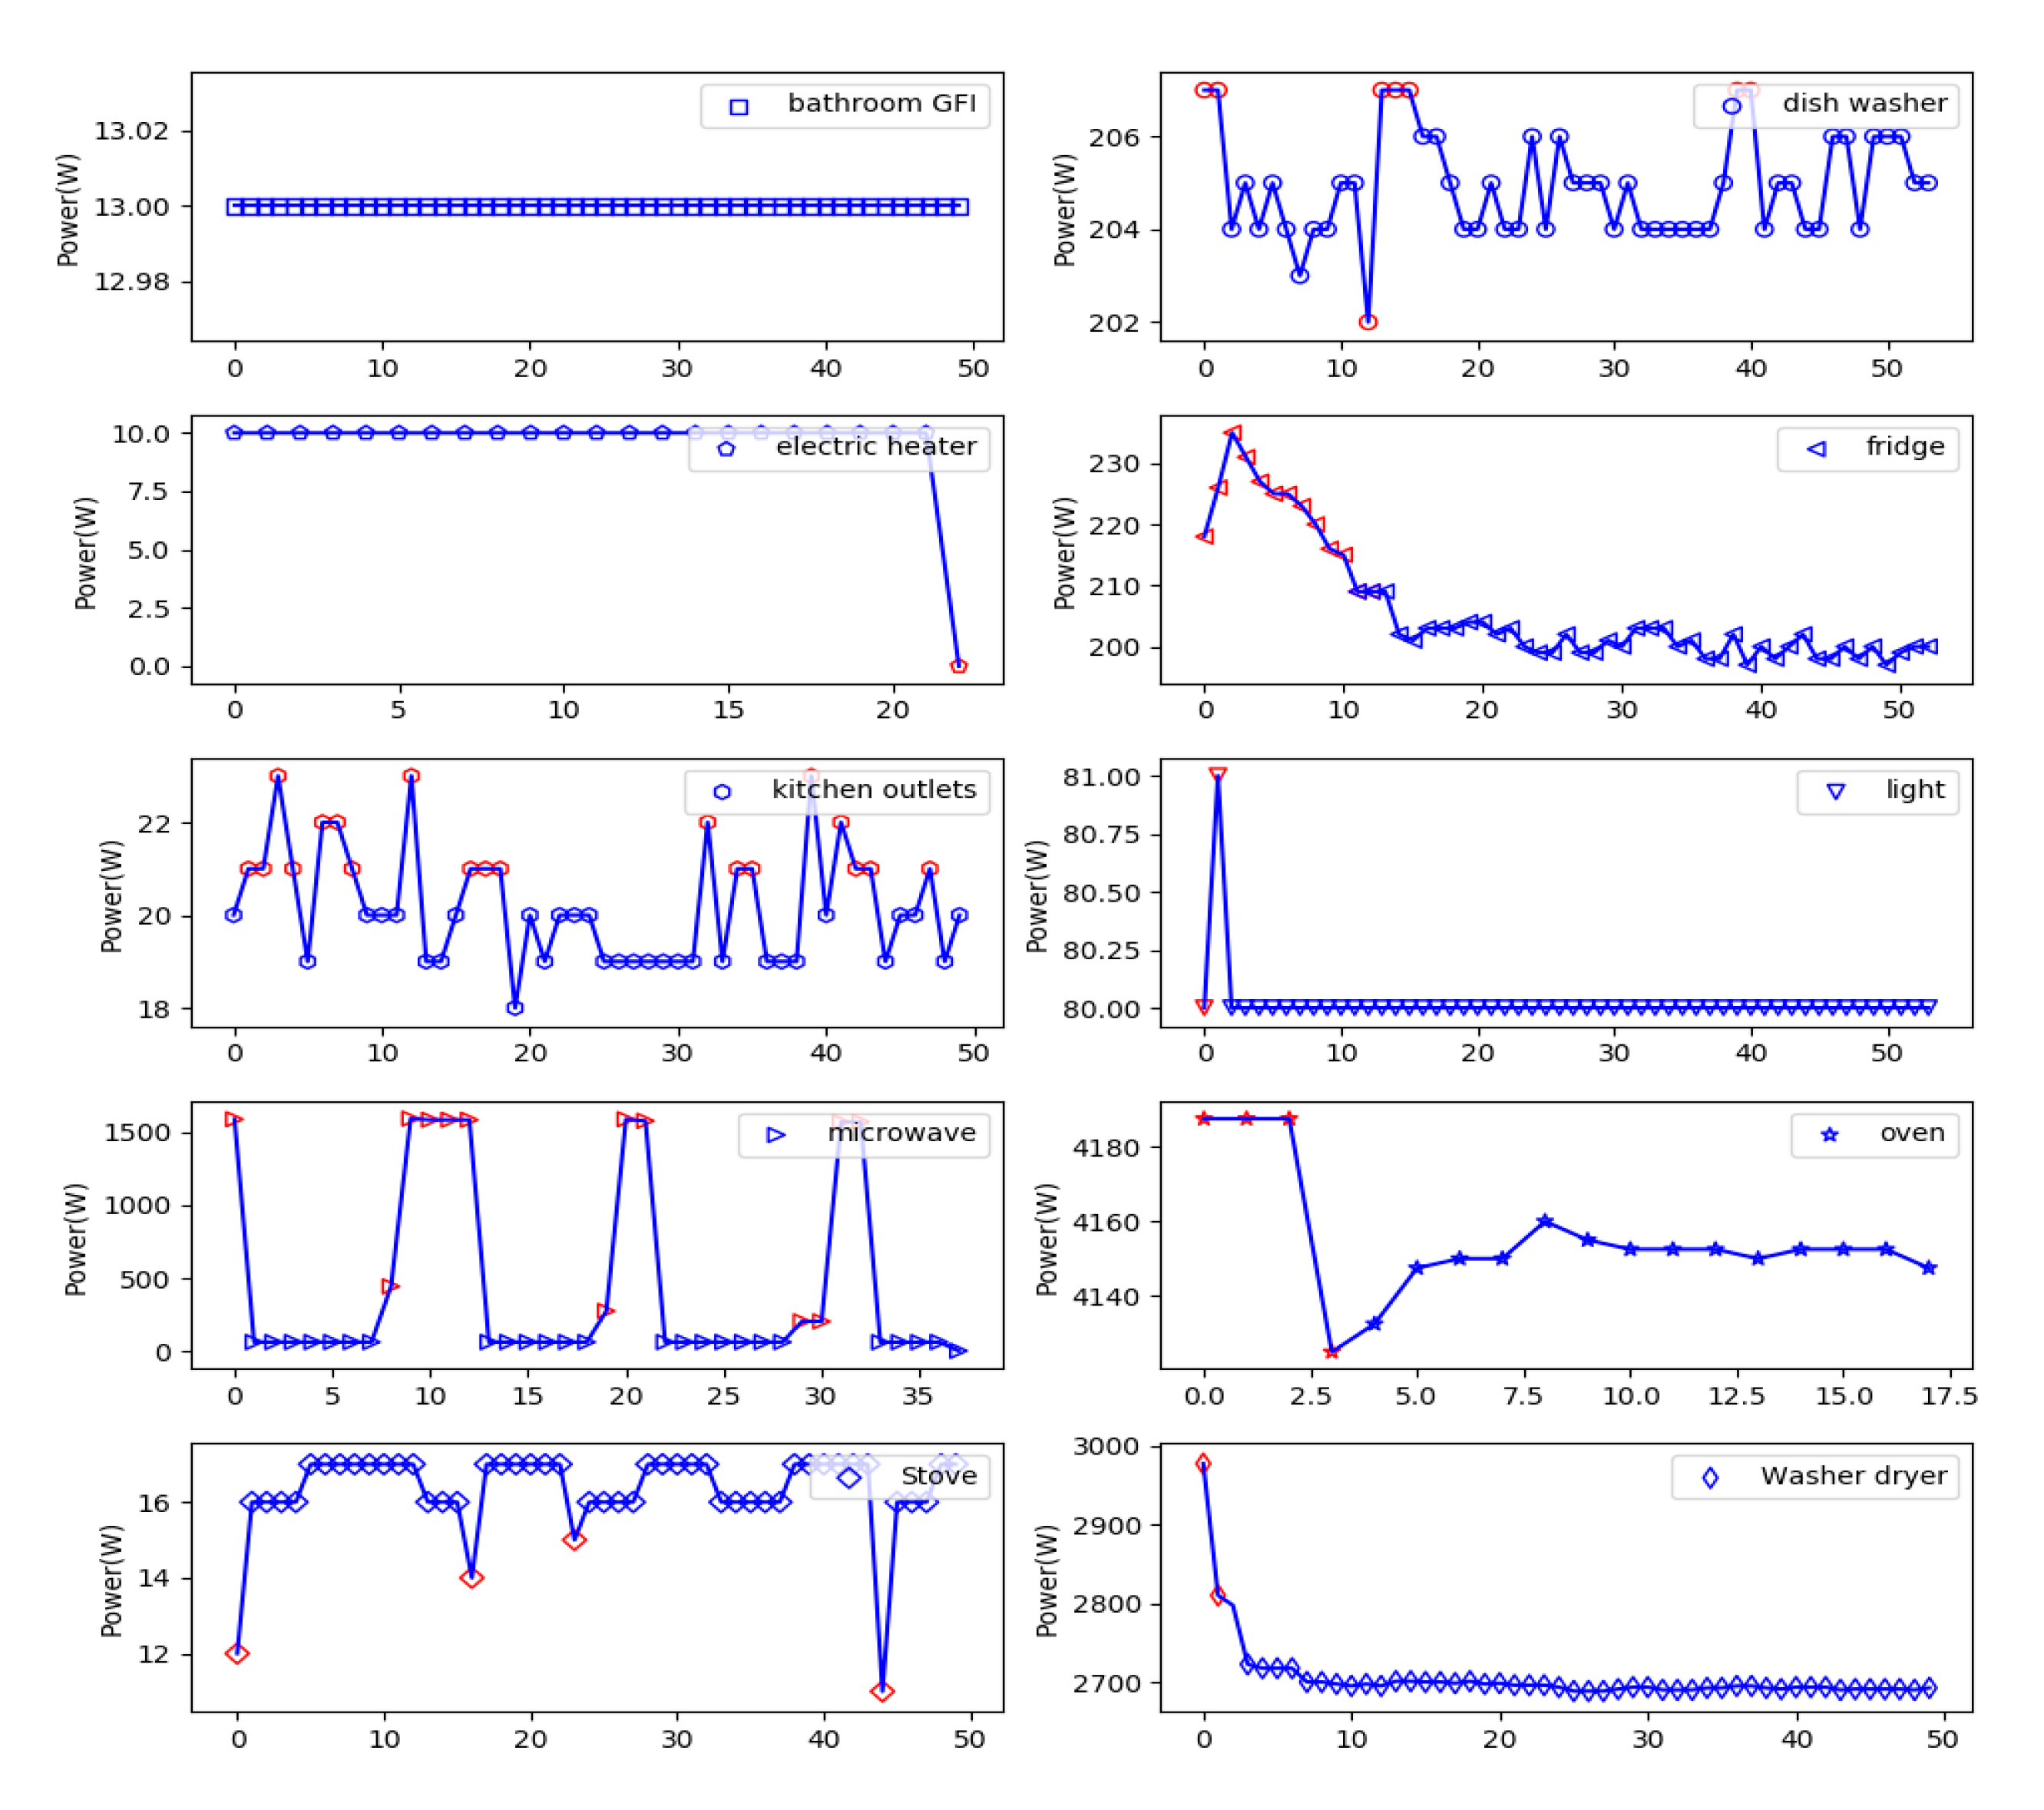
5.2.3. Appliance States Identification Result

The different state distributions of different electrical appliances are summarized in Figure 9 following the methodology set out in Section 3.2.
In order to detect the accuracy of electrical status recognition, manual sampling was applied. A small number of samples were randomly selected for state comparisons. The results are shown in Figure 10 and Table 4. In Figure 10, the red points indicate the states in which the error was recognized, and the blue dots indicates the correct point.
There were 54, 38, 53, 18, 54, 50, 23, 50, 50, and 50 samples for the above electrical appliances, as shown in Table 4. The ratios of blue samples to selected samples shown in Table 4 were obtained using the calculations show in Figure 10.

6. Conclusions

To deal with the increasing complexity of multi-state electric appliances, a novel NILM was proposed to identify both the types and states of electric appliances based on a power time series. In this method, a convolutional neural network model incorporating residual modules was constructed to identify specific types of appliances. The k-means clustering algorithm was then applied to calculate the number of states of the appliance. Finally, in order to identify the states of the appliances, different k-means clustering models were established for different multi-state electric appliances. The experimental results show that the model achieved 97% accuracy when identifying appliance types and 83.9% accuracy when identifying appliance states. Hence, the method proposed in this paper demonstrated a good performance when identifying both types and states of multi-state electric appliances.

Author Contributions

The manuscript was written through contributions of all authors. All authors contributed equally. Conceptualization, Y.Z. and B.Y.; Methodology, Y.Z. and B.Y.; Software, Y.Z.; Validation, Z.D.; Visualization, Y.Z. and Z.D.; Supervision, Y.C.; Writing—original draft, Y.Z.; Writing—review and editing, Y.Z. and B.Y. All authors have read and agreed to the published version of the manuscript.

Funding

This work was financially supported by National Natural Science Foundation of China (61972367) and the International S&T Cooperation Program of China (2015DFR10490). This work was also supported by the Pilot National Laboratory for Marine Science and Technology (Qingdao) Aoshan Science and Technology Innovation Project (2016ASKJ07).

Conflicts of Interest

The authors declare no conflicts of interest.

References

  1. Yoon, S.-H.; Kim, S.-Y.; Park, G.-H.; Kim, Y.-K.; Cho, C.-H.; Park, B.-H. Multiple power-based building energy management system for efficient management of building energy. Sustain. Cities Soc. 2018, 42, 462–470. [Google Scholar] [CrossRef]
  2. Hart, G.W. Nonintrusive appliance load monitoring. Proc. IEEE 1992, 80, 1870–1891. [Google Scholar] [CrossRef]
  3. Houidi, S.; Auger, F.; Sethom, H.B.A.; Miègeville, L.; Fourer, D.; Jiang, X. Statistical Assessment of Abrupt Change Detectors for Non Intrusive Load Monitoring. In Proceedings of the 2018 IEEE International Conference on Industrial Technology (ICIT), Lyon, France, 20–22 February 2018. [Google Scholar]
  4. Niu, L.; Jia, H. Transient event detection algorithm for non-intrusive load monitoring. Autom. Electr. Power Syst. 2011, 35, 30–35. [Google Scholar]
  5. Afzalan, M.; Jazizadeh, F.; Wang, J. Self-configuring event detection in electricity monitoring for human-building interaction. Energy Build. 2019, 187, 95–109. [Google Scholar] [CrossRef]
  6. Mauch, L.; Yang, B. A new approach for supervised power disaggregation by using a deep recurrent LSTM network. IEEE Global Conf. Signal Inf. Process. 2015, 63–67. [Google Scholar] [CrossRef]
  7. Schirmer, P.A.; Mporas, I. Statistical and Electrical Features Evaluation for Electrical Appliances Energy Disaggregation. Sustainability 2019, 11, 3222. [Google Scholar] [CrossRef] [Green Version]
  8. Machlev, R.; Belikov, J.; Beck, Y.; Levron, Y. MO-NILM: A multi-objective evolutionary algorithm for NILM classification. Energy Build. 2019, 199, 134–144. [Google Scholar] [CrossRef]
  9. de Baets, L.; Ruyssinck, J.; Develder, C.; Dhaene, T.; Deschrijver, D. Appliance classification using VI trajectories and convolutional neural networks. Energy Build. 2018, 158, 32–36. [Google Scholar] [CrossRef] [Green Version]
  10. Hamdi, M.; Messaoud, H.; Bouguila, N. A new approach of electrical appliance identification in residential buildings. Electr. Power Syst. Res. 2020, 178, 106037. [Google Scholar] [CrossRef]
  11. Fagiani, M.; Bonfigli, R.; Principi, E.; Squartini, S.; Mandolini, L. A Non-Intrusive Load Monitoring Algorithm Based on Non-Uniform Sampling of Power Data and Deep Neural Networks. Energies 2019, 12, 1371. [Google Scholar] [CrossRef] [Green Version]
  12. Gagliano, S.; Cairone, F.; Amenta, A.; Bucolo, M. A Real Time Feed Forward Control of Slug Flow in Microchannels. Energies 2019, 12, 2556. [Google Scholar] [CrossRef] [Green Version]
  13. Liu, Y.; Wang, X.; Zhao, L.; Liu, Y. Admittance-based load signature construction for non-intrusive appliance load monitoring. Energy Build. 2018, 171, 209–219. [Google Scholar] [CrossRef]
  14. Baets, L.D.; Dhaene, T.; Deschrijver, D.; Develder, C.; Berges, M. VI-Based Appliance Classification Using Aggregated Power Consumption Data. In Proceedings of the 2018 IEEE International Conference on Smart Computing (SMARTCOMP), Taormina, Italy, 18–20 June 2018; pp. 179–186. [Google Scholar] [CrossRef] [Green Version]
  15. Liu, H.; Wu, H.; Yu, C. A hybrid model for appliance classification based on time series features. Energy Build. 2019, 196, 112–123. [Google Scholar] [CrossRef]
  16. Ghosh, S.; Chatterjee, A.; Chatterjee, D. Improved non-intrusive identification technique of electrical appliances for a smart residential system. IET Gener. Transm. Distrib. 2019, 13, 695–702. [Google Scholar] [CrossRef]
  17. Dinesh, C.; Welikala, S.; Liyanage, Y.; Ekanayake, M.P.B.; Godaliyadda, R.I.; Ekanayake, J. Non-intrusive load monitoring under residential solar power influx. Appl. Energy 2017, 205, 1068–1080. [Google Scholar] [CrossRef]
  18. Choksi, K.A.; Jain, S.K. Pattern matrix and decision tree based technique for non-intrusive monitoring of home appliances. In Proceedings of the 2017 7th International Conference on Power Systems (ICPS), Pune, India, 21–23 December 2017; pp. 824–829. [Google Scholar] [CrossRef]
  19. Kolter, J.Z.; Johnson, M.J. REDD: A Public Data Set for Energy Disaggregation Research. In Proceedings of the SustKDD workshop on Data Mining Applications in Sustainability, San Diego, CA, USA, 21 August 2011; p. 6. [Google Scholar]
  20. Lecun, Y.; Bottou, L.; Bengio, Y.; Haffner, P. Gradient-based learning applied to document recognition. Proc. IEEE 1998, 86, 2278–2324. [Google Scholar] [CrossRef] [Green Version]
  21. Batra, N.; Kelly, J.; Parson, O.; Dutta, H.; Knottenbelt, W.; Rogers, A.; Singh, A.; Srivastava, M. NILMTK: An Open Source Toolkit for Non-intrusive Load Monitoring. In Proceedings of the 5th international conference on Future energy systems - e-Energy, Melbourne, Australia, 14 June 2014; pp. 265–276. [Google Scholar] [CrossRef] [Green Version]
  22. Yang, C.C.; Soh, C.S.; Yap, V.V. A systematic approach to ON-OFF event detection and clustering analysis of non-intrusive appliance load monitoring. Front. Energy 2015, 9, 231–237. [Google Scholar] [CrossRef]
  23. Makonin, S.; Popowich, F. Nonintrusive load monitoring (NILM) performance evaluation: A unified approach for accuracy reporting. Energy Effic. 2015, 8, 809–814. [Google Scholar] [CrossRef]
Figure 1. One-dimensional convolutional neural network input graph.
Energies 13 00792 g001
Figure 2. One-dimensional convolutional neural network model structure.
Energies 13 00792 g002
Figure 3. House1 electrical distribution map.
Energies 13 00792 g003
Figure 4. State diagrams of different appliances.
Energies 13 00792 g004
Figure 5. (a) Dishwasher status switching diagram. (b) Microwave status switching diagram. (c) Refrigerator status switching diagram.
Energies 13 00792 g005
Figure 6. Flow chart of the method.
Energies 13 00792 g006
Figure 7. Confusion matrix.
Energies 13 00792 g007
Figure 8. Loss and accuracy curves.
Energies 13 00792 g008
Figure 9. State distribution diagram.
Energies 13 00792 g009
Figure 10. Identification result graphs.
Energies 13 00792 g010
Table 1. A detailed overview of the abbreviations.
LogogramFull Name
NILMNon-intrusive load monitoring
PLAIDPlug Load Appliance Identification Dataset
REDDReference Energy Disaggregation Data Set
NILMtkNon-intrusive load monitoring tool kit
SGDStochastic gradient descent
TPTrue Positive
TNTrue Negative
FPFalse Positive
FNFalse Negative
Table 2. Table of different electrical states.
ApplianceStates
Bathroom gfi2
Dish washer4
Electric heater1
Fridge2
Kitchen outlets3
Light4
Microwave3
Oven4
Stove4
Washer/dryer2
Table 3. Experimental results table.
ApplianceRecallPrecisionF1-Score
Bathroom gfi0.960.990.97
Dish washer0.790.680.73
Electric heater0.401.000.57
Fridge0.991.000.99
Kitchen outlets1.001.001.00
Light0.970.990.98
Microwave1.001.001.00
Oven1.000.600.75
Stove1.000.110.20
Washer/dryer0.960.930.94
Table 4. Status recognition accuracy.
ApplianceAccuracy
Bathroom gfi100%
Dish washer85%
Electric heater92%
Fridge79%
Kitchen outlets62%
Light91%
Microwave65%
Oven77%
Stove92%
Washer dryer96%

