Limitations and Characterization of Energy Storage Devices for Harvesting Applications


Abstract
1. Introduction
State of Art with Respect to the Self-Discharge Phenomenon in SCs and Lithium Batteries
2. Materials and Methods
- Nominal capacity: 380 mAh;
- Standard charge: constant current 0.5 C (i.e., it is fully charged with a constant current of 190 mA in 2 h);
- Nominal voltage: 3.7 V (maximum achievable voltage: 4.2 V);
- Maximum constant charging current: 1 C (380 mA);
- Standard discharge: 0.2 C (it supplies the load with a current of 76 mA for 5 h);
- Maximum continuous discharging current: 1.5 C (C-rate).
3. Results
3.1. Characterization of SC Self-Discharge Phenomenon
3.2. Characterization of LiPo Batteries’ Self-Discharge Phenomenon
4. Discussion
5. Conclusions
Author Contributions
Funding
Conflicts of Interest
References
- Weddell, A.S.; Magno, M.; Merrett, G.V.; Brunelli, D.; Al-Hashimi, B.M.; Benini, L. A survey of multi-source energy harvesting systems. In Proceedings of the 2013 Design, Automation Test in Europe Conference Exhibition (DATE), Grenoble, France, 18–22 March 2013; IEEE: Piscataway, NJ, USA; pp. 905–908. [Google Scholar]
- Visconti, P.; Primiceri, P.; Orlando, C. Solar Powered Wireless Monitoring System of Environmental Conditions for Early Flood Prediction or Optimized Irrigation in Agriculture. J. Eng. Appl. Sci. 2016, 11, 4623–4632. [Google Scholar]
- Visconti, P.; Ferri, R.; Pucciarelli, M.; Venere, E. Development and Characterization of a solar-based energy harvesting and power management system for a WSN node applied to optimized goods transport and storage. Int. J. Smart Sens. Intell. Syst. 2016, 9, 1637–1667. [Google Scholar]
- Visconti, P.; Primiceri, P.; Ferri, R.; Pucciarelli, M.; Venere, E. An Overview on State-of-Art Energy Harvesting Techniques and Choice Criteria: A WSN Node for Goods Transport and Storage Powered by a Smart Solar- Based EH System. Int. J. Renew. Energy Res. 2017, 7, 1281–1295. [Google Scholar]
- Afif, A.; Rahman, S.M.; Tasfiah Azad, A.; Zaini, J.; Islan, M.A.; Azad, A.K. Advanced materials and technologies for hybrid supercapacitors for energy storage—A review. J. Energy Storage 2019, 25, 1–24. [Google Scholar] [CrossRef]
- Hajiaghasi, S.; Salemnia, A.; Hamzeh, M. Hybrid energy storage system for microgrids applications: A review. J. Energy Storage 2019, 21, 543–570. [Google Scholar] [CrossRef]
- Habibzadeh, M.; Hassanalieragh, M.; Ishikawa, A.; Soyata, T.; Sharma, G. Hybrid Solar-Wind Energy Harvesting for Embedded Applications: Supercapacitor-Based System Architectures and Design Tradeoffs. IEEE Circ. Syst. Magaz. 2017, 17, 29–63. [Google Scholar] [CrossRef]
- Zhu, M.; Hassanalieragh, M.; Chen, Z.; Fahad, A.; Shen, K.; Soyata, T. Energy-Aware Sensing in Data-Intensive Field Systems Using Supercapacitor Energy Buffer. IEEE Sens. J. 2018, 18, 3372–3383. [Google Scholar] [CrossRef]
- Vračar, L.; Prijić, A.; Nešić, D.; Dević, S.; Prijić, Z. Photovoltaic Energy Harvesting Wireless Sensor Node for Telemetry Applications Optimized for Low Illumination Levels. Electronics 2016, 5, 26. [Google Scholar] [CrossRef]
- Toh, W.Y.; Tan, Y.K.; Koh, W.S.; Siek, L. Autonomous Wearable Sensor Nodes with Flexible Energy Harvesting. IEEE Sens. J. 2014, 14, 2299–2306. [Google Scholar] [CrossRef]
- Chen, X.; Villa, N.S.; Zhuang, Y.; Chen, L.; Wang, T.; Li, Z.; Kong, T. Stretchable Supercapacitors as Emergent Energy Storage Units for Health Monitoring Bioelectronics. Adv. Energy Mater. 2019, 1902769, 1–27. [Google Scholar] [CrossRef]
- Kamal, T.; Karabacak, M.; Hassan, S.Z.; Fernández-Ramírez, L.M.; Riaz, M.H.; Riaz, M.T.; Khan, M.A.; Khan, L. Energy Management and Switching Control of PHEV Charging Stations in a Hybrid Smart Micro-Grid System. Electronics 2018, 7, 156. [Google Scholar] [CrossRef]
- Aravindan, V.; Gnanaraj, J.; Lee, Y.-S.; Madhavi, S. Insertion-Type Electrodes for Nonaqueous Li-Ion Capacitors. Chem. Rev. 2014, 114, 11619–11635. [Google Scholar] [CrossRef]
- Technical Data-Sheet, Panasonic Industrial Company Electric Double Layer Capacitors (Gold Capacitors)-Technical Guide. 2005. Available online: https://industrial.panasonic.com/content/data/CP/PDF/Electric_Double/EDLC_TechnicalGuide_e.pdf (accessed on 25 December 2019).
- Jiya, I.N.; Gurusinghe, N.; Gouws, R. Electrical Circuit Modelling of Double Layer Capacitors for Power Electronics and Energy Storage Applications: A Review. Electronics 2018, 7, 268. [Google Scholar] [CrossRef]
- Helseth, L.E. Modelling supercapacitors using a dynamic equivalent circuit with a distribution of relaxation times. J. Energy Storage 2019, 25, 1–7. [Google Scholar] [CrossRef]
- Yang, H.; Zhang, Y. Self-discharge analysis and characterization of supercapacitors for environmentally powered wireless sensor network applications. J. Power Sour. 2011, 196, 8866–8873. [Google Scholar] [CrossRef]
- Sedlakova, V.; Sikula, J.; Majzner, J.; Sedlak, P.; Kuparowitz, T.; Buergler, B.; Vasina, P. Supercapacitor equivalent electrical circuit model based on charges redistribution by diffusion. J. Power Sour. 2015, 286, 58–65. [Google Scholar] [CrossRef]
- Buller, S.; Karden, E.; Kok, D.; De Doncker, R.W. Modeling the dynamic behavior of supercapacitors using impedance spectroscopy. IEEE Trans. Ind. Appl. 2002, 38, 1622–1626. [Google Scholar] [CrossRef]
- Ricketts, B.W.; Ton-That, C. Self-discharge of carbon-based supercapacitors with organic electrolytes. J. Power Sour. 2000, 89, 64–69. [Google Scholar] [CrossRef]
- Diab, Y.; Venet, P.; Gualous, H.; Rojat, G. Self-Discharge Characterization and Modeling of Electrochemical Capacitor Used for Power Electronics Applications. IEEE Trans. Power Electron. 2009, 24, 510–517. [Google Scholar] [CrossRef]
- Kowal, J.; Avaroglu, E.; Chamekh, F.; Šenfelds, A.; Thien, T.; Wijaya, D.; Sauer, D.U. Detailed analysis of the self-discharge of supercapacitors. J. Power Sour. 2011, 196, 573–579. [Google Scholar] [CrossRef]
- Miniguano, H.; Barrado, A.; Fernández, C.; Zumel, P.; Lázaro, A. A General Parameter Identification Procedure Used for the Comparative Study of Supercapacitors Models. Energies 2019, 12, 1776. [Google Scholar] [CrossRef]
- Sibi Krishnan, K.; Pathiyil, P.; Sunitha, R. Generic Battery model covering self-discharge and internal resistance variation. In Proceedings of the 2016 IEEE 6th International Conference on Power Systems (ICPS), New Delhi, India, 4–6 March 2016; pp. 1–5. [Google Scholar]
- La Rosa, R.; Livreri, P.; Trigona, C.; Di Donato, L.; Sorbello, G. Strategies and Techniques for Powering Wireless Sensor Nodes through Energy Harvesting and Wireless Power Transfer. Sensors 2019, 19, 660. [Google Scholar] [CrossRef] [PubMed]
- Houbbadi, A.; Trigui, R.; Pelissier, S.; Redondo-Iglesias, E.; Bouton, T. Optimal Scheduling to Manage an Electric Bus Fleet Overnight Charging. Energies 2019, 12, 2727. [Google Scholar] [CrossRef]
- Dąbrowska, A.; Greszta, A. Analysis of the Possibility of Using Energy Harvesters to Power Wearable Electronics in Clothing. Adv. Mater. Sci. Eng. 2019, 2019, 1–13. [Google Scholar] [CrossRef]
- Korthauer, R. (Ed.) Lithium-Ion Batteries: Basics and Applications; Springer: Berlin/Heidelberg, Germany, 2018; ISBN 978-3-662-53069-6. [Google Scholar]
- Nitta, N.; Wu, F.; Lee, J.T.; Yushin, G. Li-ion battery materials: Present and future. Mater. Today 2015, 18, 252–264. [Google Scholar] [CrossRef]
- Hannan, M.A.; Hoque, M.M.; Hussain, A.; Yusof, Y.; Ker, P.J. State-of-the-Art and Energy Management System of Lithium-Ion Batteries in Electric Vehicle Applications: Issues and Recommendations. IEEE Access 2018, 6, 19362–19378. [Google Scholar] [CrossRef]
- Zhu, F.; Liu, G.; Tao, C.; Wang, K.; Jiang, K. Battery management system for Li-ion battery. J. Eng. 2017, 2017, 1437–1440. [Google Scholar] [CrossRef]
- Madani, S.S.; Swierczynski, M.J.; Kær, S.K. A review of thermal management and safety for lithium ion batteries. In Proceedings of the 2017 Twelfth International Conference on Ecological Vehicles and Renewable Energies (EVER), Monte Carlo, Monaco, 11–13 April 2017; pp. 1–20. [Google Scholar]
- Riviere, E.; Sari, A.; Venet, P.; Meniere, F.; Bultel, Y. Innovative Incremental Capacity Analysis Implementation for C/LiFePO4 Cell State-of-Health Estimation in Electrical Vehicles. Batteries 2019, 5, 37. [Google Scholar] [CrossRef]
- Liu, K.; Li, K.; Yang, Z.; Zhang, C.; Deng, J. An advanced Lithium-ion battery optimal charging strategy based on a coupled thermoelectric model. Electrochim. Acta 2017, 225, 330–344. [Google Scholar] [CrossRef]
- Omariba, Z.B.; Zhang, L.; Sun, D. Review on Health Management System for Lithium-Ion Batteries of Electric Vehicles. Electronics 2018, 7, 72. [Google Scholar] [CrossRef]
- Dai, Q.; Kelly, J.C.; Gaines, L.; Wang, M. Life Cycle Analysis of Lithium-Ion Batteries for Automotive Applications. Batteries 2019, 5, 48. [Google Scholar] [CrossRef]
- Chen, X.; Vereecken, P.M. Solid and Solid-Like Composite Electrolyte for Lithium Ion Batteries: Engineering the Ion Conductivity at Interfaces. Adv. Mater. Interf. 2019, 6, 1–31. [Google Scholar] [CrossRef]
- Julien, C.; Nazri, G.-A. Solid State Batteries: Materials Design and Optimization; Springer US Science & Business Media: New York, NY, USA, 2013; ISBN 978-1-4615-2704-6. [Google Scholar]
- Palacín, M.R.; de Guibert, A. Why do batteries fail? Science 2016, 351, 1–7. [Google Scholar] [CrossRef] [PubMed]
- Kong, L.; Li, C.; Jiang, J.; Pecht, M.G. Li-Ion Battery Fire Hazards and Safety Strategies. Energies 2018, 11, 2191. [Google Scholar] [CrossRef]
- Seong, W.M.; Park, K.-Y.; Lee, M.H.; Moon, S.; Oh, K.; Park, H.; Lee, S.; Kang, K. Abnormal self-discharge in lithium-ion batteries. Energy Environ. Sci. 2018, 11, 970–978. [Google Scholar] [CrossRef]
- Redondo-Iglesias, E.; Venet, P.; Pelissier, S. Global Model for Self-Discharge and Capacity Fade in Lithium-Ion Batteries Based on the Generalized Eyring Relationship. IEEE Trans. Vehic. Technol. 2018, 67, 104–113. [Google Scholar] [CrossRef]
- Saha, P.; Khanra, M. Equivalent circuit model of supercapacitor for self-discharge analysis—A comparative study. In Proceedings of the 2016 International Conference on Signal Processing, Communication, Power and Embedded System (SCOPES), Paralakhemundi, India, 3–5 October 2016; pp. 1381–1386. [Google Scholar]
- Kularatna, N. Rechargeable batteries and their management. IEEE Instrument. Measure. Magaz. 2011, 14, 20–33. [Google Scholar] [CrossRef]
- Berrueta, A.; Ursúa, A.; Martín, I.S.; Eftekhari, A.; Sanchis, P. Supercapacitors: Electrical Characteristics, Modeling, Applications, and Future Trends. IEEE Access 2019, 7, 50869–50896. [Google Scholar] [CrossRef]
- Kurzweil, P.; Shamonin, M. State-of-Charge Monitoring by Impedance Spectroscopy during Long-Term Self-Discharge of Supercapacitors and Lithium-Ion Batteries. Batteries 2018, 4, 35. [Google Scholar] [CrossRef]


| State of Charge | Charge Loss at T = 0 °C for the First Month | Charge Loss at T = 25 °C for the First Month | Charge Loss at T = 60 °C for the First Month |
|---|---|---|---|
| Full charge | 6% | 20% | 35% |
| 40–60% charge | 2% | 4% | 15% |
| V1,start (V) | V1,final (V) | V2,start (V) | V2,final (V) | V3,start (V) | V3,final (V) | [mV/h] | [mV/h] | [mV/h] | RSD1 [kΩ)] | RSD2 [kΩ] | RSD3 [kΩ] | |
|---|---|---|---|---|---|---|---|---|---|---|---|---|
| SC_A | 4.46 | 3.64 | 3.64 | 2.87 | 2.87 | 1.51 | −164.0 | −85.6 | −14.3 | 88.6 | 181.8 | 571.8 |
| SC_B1 | 4.73 | 4.29 | 4.29 | 3.90 | 3.90 | 3.15 | −88.0 | −43.3 | −7.9 | 46.1 | 113.3 | 429.8 |
| SC_B2 | 4.71 | 4.14 | 4.14 | 3.74 | 3.74 | 3.01 | −114.0 | −44.4 | −7.7 | 34.9 | 106.3 | 422.7 |
| SC_C | 4.78 | 4.49 | 4.49 | 4.31 | 4.31 | 3.74 | −58.0 | −20.0 | −6.0 | 143.8 | 527.9 | 1294.3 |
| V1,start (V) | V1,final (V) | V2,start (V) | V2,final (V) | V3,start (V) | V3,final (V) | [mV/h] | [mV/h] | [mV/h] | RSD1 [kΩ)] | RSD2 [kΩ] | RSD3 [kΩ] | |
|---|---|---|---|---|---|---|---|---|---|---|---|---|
| SC_A | 4.55 | 4.05 | 4.05 | 3.37 | 3.37 | 2.43 | −100.0 | −56.7 | −9.2 | 154.6 | 235.0 | 1122.9 |
| SC_B1 | 4.90 | 4.67 | 4.67 | 4.40 | 4.40 | 3.87 | −46.0 | −22.5 | −5.2 | 93.6 | 181.3 | 715.2 |
| SC_B2 | 4.82 | 4.45 | 4.45 | 4.09 | 4.09 | 3.40 | −74.0 | −30.0 | −6.8 | 56.3 | 128.0 | 496.8 |
| SC_C | 4.92 | 4.82 | 4.82 | 4.69 | 4.69 | 4.33 | −20.0 | −10.8 | −3.5 | 438.3 | 790.0 | 2298.9 |
[mV/h] | RSD1 [kΩ)] | [mV/h] | RSD2 [kΩ] | [mV/h] | RSD3 [kΩ)] | ||
|---|---|---|---|---|---|---|---|
| 5 V charged and then one hour under charge | SC_A | −164.0 | 88.6 | −85.6 | 181.8 | −14.3 | 571.8 |
| SC_B1 | −88.0 | 46.1 | −43.3 | 113.3 | −7.9 | 429.8 | |
| SC_B2 | −114.0 | 34.9 | −44.4 | 106.3 | −7.7 | 422.7 | |
| SC_C | −58.0 | 143.8 | −20.0 | 527.9 | −6.0 | 1294.3 | |
| 5 V charged and then five hours under charge | SC_A | −100.0 | 154.6 | −56.7 | 235.0 | −9.2 | 1122.9 |
| SC_B1 | −46.0 | 93.6 | −22.5 | 181.3 | −5.2 | 715.2 | |
| SC_B2 | −74.0 | 56.3 | −30.0 | 128.0 | −6.8 | 496.8 | |
| SC_C | −20.0 | 438.3 | −10.8 | 790.0 | −3.5 | 2298.9 | |
| Percentage difference | SC_A | −39.0% | 74.5% | −33.8% | 29.3% | −35.7% | 96.4% |
| SC_B1 | −47.7% | 103.0% | −48.0% | 60.0% | −34.2% | 66.4% | |
| SC_B2 | −35.1% | 61.3% | −32.4% | 20.4% | −11.7% | 17.5% | |
| SC_C | −65.5% | 204.8% | −46.0% | 49.65% | −41.6% | 77.61% |
| SC | R2 | RMSE | ||||
|---|---|---|---|---|---|---|
| SC_A | 1.94 | 7.78 | 2.84 | 181.59 | 0.996 | 0.083 |
| SC_B1 | 1.08 | 8.25 | 3.82 | 568.18 | 0.996 | 0.044 |
| SC_B2 | 1.23 | 7.15 | 3.67 | 545.25 | 0.996 | 0.044 |
| SC_C | 0.58 | 5.92 | 4.32 | 759.87 | 0.993 | 0.036 |
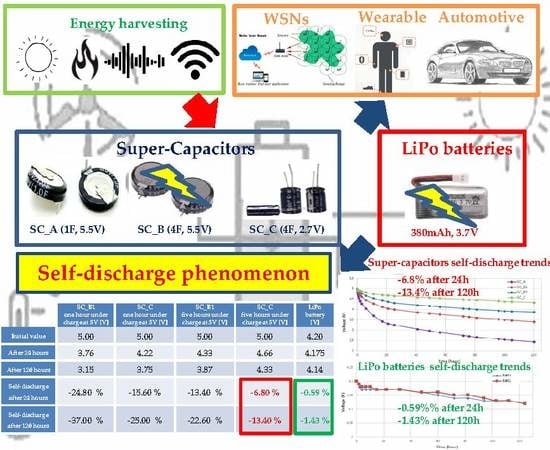
| SC_B1 One Hour Under Charge at 5 V [V] | SC_C One Hour Under Charge at 5 V [V] | SC_B1 Five Hours Under Charge at 5 V [V] | SC_C Five Hours Under Charge at 5 V [V] | LiPo Battery LW 752035 [V] | |
|---|---|---|---|---|---|
| Initial value | 5.00 | 5.00 | 5.00 | 5.00 | 4.20 |
| After 24 h | 3.76 | 4.22 | 4.33 | 4.66 | 4.175 |
| After 120 h | 3.15 | 3.75 | 3.87 | 4.33 | 4.14 |
| Self-discharge after 24 h | −24.80% | −15.60% | −13.40% | −6.80% | −0.59% 1 |
| Self-discharge after 120 h | −37.00% | −25.00% | −22.60% | −13.40% | −1.43% 1 |
© 2020 by the authors. Licensee MDPI, Basel, Switzerland. This article is an open access article distributed under the terms and conditions of the Creative Commons Attribution (CC BY) license (http://creativecommons.org/licenses/by/4.0/).
Share and Cite
de Fazio, R.; Cafagna, D.; Marcuccio, G.; Visconti, P. Limitations and Characterization of Energy Storage Devices for Harvesting Applications. Energies 2020, 13, 783. https://doi.org/10.3390/en13040783
de Fazio R, Cafagna D, Marcuccio G, Visconti P. Limitations and Characterization of Energy Storage Devices for Harvesting Applications. Energies. 2020; 13(4):783. https://doi.org/10.3390/en13040783
Chicago/Turabian Stylede Fazio, Roberto, Donato Cafagna, Giorgio Marcuccio, and Paolo Visconti. 2020. "Limitations and Characterization of Energy Storage Devices for Harvesting Applications" Energies 13, no. 4: 783. https://doi.org/10.3390/en13040783
APA Stylede Fazio, R., Cafagna, D., Marcuccio, G., & Visconti, P. (2020). Limitations and Characterization of Energy Storage Devices for Harvesting Applications. Energies, 13(4), 783. https://doi.org/10.3390/en13040783