Figure 1.
Open-loop system for a governor and a turbine. Symbols: ω, rotating speed; Ggov, governor transfer function; Gh, turbine transfer function; Pm, mechanical power.
Figure 1.
Open-loop system for a governor and a turbine. Symbols: ω, rotating speed; Ggov, governor transfer function; Gh, turbine transfer function; Pm, mechanical power.
Figure 2.
The position of mechanical torque.
Figure 2.
The position of mechanical torque.
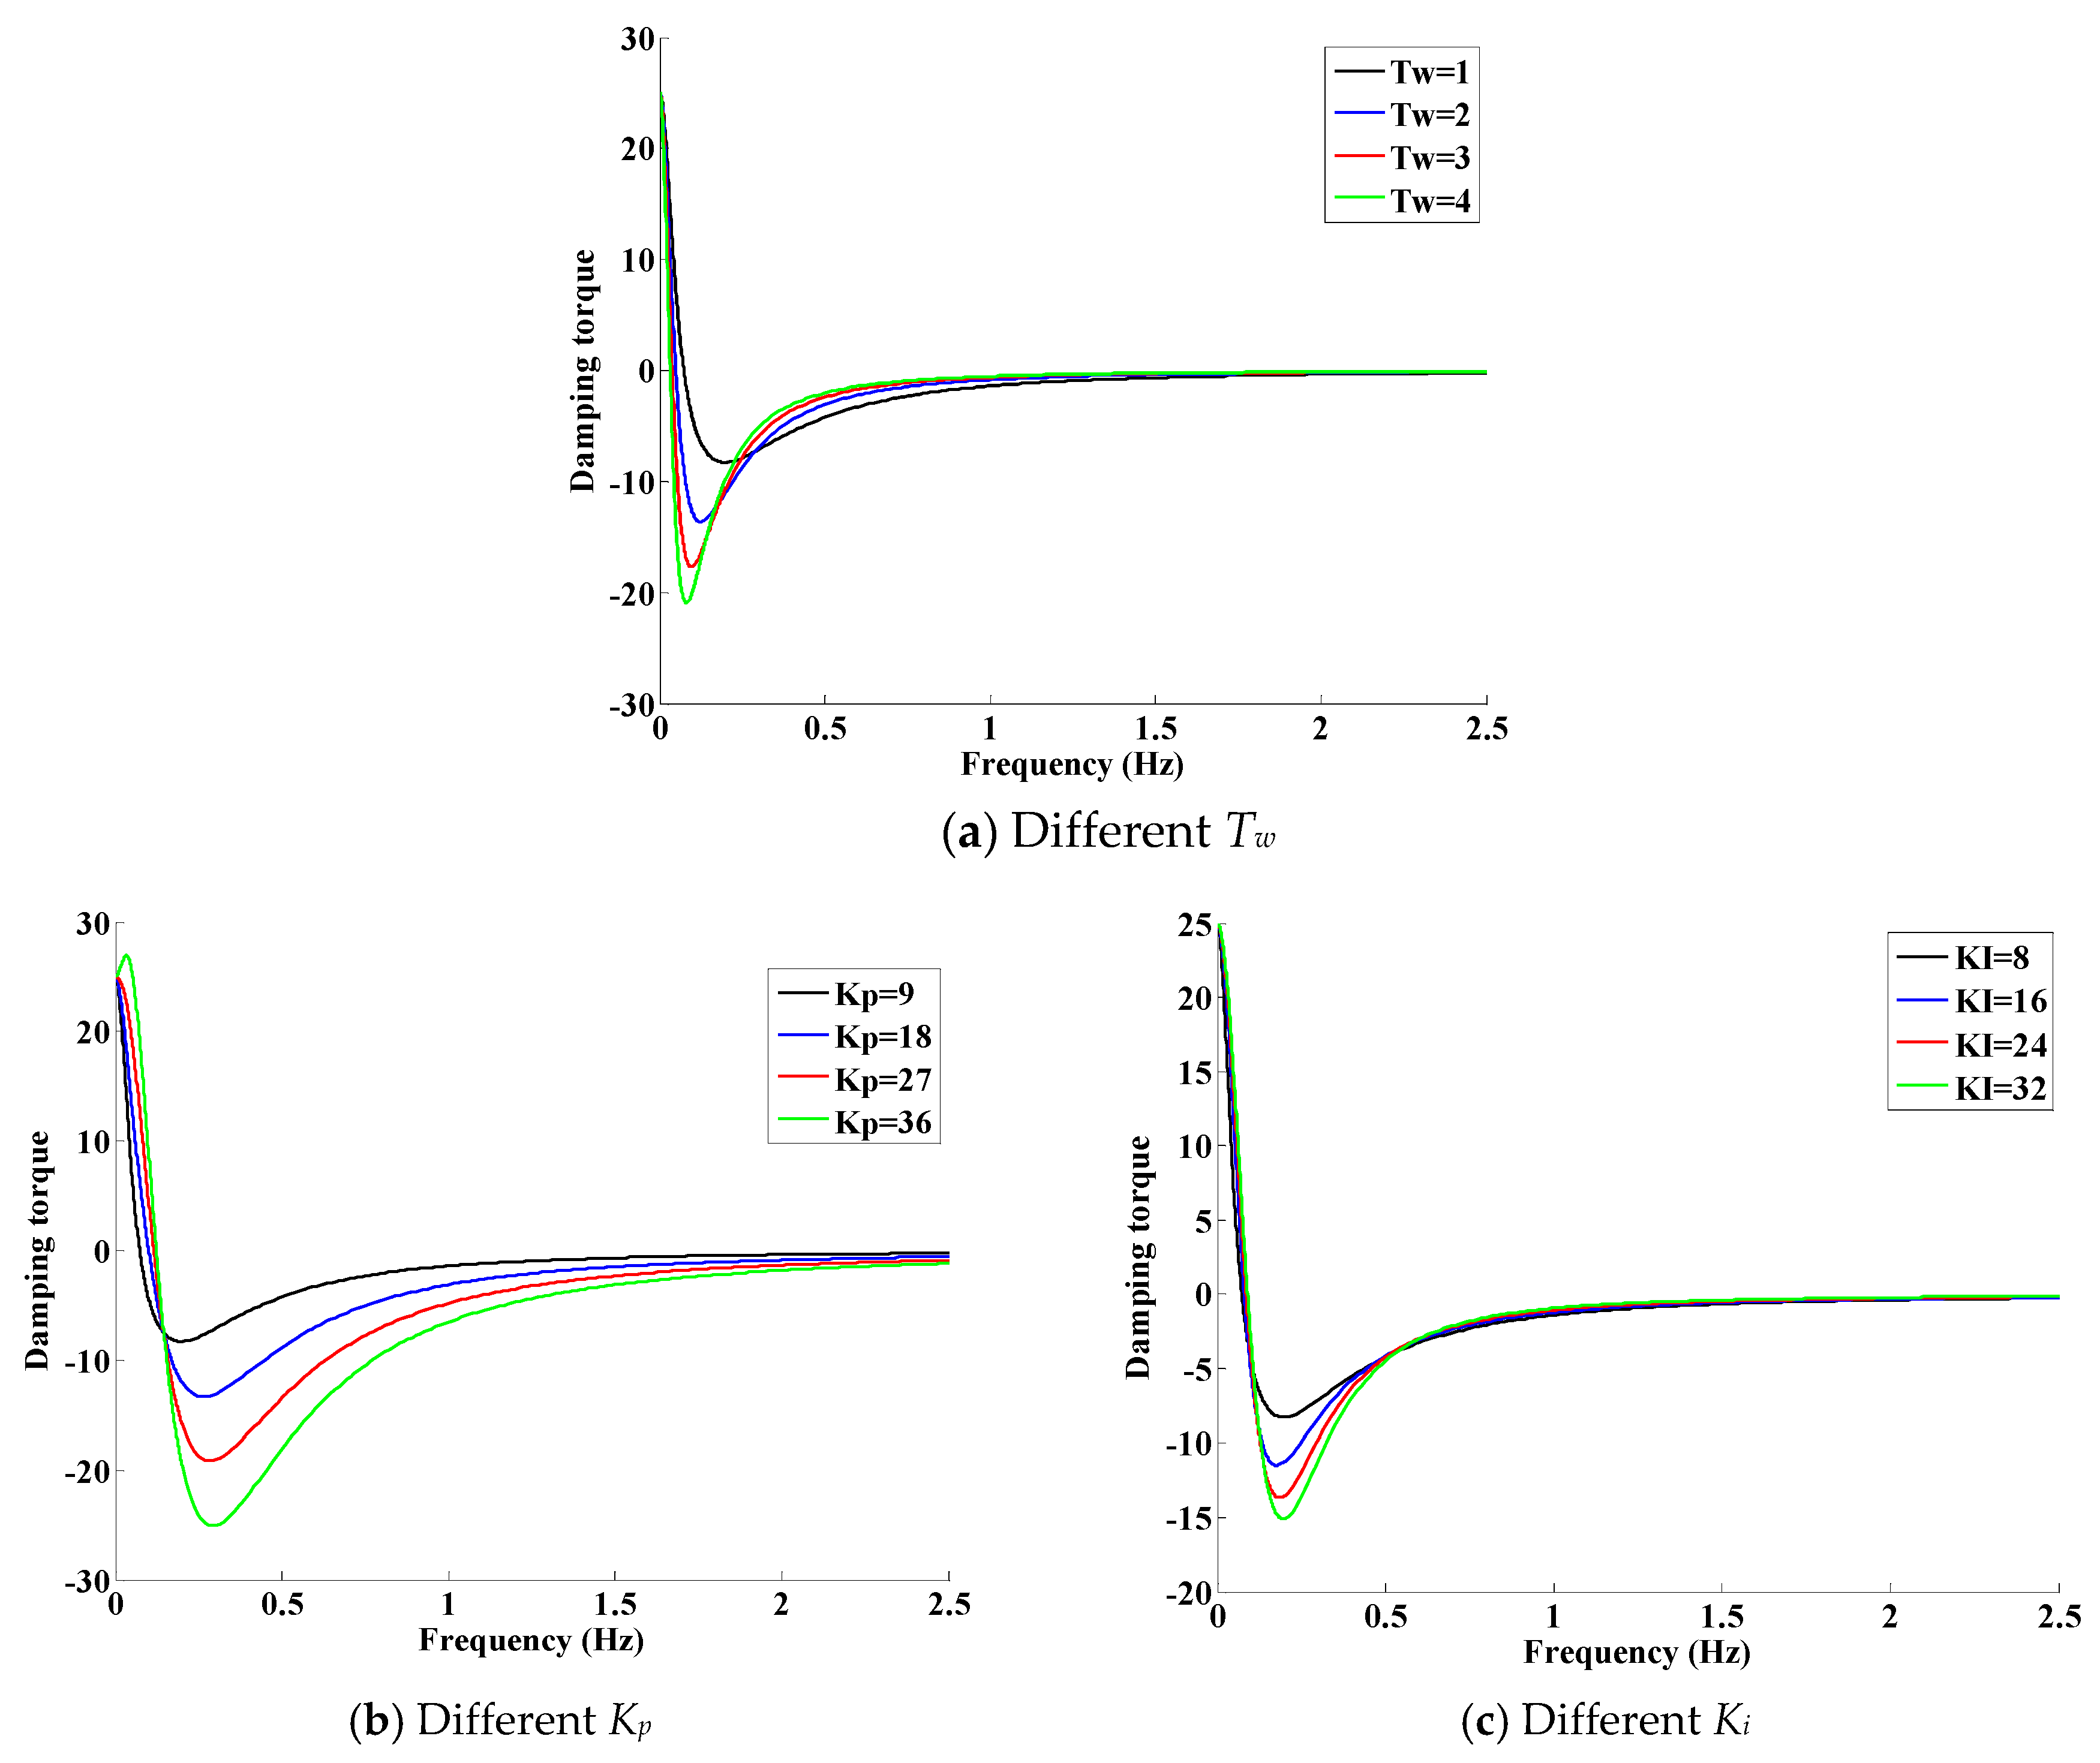
Figure 3.
The damping characteristics of the governor and the turbine in a frequency range of 0–2.5 Hz.
Figure 3.
The damping characteristics of the governor and the turbine in a frequency range of 0–2.5 Hz.
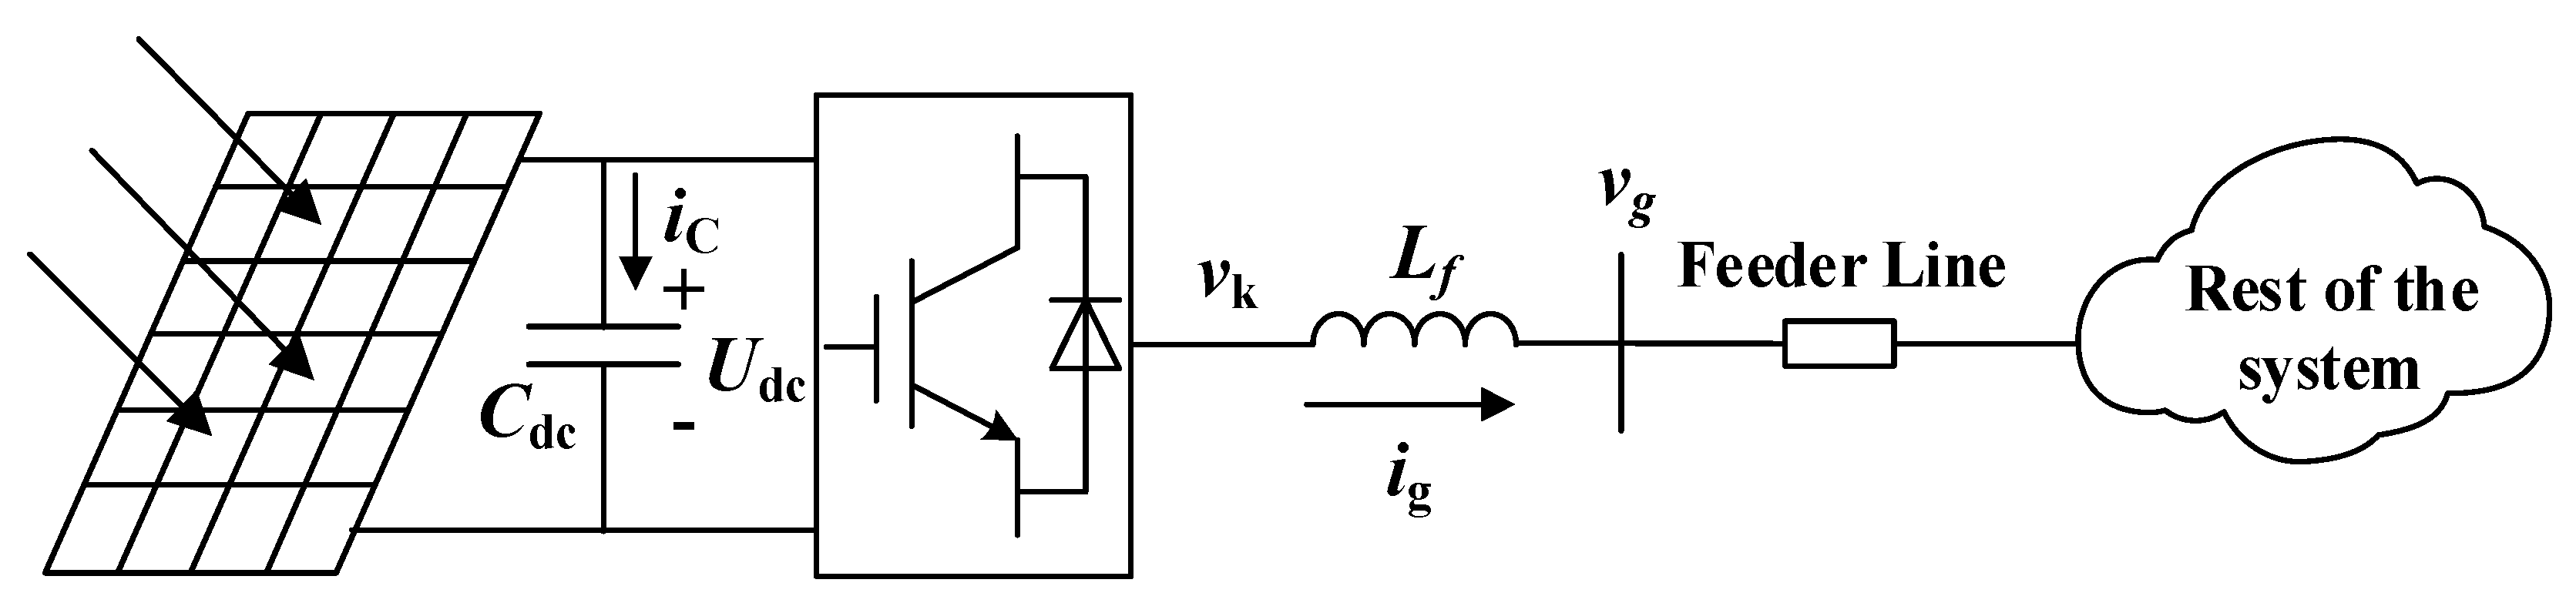
Figure 4.
The structure of photovoltaic (PV) generation. Symbols: Cdc, direct current (DC) capacitor; Udc, DC-side output voltage; iC, the current of a DC capacitor; Vk, alternating current (AC)-side output voltage; Lf, AC inductor; ig, AC-side output current; Vg, the voltage of the point connected with a power system.
Figure 5.
The structure of controllers. Symbols: U*dc, the reference value of a DC-side voltage; i*gd, the reference value of a d-axis current; i*gq, the reference value of a q-axis current; igd, the d-axis current; igq, the q-axis current; vgd, the d-axis voltage; vgq, the q-axis voltage; ω, the angular frequency of the system.
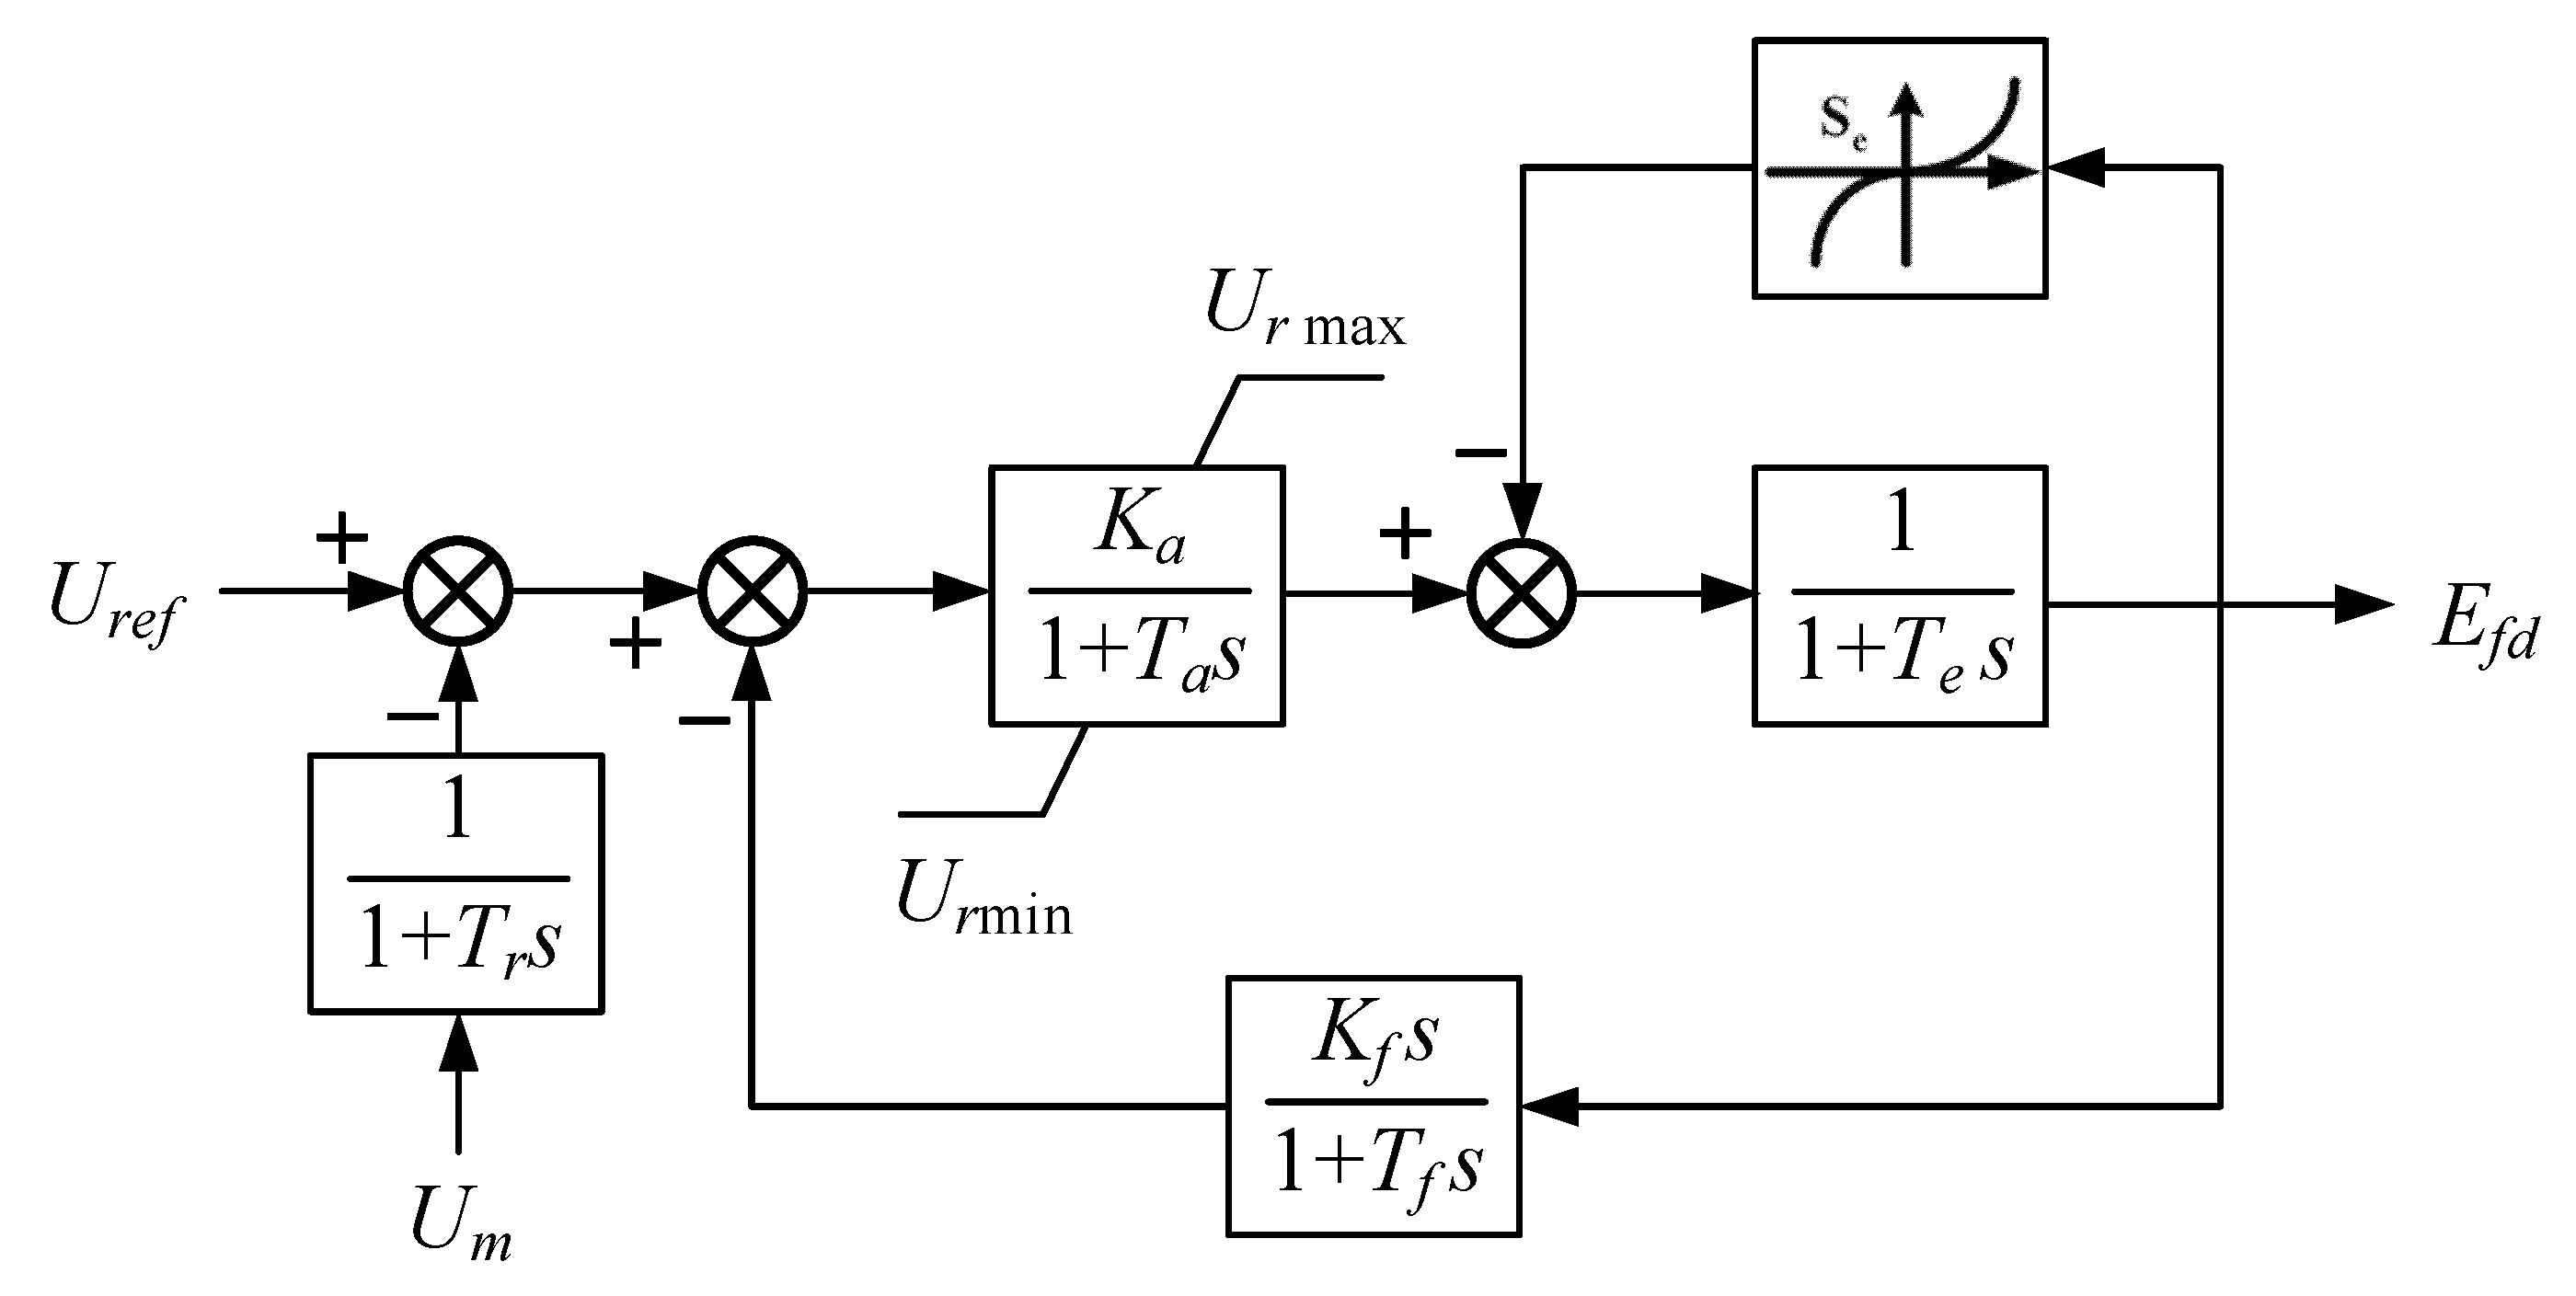
Figure 6.
Block diagram of the exciter.
Figure 6.
Block diagram of the exciter.
Figure 7.
Block diagram of a water turbine and a PID governor. Symbols: KW, the gain of frequency deviation; bp, permanent difference coefficient; KP1, the gain of the governor; KI1, the integral gain of the governor; KP2, the gain of the servo system; TF, the time constant of stroke feedback; TW, the time constant of the water hammer.
Figure 8.
The structure of an integrated PV-hydro system. Gen1, Gen2, Gen3 and Gen4 are the abbreviations for the names of hydropower stations.
Figure 8.
The structure of an integrated PV-hydro system. Gen1, Gen2, Gen3 and Gen4 are the abbreviations for the names of hydropower stations.
Figure 9.
Participation factors. The state variables of synchronous machines contain δ, ω, E’d, and E’q. The state variables of excitation systems contain Uex1, Uex2, and Uex3. The state variables of governors and turbines contain X1, X2, PGV, and Pm. The state variables of PV generation contain Udc, XV, Yd, Yq, igd, and igq.
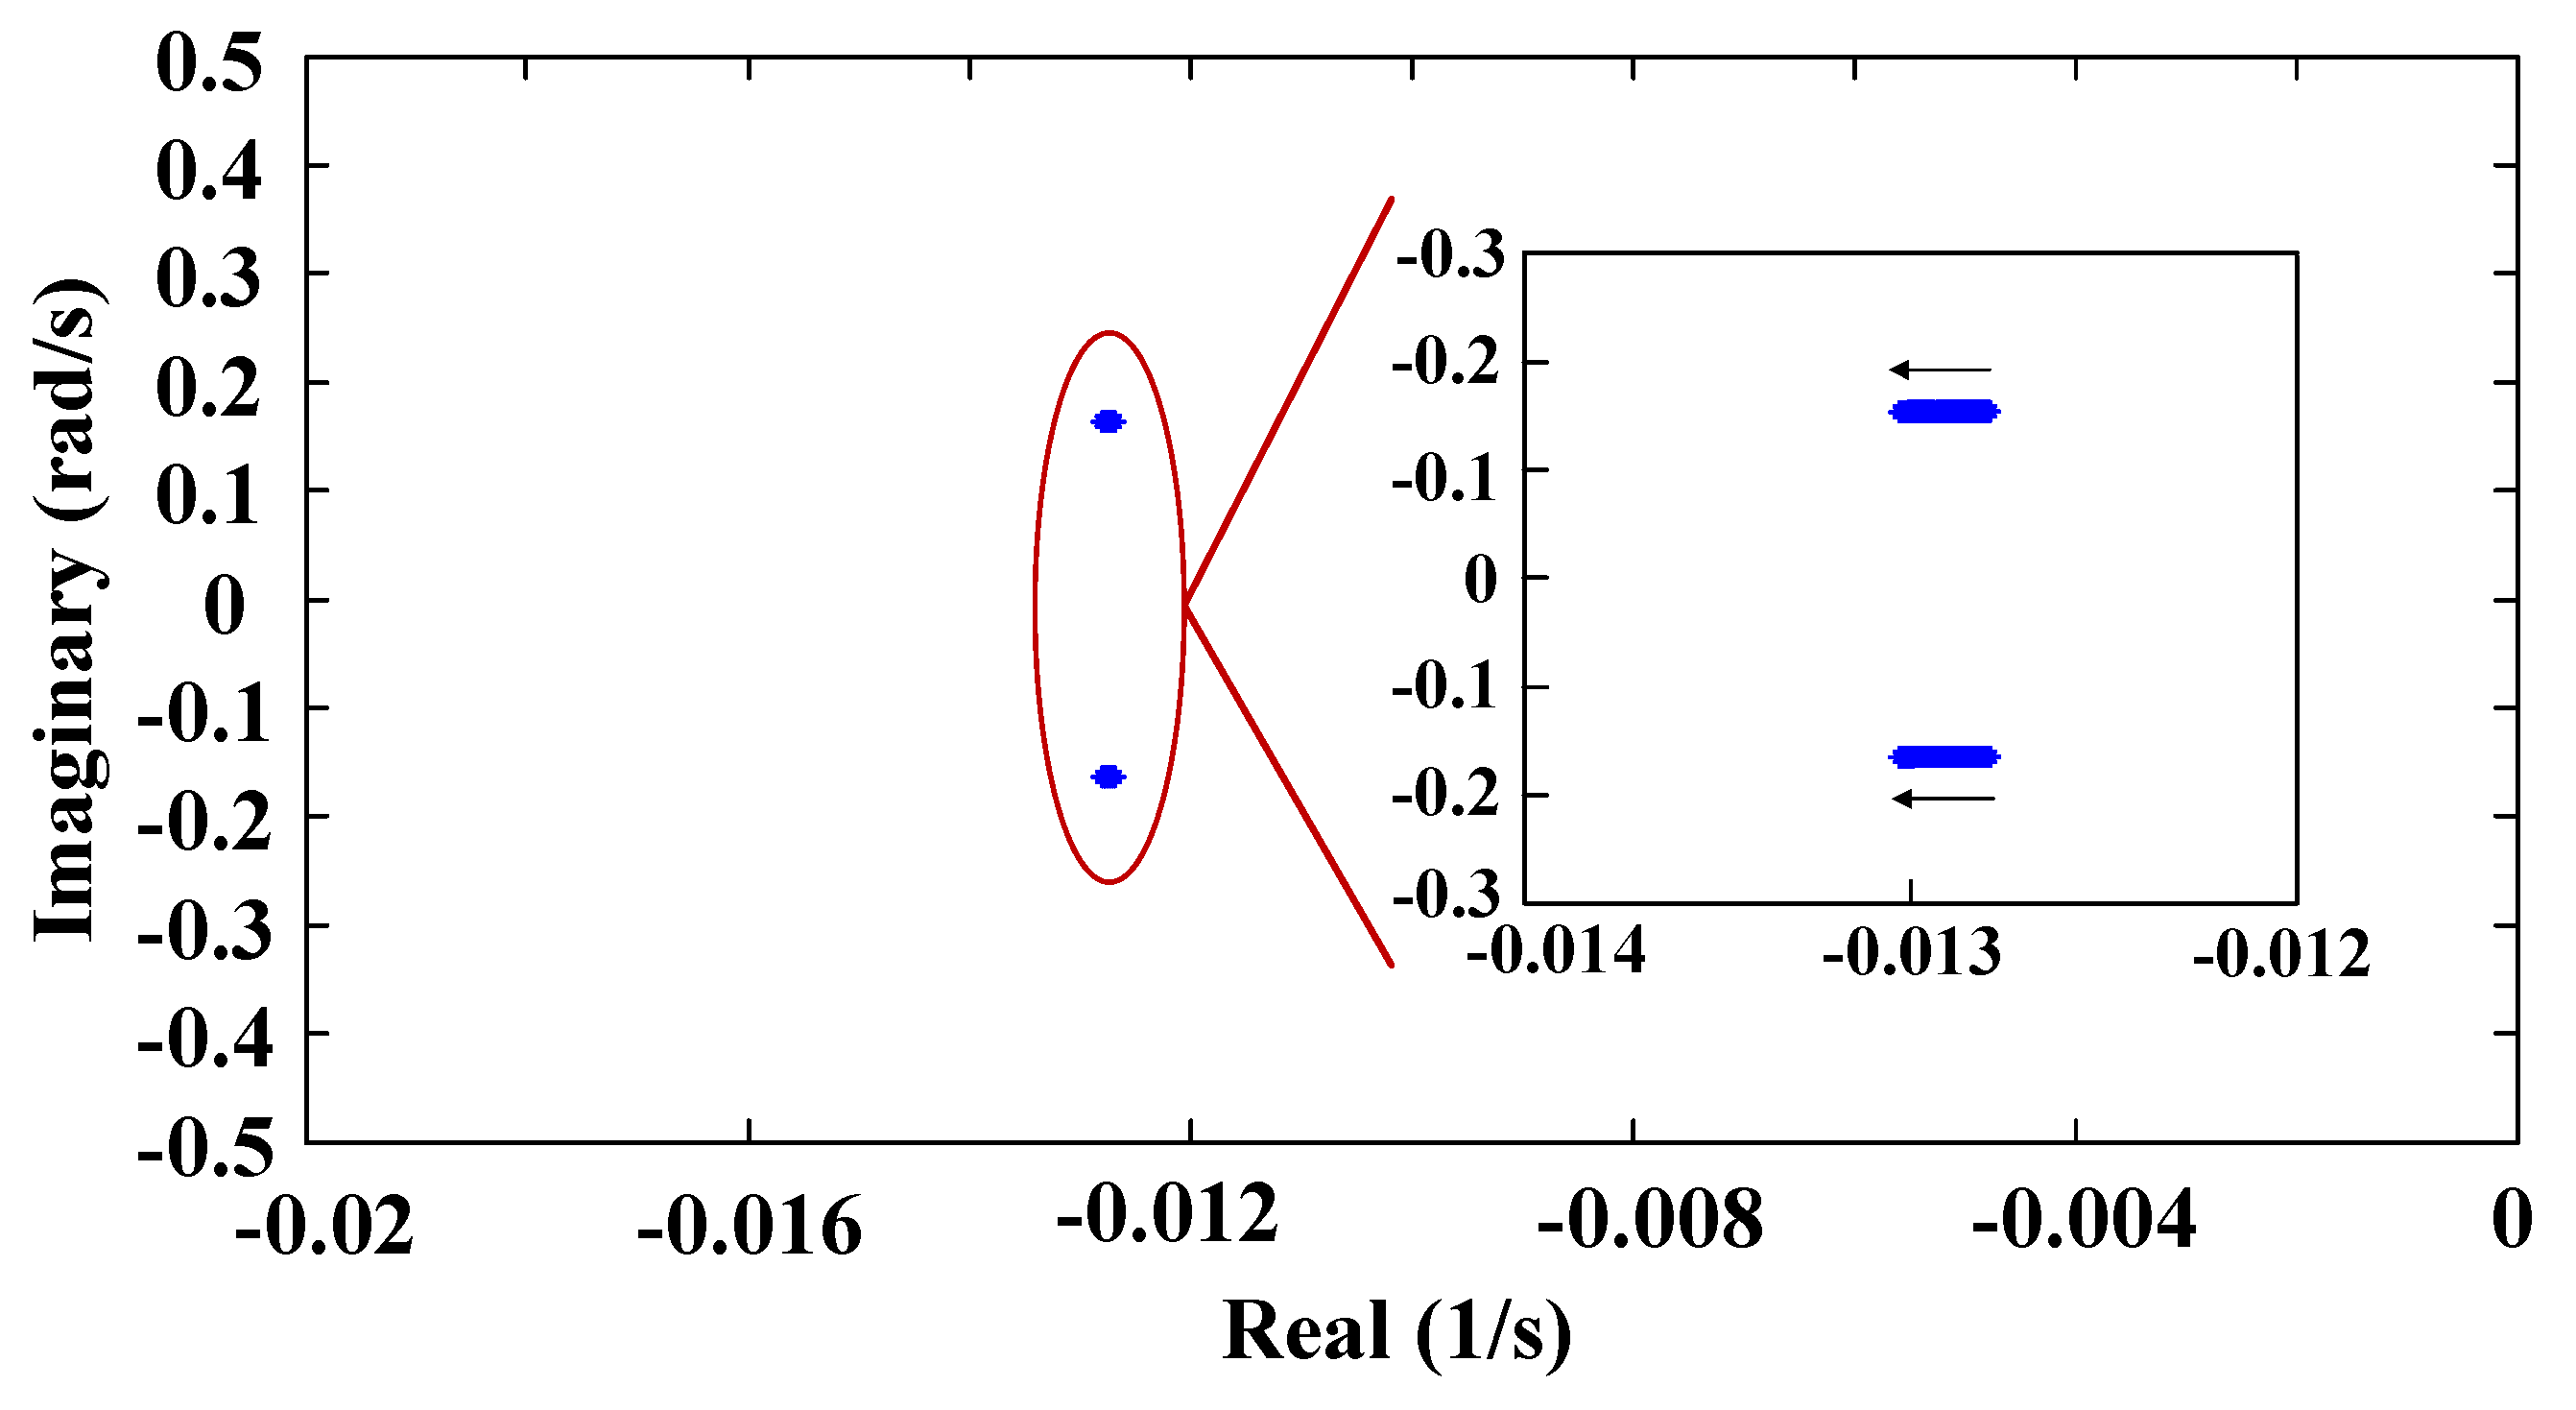
Figure 10.
Root locus of the ultralow-frequency oscillation.
Figure 10.
Root locus of the ultralow-frequency oscillation.
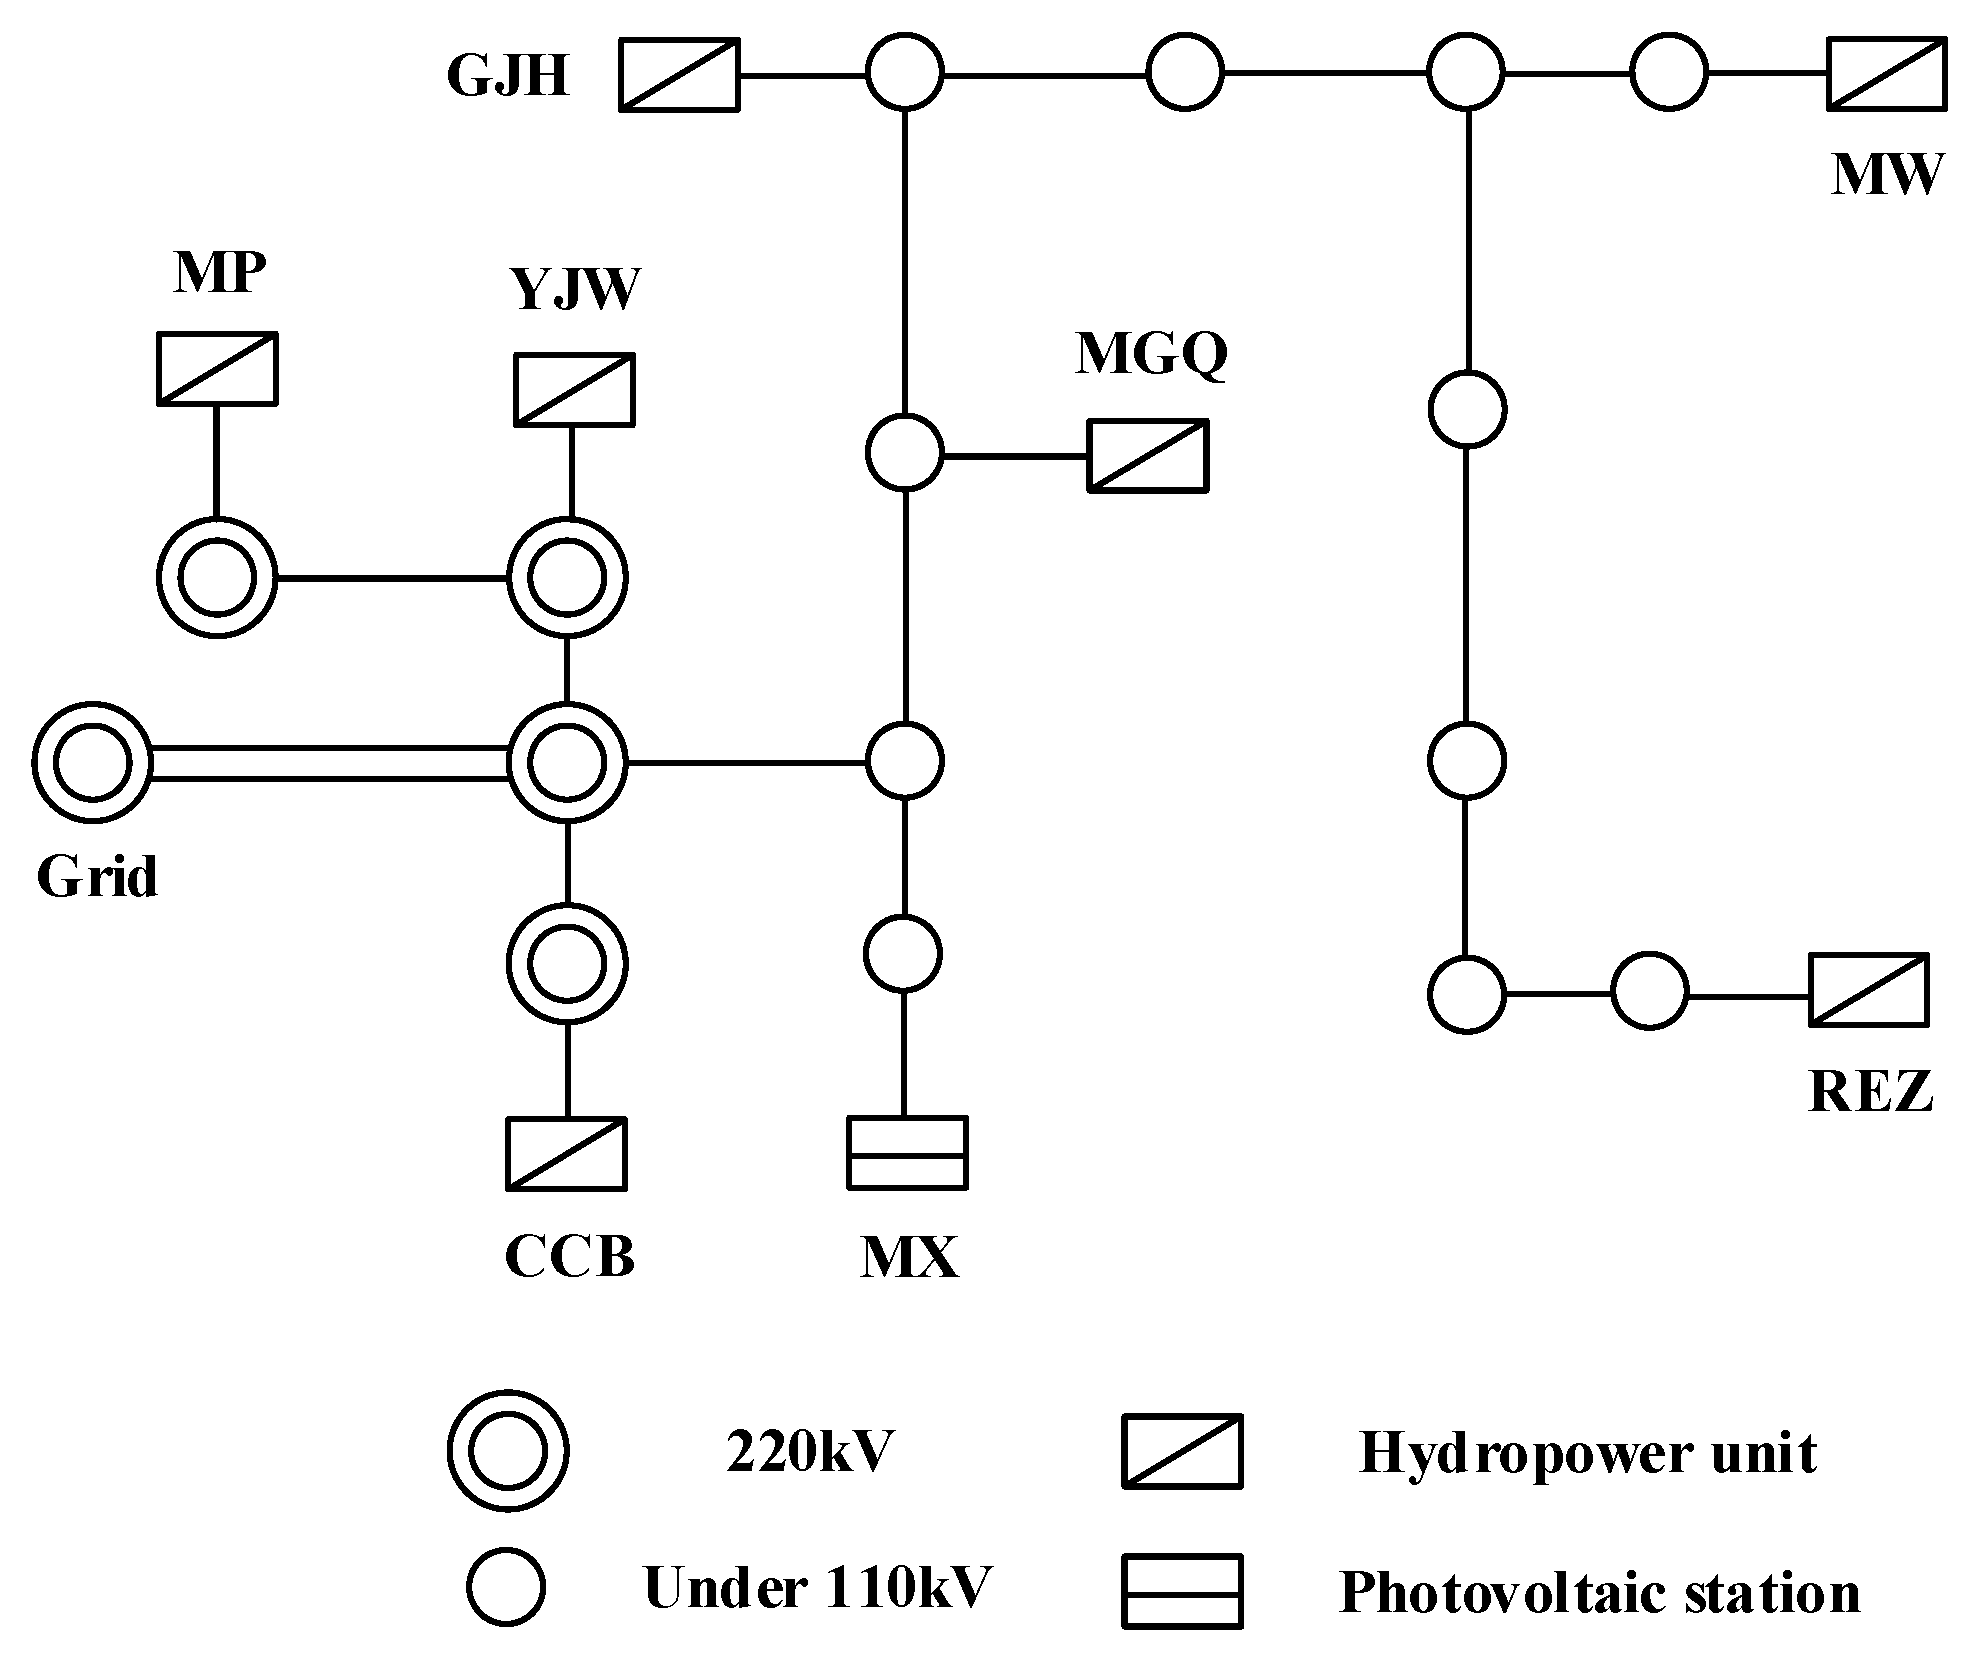
Figure 11.
Structure diagram of a county town in China. MP, YJW, CCB, MGQ, GJH, MW, and REZ are the abbreviations for the names of hydropower stations, MX is the abbreviation for the name of a PV station.
Figure 11.
Structure diagram of a county town in China. MP, YJW, CCB, MGQ, GJH, MW, and REZ are the abbreviations for the names of hydropower stations, MX is the abbreviation for the name of a PV station.
Figure 12.
Participation factors. The state variables are the same as in
Figure 9.
Figure 12.
Participation factors. The state variables are the same as in
Figure 9.
Figure 13.
Root locus of the ultralow-frequency oscillation.
Figure 13.
Root locus of the ultralow-frequency oscillation.
Table 1.
The parameters of governors and turbines.
Table 1.
The parameters of governors and turbines.
| | Gen1 | Gen2 | Gen3 | Gen4 |
|---|
| Tw/s | 1 | 1 | 3 | 3 |
| KP | 2.6 | 2.6 | 2.6 | 2.6 |
| KI | 6 | 6 | 6 | 6 |
| KD | 0 | 0 | 0 | 0 |
Table 2.
The ultralow-frequency oscillation.
Table 2.
The ultralow-frequency oscillation.
| Eigenvalues | Damping Ratio (%) | Frequency (Hz) |
|---|
| −0.0127 ± 0.1635i | 7.73 | 0.026 |
Table 3.
Damping ratio and frequency with increasing of PV output power.
Table 3.
Damping ratio and frequency with increasing of PV output power.
| Output Power (MW) | Damping Ratio (%) | Frequency (Hz) |
|---|
| 100 | 7.73 | 0.026 |
| 200 | 7.75 | 0.026 |
| 300 | 7.77 | 0.026 |
| 400 | 7.79 | 0.026 |
| 500 | 7.81 | 0.026 |
| 600 | 7.82 | 0.026 |
Table 4.
The ultralow-frequency oscillation modes for PV generation connected to different locations.
Table 4.
The ultralow-frequency oscillation modes for PV generation connected to different locations.
| Location | Eigenvalues | Damping Ratio (%) | Frequency (Hz) |
|---|
| Bus 5 | −0.0126 ± 0.1635i | 7.71 | 0.026 |
| Bus 6 | −0.0127 ± 0.1635i | 7.73 | 0.026 |
| Bus 10 | −0.0131 ± 0.1636i | 7.96 | 0.026 |
| Bus 11 | −0.0131 ± 0.1636i | 7.97 | 0.026 |
Table 5.
The ultralow-frequency oscillation modes by replacing a generator.
Table 5.
The ultralow-frequency oscillation modes by replacing a generator.
| Generator Replaced | Eigenvalues | Damping Ratio (%) | Frequency (Hz) |
|---|
| Gen 1 | −0.0050 ± 0.1580i | 3.14 | 0.025 |
| Gen 2 | −0.0049 ± 0.1580i | 3.12 | 0.025 |
| Gen 3 | −0.0160 ± 0.1644i | 9.64 | 0.026 |
| Gen 4 | −0.0159 ± 0.1644i | 9.62 | 0.026 |
Table 6.
The output powers of sources.
Table 6.
The output powers of sources.
| Name | Output Power (MW) |
|---|
| Grid-Connected Mode | Island Mode |
|---|
| MP | 45 | 10 |
| YJW | 60 | 13 |
| CCB | 54 | 12 |
| MHQ | 36 | 12 |
| GJH | 44 | 10 |
| MW | 23 | 5 |
| REZ | 37 | 9 |
| MX | 100 | 20 |
Table 7.
Ultralow-frequency oscillations under different operating modes.
Table 7.
Ultralow-frequency oscillations under different operating modes.
| Operating Mode | Eigenvalues | Damping Ratio (%) | Frequency (Hz) |
|---|
| On-grid | −1.172 ± 0.42i | 94.2 | 0.066 |
| Off-grid | −0.032 ± 0.33i | 9.7 | 0.053 |


