Enzymatic Saccharification of Laminaria japonica by Cellulase for the Production of Reducing Sugars

Abstract
1. Introduction
- Experimental design and statistical analysis;
- Validation of the analytical methodology;
- Optimization of proposed method and potential assessment of Laminaria japonica biomass into biofuel and value-added products.
2. Materials and Methods
2.1. Materials
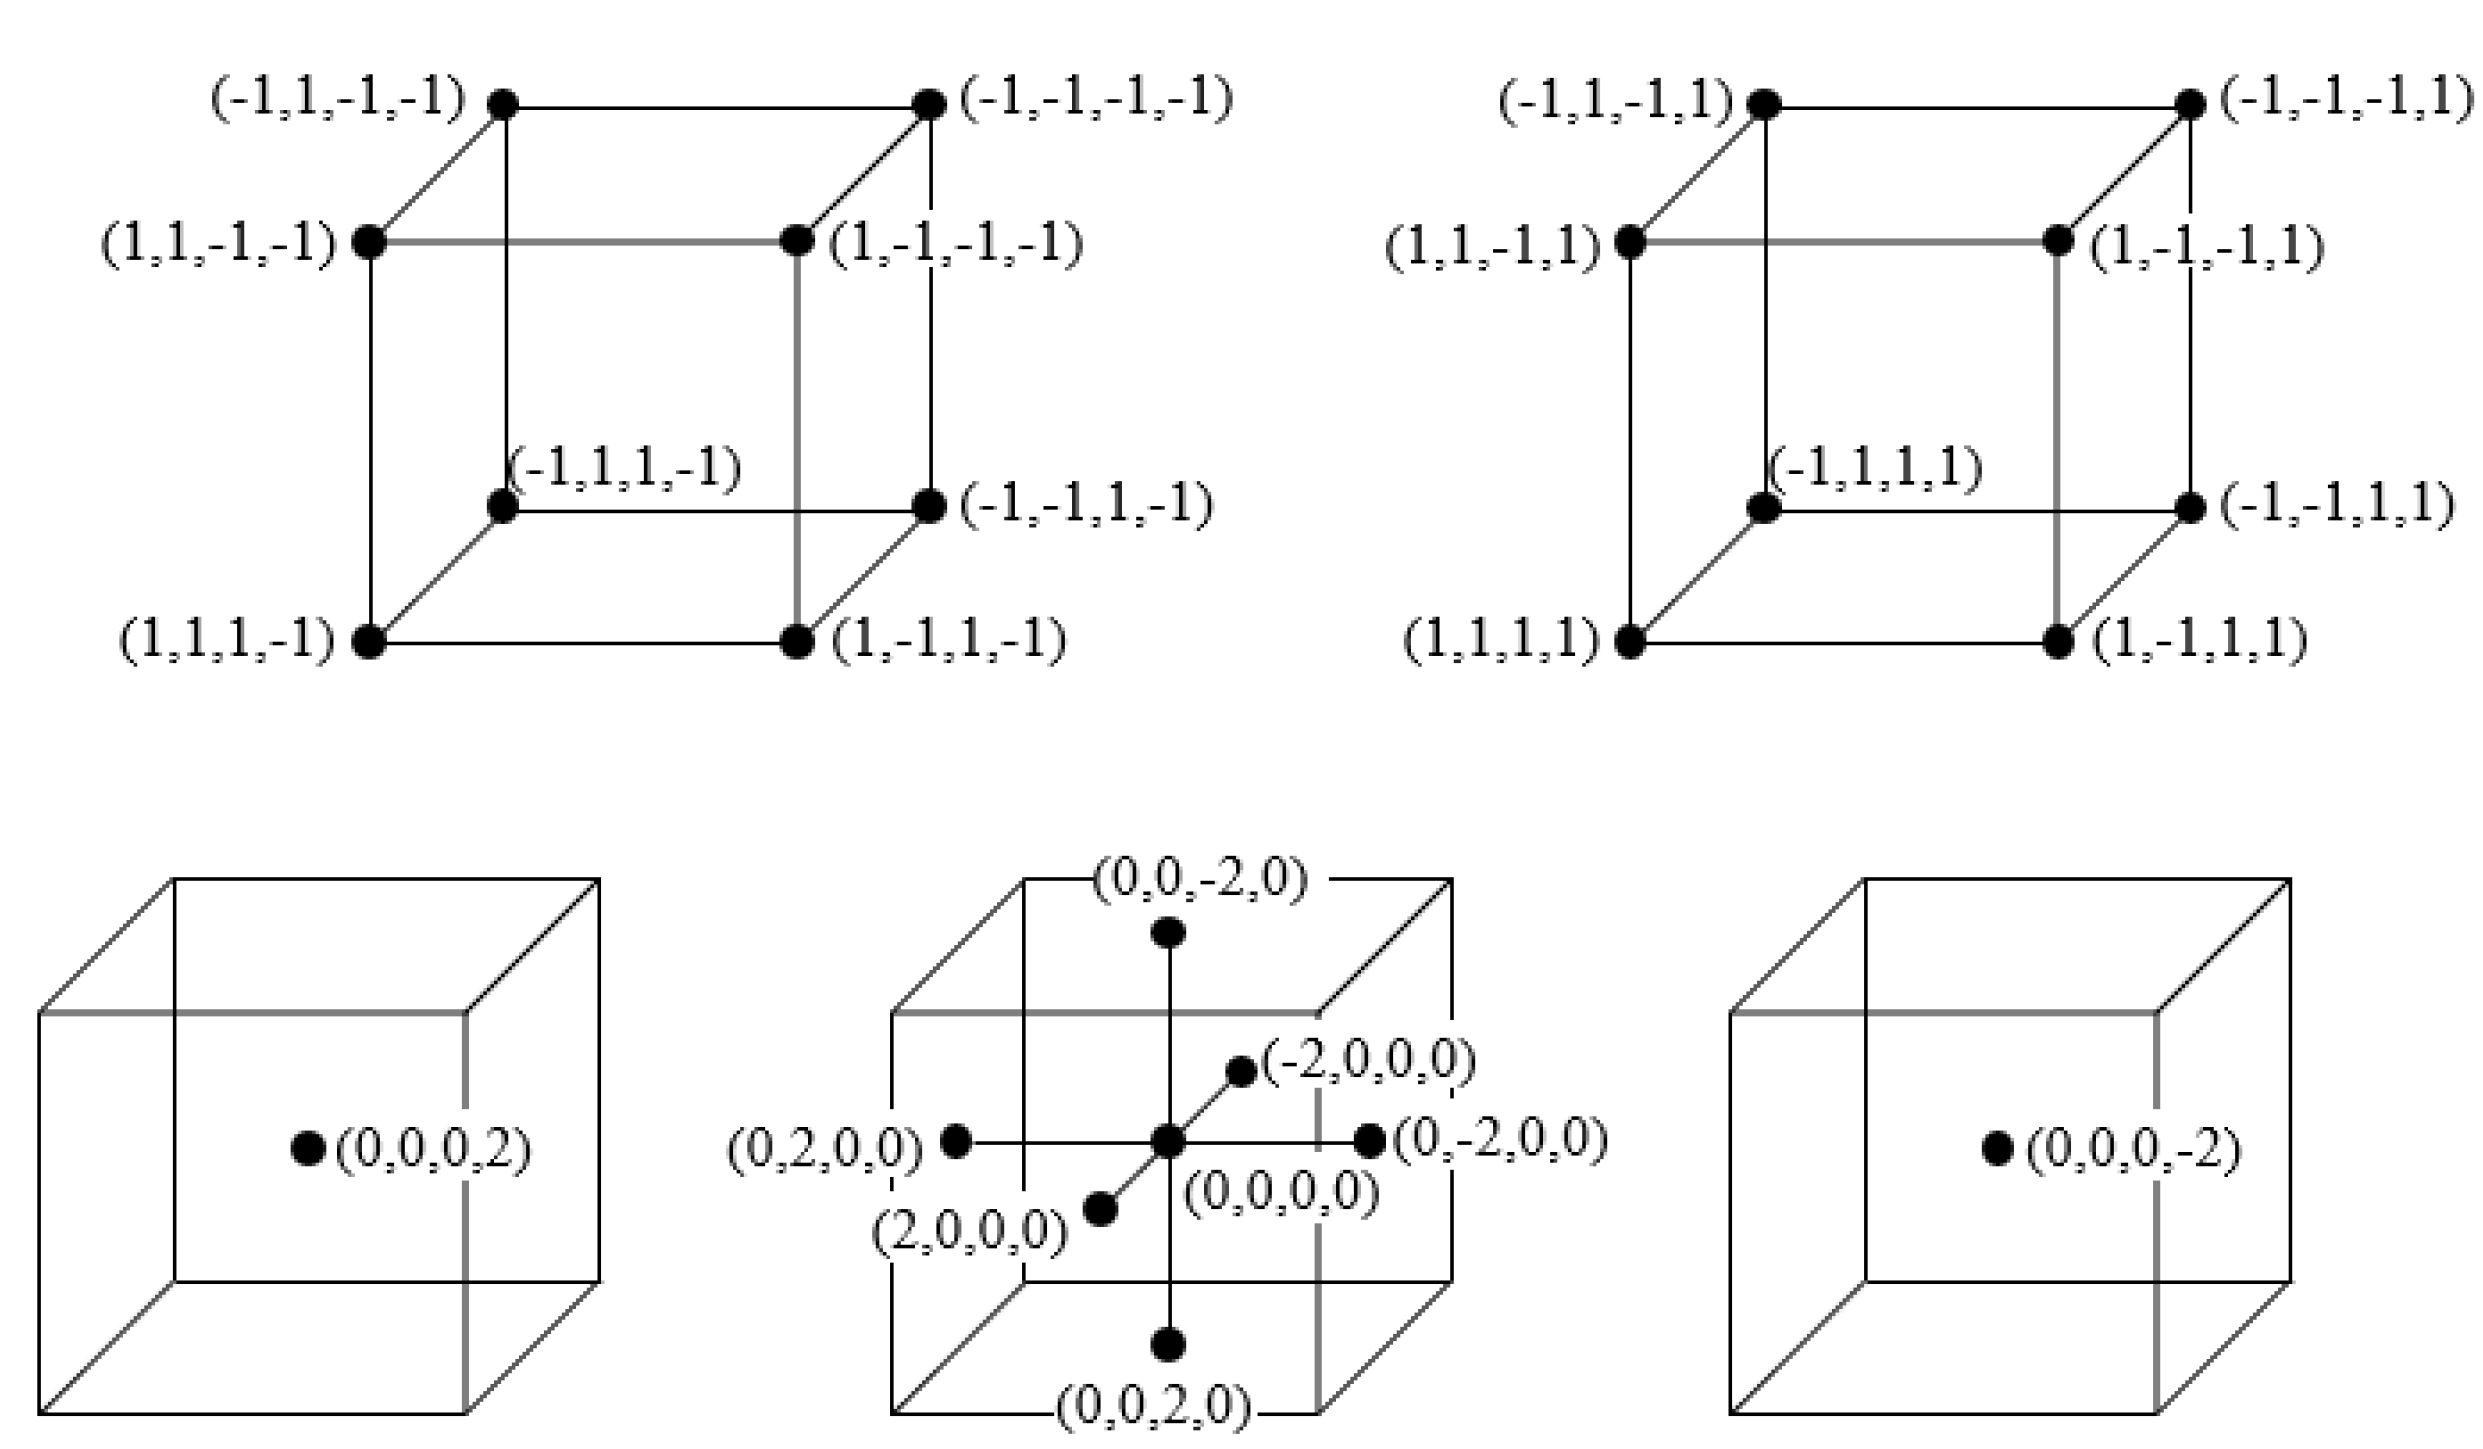
2.2. Experimental Design and Statistical Analysis
2.3. Validation of the Analytical Methodology
3. Results and Discussion
3.1. Experimental Design and Statistical Analysis
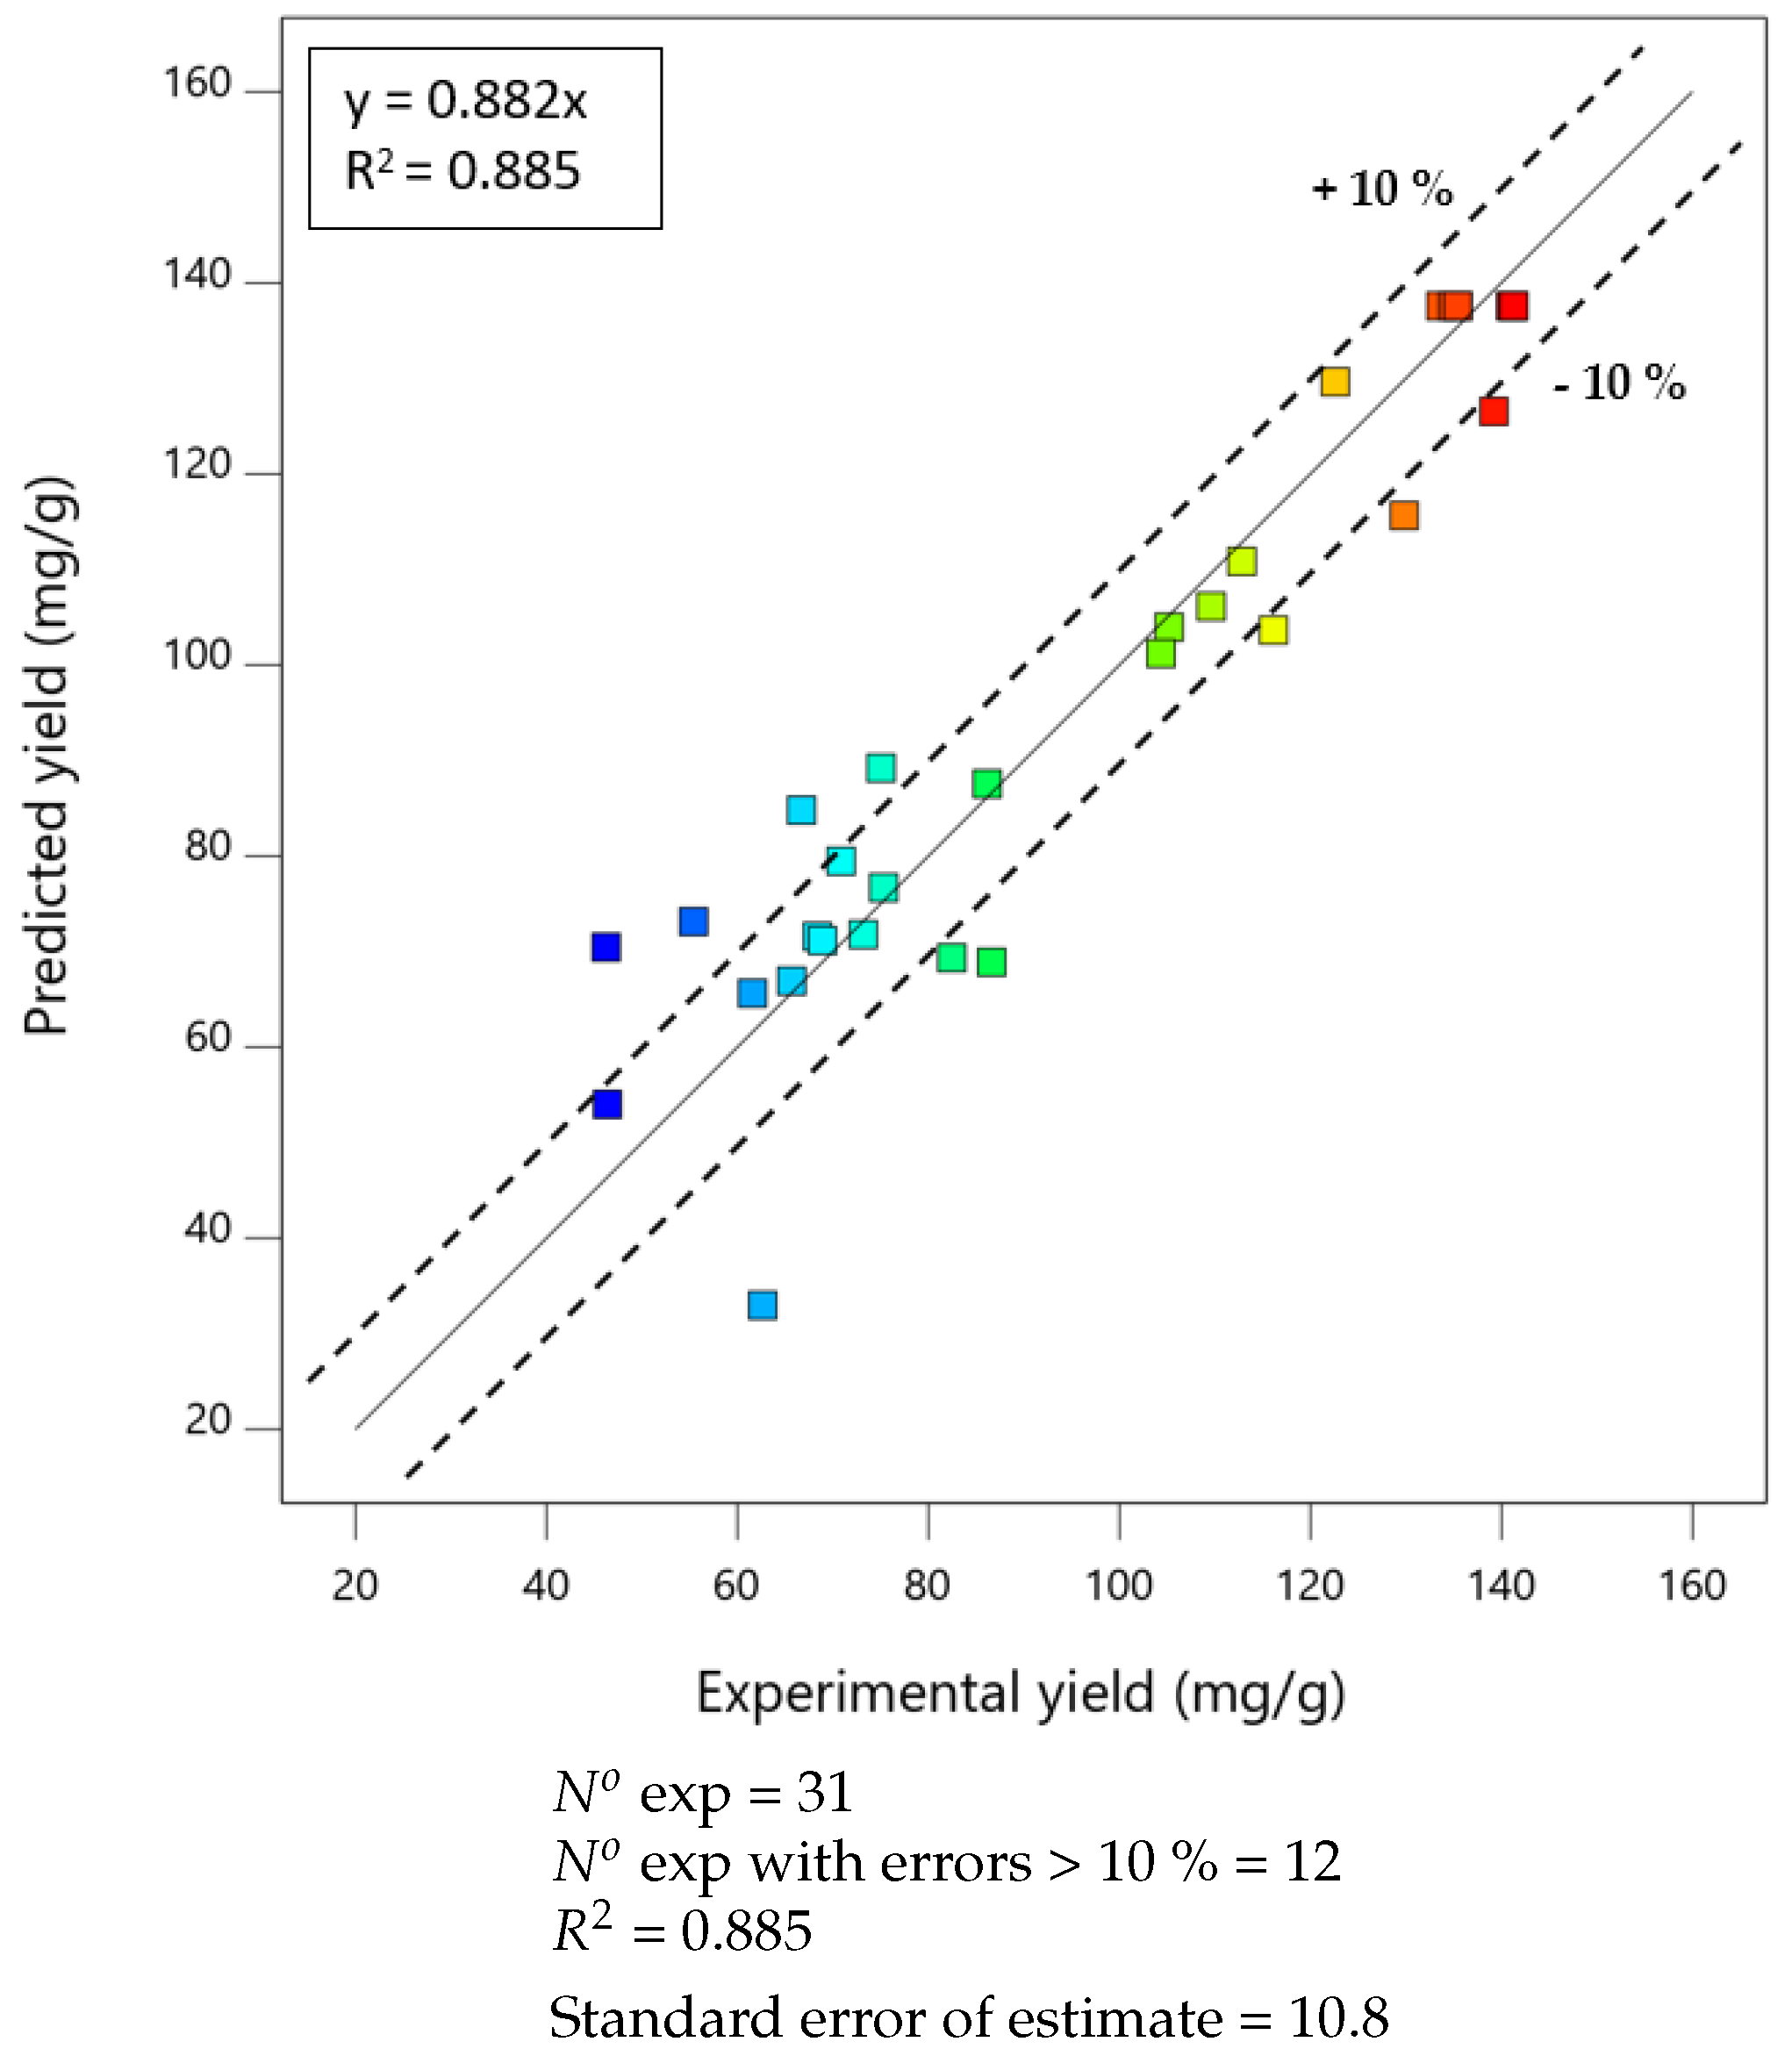
3.2. Validation of the Analytical Methodology
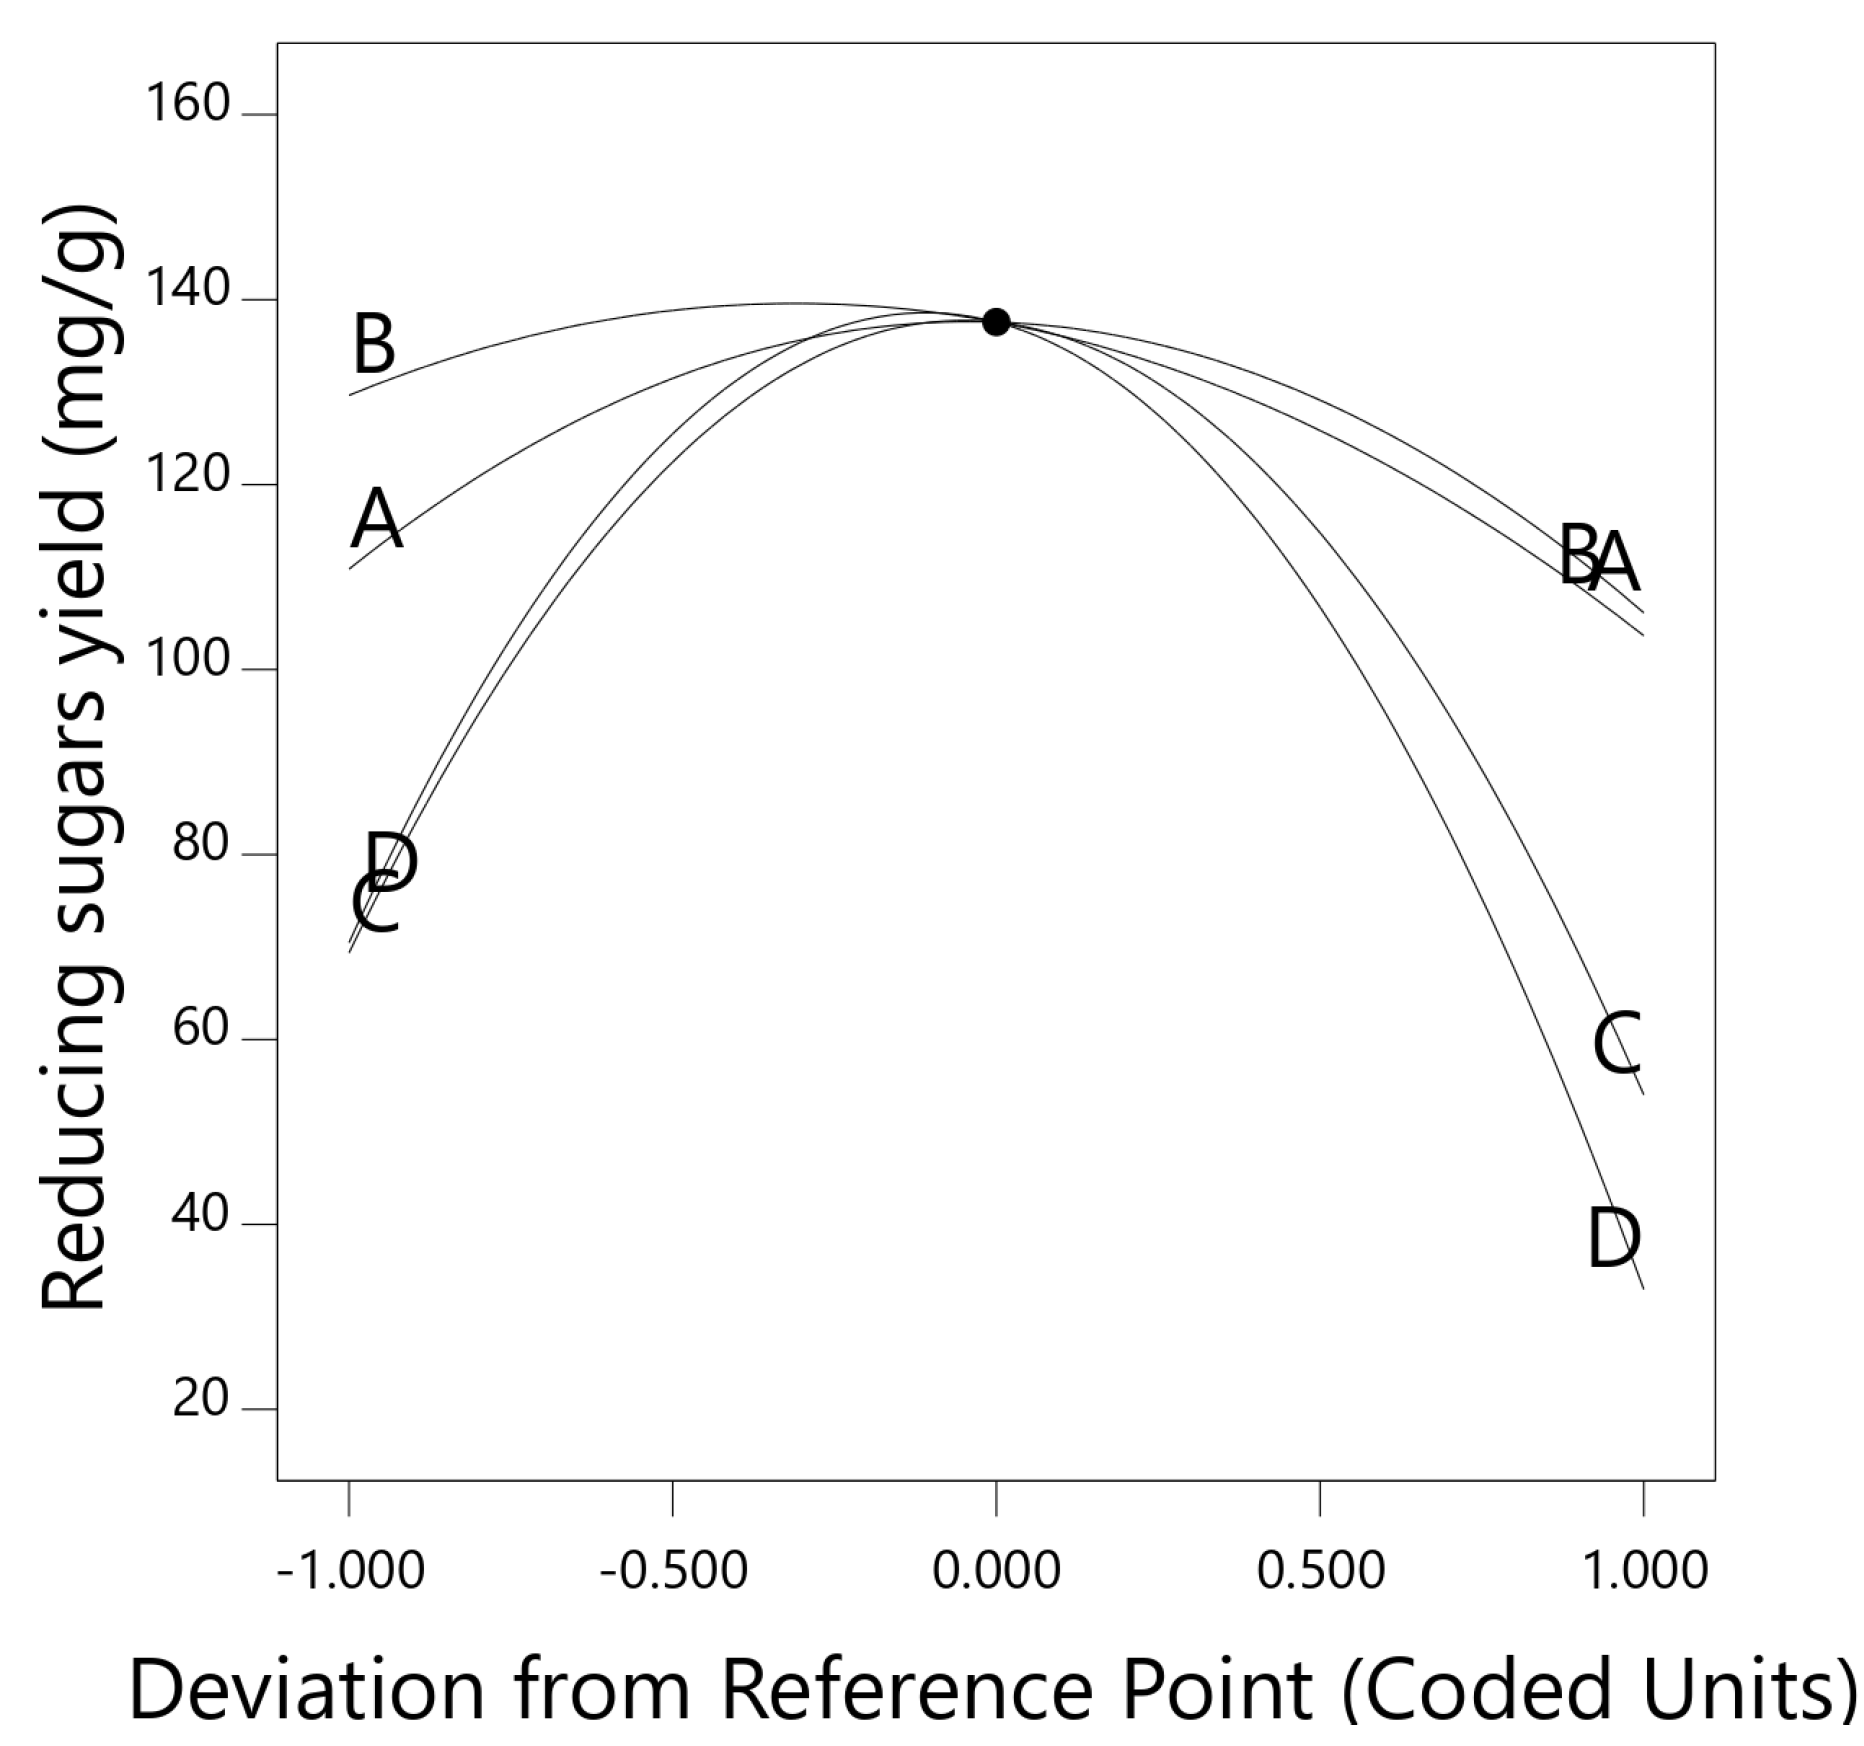
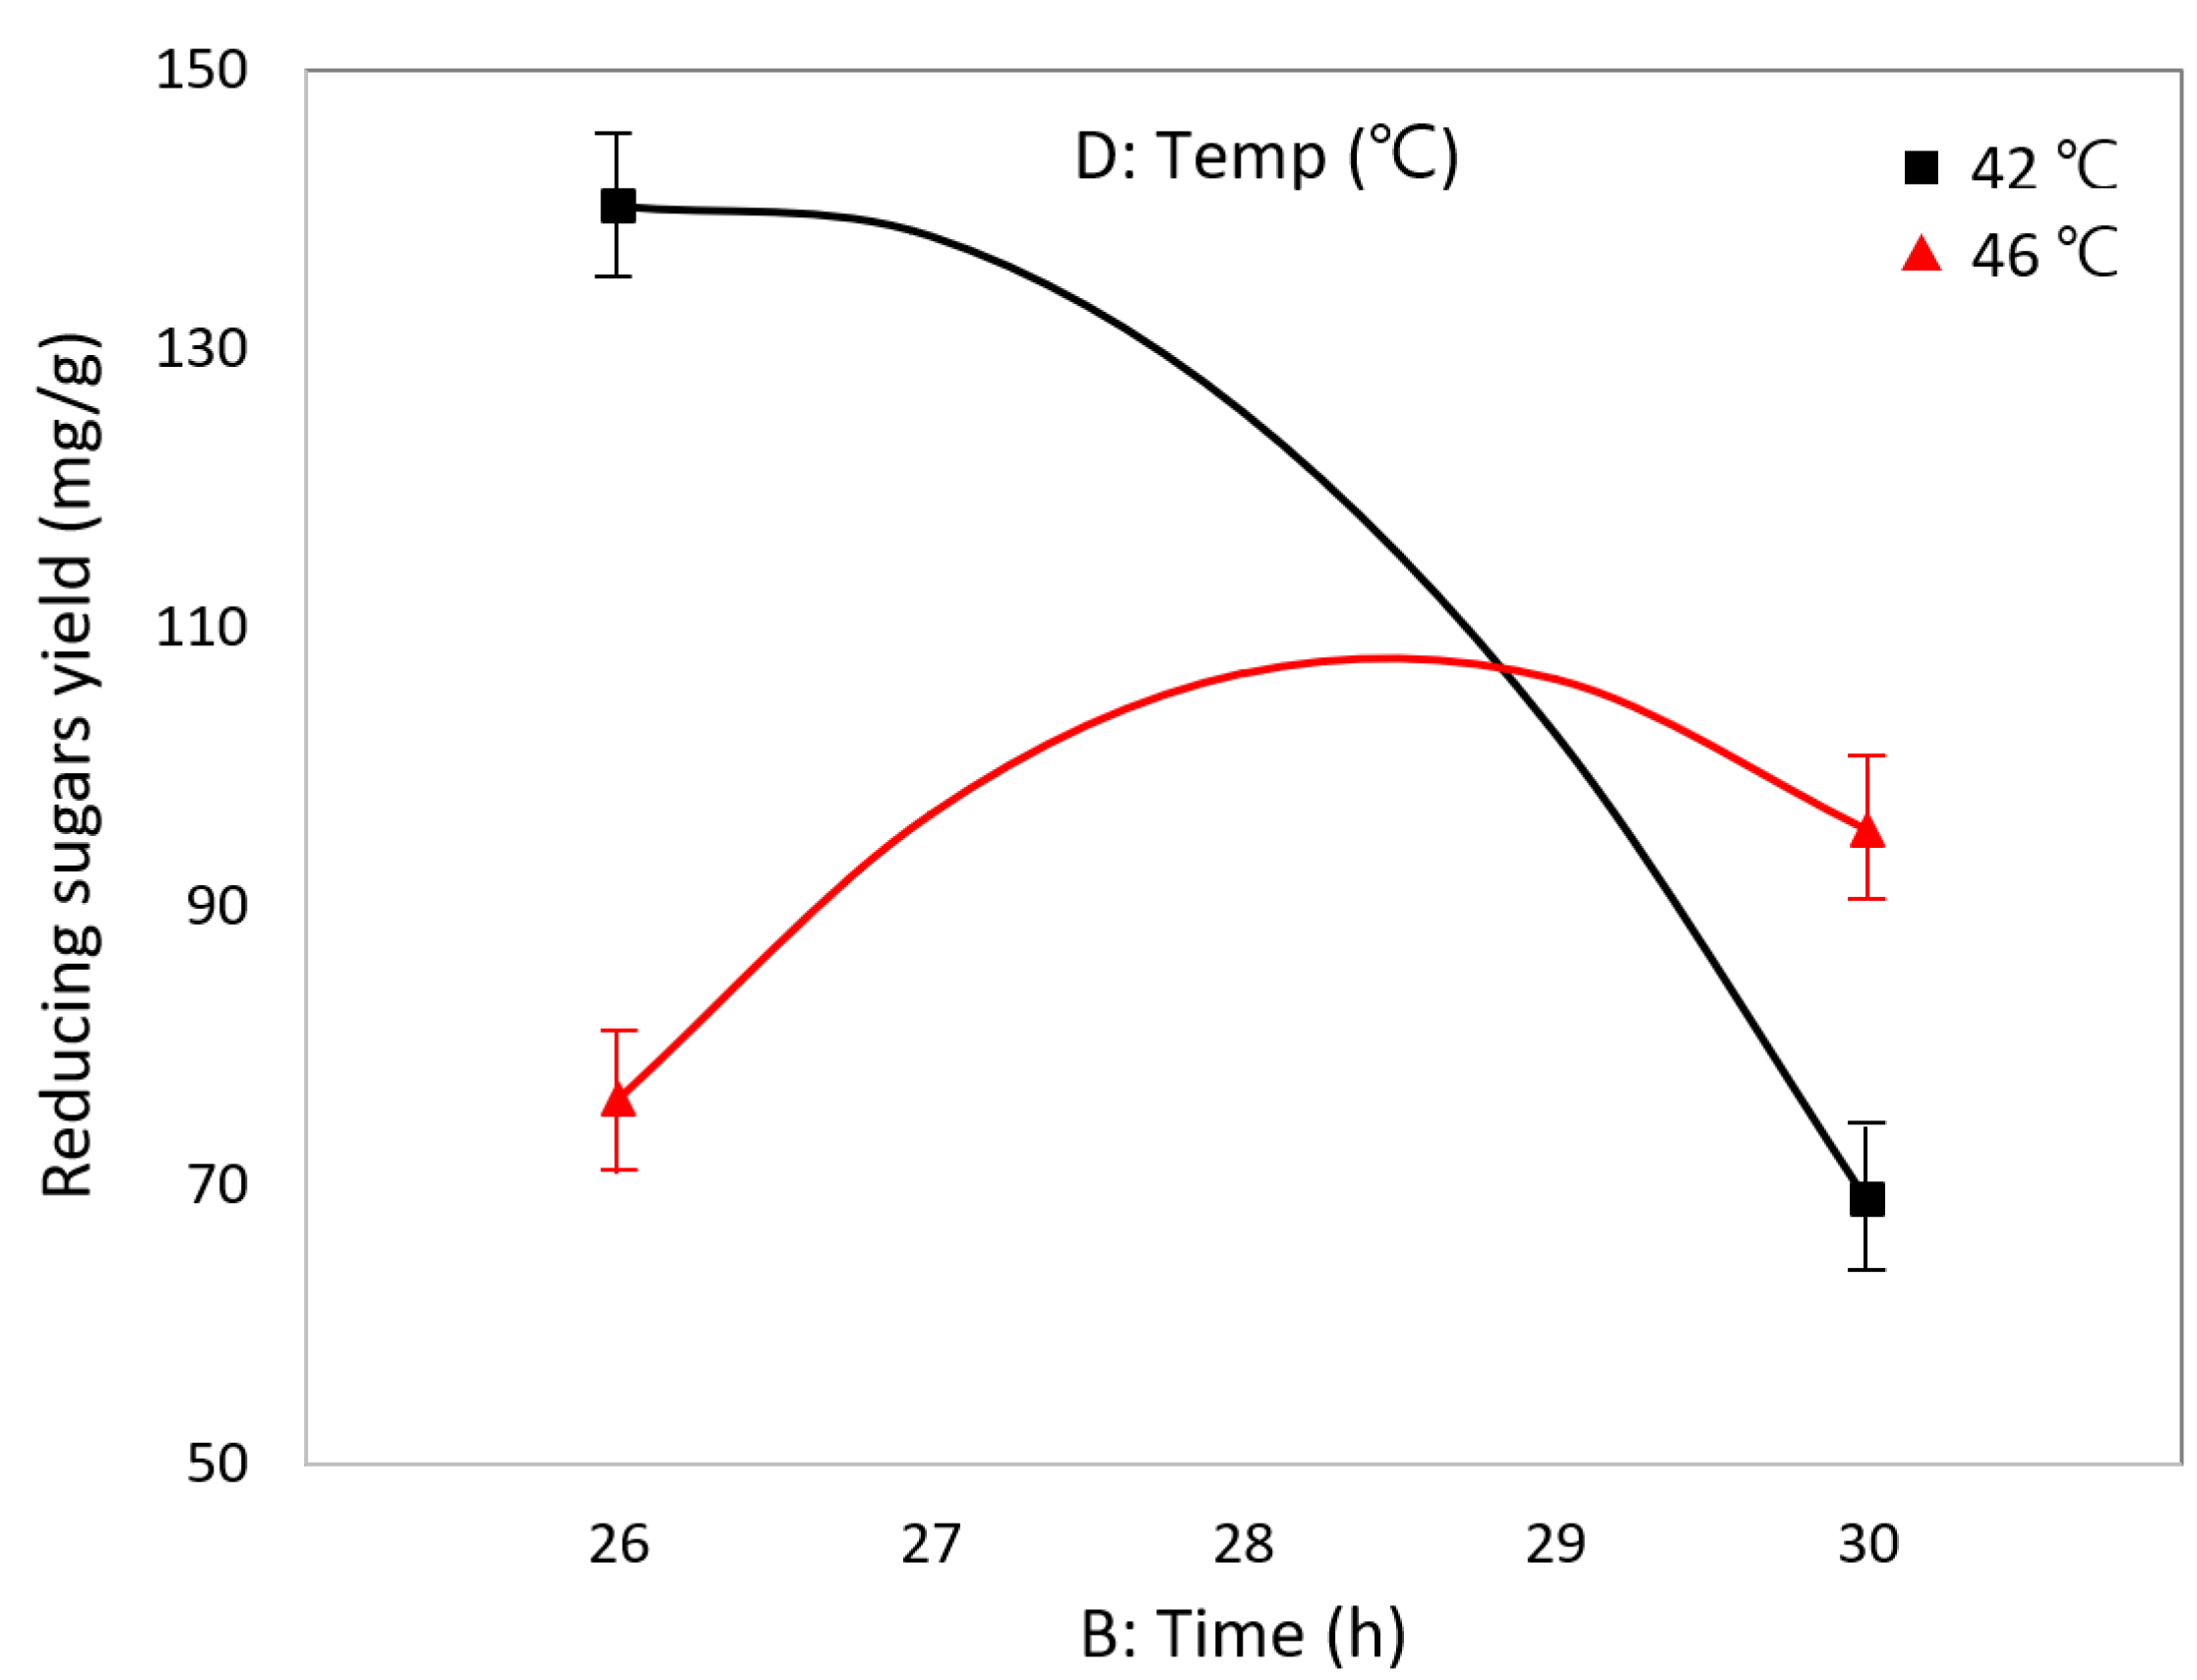
3.3. Optimization of Proposed Method
4. Conclusions
Author Contributions
Funding
Conflicts of Interest
References
- Sharma, S.; Horn, S.J. Enzymatic saccharification of brown seaweed for production of fermentable sugars. Bioresource Technol. 2016, 213, 155–161. [Google Scholar] [CrossRef] [PubMed]
- Ravanal, M.C.; Sharma, S.; Gimpel, J.; Reveco-Urzua, F.E.; Overland, M.; Horn, S.J.; Lienqueo, M.E. The role of alginate lyases in the enzymatic saccharification of brown macroalgae, Macrocystis pyrifera and Saccharina latissima. Algal Res. 2017, 26, 287–293. [Google Scholar] [CrossRef]
- Kraan, S. Mass-cultivation of carbohydrate rich macroalgae, a possible solution for sustainable biofuel production. Mitig. Adapt. Start. Gl. 2013, 18, 27–46. [Google Scholar] [CrossRef]
- Peinado, I.; Giron, J.; Koutsidis, G.; Ames, J.M. Chemical composition, antioxidant activity and sensory evaluation of five different species of brown edible seaweeds. Food Res. Int. 2014, 66, 36–44. [Google Scholar] [CrossRef]
- Lee, S.M.; Lee, J.H. Organic acid and enzyme pretreatment of Laminaria japonica for bio-ethanol production. Appl. Chem. Eng. 2012, 23, 164–168. [Google Scholar]
- Obluchinskaya, E.D. Comparative chemical composition of the barents sea brown algae. Appl. Biochem. Microbiol. 2008, 44, 305–309. [Google Scholar] [CrossRef]
- Horn, S.J. Bioenergy from Brown Seaweeds. Ph.D Thesis, Norwegian University of Science and Technology, Trondheim, Norwa, November 2000. [Google Scholar]
- Kloareg, B.; Quatrano, R.S. Structure of cell walls of marine algae and ecophysiological funtions of the matrix polysaccharides. Oceanogr. Mar. Biol. 1988, 26, 259–315. [Google Scholar]
- Sivec, R.; Grilc, M.; Hus, M.; Likozar, B. Multiscale modeling of (hemi)cellulose hydrolysis and cascade hydrotreatment of 5-hydroxymethylfurfural, furfural, and levulinic acid. Ind. Eng. Chem. Res. 2019, 58, 16018–16032. [Google Scholar] [CrossRef]
- Mamilla, J.L.K.; Novak, U.; Grile, M.; Likozar, B. Natural deep eutectic solvents (DES) for fractionation of waste lignocellulosic biomass and its cascade conversion to value-added bio-based chemical. Biomass Bioenerg. 2019, 120, 417–425. [Google Scholar] [CrossRef]
- De Jong, E.d.; Higson, A.; Walsh, P.; Wellisch, M. Biorefineries and the Bio-Based Economy. In Bio-Based Chemicals: Value Added Products from Biorefineries; IEA Bioenergy - Task 42 Biorefinery; IEA Bioenergy: Wageningen, The Netherlands, 2019. [Google Scholar]
- Xu, S.Y.; Huang, X.; Cheong, K.L. Recent Advances in Marine Algae Polysaccharides: Isolation, Structure, and Activities. Mar. Drugs 2017, 15, 388. [Google Scholar] [CrossRef]
- Hocevar, B.; Grile, M.; Likozar, B. Aqueous dehydration, hydrogenation, and hydrodeoxygenation reactions of bio-based mucic acid over Ni, NiMo, Pt, Rh, and Ru on neutral or acidic catalyst supports. Catalysts 2019, 9, 286. [Google Scholar] [CrossRef]
- Amamou, S.; Sambusiti, C.; Monlau, F.; Dubreucq, E.; Barakat, A. Mechano-enzymatic deconstruction with a new enzymatic cocktail to enhance enzymatic hydrolysis and bioethanol fermentation of two macroalgae species. Molecules 2018, 23, 174. [Google Scholar] [CrossRef] [PubMed]
- Yoon, M.C.; Choi, J.I.; Lee, J.W.; Park, D.H. Improvement of saccharification process for bioethanol production from Undaria sp. by gamma irradiation. Radiat. Phys. Chem. 2012, 81, 999–1002. [Google Scholar] [CrossRef]
- Horn, S.J.; Aasen, I.M.; Ostgaard, K. Ethanol production from seaweeds extract. J. Ind. Microbiol. Biotechnol. 2000, 25, 249–254. [Google Scholar] [CrossRef]
- Kim, N.J.; Li, H.; Jung, K.; Chang, H.N.; Lee, P.C. Ethanol production from marine algal hydrolysates using Escherichia coli KO11. Bioresource Technol. 2011, 102, 7466–7469. [Google Scholar] [CrossRef] [PubMed]
- Lee, S.M.; Yu, B.J.; Kim, Y.M.; Choi, S.J.; Ha, J.M.; Lee, J.H. Production of bio-ethanol from agar using Saccharomyces cerevisiae. J. Korean Ind. Eng. Chem. 2009, 20, 290–295. [Google Scholar]
- Khambhaty, Y.; Mody, K.; Gandhi, M.R.; Thampy, S.; Maiti, P.; Brahmbhatt, H.; Eswaran, K.; Ghosh, P.K. Kappaphycus alvarezii as a source of bioethanol. Bioresource Technol. 2012, 103, 180–185. [Google Scholar] [CrossRef]
- Meinita, M.D.N.; Kang, J.Y.; Jeong, G.T.; Koo, H.M.; Park, S.M.; Hong, Y.K. Bioethanol production from the acid hydrolysate of the carrageenophyte Kappaphycus alvarezii(cottonii). J. Appl. Phycol. 2012, 24, 857–862. [Google Scholar] [CrossRef]
- Wang, X.; Liu, X.; Wang, G. Two-stage hydrolysis of invasive algal feedstock for ethanol fermentation. J. Integr. Plant Biol. 2011, 53, 246–252. [Google Scholar] [CrossRef]
- Yazdani, P.; Zamani, A.; Karimi, K.; Taherzadeh, M.J. Characterization of Nizimuddinia zanardini macroalgae biomass composition and its potential for biofuel production. Bioresource Technol. 2015, 176, 196–202. [Google Scholar] [CrossRef]
- Yeon, J.H.; Lee, S.E.; Choi, W.Y.; Kang, D.H.; Lee, H.Y.; Jung, K.H. Repeated-batch operation of surface-aerated fermentor for bioethanol production from the hydrolysate of seaweed Sargassum sagamianum. J. Microbiol. Biotechnol. 2011, 21, 323–331. [Google Scholar] [CrossRef] [PubMed]
- Okuda, K.; Oka, K.; Onda, A.; Kajiyoshi, K.; Hiraoka, M.; Yanagisawa, K. Hydrothermal fractional pretreatment of sea algae and its enhanced enzymatic hydrolysis. J. Chem. Technol. Biotechnol. 2008, 83, 836–841. [Google Scholar] [CrossRef]
- Han, J.G.; Oh, S.H.; Choi, W.Y.; Kwon, J.W.; Seo, H.B.; Jeong, K.H.; Kang, D.H.; Lee, H.Y. Enhancement of saccharification yield of Ultra pertusa kjellman for ethanol production through high temperature liquefaction process. KSBB J. 2010, 25, 357–362. [Google Scholar]
- Adams, J.M.; Gallagher, J.A.; Donnisin, I. Fermentation study on Saccharina latissima for bioethanol production considering variable pre-treatments. J. Appl. Phycol. 2009, 21, 569–574. [Google Scholar] [CrossRef]
- Hou, X.; Hansen, J.H.; Bjerre, A.B. Integrated bioethanol and protein production from brown seaweed Laminaria digitata. Bioresource Technol. 2015, 197, 310–317. [Google Scholar] [CrossRef]
- Ravanal, M.C.; Pezoa-Conte, R.; Von Schoultz, S.; Hemming, J.; Salazar, O.; Anugwom, I.; Jogunola, O.; Maki-Arvela, P.; Willfor, S.; Mikkola, J.P.; et al. Comparison of different types of pretreatment and enzymatic saccharification of Macrocystis pyrifera for the production of biofuel. Algal Res. 2016, 13, 141–147. [Google Scholar] [CrossRef]
- Yanagisawa, M.; Nakamura, K.; Ariga, O.; Nakasaki, K. Production of high concentrations of bioethanol from seaweeds that contain easily hydrolyzable polysaccharides. Process Biochem. 2011, 46, 2111–2116. [Google Scholar] [CrossRef]
- Jung, K.W.; Kim, D.H.; Shin, H.S. Fermentative hydrogen production from Laminaria japonica and optimization of thermal pretreatment conditions. Bioresource Technol. 2011, 102, 2745–2750. [Google Scholar] [CrossRef]
- Hong, I.K.; Jeon, H.; Lee, S.B. Comparison of red, brown and green seaweeds on enzymatic saccharification process. J. Ind. Eng. Chem. 2014, 20, 2687–2691. [Google Scholar] [CrossRef]
- Manns, D.; Deutschle, A.L.; Saake, B.; Meyer, A.S. Methodology for quantitative determination of the carbohydrate composition of brown seaweeds (Laminariaceae). RSC Adv. 2014, 4, 25736–25746. [Google Scholar] [CrossRef]
- Chades, T.; Scully, S.M.; Ingvadottir, E.M.; Orlygsson, J. Fermentation of mannitol extracts from brown macro algae by Thermophilic Clostridia. Front Microbiol. 2018, 9, 1931–1943. [Google Scholar] [CrossRef] [PubMed]
- Miller, G.L. Use of dinitrosalicylic acid reagent for determination of reducing sugars. Anal. Chem. 1959, 31, 426–428. [Google Scholar] [CrossRef]
- Negrulescu, A.; Patrulea, V.; Mincea, M.M.; Ionascu, C.; Vlad-Oros, B.A.; Ostafe, V. Adapting the reducing sugars method with dinitrosalicylic acid to microtiter plates and microwave heating. J. Braz. Chem. Soc. 2012, 23, 2176–2182. [Google Scholar] [CrossRef]
- Wu, J.; Elliston, A.; Le Gall, G.; Colquhoun, I.J.; Collins, A.R.A.; Wood, I.P.; Dicks, J.; Roberts, I.N.; Waldron, K.W. Optimising conditions for bioethanol production from rice husk and rice straw: Effects of pre-treatment on liquor composition and fermentation inhibitors. Biotechnol. Biofuels 2018, 11, 62–74. [Google Scholar] [CrossRef] [PubMed]
- Phwan, C.K.; Chew, K.W.; Sebayang, A.H.; Ong, H.C.; Ling, T.C.; Malek, M.A.; Ho, Y.C.; Show, P.L. Effects of acids pre-treatment on the microbial fermentation process for bioethanol production from microalgae. Biotechnol. Biofuels 2019, 12, 191–198. [Google Scholar] [CrossRef] [PubMed]
- ISO (International Organization for Standardization) 5725-6. Accuracy (Trueness and Precision) of Measurement Methods and Results.; Part 6: Use in Practice of Accuracy Values; ISO: Geneva, Switzerland, 1994. [Google Scholar]
- Montgomery, D.C. Design and Analysis of Experiments, 5th ed.; John Wiley & Sons: Hoboken, NJ, USA, 2000; ISBN 9780471316497. [Google Scholar]
- Rosner, B. Fundamentals of Biostatistics, 7th ed.; Cengage Learning: Boston, MA, USA, 2006; ISBN 9780538733496. [Google Scholar]
- Reed, G.F.; Lynn, F.; Meade, B.D. Use of coefficient of variation in assessing variability of quantitative assays. Clin. Diagn. Lab. Immunol. 2002, 9, 1235–1239. [Google Scholar] [CrossRef]
- Joglekar, A.M.; May, A.T. Product excellence through design of experiments. Cereal Foods World 1987, 32, 857–868. [Google Scholar]
- AOAC (Association of Official Analytical Chemists). Guidelines for Standard Method Performance Requirements; Official Methods of Analysis, Appendix F; AOAC International: Gaithersburg, MD, USA, 2016; Available online: http://www.eoma.aoac.org/app_f.pdf (accessed on 10 September 2019).
- Kostas, E.T.; White, D.A.; Du, C.; Cook, D.J. Selection of yeast strains for bioethanol production from UK seaweeds. J. Appl. Phycol. 2016, 28, 1427–1441. [Google Scholar] [CrossRef]
- Song, B.B.; Kim, S.K.; Jeong, G.T. Enzymatic hydrolysis of marine algae Hizikia fusiforme. KSBB J. 2011, 26, 347–351. [Google Scholar] [CrossRef][Green Version]
- Borines, M.G.; De Leon, R.L.; Cuello, J.L. Bioethanol production from the macroalgae Sargassum spp. Bioresource Technol. 2013, 138, 22–29. [Google Scholar] [CrossRef]
- Duraisamy, S.; Ramasamy, G.; Kumarasamy, A.; Balakrishan, S. Evaluation of the saccharification and fermentation process of two different seaweeds for an ecofriendly bioethanol production. Biocatal. Agric. Biotechnol. 2018, 14, 444–449. [Google Scholar]


| Seaweed | Species | Carbohydrate | Protein (% Dry Weight) | Lipid | Ash | Country | Ref. |
|---|---|---|---|---|---|---|---|
| Laminaria spp. | L. japonica | 51.9 | 14.8 | 1.8 | 31.5 | South Korea | [17] |
| L. japonica | 59.7 | 9.4 | 2.4 | 28.5 | South Korea | [30] | |
| L. japonica | 51.5 | 8.4 | 1.3 | 38.8 | South Korea | [31] | |
| L. digitata (August) | 64.2 | 3.1 | 1.0 | 11.9 | Denmark | [32] | |
| L. digitata (July) | 77.4 | 4.0 | 0.5 | 18.1 | Iceland | [33] | |
| Mean ± SD | 60.9 ± 10.7 | 7.9 ± 4.7 | 1.4 ± 0.7 | 25.8 ± 10.7 |
| Factors | Unit | Levels | ||||
|---|---|---|---|---|---|---|
| Actual, Coded | −1 | 0 | +1 | |||
| Enzyme dose, A | % | 7.5 | 8 | 8.5 | 9 | 9.5 |
| Hydrolysis time, B | h | 26 | 27 | 28 | 29 | 30 |
| pH, C | - | 3.7 | 3.9 | 4.1 | 4.3 | 4.5 |
| Temp., D | °C | 40 | 42 | 44 | 46 | 48 |
| Source | Sum of Squares | DF * | Mean Square | F-Value | p-Value | Remark |
|---|---|---|---|---|---|---|
| Model | 27819.86 | 14 | 1987.13 | 8.76 | <0.0001 | significant |
| A | 33.21 | 1 | 33.21 | 0.1463 | 0.7071 | |
| B | 1012.57 | 1 | 1012.57 | 4.46 | 0.0507 | |
| C | 352.28 | 1 | 352.28 | 1.55 | 0.2307 | |
| D | 2108.06 | 1 | 2108.06 | 9.29 | 0.0077 | significant |
| AB | 137.89 | 1 | 137.89 | 0.6076 | 0.4471 | |
| AC | 66.46 | 1 | 66.46 | 0.2929 | 0.5958 | |
| AD | 424.05 | 1 | 424.05 | 1.87 | 0.1905 | |
| BC | 25.48 | 1 | 25.48 | 0.1123 | 0.7419 | |
| BD | 2055.04 | 1 | 2055.04 | 9.06 | 0.0083 | significant |
| CD | 11.58 | 1 | 11.58 | 0.0510 | 0.8242 | |
| 1510.90 | 1 | 1510.90 | 6.66 | 0.0201 | significant | |
| 782.22 | 1 | 782.22 | 3.45 | 0.0819 | ||
| 10291.99 | 1 | 10291.99 | 45.35 | <0.0001 | significant | |
| 13172.48 | 1 | 13172.48 | 58.04 | <0.0001 | significant |
| Sample | Glucose g/L | G + L g/L | Average | Recovery (%) | Stand. Dev. | C.V. (%) |
|---|---|---|---|---|---|---|
| 1 | 0.5 | 0.655 0.654 0.647 | 0.652 | 98.247 | 0.004 | 0.661 |
| 2 | 1.0 | 1.122 1.136 1.135 | 1.131 | 97.003 | 0.008 | 0.669 |
| 3 | 1.5 | 1.641 1.634 1.632 | 1.636 | 98.316 | 0.005 | 0.294 |
| Laminaria japonica extract Recovery Average(%) | 0.161 | 97.855 | 0.541 |
| Brown Algae | Hydrolysis Condition | RSy (mg/g DW) | Ref. |
|---|---|---|---|
| Laminaria japonica | Celluclast® 1.5L (8.2 % v/w, 43 °C, pH 4.1, 26 h) | 118 | This study |
| Laminaria japonica | HCl (0.1N, 121 °C 15 min) | 94 | [17] |
| Laminaria japonica | (0.5 M, 121 °C, 15 min) | 85 | [44] |
| Hizikia fusiforme | Viscozyme L/Novozyme 188 = 9 : 1, (30% of substrate weight, 50 °C, 150 rpm, 24 h) | 89 | [45] |
| Sargassum spp. | (1% w/v, 126 °C, 30 min) and 50FPU Cellulase and 250CBU Cellobiase (50 °C, pH 4.8, 100 rpm 48 h) | 80 | [46] |
| Sargassum spp. | (3% w/v, 121 °C, 30 min) and 53FPU Cellulase and 10U Pectinase (50 °C, pH 5, 150 rpm, 4 h) | 110 | [47] |
© 2020 by the authors. Licensee MDPI, Basel, Switzerland. This article is an open access article distributed under the terms and conditions of the Creative Commons Attribution (CC BY) license (http://creativecommons.org/licenses/by/4.0/).
Share and Cite
Park, E.Y.; Park, J.K. Enzymatic Saccharification of Laminaria japonica by Cellulase for the Production of Reducing Sugars. Energies 2020, 13, 763. https://doi.org/10.3390/en13030763
Park EY, Park JK. Enzymatic Saccharification of Laminaria japonica by Cellulase for the Production of Reducing Sugars. Energies. 2020; 13(3):763. https://doi.org/10.3390/en13030763
Chicago/Turabian StylePark, Eun Young, and Jung Kyu Park. 2020. "Enzymatic Saccharification of Laminaria japonica by Cellulase for the Production of Reducing Sugars" Energies 13, no. 3: 763. https://doi.org/10.3390/en13030763
APA StylePark, E. Y., & Park, J. K. (2020). Enzymatic Saccharification of Laminaria japonica by Cellulase for the Production of Reducing Sugars. Energies, 13(3), 763. https://doi.org/10.3390/en13030763