Article

Impacts of Initial Sugar, Nitrogen and Calcium Carbonate on Butanol Fermentation from Sugarcane Molasses by Clostridium beijerinckii

by
Patthranit Narueworanon
1,
Lakkana Laopaiboon
2,3,
Niphaphat Phukoetphim
2 and
Pattana Laopaiboon
2,4,*
1
Graduate School, Khon Kaen University, Khon Kaen 40002, Thailand
2
Department of Biotechnology, Faculty of Technology, Khon Kaen University, Khon Kaen 40002, Thailand
3
Center for Alternative Energy Research and Development, Khon Kaen University, Khon Kaen 40002, Thailand
4
Fermentation Research Center for Value Added Agricultural Products, Khon Kaen University, Khon Kaen 40002, Thailand
*
Author to whom correspondence should be addressed.
Energies 2020, 13(3), 694; https://doi.org/10.3390/en13030694
Submission received: 3 January 2020 / Revised: 20 January 2020 / Accepted: 3 February 2020 / Published: 5 February 2020
(This article belongs to the Section A4: Bio-Energy)

Abstract

:
Low-cost nitrogen sources, i.e., dried spent yeast (DSY), rice bran (RB), soybean meal (SM), urea and ammonium sulfate were used for batch butanol fermentation from sugarcane molasses by Clostridium beijerinckii TISTR 1461 under anaerobic conditions. Among these five low-cost nitrogen sources, DSY at 1.53 g/L (nitrogen content equal to that of 1 g/L of yeast extract) was found to be the most suitable. At an initial sugar level of 60 g/L, the maximum butanol concentration (PB), productivity (QB) and yield (YB/S) were 11.19 g/L, 0.23 g/L·h and 0.31 g/g, respectively. To improve the butanol production, the concentrations of initial sugar, DSY and calcium carbonate were varied using response surface methodology (RSM) based on Box–Behnken design. It was found that the optimal conditions for high butanol production were initial sugar, 50 g/L; DSY, 6 g/L and calcium carbonate, 6.6 g/L. Under these conditions, the highest experimental PB, QB and YB/S values were 11.38 g/L, 0.32 g/L·h and 0.40 g/g, respectively with 50% sugar consumption (SC). The PB with neither DSY nor CaCO3 was only 8.53 g/L. When an in situ gas stripping system was connected to the fermenter to remove butanol produced during the fermentation, the PB was increased to 15.33 g/L, whereas the YB/S (0.39 g/g) was not changed. However, the QB was decreased to 0.21 g/L·h with 75% SC.

1. Introduction

Interest in liquid biofuel production continues to grow. The primary reasons for this are a realization of our dependence on petroleum reserves that will one day be exhausted, concern about greenhouse gas emissions from the use of fossil fuels, and the emerging global climate change crisis. Ethanol is the most prominent of the renewable liquid biofuels, even with its drawbacks, i.e., lower energy content than gasoline, blending limitations with gasoline, and the need for corrosion resistant containers and pipes. The current pipeline infrastructure cannot be used to transport ethanol because of corrosion issues [1]. The acetone-butanol-ethanol (ABE) fermentation process is the most useful for production of fuels and chemicals from renewable resources. Butanol is superior to other fermentation derived fuels, including ethanol [2]. It has a lower vapor pressure than ethanol making it less flammable, safer to transport, and safer to use in combustion engines than ethanol [3].
Butanol can be produced via an ABE fermentation using solventogenic clostridia. It is a two-phase fermentation that produces intracellular acetic and butyric acids with concomitant release into the environment in an acidogenic phase. This is followed by reassimilation of the acids into the cells and conversion into solvents in a solventogenic phase [1]. Wechgama et al. [4] reported that among four clostridia (C. beijerinkii JCM 1390, C. acetobutylicum JCM 7829, C. beijerinkii TISTR 1461 and C. beijerinkii TISTR 1462), C. beijerinkii TISTR 1461 was the most suitable strain for butanol production under the tested conditions. They also found that diluted molasses without nutrient supplementation could be used as a low cost substrate for butanol production by this stain.
Initial sugar concentration and nitrogen sufficiency are important chemical parameters for Clostridium growth and butanol production. Li et al. [5] reported that the optimal initial sugar concentration for butanol production ranged from 40–80 g/L, depending on the Clostridium sp. and substrate used. Yeast extract (YE, 1–5 g/L), a complex nutrient, is widely used as nitrogen source for microbial growth and as a nutrient supplement for butanol [6], ethanol [7] and lactic acid production [8]. However, it is expensive making it unsuitable for industrial scale use. Thus, it is challenge to exploit low-cost nitrogen sources to provide the nutritional requirements for cell growth and butanol fermentation. In this study, dried spent yeast (DSY), rice bran (RB), soybean meal (SM), urea and ammonium sulfate ((NH4)2SO4) were examined as alternative nitrogen substitutes for YE due to their lower cost. Additionally, CaCO3 is used enhance butanol production through its buffering capacity in the fermentation medium [9,10,11].
In this study, sugarcane molasses (a byproduct of the sugar industry) was used as a substrate for butanol production because its low cost and availability in Thailand. Additionally, it contains many nutrients and trace elements that are essential for bacterial growth [12]. The challenges of butanol fermentation are the limitations of low butanol concentration, yield and volumetric productivity due to butanol toxicity to the bacterial cells, and the high cost of nutrient supplementation in fermentation broth. To solve these problems, the alternative nitrogen sources are used to replace YE. Product removal has been proposed to alleviate butanol toxicity using a number of alternative techniques, e.g., pervaporation [13,14], gas stripping [15,16,17,18,19], adsorption [20,21] and liquid–liquid extraction [22]. Among these techniques, gas stripping has been found to be particularly promising. This technique allows selective removal of volatiles from the fermentation broth and uses no membranes. Additionally, it offers simple operation, no harm to the microbial culture, as well as low energy input and capital investment for facilities [2].
The aim of this study was to enhance butanol production efficiency from sugarcane molasses by C. beijerinkii TISTR 1461. Low-cost nitrogen sources (DSY, RB, SM, urea and (NH4)2SO4) were used in place of YE to evaluate their suitability for butanol fermentation. The levels of the carbon source, nitrogen source and CaCO3 were optimized for high butanol production. Additionally, an in situ gas stripping technique was used to improve butanol production.

2. Materials and Methods

2.1. Raw Materials and Nitrogen Supplementation

Sugarcane molasses was donated by Mitr Phuviang Sugar Co., Ltd., Khon Kaen, Thailand. The molasses, containing 80° Bx of total soluble solids, was kept at −20 °C to prevent bacterial growth before its use as a carbon source for butanol production.
Yeast extract (YE), dried spent yeast (DSY), rice bran (RB), soybean meal (SM), urea and ammonium sulfate ((NH4)2SO4) were used as nitrogen sources for butanol production in this study. YE was purchased from Oxoid, UK. DSY was donated by Beer Thip Brewery Co., Ltd., Phra Nakhon Si Ayutthaya, Thailand. RB was purchased from a market in Phetchabun province, Thailand. SM was obtained from a local shop in Khon Kaen, Thailand. Urea and (NH4)2SO4 were purchased from Ajax Finechem Pty Ltd. and BDH, UK.

2.2. Culture Medium Preparation

Modified cooked meat medium (CMM, Oxoid, UK) and tryptone-glucose-yeast extract (TGY) medium were used as media for inoculum preparation (modified from [23]). Modified CMM consisted of (g/L) CMM, 10 and glucose (BDH, UK), 0.08. TGY was composed of (g/L) tryptone (Oxoid, UK), 5; glucose, 1; yeast extract (Oxoid, UK), 5 and K2HPO4 (BDH, UK), 1. Modified CMM and TGY were autoclaved at 121 °C for 15 min. Oxygen in the media was removed with sterile oxygen free nitrogen (OFN) gas using a 0.2 µm pore-size polytetrafluoroethelene (PTFE) membrane filter to create a strictly anaerobic condition.

2.3. Microorganism and Growth Conditions

C. beijerinckii TISTR 1461 was purchased from the Thailand Institute of Scientific and Technological Research (TISTR), Khlong Luang, Pathum Thani, Thailand. It was kept as a spore suspension and stored at 4 °C in sterile distilled water. The spore suspension was heat shocked at 80 °C for 1 min and immediately cooled in iced-water for 1 min [24]. The heat shocked spores (0.5 mL) were transferred into 10 mL of sterile CMM and incubated at 37 °C for 12–14 h to obtain highly motile vegetative cells. The vegetative cells of 5% (v/v) at 0.5 O.D. (optical density at 600 nm) were transferred into 45 mL of sterile TGY medium and cultivated at 37 °C for 3–4 h [24] before use as an inoculum for butanol production.

2.4. Experiments

2.4.1. Effects of Various Nitrogen Sources on Batch Butanol Fermentation

The butanol production medium of this experiment was sugarcane molasses containing a total sugar concentration of 60 g/L and a low-cost nitrogen source with no CaCO3 buffer. Low-cost nitrogen sources, i.e., DSY, RB, SM, urea and (NH4)2SO4 were used at concentrations corresponding to the nitrogen content in 1 g/L of YE. The fermentations were carried out in 1-L screw-capped bottles. Sugarcane molasses containing a total sugar concentration of 60 g/L without nitrogen supplementation was used as a negative control. A synthetic butanol production medium called P2 medium consisting of glucose, 60 g/L and YE, 1 g/L and stock solutions A, B and C was used as a positive control [23]. Stock solution A was composed of (g/L) K2HPO4 (BDH, UK), 50; KH2PO4 (BDH, UK), 50 and ammonium acetate (BDH, UK), 220. Stock solution B was made of (g/L) para-amino-benzoic acid (BDH, UK), 0.1; thiamin (BDH, UK), 0.1 and biotin (Fluka, Switzerland), 0.001. Stock solution C was composed of (g/L) MgSO4·7H2O (Riedel-DeHaen, Seelze, Germany), 20; MnSO4·H2O (BDH, UK), 1; FeSO4·7H2O (Riedel-DeHaen, Germany), 1 and NaCl (BDH, UK), 1. These three stock solutions were sterilized [24]. Then, each sterile stock solution (1%, v/v) was added to the sterile P2 medium. Before batch mode operation, the medium was sparged with OFN gas to create strictly anaerobic conditions and the initial pH of the fermentation broth was adjusted to 6.5 by addition of either NaOH (BDH, UK) or HCl (BDH, UK) [25]. Inoculum at 0.5 O.D. (5%, v/v) was added into all media to initiate batch fermentation. The fermentation temperature was controlled at 37 °C with agitation rate of 100 rpm. Samples were taken at regular time intervals for analysis to determine the nitrogen source giving the maximum butanol production.

2.4.2. Optimization, Experimental Design and Statistical Analysis

To maximize butanol production from sugarcane molasses, three main chemical factors (initial levels of sugar, the nitrogen source determined from Section 2.4.1 and the amount of CaCO3) were optimized using a Box–Behnken design (Table 1). Seventeen experiments were performed to maximize butanol production as shown in Table 2. Batch fermentations were done in 1-L screw-capped bottles containing 0.75 L of sterile butanol production medium. The fermentation conditions were performed as previously described in Section 2.4.1.
All experiments in this study were performed in triplicate and the results were expressed as a mean value ± SD. A Box–Behnken design was used in this work to optimize these three independent variables. Each variable was varied at three levels. The notation a, b and c refers to the independent variables, i.e., initial sugar, nitrogen source and CaCO3, respectively. Experimental design, data analysis, and quadratic modeling were performed using Design-Expert software (Version 7.0, Stat-Ease, Inc., Minneapolis, MN, USA).
A second order model was used to simulate the experimental data as the following equation:
Y = β0 + ∑βixi + ∑∑βijxixj + ∑βiixi2
where Y is the predicted response variable, i.e., the final butanol concentration, β0, βi, βij and βii are regression coefficients, and xi and xj (i = 1, 3; j = 1, 3, ij) are the independent variables. The quality of fit of the model equation is shown by the coefficient of determination, R2 [26].

2.4.3. Verification Experiments

The predicted butanol concentration was also verified with experiments conducted under the optimal conditions predicted by the RSM analysis results in 1-L of screw-capped bottles and in a 2-L stirred-tank reactor (STR) or fermenter (Biostat® B, B Braun Biotech, Melsungen, Germany) with working volumes of 0.75 L and 1.3 L, respectively. This was done to confirm the reliability of the statistical analysis results.

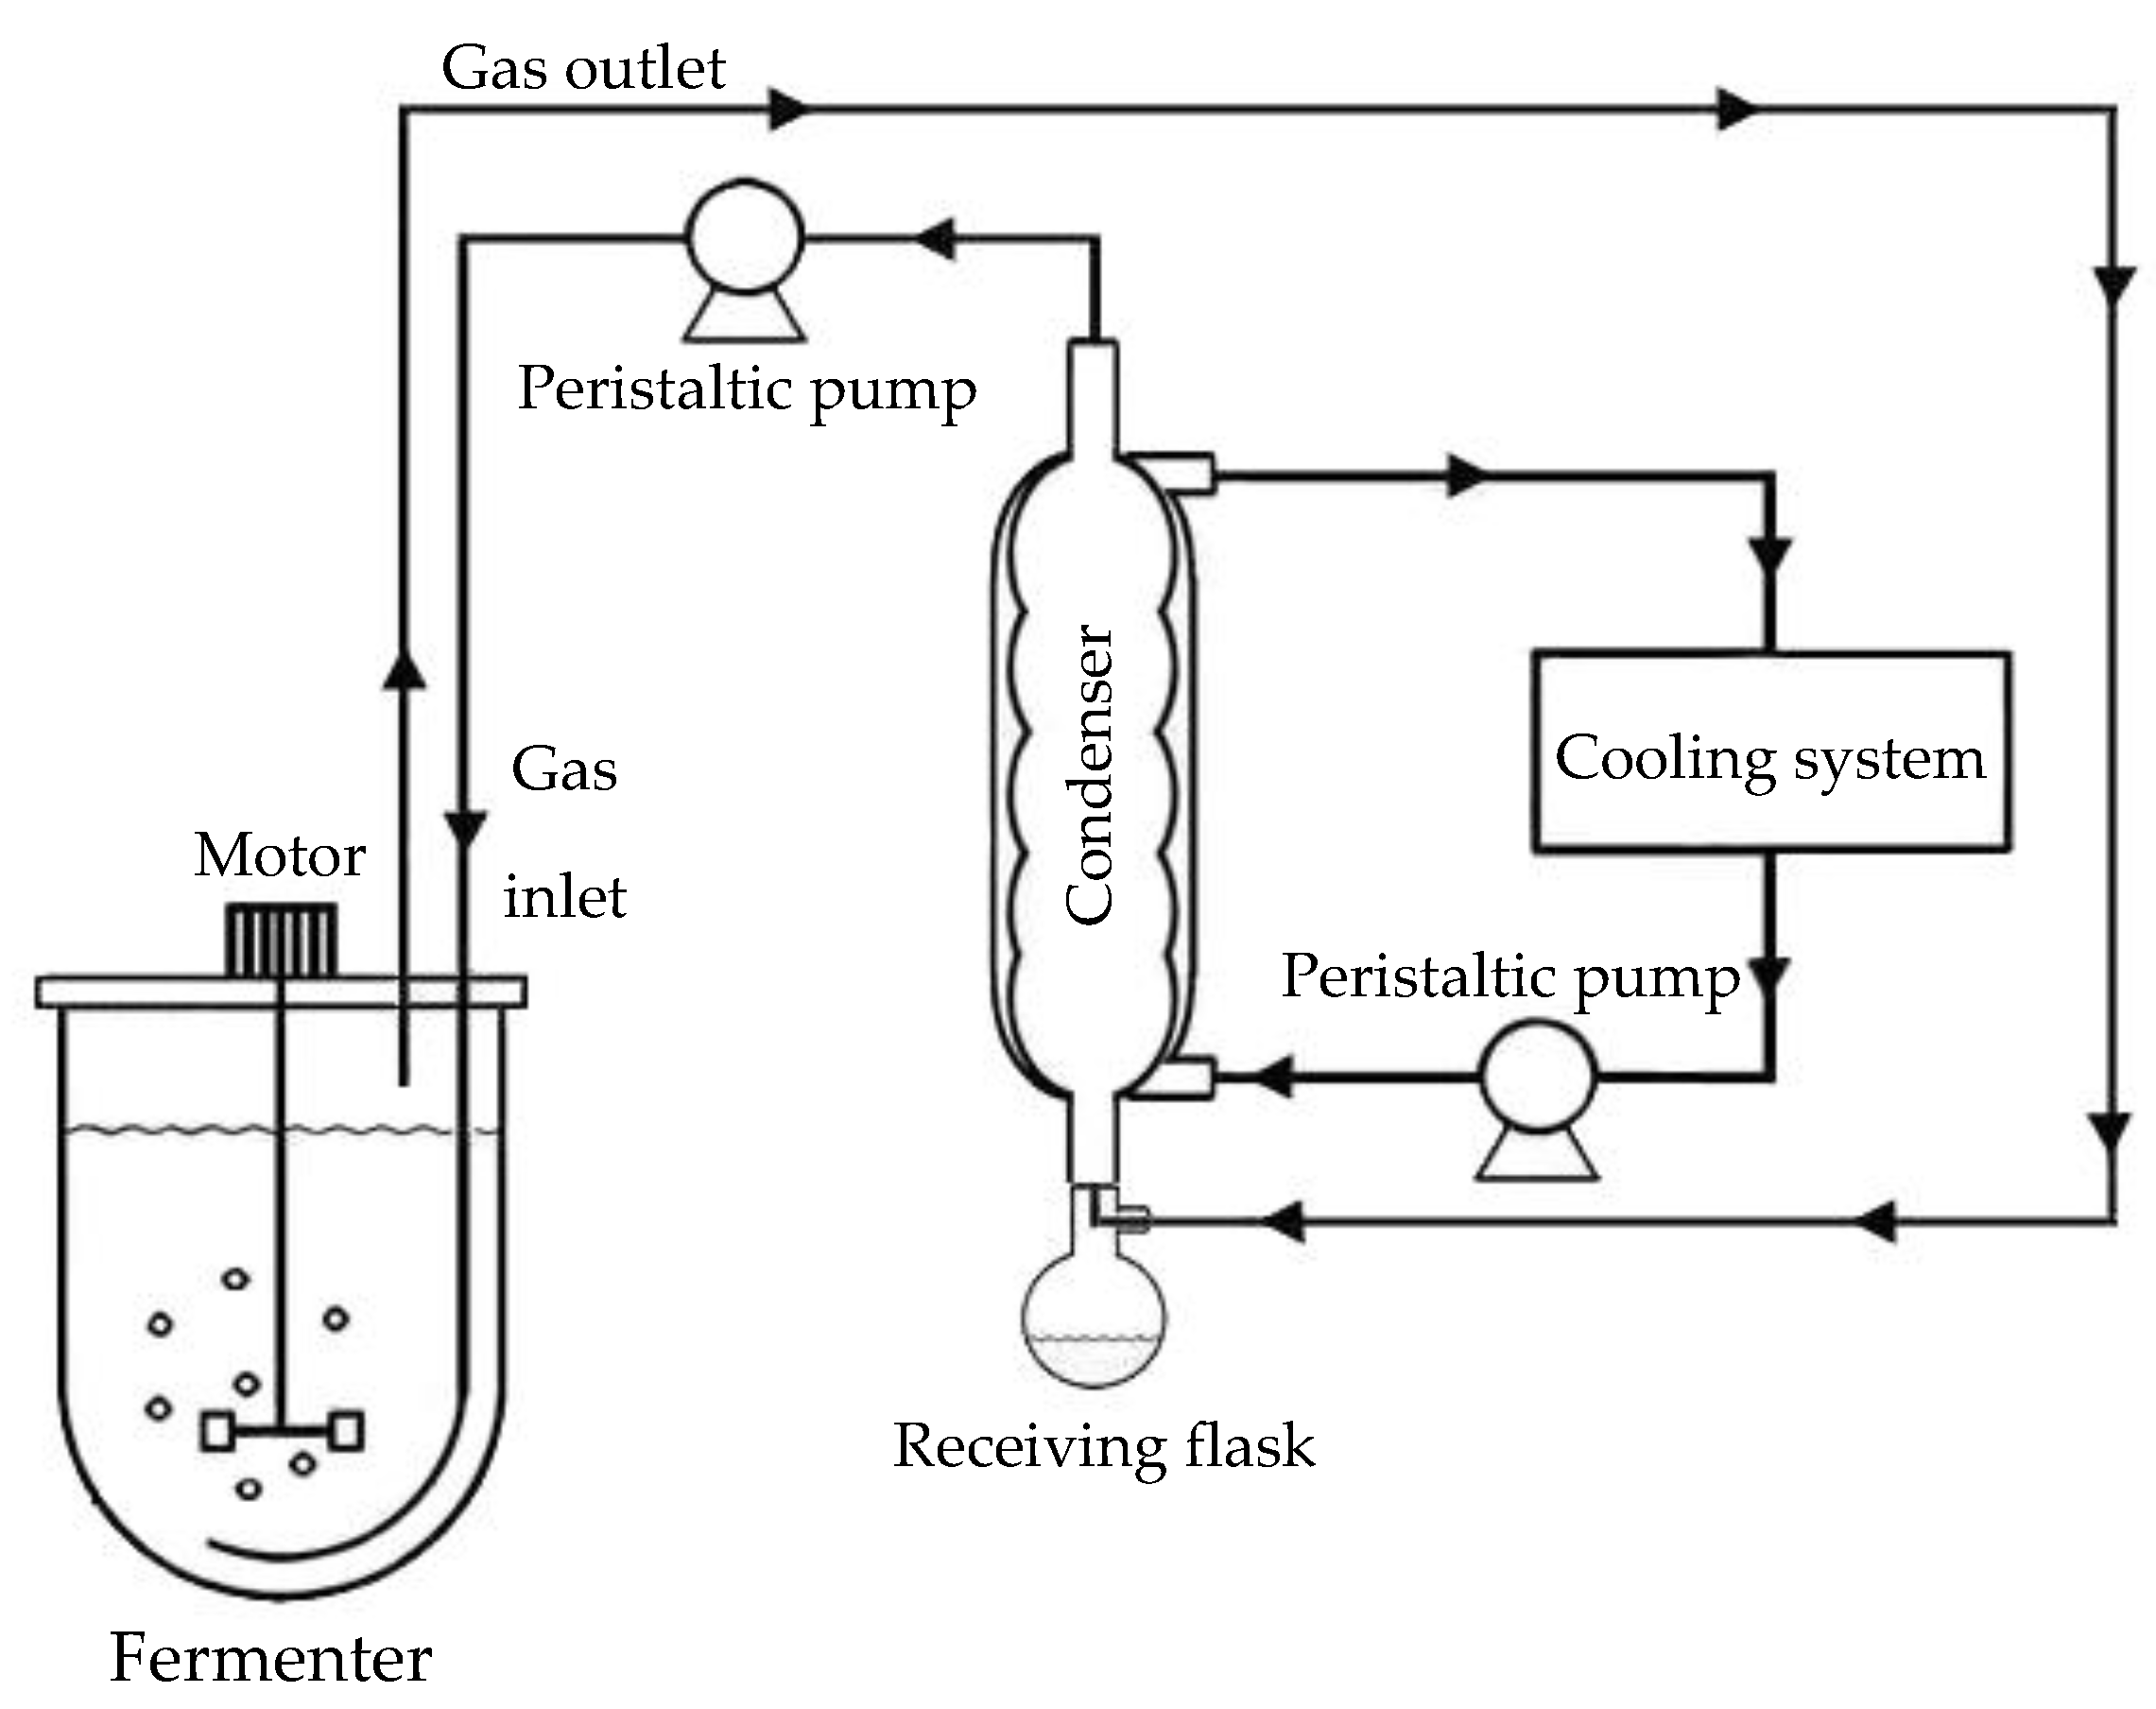
2.4.4. Batch Butanol Fermentation Coupled with a Gas Stripping System

The fermentation was carried out in a 2-L fermenter containing the optimal butanol production medium predicted by the RSM results. A schematic diagram of gas stripping system is shown in Figure 1. Gas stripping was done by circulating the fermentation gas (CO2 and H2) at a flow rate of 1.0 L/min [12] through the fermentation broth in the 2-L fermenter using a peristaltic pump (Watson-Marlow, England). A glass coil condenser (Pyrex Brand Graham Condenser, 300 × 8 mm water jacket, Fisher Scientific, NJ, USA) was maintained at approximately (−2) ± 2 °C [27] using 95% (v/v) ethanol as a coolant. The gas recirculated was in a closed loop to minimize vapor losses into air. The condensate was collected in a cooled trap. The gas stripping system was started after 24 h of fermentation before butanol toxicity became a consideration [27]. Samples were collected periodically from the condensate and the fermentation broth in the fermenter for analysis.

2.5. Analytical Methods

Total carbohydrate, protein, total fat, moisture, fibre, ash and nitrogen contents of YE, DSY, RB and SM were determined by Central Laboratory (Thailand) Co., Ltd., Khon Kaen, Thailand using AOAC methods [28]. All products (solvents and acids) were determined with a gas chromatograph (Shimadzu, GC-2014, Japan) equipped with a flame ionization detector, using a Porapak Q column (3 m × 2 mm). The oven temperature was programmed to produce conditions of 160 °C for 9 min, heating from 160 to 220 °C at an 8 °C/min rise, then held for 12 min at 220 °C. The injector and detector temperatures were set at 220 and 230 °C, respectively. N2 was employed as a carrier gas at a pressure of 150 kPa, and isobutanol was used as an internal standard (modified from [29]). Total sugar concentrations in the fermentation broth were measured using a phenol-sulfuric acid method [30]. Cell growth was determined by measurement of OD600 [31]. The butanol yield (YB/S, g/g) was calculated as the butanol produced divided by the sugar utilized. The volumetric butanol productivity (QB, g/L·h) was calculated as the butanol produced (PB, g/L) divided by the fermentation time giving the highest butanol concentration.

3. Results and Discussion

3.1. Proximate Chemical Composition of Various Nitrogen Sources

The proximate chemical analyses of various nitrogen sources are shown in Table 3. The main component of YE was protein, ~75% dry weight. DSY, SM and RB had lower protein contents than YE. RB contained the highest carbohydrate level, whereas SM had the highest total fat. A higher ash content in YE was observed, indicating that inorganic compounds in YE were at the highest level among the various nitrogen sources. Urea has the highest nitrogen content on a dry weight basis, followed by (NH4)2SO4, YE, DSY, SM and RB.

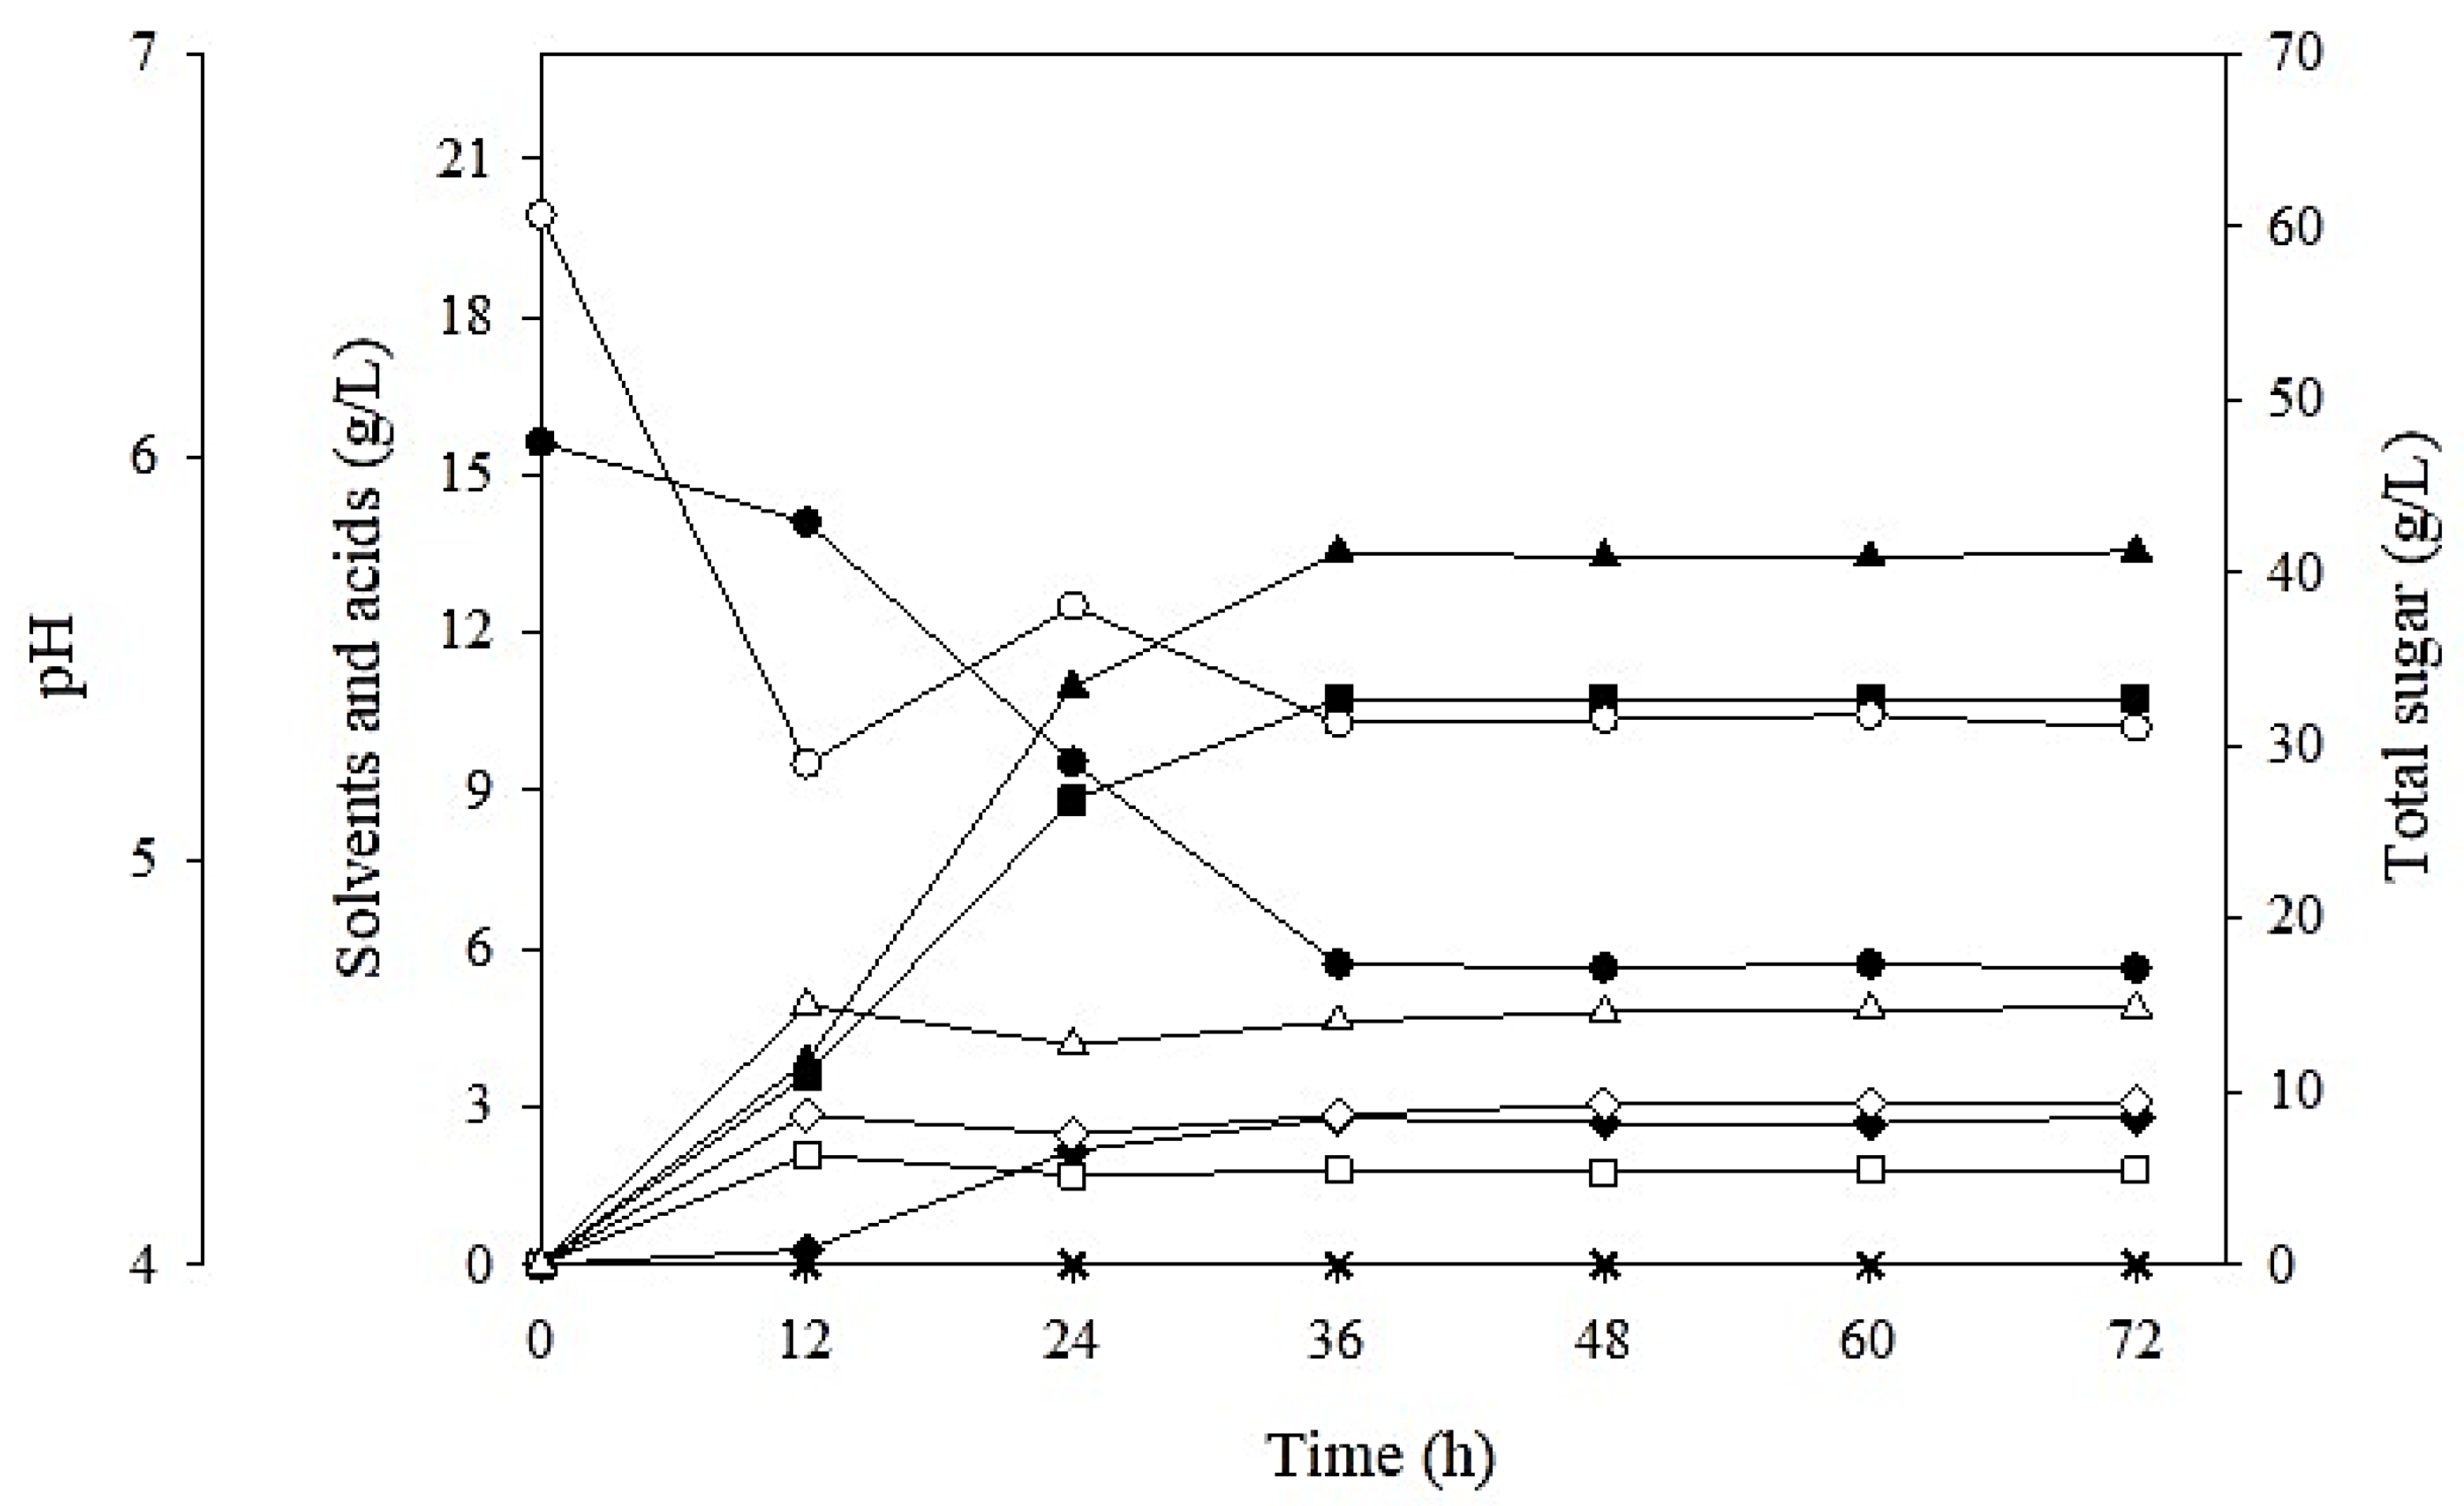
3.2. Effects of Various Nitrogen Sources on Butanol Production

P2 medium is generally used as a synthetic medium for butanol production [23]. It contains 60 g/L of glucose, 1 g/L of YE, phosphate buffer, ammonium acetate, vitamins and minerals. In this study, sugarcane molasses containing 60 g/L of total sugar was first used for butanol production. The butanol concentration (PB) using sugarcane molasses without nutrient supplementation (a negative control treatment) was 8.53 g/L, whereas it was 11.37 g/L using sugarcane molasses supplemented with 1 g/L of YE (Table 4). The results indicated that the nitrogen in molasses was insufficient. Nitrogen supplementation is required to improve butanol production efficiency. Addition of 1 g/L of YE improved butanol concentration by approximately 33% compared to the control treatment, and the YB/S and QB increased to 0.38 g/g and 0.24 g/L·h, respectively.
When 1.53 g/L of DSY, 6.18 g/L of RB, 2.13 g/L of SM, 0.26 g/L of urea and 0.56 g/L of (NH4)2SO4 (corresponding to the nitrogen content of YE, 1 g/L) were used as nitrogen sources for butanol production by C. beijerinkii TISTR 1461, the fermentation profiles using them were similar to that of sugarcane molasses supplemented with YE (Figure 2). Under all conditions tested, the concentration of butanol was higher than that of acetone and ethanol (Table 4). DSY gave the highest PB (11.19 g/L) and QB (0.23 g/L·h), whereas (NH4)2SO4 had the lowest PB (8.54 g/L) and QB (0.14 g/L·h) (Table 4). Although the butanol production rate using YE was slightly higher than when using DSY in the first period of fermentation, the maximum PB value at the end of fermentation under both conditions was not significantly different (Figure 2). Therefore, DSY could be used as a low-cost nitrogen source instead of YE for butanol production. The PB value with DSY supplementation was higher than that using RB, SM, urea and (NH4)2SO4 supplementation. This might have been due to the presence of not only high nitrogen in DSY, but also many essential trace elements that promoted cell growth [32]. Sugar consumption (SC) and YB/S values under all conditions tested were in the range of 27 to 36 g/L and 0.26 to 0.38 g/g, respectively. This suggests that the various nitrogen sources affected metabolic pathways of C. beijerinckii TISTR 1461 for butanol production in different ways. Unfortunately, cell growth could not be detected in this study because of interference of the small particles in sugarcane molasses, rendering optical measurements ineffective. Additionally, RB and SM contained high total fat contents (Table 3), which might make them unsuitable for ABE fermentations as is evidenced by lower PB values [33]. The PB value using (NH4)2SO4 was not different from that of the control (molasses only). This might have been due to the absence of essential trace elements in (NH4)2SO4 for cell growth and fermentation. Based on these results, DSY was chosen as a nitrogen supplement for subsequent experiments. To the best of our knowledge, this is the first report of the use of DSY, a by-product of brewing industry, as a nitrogen supplement for ABE fermentation.

3.3. Batch Butanol Fermentation

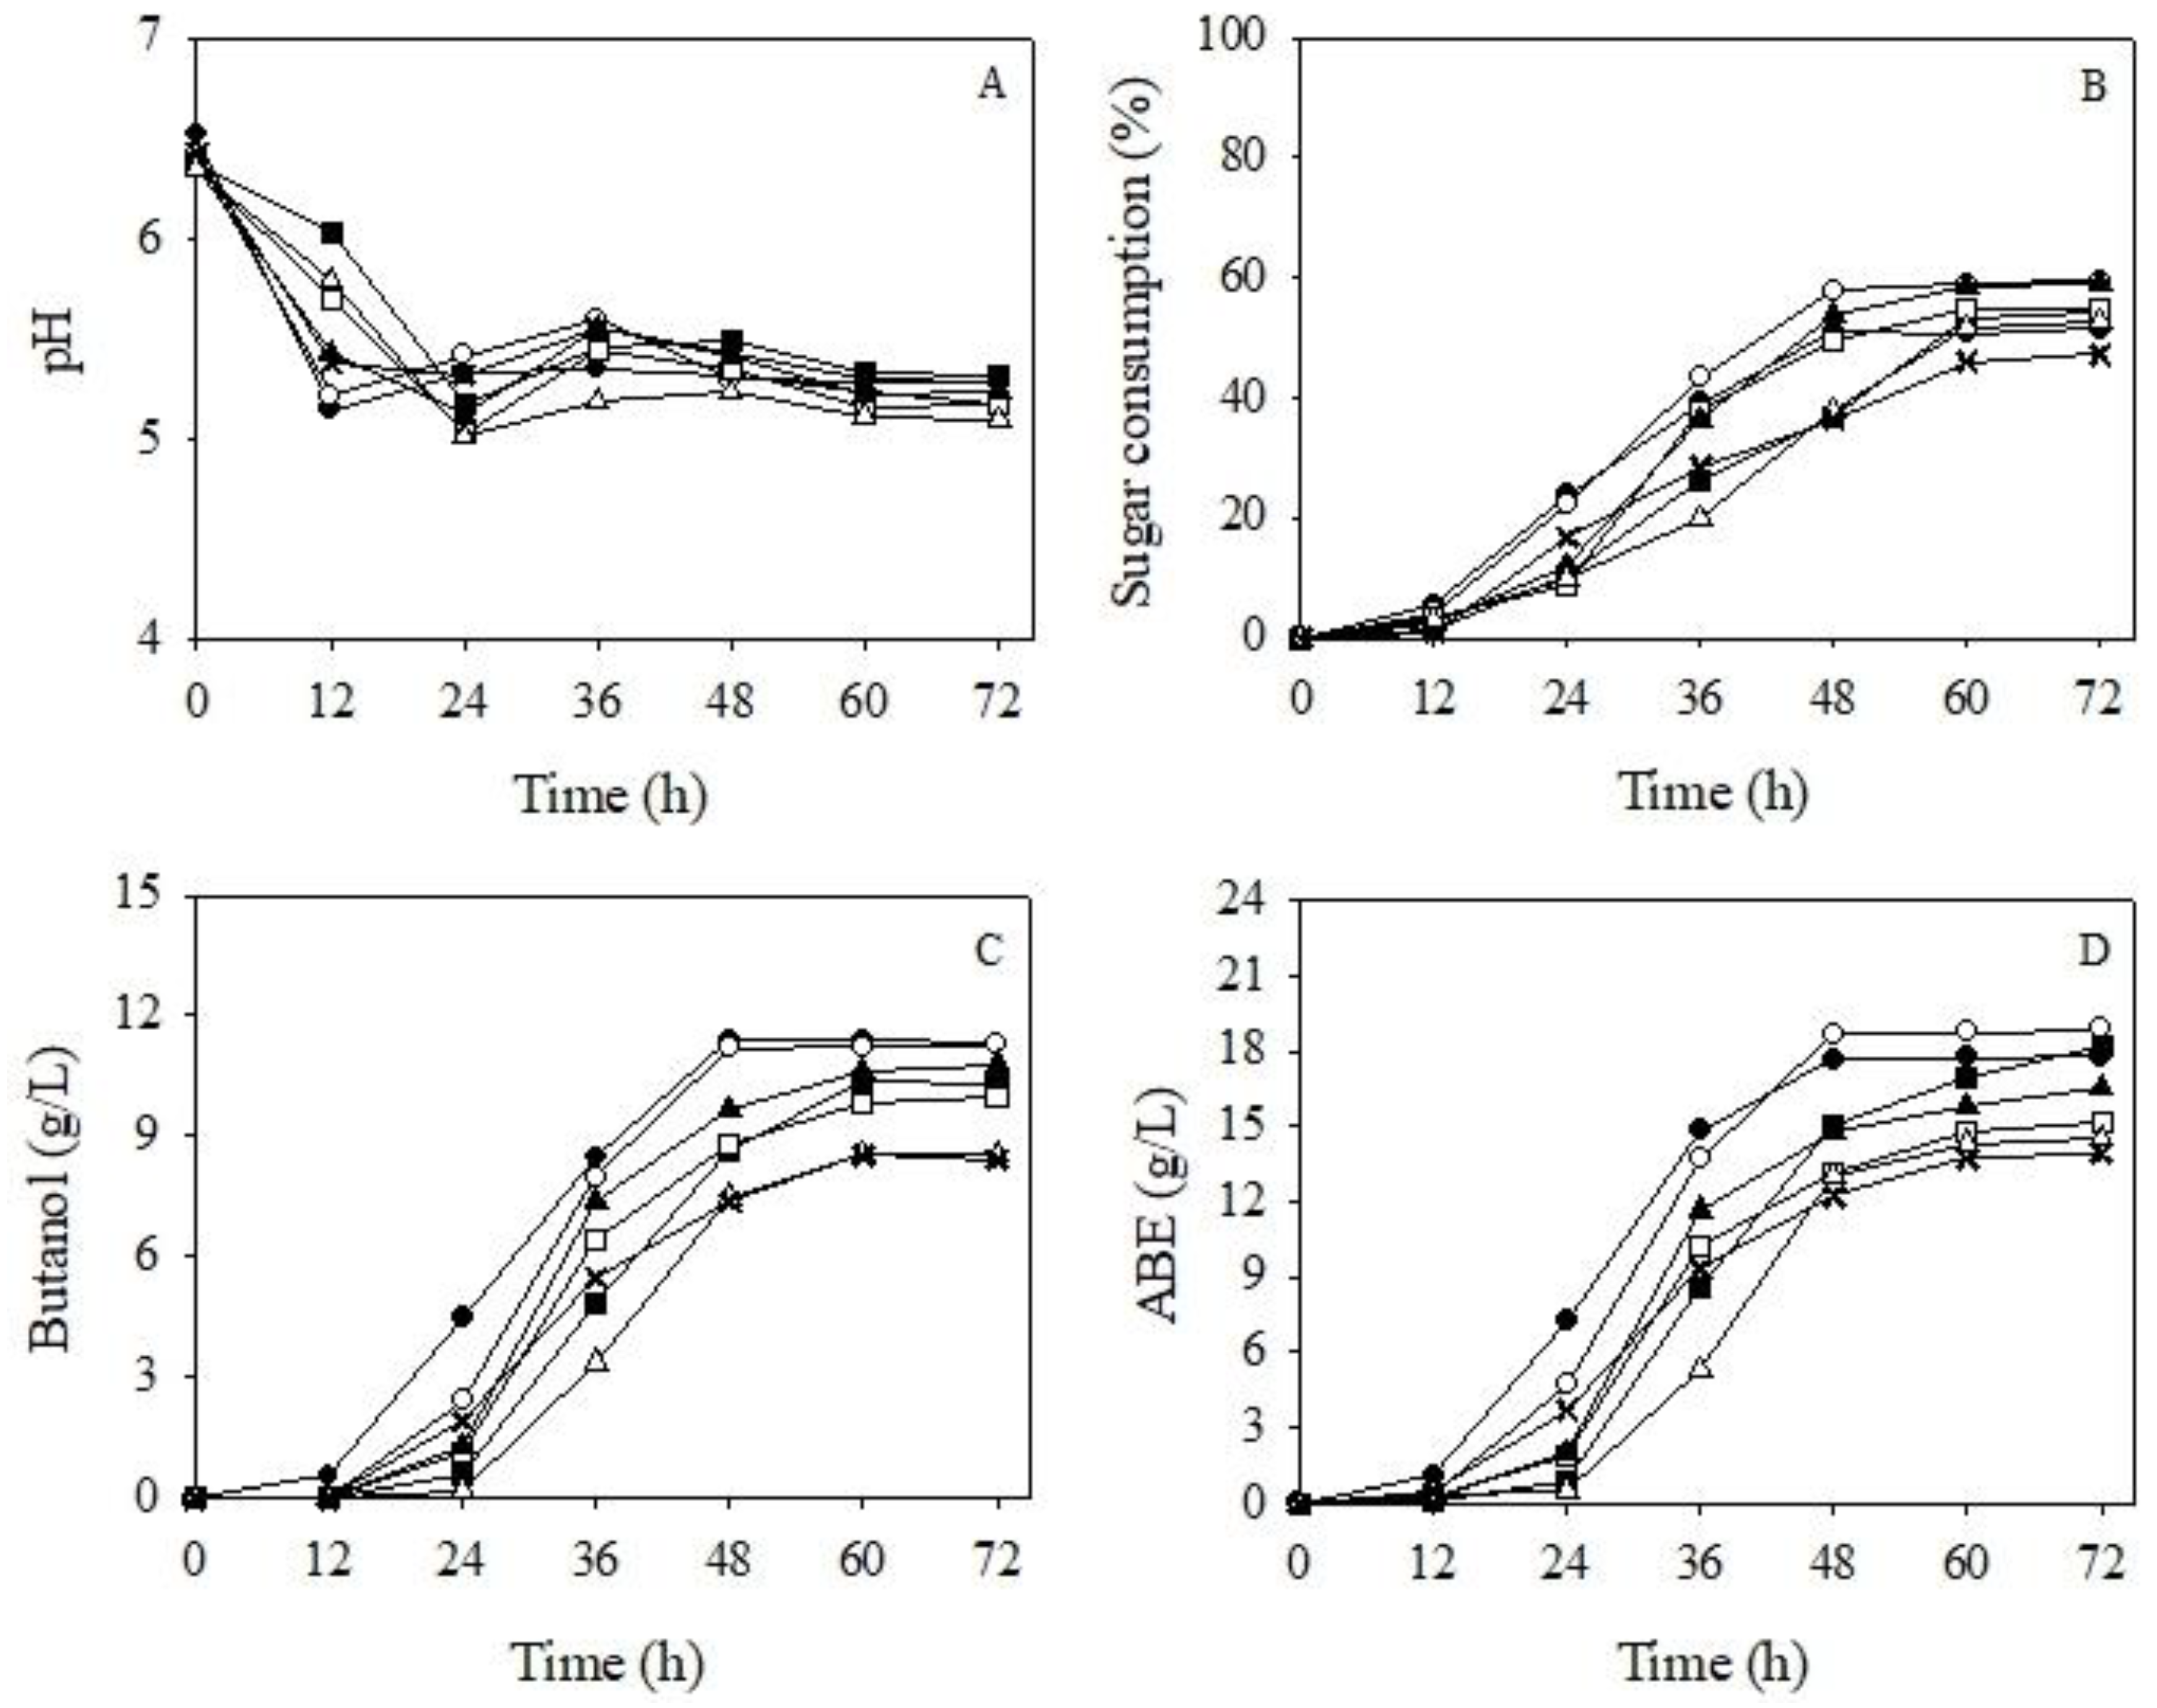
3.3.1. Impact of Initial Sugar, DSY and CaCO3 Concentrations on Butanol Production

Seventeen experimental runs of batch butanol fermentation were carried out (Table 5). The batch profiles of experimental Run 1 (initial sugar, 45 g/L; DSY, 3.06 g/L and CaCO3, 8 g/L) are shown in Figure 3. The pH of the fermented broth decreased from 6.60 to 5.24 after 12 h, due to the production of acetic and butyric acids. This indicates that acidogenesis occurred. After 12 h of ABE fermentation, the pH of the fermented broth increased from 5.24 to 5.63 and high solvent levels (acetone, butanol and ethanol) were observed, indicating that the solventogenesis had occurred. Under this condition, the sugar was not completely consumed by C. beijerinckii TISTR 1461. The total sugar remaining was 17.36 g/L and the PB significantly increased until 36 h to a value of 10.75 g/L. This concentration might cause butanol toxicity to bacterial cells. Al-Shorgani et al. [34] reported that 5 g/L of butanol caused a toxic effect on C. saccharoperbutylacetonicum N1-4, and it was 99.5% inhibited with a PB of 15 g/L. Costa [35] reported that 11 g/L of butanol showed a toxic effect on C. acetobutylicum, and it was totally inhibited at a PB value of 15 g/L. However, this effect depended on the bacterial species and environmental conditions. The profiles of the parameters measured during the batch ABE fermentation of the 16 remaining experimental runs were similar to those of Run 1 (data not shown).
The optimum concentration of three factors (initial sugar, DSY and CaCO3) was determined using the RSM with Box–Behnken design. The 17 experimental runs including five replicates of the central point are shown in Table 5. The results showed that the PB values ranged from 7.29 (Run 15) to 11.50 g/L (Run 4). These values were further used to generate a quadratic polynomial equation to predict the PB values. The equation is as follows:
Y1 = −1.749 + 0.275x1 + 0.441x2 + 0.833x3 + 2.410 × 10−3x1x2 + 6.25 × 10−5x1x3
1.634 × 10−3x2x3 − 2.358 × 10−3x12 − 0.037x22 − 0.051x32
where Y1 is the predicted PB value; x1, x2 and x3 represent initial sugar, DSY and CaCO3 concentrations, respectively.
The Fisher’s F-test for ANOVA analysis (Table 6) was used to evaluate the statistical analysis. The results demonstrated that the model was highly significant (p < 0.05). The p-value for lack of fit was more than 0.05, indicating a lack statistical significance relative to pure error [36]. This model can be considered reliable. Significant effects (p < 0.05) were also observed in the squared terms of initial sugar (A2) and CaCO3 (C2). The coefficient of determination (R2) can be used to determine the suitability of the model. The R2 of the correlation between the experimental and predicted of PB values in this study was 90.29%, confirming that the fitted to the data and these results were acceptable. Additionally, the results showed that initial sugar (A) and DSY (B) had a p-value less than 0.05, demonstrating the significant effects of the initial sugar and DSY concentrations on butanol production.
A 3D response surface plot of initial sugar and DSY concentrations on butanol production is shown in Figure 4A. An increase in the initial sugar and DSY concentration up to an optimal point improved the PB value to a maximal level. However, higher initial sugar (>50 g/L) and DSY (>6 g/L) concentrations did not promote butanol production. Similar results were found in the batch culture of C. saccharoperbutylacetonicum N1-4 grown in synthetic medium [34]. High sugar concentrations, above 50 g/L, decreased the ABE concentrations due to substrate inhibition. Additionally, Li et al. [5] reported that increasing the sugar concentration (>60 g/L) in cane molasses decreased the ABE concentrations. Using DSY as a nitrogen source was an important factor affecting cell growth, as well as solvent and acid production. It was reported that a limited nitrogen supply reduced growth and sugar utilization [37]. Thus, the cell growth phase did not undergo a shift from acid to solvent production even in the presence of excess sugar. In this study, the highest PB value was achieved at 6 g/L of DSY (corresponding to 4 g/L of YE), implying that both permeation of butyric acid and nutrients from the broth to the interior of bacterial cells and the butanol from the inside of the cells to broth could be improved. However, higher DSY (>6 g/L) did not enhance the PB value. This may have been due to distortion of the C:N ratio leading to other metabolic pathways [38]. These results are in agreement with those of Li et al. [5] who used YE as nitrogen source for ABE fermentation by C. beijerinkii MTU3. They reported that maximal butanol production was obtained at 3 g/L of YE and the PB value was reduced at higher YE concentrations (>3 g/L).
Figure 4B shows a 3D response surface plot of initial sugar and CaCO3 concentrations on butanol production, when the DSY concentration was fixed at the center level (6 g/L). The results indicate that a maximal PB was obtained when the initial sugar and CaCO3 concentrations were at the center level. An increase in the initial sugar and CaCO3 concentrations up to the maximum point raised butanol to the optimal level. However, higher initial sugar (>50 g/L) and CaCO3 (>6.6 g/L) concentrations did not boost butanol production. The influence of CaCO3 in sugarcane molasses might be due to its buffering capacity [9,10,11]. The buffering capacity of the fermentation broth under these conditions was obviously not sufficient to keep a constant pH because a decrease in the pH value in the fermentation broth was observed. Isar and Rangaswamy [39] stated that calcium ions were found to support butanol production. Additionally, the effect of pH is known as a key factor in butanol production. Hence, CaCO3 could keep pH at a good level enabling high butanol production. YouSheng et al. [10] demonstrated that butanol production by C. acetobutyricum from an enzymatic hydrolysate of corn straw required 5.04 g/L of CaCO3 for optimal butanol production. This value is close to the CaCO3 concentration used in the current study.
Figure 4C shows a 3D response surface plot of the results of DSY and CaCO3 addition on butanol production at an initial sugar concentration of 50 g/L. A maximal PB was obtained when the amounts of DSY and CaCO3 were at the center level. According to the statistical analysis, the optimum nutrient conditions predicted by the model for maximum PB by C. beijerinkii TISTR 1461 from sugarcane molasses were initial sugar, 50; DSY, 6 and CaCO3, 6.6 g/L. The predicted maximum PB value was 11.40 g/L.

3.3.2. Verification Experiment under the Optimized Medium Composition

The optimal conditions (initial sugar, 50 g/L; DSY, 6 g/L and CaCO3, 6.6 g/L) for the maximal PB value from RSM experiments was verified to confirm the prediction. The PB values under the optimal conditions in 1-L screw-capped bottles and the 2-L fermenter (STR) were 11.38 and 11.42 g/L, respectively (Table 7), which were very close to the predicted value (11.40 g/L). It was found that the QB value under the optimal condition in 1-L screw-capped bottles (0.32 g/L·h) was higher than that in 2-L STR (0.24 g/L·h). This is because the fermentation in the former was 12 h shorter than that in the latter. It might also be due to the effect of mixing. Good mixing occurred in the 1-L screw-capped bottles using a magnetic bar for agitation. In the 2-L STR, a turbine was used for agitation and the bottom of the STR was not flat which might cause incomplete mixing. However, the results indicated that optimum concentrations of initial sugar, DSY and CaCO3 could boost butanol production efficiency (approximately 33% to 34% for PB, 71% to 129% for QB and 29% for YB/S) from sugarcane molasses by C. beijerinckii TISTR 1461. Additionally, it was found that the PB, QB and YB/S values from sugarcane molasses under the optimal condition were slightly higher than those using P2 medium (Table 7). These results suggested that sugarcane molasses with a low cost nitrogen source (DSY) is a suitable substrate for butanol production.
Table 8 summarizes butanol production from various substrates and nutrient supplements. For butanol production from molasses supplemented with nutrients, the PB value in our study was higher than that of the pretreated molasses supplemented with 3 g/L of urea and 3 g/L of (NH4)2SO4 [5]. Additionally, the PB and QB values in our study (supplemented only with DSY and CaCO3) were similar to that of Ni et al. [40] using molasses supplemented with CaCO3, (NH4)2SO4, K2HPO4, corn steep powder and MnSO4·H2O. Comparison of molasses with other substrates for butanol production showed that the PB and QB values when using molasses were relatively higher than those using other substrates (corn, cassava, cheese whey, xylose and sugarcane bagasse hydrolysate). Therefore, it can be concluded that sugarcane molasses is a more suitable feedstock for butanol production than other raw materials, and the butanol production efficiency from the molasses can be improved by addition of appropriate amounts of DSY and CaCO3.

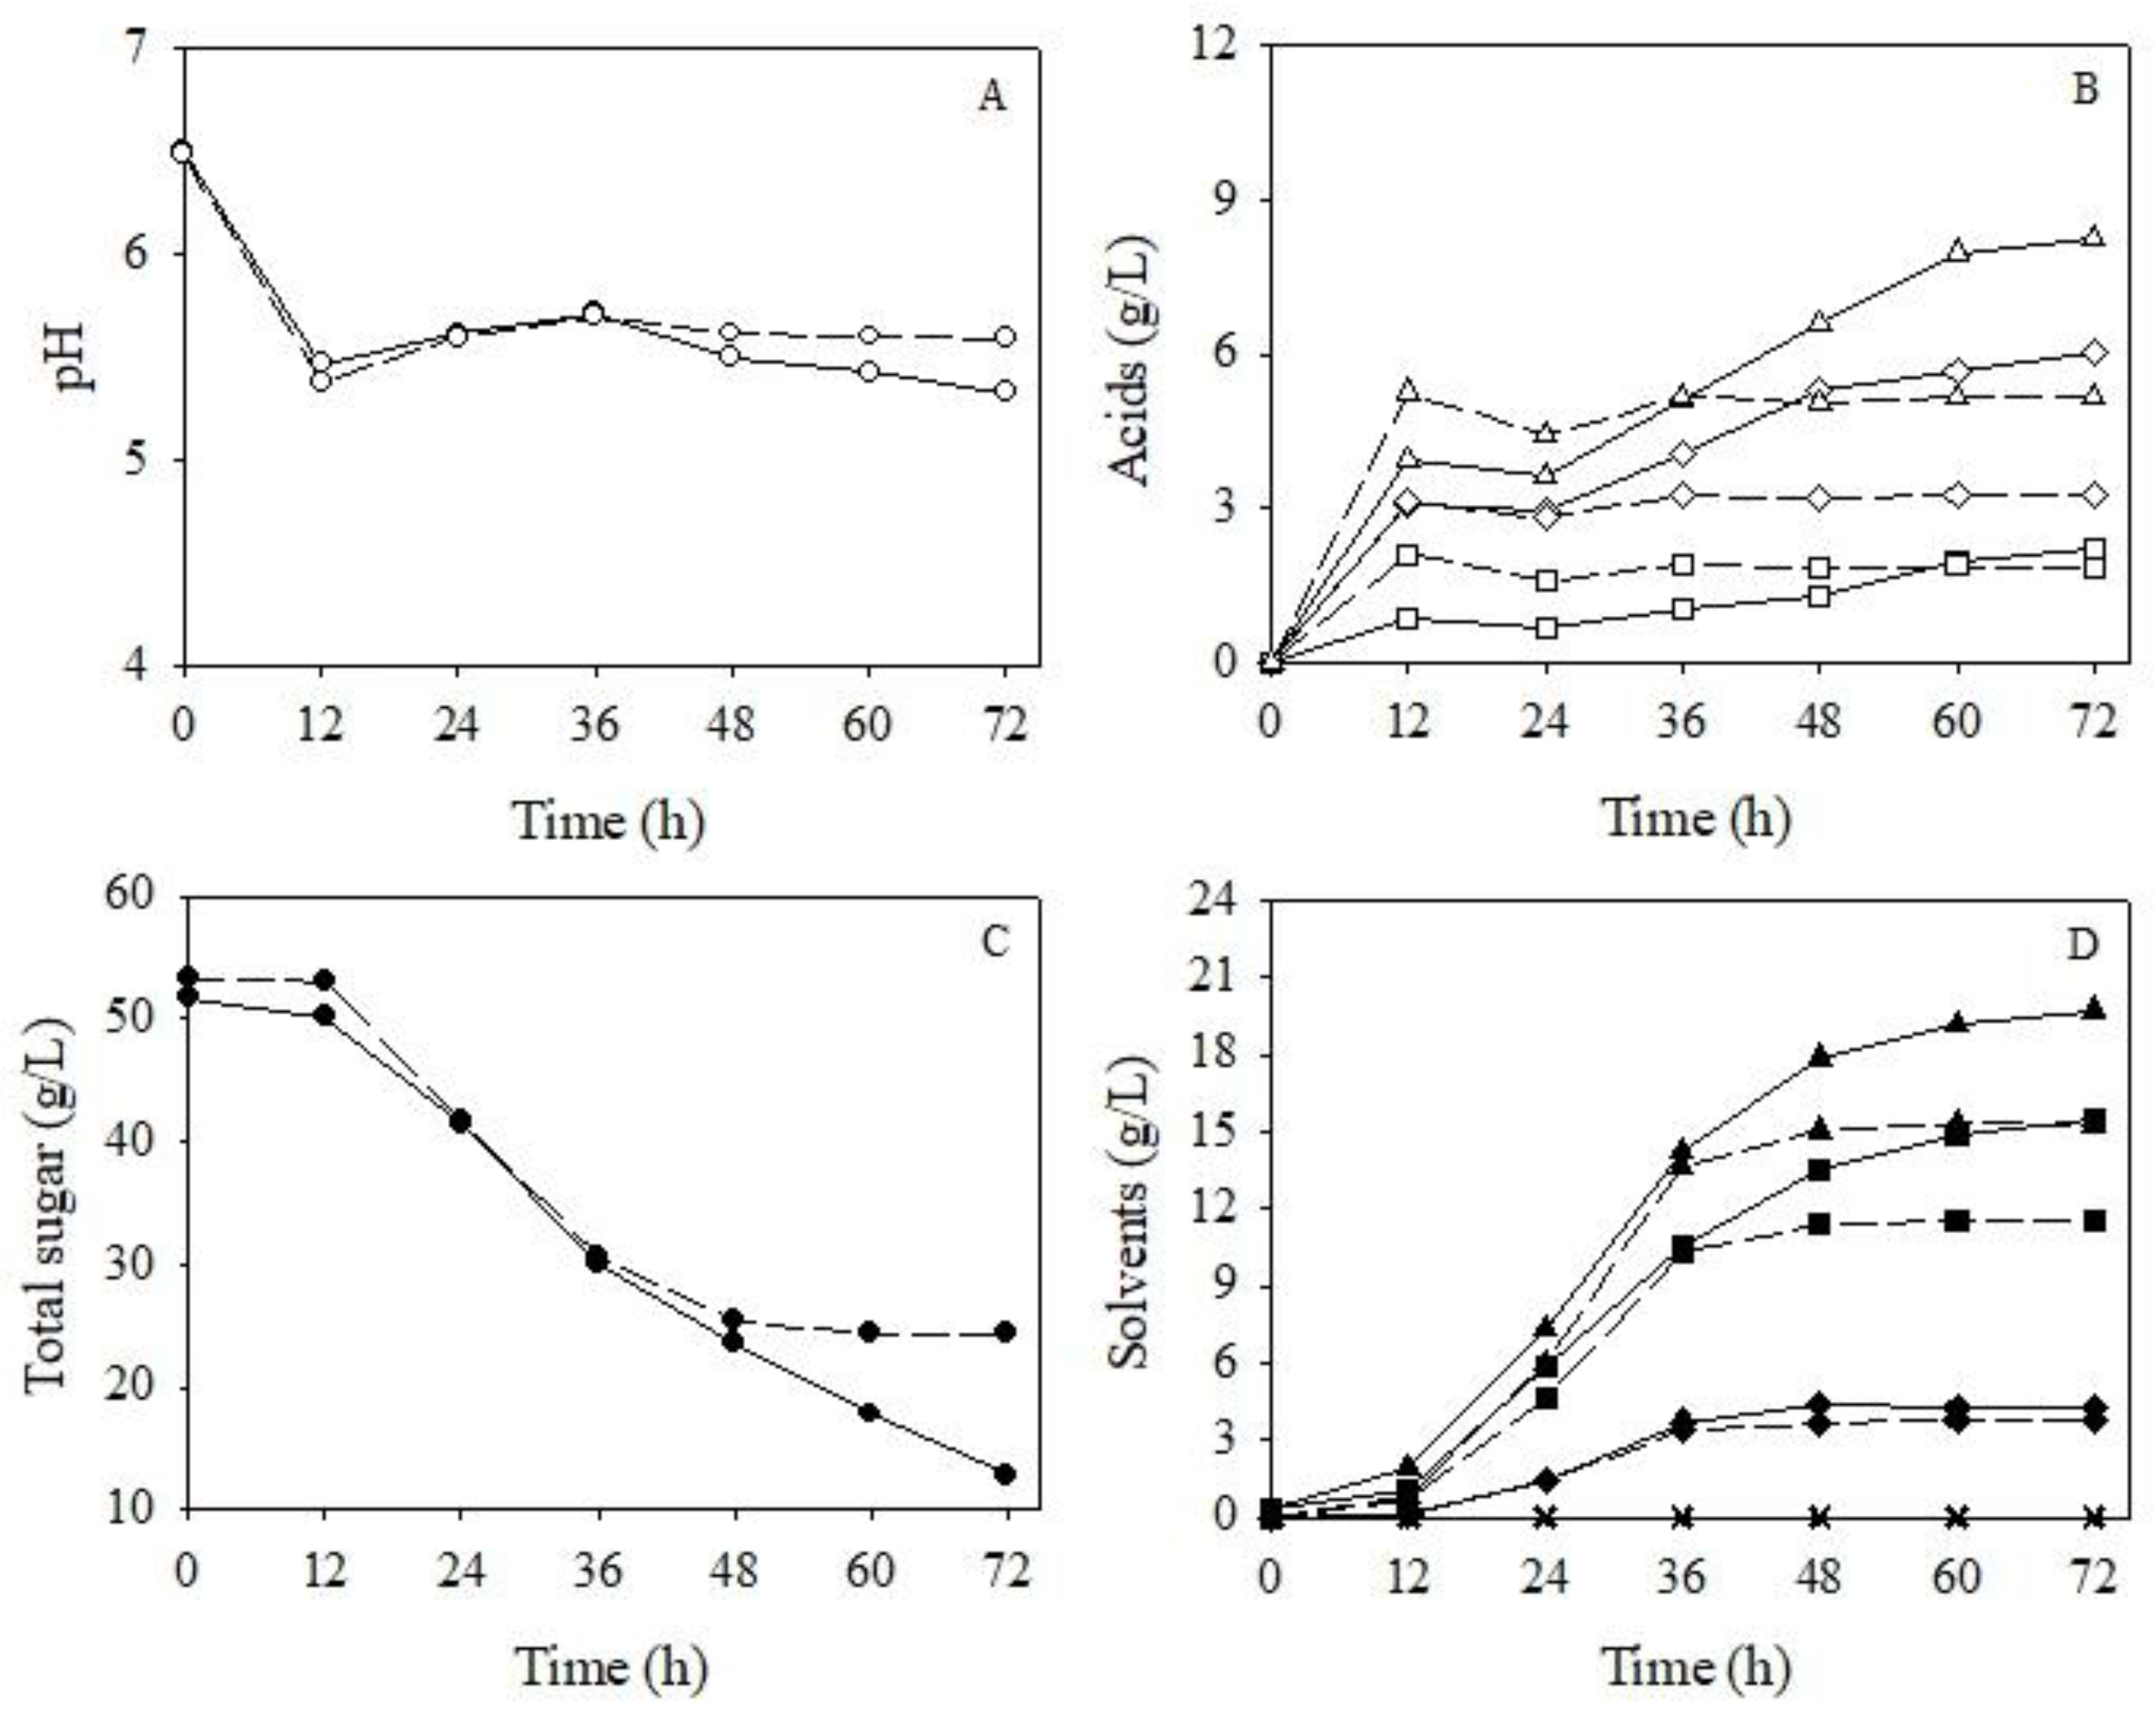
3.3.3. Improvement of Butanol Production by a Gas Stripping System

According to the results of Section 3.3.2, the agitation speed of the STR was increased from 100 to 150 rpm for better mixing during the fermentation. When not using the gas stripping system, the pH of the fermented broth decreased from 6.49 to 5.38 at 12 h, due to the production of acetic and butyric acids (Figure 5A,B). These results suggest that acidogenesis occurred as it did in a previous study. After 12 h, the pH of the fermentation broth increased from 5.38 to 5.60, and solvents (acetone, butanol and ethanol) were detected, indicating the occurrence of solventogenesis. Under this condition, butanol, ABE concentrations and sugar utilization were 11.42 g/L, 15.05 g/L and 54.23%, respectively (Figure 5 and Table 9).
To improve butanol production, the gas stripping system was connected to the 2-L STR, and the gases (CO2 and H2) from the ABE fermentation were stripped beginning 24 h after the start of fermentation. The results showed that the ABE fermentation profiles under the batch fermentation coupled with gas stripping were similar to those without gas stripping in the first 36 h. When using the gas stripping system, the pH slightly decreased again after 36 h of fermentation, corresponding to solvent removal from the fermenter by gas stripping and acid concentration increased in the fermenter (Figure 5). Butanol, ABE concentrations and sugar utilization were 15.33 g/L, 19.46 g/L and 74.89%, respectively. These values increased by ~34, 29 and 21%, respectively compared to those with no gas stripping. However, the butanol yields or YB/S of both systems were not different, indicating that the in situ gas stripping technique did not affect the metabolic pathways of C. beijerinkii TISTR 1461 during ABE fermentation. The results also illustrate that gas stripping is an effective technique for the improvement of butanol production in terms of butanol concentration and sugar utilization in batch ABE fermentations.
A comparison of butanol production with other research studies using batch processes coupled with gas stripping is presented in Table 10. The PB, QB and YB/S values depend on several factors such as the substrate used, initial sugar concentration, Clostridium strain employed and the environmental conditions. The PB value in the current study was lower than those of Ezeji et al. [2,45] and Xue et al. [17] who used glucose and saccharified liquefied cornstarch as carbon sources. High QB values (0.41 to 0.42) were obtained using glucose as a carbon source. However, the QB value in our study was relatively high compared with others. The YB/S in our study was the highest, indicating that C. beijerinckii TISTR 1461 is one of the better suited bacteria for butanol production.

4. Conclusions

Sugarcane molasses can be effectively used for butanol production. The addition of nitrogen supplement and CaCO3 at appropriate levels could significantly promote butanol production. Among five low-cost nitrogen sources (DSY, RB, SM, urea and (NH4)2SO4), DSY was found to be the most suitable low-cost nitrogen source for butanol production from sugarcane molasses by C. beijerinckii TISTR 1461. RSM with Box–Behnken design was successfully used to optimize the concentrations of initial sugar, DSY and CaCO3 for high butanol production. Under the optimum conditions (initial sugar, 50 g/L; DSY, 6 g/L and CaCO3, 6.6 g/L), butanol concentration was increased to 11.38 g/L. Gas stripping is an effective technique of product removal for improvement of batch butanol production efficiency. The butanol concentration (15.33 g/L), ABE concentration (19.46 g/L) and sugar consumption (74.89%) increased by approximately 21% to 34% compared to fermentations using no gas stripping system.

Author Contributions

Conceptualization, P.L. and L.L.; data curation, P.L.; formal analysis, P.N.; investigation, P.N.; methodology, P.N. and N.P.; supervision, P.L.; writing—original draft, P.N.; writing—review and editing, P.L. and L.L. All authors have read and agreed to the published version of the manuscript.

Funding

This research was funded by the National Research Council of Thailand (NRTC), The Royal Golden Jubilee Ph.D. Program (Grant No. PHD/0092/2559), the Post-doctoral Program from Research Affairs and Graduate School, Khon Kaen University (KKU) (Grant No. 59153), Thailand.

Acknowledgments

The authors would like to thank Mitr Phuviang Sugar Co., Ltd., and Beer Thip Brewery Co., Ltd., Phra Nakhon Si Ayutthaya, Thailand for providing sugarcane molasses and DSY, respectively. We also thank to our students, Warut Panbut and Dawan Leetana for their technical assistance.

Conflicts of Interest

The authors declare no conflict of interest.

References

  1. Ezeji, T.C.; Milne, C.; Price, N.D.; Blaschek, H.P. Achievements and perspectives to overcome the poor solvent resistance in acetone and butanol producing microorganisms. Appl. Microbiol. Biotechnol. 2010, 85, 1697–1712. [Google Scholar] [CrossRef]
  2. Ezeji, T.C.; Qureshi, N.; Blaschek, H.P. Production of acetone butanol (AB) from liquefied corn starch, a commercial substrate, using Clostridium beijerinckii coupled with product recovery by gas stripping. J. Ind. Microbiol. Biotechnol. 2007, 34, 771–777. [Google Scholar] [CrossRef]
  3. Dürre, P. Fermentative Butanol Production. Ann. N. Y. Acad. Sci. 2008, 1125, 353–362. [Google Scholar] [CrossRef]
  4. Wechgama, K.; Laopaiboon, L.; Laopaiboon, P. Biobutanol production from agricultural raw materials by Clostridium spp. Chiang Mai J. Sci. 2017, 44, 394–405. [Google Scholar]
  5. Li, H.G.; Luo, W.; Gu, Q.Y.; Wang, Q.; Hu, W.J.; Yu, X.B. Acetone, butanol, and ethanol production from cane molasses using Clostridium beijerinckii mutant obtained low-energy ion beam implantation and N-methyl-N-nitro-N-nitrosoguanidine induction. Bioresour. Technol. 2013, 137, 254–260. [Google Scholar] [CrossRef] [PubMed]
  6. Li, H.G.; Ma, X.X.; Zhang, Q.H.; Luo, W.; Wu, Y.Q.; Li, X.H. Enhanced butanol production by solvent tolerance Clostridium acetobutylicum SE25 from cassava flour in a fibrous bed bioreactor. Bioresour. Technol. 2016, 221, 412–418. [Google Scholar] [CrossRef]
  7. Thani, A.; Laopaiboon, P.; Laopaiboon, L. Improvement of a continuous ethanol fermentation from sweet sorghum stem juice using a cell recycling system. J. Biotechnol. 2017, 251, 21–29. [Google Scholar] [CrossRef]
  8. Pleissner, N.; Neu, A.K.; Mehlmann, K.; Schneider, R.; Quintero, G.P.; Venus, J. Fermentative lactic acid production from coffee pulp hydrolysate using Bacillus coagulans at laboratory and pilot scales. Bioresour. Technol. 2016, 218, 167–173. [Google Scholar] [CrossRef] [Green Version]
  9. Richmond, C.; Ezeji, T.C. Stimulatory effects of calcium carbonate on butanol production by solventogenic Clostridium species. Continental J. Microbiol. 2011, 5, 18–28. [Google Scholar]
  10. YouSheng, L.; Jing, W.; XuMing, W.; XiaoHong, S. Optimization of butanol production from corn straw hydrolysate by Clostridium acetobutylicum using response surface method. Chinese Sci. Bull. 2011, 56, 1422–1428. [Google Scholar] [CrossRef] [Green Version]
  11. Han, B.; Ujor, V.; Lai, L.B.; Gopalan, V.; Ezeji, T.C. Use of proteomic analysis to elucidate the role of calcium in acetone-butanol-ethanol fermentation by Clostridium beijerinckii NCIMB 8052. Appl. Environ. Microbiol. 2013, 79, 282–293. [Google Scholar] [CrossRef] [PubMed] [Green Version]
  12. Wechgama, K.; Laopaiboon, L.; Laopaiboon, P. Enhancement of batch butanol production from sugarcane molasses using nitrogen supplementation integrated with gas stripping for product recovery. Ind. Crops Prod. 2017, 95, 216–226. [Google Scholar] [CrossRef]
  13. Cai, D.; Chen, H.; Chen, C.; Hu, S.; Wang, Y.; Chang, Z.; Miao, Q.; Qin, P.; Wang, Z.; Wang, J.; et al. Gas stripping–pervaporation hybrid process for energy-saving product recovery from acetone-butanol-ethanol (ABE) fermentation broth. Chem. Eng. J. 2016, 287, 1–10. [Google Scholar] [CrossRef]
  14. Xue, C.; Liu, F.; Xu, M.; Zhao, J.; Chen, L.; Ren, J.; Bai, F.; Yang, S.T. A novel in situ gas stripping-pervaporation process integrated with acetone-butanol-ethanol fermentation for hyper n-butanol production. Biotechnol. Bioeng. 2016, 113, 120–129. [Google Scholar] [CrossRef]
  15. Lu, C.; Zhao, J.; Yang, S.T.; Wei, D. Fed-batch fermentation for n-butanol production from cassava bagasse hydrolysate in a fibrous bed bioreactor with continuous gas stripping. Bioresour. Technol. 2012, 104, 380–387. [Google Scholar] [CrossRef]
  16. Xue, C.; Zhao, J.; Lu, C.; Yang, S.T.; Bai, F.; Tang, I. High-titer n-butanol production by Clostridium acetobutylicum JB200 in fed-batch fermentation with intermittent gas stripping. Biotechnol. Bioeng. 2012, 109, 2746–2756. [Google Scholar] [CrossRef] [PubMed]
  17. Xue, C.; Zhao, J.; Liu, F.; Lu, C.; Yang, S.T.; Bai, F.W. Two-stage in situ gas stripping for enhanced butanol fermentation and energy-saving product recovery. Bioresour. Technol. 2013, 135, 396–402. [Google Scholar] [CrossRef]
  18. Xue, C.; Du, G.Q.; Sun, J.X.; Chen, L.J.; Gao, S.S.; Yu, M.L.; Yang, S.T.; Bai, F.W. Characterization of gas stripping and its integration with acetone-butanol-ethanol fermentation for high-efficient butanol production and recovery. Biochem. Eng. J. 2014, 83, 55–61. [Google Scholar] [CrossRef]
  19. Rochon, E.; Ferrari, M.D.; Lareo, C. Integrated ABE fermentation-gas stripping process for enhanced butanol production from sugarcane-sweet sorghum juices. Biomass Bioenergy 2017, 98, 153–160. [Google Scholar] [CrossRef]
  20. Wiehn, M.; Staggs, K.; Wang, Y.C.; Nielsen, D.R. In situ butanol recovery from Clostridium acetobutylicum fermentations by expanded bed adsorption. Biotechnol. Prog. 2014, 30, 68–78. [Google Scholar] [CrossRef]
  21. Xue, C.; Liu, F.; Xu, M.; Tang, I.; Zhao, J.; Bai, F.; Yang, S.T. Butanol production in acetone-butanol-ethanol fermentation with in situ product recovery by adsorption. Bioresour. Technol. 2016, 219, 158–168. [Google Scholar] [CrossRef] [PubMed] [Green Version]
  22. Stoffers, M.; Górak, A. Continuous multi-stage extraction of n-butanol from aqueous solutions with 1-hexyl-3-methylimidazolium tetracyanoborate. Sep. Purif. Technol. 2013, 120, 415–422. [Google Scholar] [CrossRef]
  23. Qureshi, N.; Blaschek, H.P. Production of acetone-butanol-ethanol (ABE) by a hyper-producing mutant stain of Clostridium beijerinckii BA101 and recovery by pervaporation. Biotechnol. Prog. 1999, 15, 594–602. [Google Scholar] [CrossRef] [PubMed]
  24. Sirisantimethakom, L.; Laopaiboon, L.; Sanchanda, P.; Chatleudmongkol, J.; Laopaiboon, P. Improvement of butanol production from sweet sorghum juice by Clostridium beijerinckii using an orthogonal array design. Ind. Crops Prod. 2016, 79, 287–294. [Google Scholar] [CrossRef]
  25. Qureshi, N.; Ezeji, T.C.; Ebener, J.; Dien, B.S.; Cotta, M.A.; Blaschek, H.P. Butanol production by Clostridium beijerinckii. Part I: Use of acid and enzyme hydrolyzed corn fiber. Bioresour. Technol. 2008, 99, 5915–5922. [Google Scholar] [CrossRef]
  26. Majumder, A.; Singh, A.; Goyal, A. Application of response surface methodology for glucan production from Leuconostoc dextranicum and its structural characterization. Carbohydr. Polym. 2009, 75, 150–156. [Google Scholar] [CrossRef]
  27. Ezeji, T.C.; Qureshi, N.; Blaschek, H.P. Acetone butanol ethanol (ABE) production from concentrated substrate: Reduction in substrate inhibition by fed-batch technique and product inhibition by gas stripping. Appl. Microbiol. Biotechnol. 2004, 63, 653–658. [Google Scholar] [CrossRef]
  28. William, H. Official Methods of Analysis of the AOAC; Association of Official Analytical Chemists: Arlington, VA, USA, 2012. [Google Scholar]
  29. Areesirisuk, A.; Laopaiboon, L.; Khongsay, N.; Laopaiboon, P. Improvement of gas chromatographic analysis for organic acids and solvents in acetone-butanol-ethanol fermentation from sweet sorghum juice. Afr. J. Biotechnol. 2010, 9, 6422–6429. [Google Scholar]
  30. Mecozzi, M. Estimation of total carbohydrate amount in environmental samples by the phenol-sulphuric acid method assisted by multivariate calibration. Chemometr. Intell. Lab. Syst. 2005, 79, 84–90. [Google Scholar] [CrossRef]
  31. Wang, S.; Zhang, Y.; Dong, H.; Mao, S.; Zhu, Y.; Wang, R.; Luan, G.; Li, Y. Formic acid triggers the “Acid Crash” of acetone-butanol-ethanol fermentation by Clostridium acetobutylicum. Appl. Environ. Microbiol. 2011, 77, 1674–1680. [Google Scholar] [CrossRef] [Green Version]
  32. Sridee, W.; Laopaiboon, L.; Jaisil, P.; Laopaiboon, P. The use of dried spent yeast as a low-cost nitrogen supplement in ethanol fermentation from sweet sorghum juice under very high gravity conditions. Electron. J. Biotechnol. 2011, 14, 1–15. [Google Scholar] [CrossRef]
  33. Qureshi, N.; Lolas, A.; Blaschek, H.P. Soy molasses as fermentation substrate for production of butanol using Clostridium beijerinckii BA101. J. Ind. Microbiol. Biotechnol. 2001, 26, 290–295. [Google Scholar] [CrossRef] [PubMed]
  34. Al-Shorgani, N.K.N.; Kalil, M.S.; Yusoff, W.M.W. The effect of different nitrogen sources on biobutanol production using Clostridium saccharoperbutylacetonicum N1-4. Biotechnology 2011, 10, 280–285. [Google Scholar] [CrossRef] [Green Version]
  35. Costa, J.M. Solvent toxicity in the acetone-butanol fermentation. Proc. Ann. Biochem. Eng. 1981, 11, 83–90. [Google Scholar]
  36. Chen, F.; Peng, J.; Lei, D.; Liu, J.; Zhao, G. Optimization of genistein solubilization by κ-carrageenan hydrogel using response surface methodology. Food Sci. Hum. Wellness 2013, 2, 124–131. [Google Scholar] [CrossRef] [Green Version]
  37. Lai, M.C.; Traxler, R.W. A coupled two-stage continuous fermentation for solvent production by Clostridium acetobutylicum. Enzyme Microb. Technol. 1994, 16, 1021–1025. [Google Scholar] [CrossRef]
  38. Agarwal, L.; Isar, J.; Meghwanshi, G.K.; Saxena, R.K. A cost effective fermentative production of succinic acid from cane molasses and corn steep liquor by Escherichia coli. J. Appl. Microbiol. 2006, 100, 1348–1354. [Google Scholar] [CrossRef]
  39. Isar, J.; Rangaswamy, V. Improved n-butanol production by solvent tolerant Clostridium beijerinkii. Biomass Bioenergy 2012, 37, 9–15. [Google Scholar] [CrossRef]
  40. Ni, Y.; Wang, Y.; Sun, Z. Butanol production from cane molasses by Clostridium saccharobutylicum DSM 13864: Batch and semicontinuous fermentation. Appl. Biochem. Biotechnol. 2012, 166, 1896–1907. [Google Scholar] [CrossRef]
  41. Li, X.; Li, Z.; Zheng, J.; Shi, Z.; Li, L. Yeast extract promotes phase shift of bio-butanol fermentation by Clostridium acetobutylicum ATCC824 using cassava as substrate. Bioresour. Technol. 2012, 125, 43–51. [Google Scholar] [CrossRef]
  42. Durán-Padilla, V.R.; Davila-Vazquez, G.; Chávez-Vela, N.A.; Tinoco-Valencia, J.R.; Jáuregui-Rincón, J. Iron effect on the fermentative metabolism of Clostridium acetobutylicum ATCC 824 using cheese whey as substrate. Biofuel Res. J. 2014, 4, 129–133. [Google Scholar] [CrossRef]
  43. Wu, Y.D.; Xue, C.; Chen, L.J.; Bai, F.W. Impact of zinc supplementation on the improved fructose/xylose utilization and butanol production during acetone-butanol-ethanol fermentation. J. Biosci. Bioeng. 2016, 121, 66–72. [Google Scholar] [CrossRef]
  44. Gomes, A.C.; Rodrigues, M.I.; Passos, D.F.; Castro, A.M.; Anna, L.M.S.; Pereira, N. Acetone-butanol-ethanol fermentation from sugarcane bagasse hydrolysates: Utilization of C5 and C6 sugars. Electron. J. Biotechnol. 2019, 42, 16–22. [Google Scholar] [CrossRef]
  45. Ezeji, T.C.; Qureshi, N.; Blaschek, H.P. Production of acetone, butanol and ethanol by Clostridium beijerinckii BA101 and in situ recovery by gas stripping. World J. Microbiol. Biotechnol. 2003, 19, 595–603. [Google Scholar] [CrossRef]
  46. Lu, C.; Dong, J.; Yang, S.T. Butanol production from wood pulping hydrolysate in an integrated fermentation-gas stripping process. Bioresour. Technol. 2013, 143, 467–475. [Google Scholar] [CrossRef]
  47. Qureshi, N.; Cotta, M.A.; Saha, B.C. Bioconversion of barley straw and corn stover to butanol (a biofuel) in integrated fermentation and simultaneous product recovery bioreactors. Food Bioprod. Process. 2014, 92, 298–308. [Google Scholar] [CrossRef]
Figure 1. Schematic diagram of batch butanol fermentation coupled with a gas stripping system.
Energies 13 00694 g001
Figure 2. Changes in the chemical composition of the medium during batch butanol fermentation by C. beijerinckii TISTR 1461 from sugarcane molasses with and without various nitrogen sources. (●) YE, (○) DSY, (■) RB, (□) SM, (▲) urea, (∆) (NH4)2SO4 and (x) without nitrogen addition. (A) pH, (B) total sugar, (C) butanol and (D) acetone-butanol-ethanol (ABE) concentrations.
Energies 13 00694 g002
Figure 3. Butanol production profiles of experimental Run 1 by C. beijerinckii TISTR 1461 from sugarcane molasses in a 1-L screw-capped bottle; (●) total sugar, (○) pH, (▲) ABE, (∆) total acids, (◆) acetone, (■) butanol, (x) ethanol, (◊) acetic acid and (□) butyric acid.
Energies 13 00694 g003
Figure 4. A 3D response surface plot for butanol production by C. beijerinckii TISTR 1461 from sugarcane molasses: (A) the effect of initial sugar and DSY concentrations, (B) the effect of initial sugar and CaCO3 concentrations and (C) the effect of DSY and CaCO3 concentrations.
Energies 13 00694 g004
Figure 5. Butanol production by C. beijerinckii TISTR 1461 from sugarcane molasses under optimal conditions (initial sugar, 50 g/L; DSY, 6 g/L and CaCO3, 6.6 g/L) in a 2-L fermenter with (solid lines) and without (dashed lines) gas stripping; (A) pH (○), (B) acetic acid (◊), butyric acid (□) and total acids (∆), (C): total sugar (●) in the fermenter and (D) accumulate acetone (◆), butanol (■), ethanol (x) and ABE (▲) in the fermenter and condensate.
Energies 13 00694 g005
Table 1. Range of the three main variables in the Box–Behnken design.
VariablesVariable CodeLevel
Low (−1)Middle (0)High (+1)
Initial sugar (g/L)a254565
Nitrogen source (g/L) ab024
CaCO3 (g/L)c4812
a corresponding to nitrogen content of YE at 0, 2 and 4 g/L.
Table 2. Box–Behnken design showing three main variables with coded values.
Run NumberCoded Value
abc
1000
2+1−10
3−1+10
4+1+10
5000
6+10−1
7−10+1
8+10+1
9000
100+1−1
110−1+1
120+1+1
13000
14−1−10
15−10−1
160−1−1
17000
a, b and c represent the initial sugar, nitrogen source and CaCO3 levels, respectively. (−1) = the lowest level, (0) = middle level and (+1) = the highest level.
Table 3. Proximate analsis of various nitrogen sources for butanol production.
Composition (% Dry Weight)Nitrogen Source a
YEDSYRBSMUrea(NH4)2SO4
Total carbohydrate8.9836.6751.9539.71- b-
Protein74.5048.6912.0834.92--
Total fat0.072.9410.4413.08--
Moisture5.195.198.403.15--
Fibre-0.358.216.60--
Ash11.266.168.922.54--
Nitrogen content11.927.791.935.5946.6221.19
a YE, yeast extract; DSY, dried spent yeast; RB, rice bran; SM, soybean meal. b not detected. Data in the table show the mean values.
Table 4. Fermentation results of batch butanol production under various nitrogen sources from sugarcane molasses containing 60 g/L of total sugar.
Nitrogen Source *Acetone (g/L)Butanol (g/L)Ethanol (g/L)ABE (g/L)Acetic Acid (g/L)Butyric Acid (g/L)Total Acid (g/L)SC ** (g/L)t (h)YB/S (g/g)QB (g/L·h)
None4.42 ± 0.51 b8.53 ± 0.44 a0.77 ± 0.13 c13.72 ± 0.95 a3.67 ± 0.09 b1.58 ± 0.03 a5.25 ± 0.05 b27.25 ± 0.27 a600.31 ± 0.01 c0.14 ± 0.01 a
YE2.59 ± 0.23 a11.37 ± 0.55 d0.71 ± 0.08 c14.67 ± 0.23 ab2.43 ± 0.37 a2.00 ± 0.49 bc4.43 ± 0.12 a30.09 ± 0.76 b480.38 ± 0.01 d0.24 ± 0.01 d
DSY6.65 ± 0.11 e11.19 ± 0.01 d0.82 ± 0.24 c 18.66 ± 0.36 e5.45 ± 0.05 d2.17 ± 0.01 c7.62 ± 0.05 e35.84 ± 0.55 f480.31 ± 0.01 c0.23 ± 0.00 d
RB6.08 ± 0.16 d10.34 ± 0.06 c0.48 ± 0.08 b16.89 ± 0.30 d5.21 ± 0.31 d1.76 ± 0.12 ab6.97 ± 0.43 d33.67 ± 0.20 de600.31 ± 0.00 c0.17 ± 0.00 bc
SM4.94 ± 0.08 bc9.81 ± 0.14 b0.00 ± 0.00 a14.75 ± 0.06 b4.28 ± 0.30 c2.19 ± 0.01 c6.47 ± 0.31 c33.28 ± 0.83 d600.29 ± 0.01 b0.16 ± 0.01 b
Urea5.21 ± 0.59 c10.61 ± 0.25 c0.02 ± 0.01 a15.83 ± 0.86 c4.51 ± 0.40 c2.66 ± 0.06 d7.17 ± 0.33 d34.56 ± 0.35 e600.31 ± 0.01 c0.18 ± 0.01 c
(NH4)2SO44.96 ± 0.02 bc8.54 ± 0.04 a0.85 ± 0.04 c14.35 ± 0.10 ab5.52 ± 0.02 d2.19 ± 0.01 c7.70 ± 0.03 e32.36 ± 0.24 c600.26 ± 0.00 a0.14 ± 0.00 a
* YE, yeast extract; DSY, dried spent yeast; RB, rice bran; SM, soybean meal; (NH4)2SO4, ammonium sulfate; ** SC, sugar consumption; t, fermentation time; YB/S, butanol yield; QB, butanol productivity. The results were measured in triplicate and expressed as mean ± SD. a, b, c, d, e, f Means followed by the same letter within the same column are not significantly different using Duncan’s multiple range test at the level of α = 0.05.
Table 5. Box–Behnken design showing three variables with real values and experimental results of butanol concentration from sugarcane molasses.
Run No.Real ValueResponse (Butanol Concentration, g/L)
ABCExperimental ValuePredicted Value
1453.06 a811.00 ± 0.3510.57
2650810.11 ± 0.179.60
3256.12 b87.93 ± 0.068.67
4656.12811.50 ± 0.2811.79
5453.06810.32 ± 0.3310.57
6653.0649.79 ± 0.0410.16
7253.06127.81 ± 0.057.45
8653.061210.06 ± 0.2310.29
9453.06810.35 ± 0.3010.57
10456.12411.01 ± 0.0310.32
11450127.71 ± 0.118.54
12456.121210.75 ± 0.0310.39
13453.06811.10 ± 0.4510.57
1425087.35 ± 0.107.06
15253.0647.29 ± 0.047.34
1645047.89 ± 0.108.38
17453.06810.50 ± 0.1510.57
A, B and C were the real values of initial sugar, DSY and CaCO3, respectively. (−1) = the lowest level, (0) = middle level and (+1) = the highest level. a Nitrogen conent in 3.06 g/L of DSY was equal to that in 2 g/L of YE. b Nitrogen conent in 6.12 g/L of DSY was equal to that in 4 g/L of YE.
Table 6. Analysis of variance for the parameters of the Box–Behnken design fitted to a quadratic response surface model.
SourceSum of SquaresdfMean SquareF-Valuep-Value
Model31.0493.457.240.0081significant
A: Initial sugar15.88115.8833.310.0007
B: DSY7.3217.3215.350.0058
C: CaCO30.02910.0290.0600.8129
AB0.08710.0870.180.6820
AC1.00 × 10−411.00 × 10−42.10 × 10−40.9888
BC1.60 × 10−311.60 × 10−33.36 × 10−30.9554
A23.7513.757.860.0264
B20.5010.501.040.3416
C22.8012.805.880.0458
Residual3.3470.48
Lack of Fit2.7730.926.550.0505not significant
Pure Error0.5640.14
Cor Total34.3816
R2 = 0.9029, df = degrees of freedom.
Table 7. Batch butanol production from sugarcane molasses and synthetic medium (P2 medium).
ContainerMediumPB (g/L)QB (g/L·h)YB/S (g/g)t (h)
1-L screw-capped bottleP2 medium10.47 ± 0.12 a0.22 ± 0.00 a0.34 ± 0.00 a48
Molasses with no supplement *8.53 ± 0.44 b0.14 ± 0.01 b0.31 ± 0.01 a60
Molasses under optimum condition **11.38 ± 0.02 c0.32 ± 0.00 c0.40 ± 0.01 b36
2-L stirred-tank reactor (STR)Molasses under optimum condition **11.42 ± 0.03 c0.24 ± 0.00 d0.40 ± 0.01 b48
* Sugarcane molasses containing only 50 g/L of initial sugar. ** Sugarcane molasses containing 50 g/L of initial sugar, 6 g/L of DSY and 6.6 g/L of CaCO3. PB, butanol concentration (g/L); QB, butanol productivity (g/L·h); YB/S, butanol yield and t, fermentation time (h). a, b, c, d Means followed by the same letter within the same column are not significantly different using Duncan’s multiple range test at the level of α = 0.05. Data in the table show the mean values ± SD of triplicate treatments.
Table 8. Comparison of batch butanol production from various substrates and nutrient supplements.
SubstrateMicroorganismNutrient SupplementButanolReference
PB (g/L)QB (g/L·h)
Pretreated molasses
(60 g/L of sugar)
C. beijerinckii L175Urea, 3 g/L
(NH4)2SO4, 3 g/L
6.60
7.70
-
-
[5]
Sugarcane molasses
(60 g/L of sugar)
C. saccharobutylicum DSM 13864CaCO3, 3.2 g/L; (NH4)2SO4, 2 g/L; K2HPO4, 0.5 g/L; corn steep powder, 10 g/L and MnSO4·H2O, 0.01 g/L11.860.33[40]
Sugarcane molasses
(50 g/L of sugar)
C. beijerinckii TISTR 1461Dried spent yeast, 6 g/L and CaCO3, 6.6 g/L11.380.32This study
Corn straw hydrolysate
(42–44 g/L of sugar)
C. acetobutylicum CICC 8008CaCO3, 5 g/L6.20-[10]
(a) Cassava
(65%–70% w/w)
(b) Corn
(50% w/w)
C. acetobutylicum ATCC 824Yeast extract, 2.5 g/L10.56
9.57
0.24
0.20
[41]
Cheese whey (55 g/L)C. acetobutylicum ATCC 824Yeast extract, 5 g/L; CaCO3, 18 g/L and FeSO4·7H2O, 20 mg/L7.13-[42]
Xylose (70 g/L)C. acetobutylicum L7P2 and ZnSO4·7H2O, 0.001 g/L8.300.10[43]
Sugarcane bagasse hydrolysate (50 g/L)C. acetobutylicum DSM 6228Yeast extract, 1 g/L; MnSO4, 0.01 g/L; MgSO4, 0.2 g/L; KH2PO4, 0.5 g/L; K2HPO4, 0.5 g/L; sodium acetate, 0.01 g/L and FeSO4·7H2O, 0.01 g/L9.100.25[44]
PB, butanol concentration and QB, butanol productivity.
Table 9. Batch butanol production by C. beijerinckii TISTR 1461 from sugarcane molasses in a 2-L fermenter with and without a gas stripping system.
SystemInitial Sugar (g/L)Sugar Utilized (g/L)SC (%)Acetone (g/L)Butanol (g/L)Ethanol (g/L)ABE (g/L)YB/S (g/g)QB (g/L·h)
Without gas stripping53.25 ± 0.1128.88 ± 0.4754.23 ± 0.473.63 ± 0.3311.42 ± 0.04015.05 ± 0.370.400.24
With gas stripping
…: Condensate---0.63 ± 0.06107 ± 0.100107.63 ± 0.08--
…: Fermenter52.05 ± 0.5738.98 ± 0.3074.89 ± 0.303.57 ± 0.219.39 ± 0.14012.96 ± 0.180.390.21
…: Total52.05 ± 0.5738.98 ± 0.3074.89 ± 0.304.08 ± 0.1115.33 ± 0.25019.46 ± 0.370.390.21
SC, sugar consumption; YB/S, butanol yield and QB, butanol productivity.
Table 10. Comparison of batch butanol fermentation coupled with a gas stripping system.
SubstrateStrainInitial Sugar (g/L)PB (g/L)QB (g/L·h)YB/S (g/g)Reference
GlucoseC. beijerinckii BA1016016.40.420.27[45]
Saccharified liquefied cornstarchC. beijerinckii BA10164.317.60.260.27[2]
Wood pulping hydrolysateC. beijerinckii CC101429.380.130.29[46]
GlucoseC. acetobutylicum JB2008019.80.410.25[17]
GlucoseC. beijerinckii P2606213.890.190.25[47]
Sugarcane juiceC. acetobutylicum ABE12016013.980.180.24[14]
Sugarcane molassesC. beijerinckii TISTR 14615215.330.210.39This study
PB, butanol concentration; QB, butanol productivity and YB/S, butanol yield.

