1. Introduction
Given concerns about greenhouse gas emission reductions and renewable energy conservation, new energy vehicles driven by electric energy have been paid increasing attention due to the substitution of traditional petroleum energy in recent years [
1,
2,
3]. In the field of transportation where energy consumption is very large, it is of great significance for electric energy to replace petroleum energy. The rise of electric vehicles (EVs) has been an inevitable trend of development. Since the driving device of EVs cannot provide a heat source like the internal combustion engine, cabin heating in a cold climate occupies a considerable proportion of the electric energy consumption from a battery leading to drastically shortened driving range [
4,
5]. To meet this challenge, a vapor compression system with cooling and heating functions is required. This can not only satisfy the comfort requirements of the crew cabin, but also achieve the goal of energy saving. This type of vapor compression system utilizes heat from the environment and shows a significant advantage in energy conservation and driving range improvement in comparison with an electric heater, also known as an air-conditioning heat pump (ACHP). The truth is that investigation on ACHP performance and reliability for EVs is still urgently needed for high standards of the automotives and complicated working conditions [
6,
7]. In terms of hardware, the performance optimization of the ACHP system includes the optimization of system components, such as compressors, heat exchangers, expansion valves, etc. In the initial stage of system performance matching, these components are determined according to the capability required by the system, such as cooling and heating capacity. After components are determined, cooling and heating performance of the system needs to be evaluated under off-design conditions, which is an important procedure of system optimization [
3,
4,
5,
6,
7]. Then, the components and piping layout should be optimized to achieve better system performance. In addition, refrigerant charge in an ACHP system is also an important factor in order to adapt to different working conditions and meet the requirements of cooling and heating capacity of the system.
Researchers have studied effect of refrigerant charge on the performance of heat pump and air conditioning systems for a variety of applications. Wang et al. put forward a method to determine the optimal charge platform (OCP) of refrigerant charge, which takes the degree of superheat at evaporator outlet and degree of superheat at compressor suction as evaluation indexes [
8]. According to the investigation of José-M et al. [
9], the optimal charge of a heat pump depends on the temperature of the heat source. The lower the heat source temperature, the lower the optimal charge quantity. When the subcooling degree is about 5–7 K, COP (coefficient of performance) of the system is optimal regardless the source temperature or sink temperature. Palmiter et al. studied the performance of heat pump systems at different refrigerant charge based on AHRI (Air-Conditioning, Heating, and Refrigeration Institute) Standard 210/240-2008 [
10]. The results show that COP of heat-supply season can be increased by 5% with increase of refrigerant charge under rated air flow condition. In order to find out optimal charge quantity of different refrigerants, the performance of the heat pump and the suction pressure of compressor were experimentaly studied by Afshari et al. [
11]. At ambient temperature 20–35 °C, the variation of system parameters with different refrigerant charge was studied by Siang et al. [
12]. It was found that refrigeration capacity and performance coefficient can be improved by increasing refrigerant charge, while specific refrigeration capacity of the system decreased. The research of charge amount for alternative refrigerants has also attracted the attention of researchers [
13]. The correlation between refrigerant charge and system performance was also studied. Some researchers have studied the characteristics of low refrigerant charge in heat exchangers [
14,
15,
16,
17]. By optimizing the design, operating conditions and structural parameters of the heat exchanger, lower refrigerant charge can be achieved.
The related theoretical model of refrigerant charge is also widely used to evaluate the performance of the system. Cheung et al. developed a theoretical model to evaluate the effects of under-charged and over-charged refrigerant on system performance [
18]. The rated refrigeration capacity, energy input ratio and sensible heat ratio of the system were modified by the relevant model. Based on all available results in the literature, Mehrabi et al. summarized the influence of refrigerant charge failure on single-speed air conditioning and the heat pump system [
19]. The generalized relation describing the effect of refrigerant charge failure was established.
From the above literature, it can be seen that refrigerant charge has a great impact on energy consumption of an ACHP system. Driving range is the key factor that restricts the development of pure electric vehicles, so it is necessary to develop an energy-saving and efficient ACHP system. To apply an ACHP system in EVs, optimal refrigerant charge needs to be determined firstly by systematic experiments.
Either excessive charge or insufficient charge could lead to a decrease of the system heating and cooling performance [
20,
21]. With an increment of refrigerant charged into system, the superheat decreases and subcooling increases constantly. OCP would appear after the intersection of the superheat and subcooling curves, then optimal charge is usually chosen in the amount of refrigerant charged on the OCP with the best system cooling performance. For the ACHP system, optimal charge in heating mode could also be determined through the charge determination experiment, but always being quite different from cooling mode. As the refrigerant charged into system is unique, the optimal charge obtained from charge sensitive experiment emersion is divided into heating and cooling mode. A widely used simple practical solution is to take the optimal charge obtained in heating mode as the system optimal charge [
22]. However, as it is quite different from the optimal charge in the cooling mode, the ACHP system could not reach its best cooling performance. A comprehensive refrigerant charge considering system performance should be proposed. Considering the cost and pollution in repeated charge determination, optimal charge determination for an ACHP system still needs further investigation to improve efficiency and reduce cost.
Theoretical methods could also be applied to determine system inner volume and optimal charge for an ACHP system. Charge amount in the single phase refrigerant part of the system including high-pressure tubes, low-pressure tubes and compressor could be calculated easily with its density and inner volume measured. Meanwhile, charge amount in two-phase refrigerant parts in heat exchangers could be estimated with appropriate void friction correlation models as confirmed in previous work [
23,
24]. These models could be applied for estimation of the charge amount in a heat exchanger with R134a and R1234yf. In confronting EVs’ complicated working conditions, better precision of the optimal charge determination in both heating and cooling mode is still required and there is a lack of experimental validation.
In this work, a newly designed ACHP system was firstly introduced and the charge determination experiments were conducted to obtain OCP with comprehensive consideration of cooling and heating performance. The comprehensive performances at charge amount in the intersecting parts of both charge plateaus were measured to obtain optimal charge. Secondly, theoretical methods including Tandon, Premoli and Hughmark relating to void fraction models were applied to calculate the optimal charge in the system. Comparison and analysis of theoretical and experimental results were made. The results can be used as a guide to determine the optimal refrigerant charge amount of similar vapor compression systems.
2. Experiments and Charge Amount Theoretical Model
2.1. Experimental Principle and System
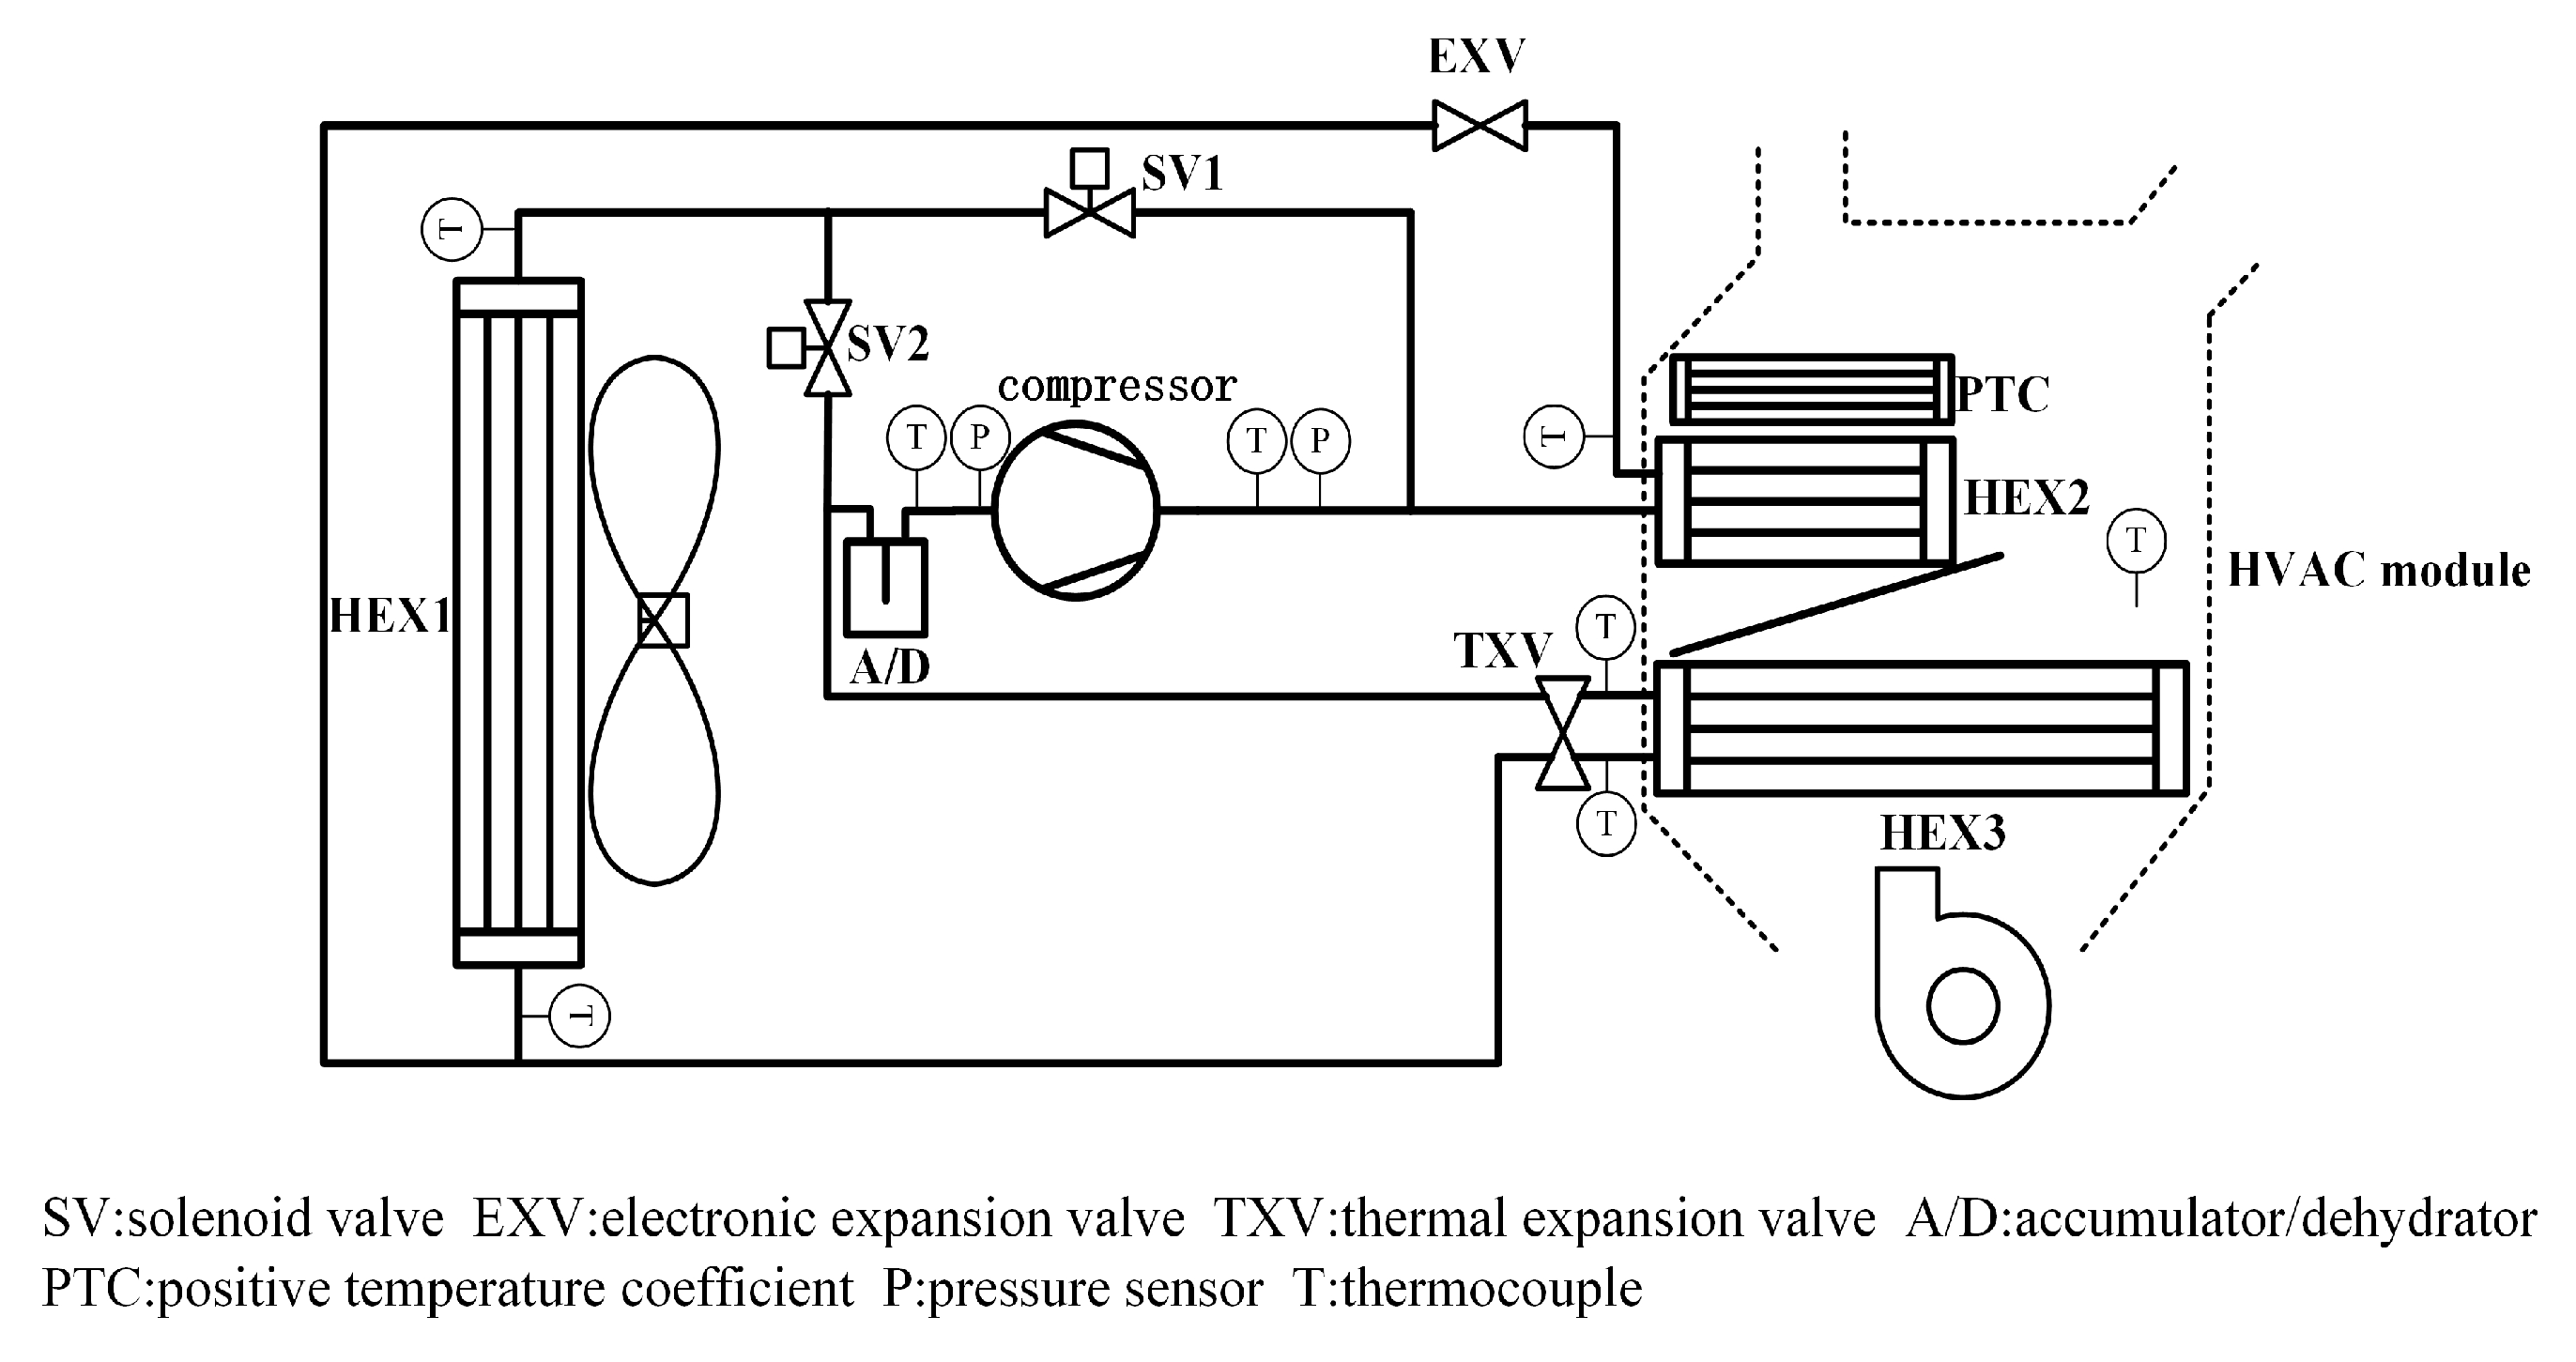
A new type of experimental platform of a vapor compression system for EV passenger cabin comfort adjustment was built to reveal the effect of refrigerant charge with R134a (tetrafluoroethane) as shown in
Figure 1.
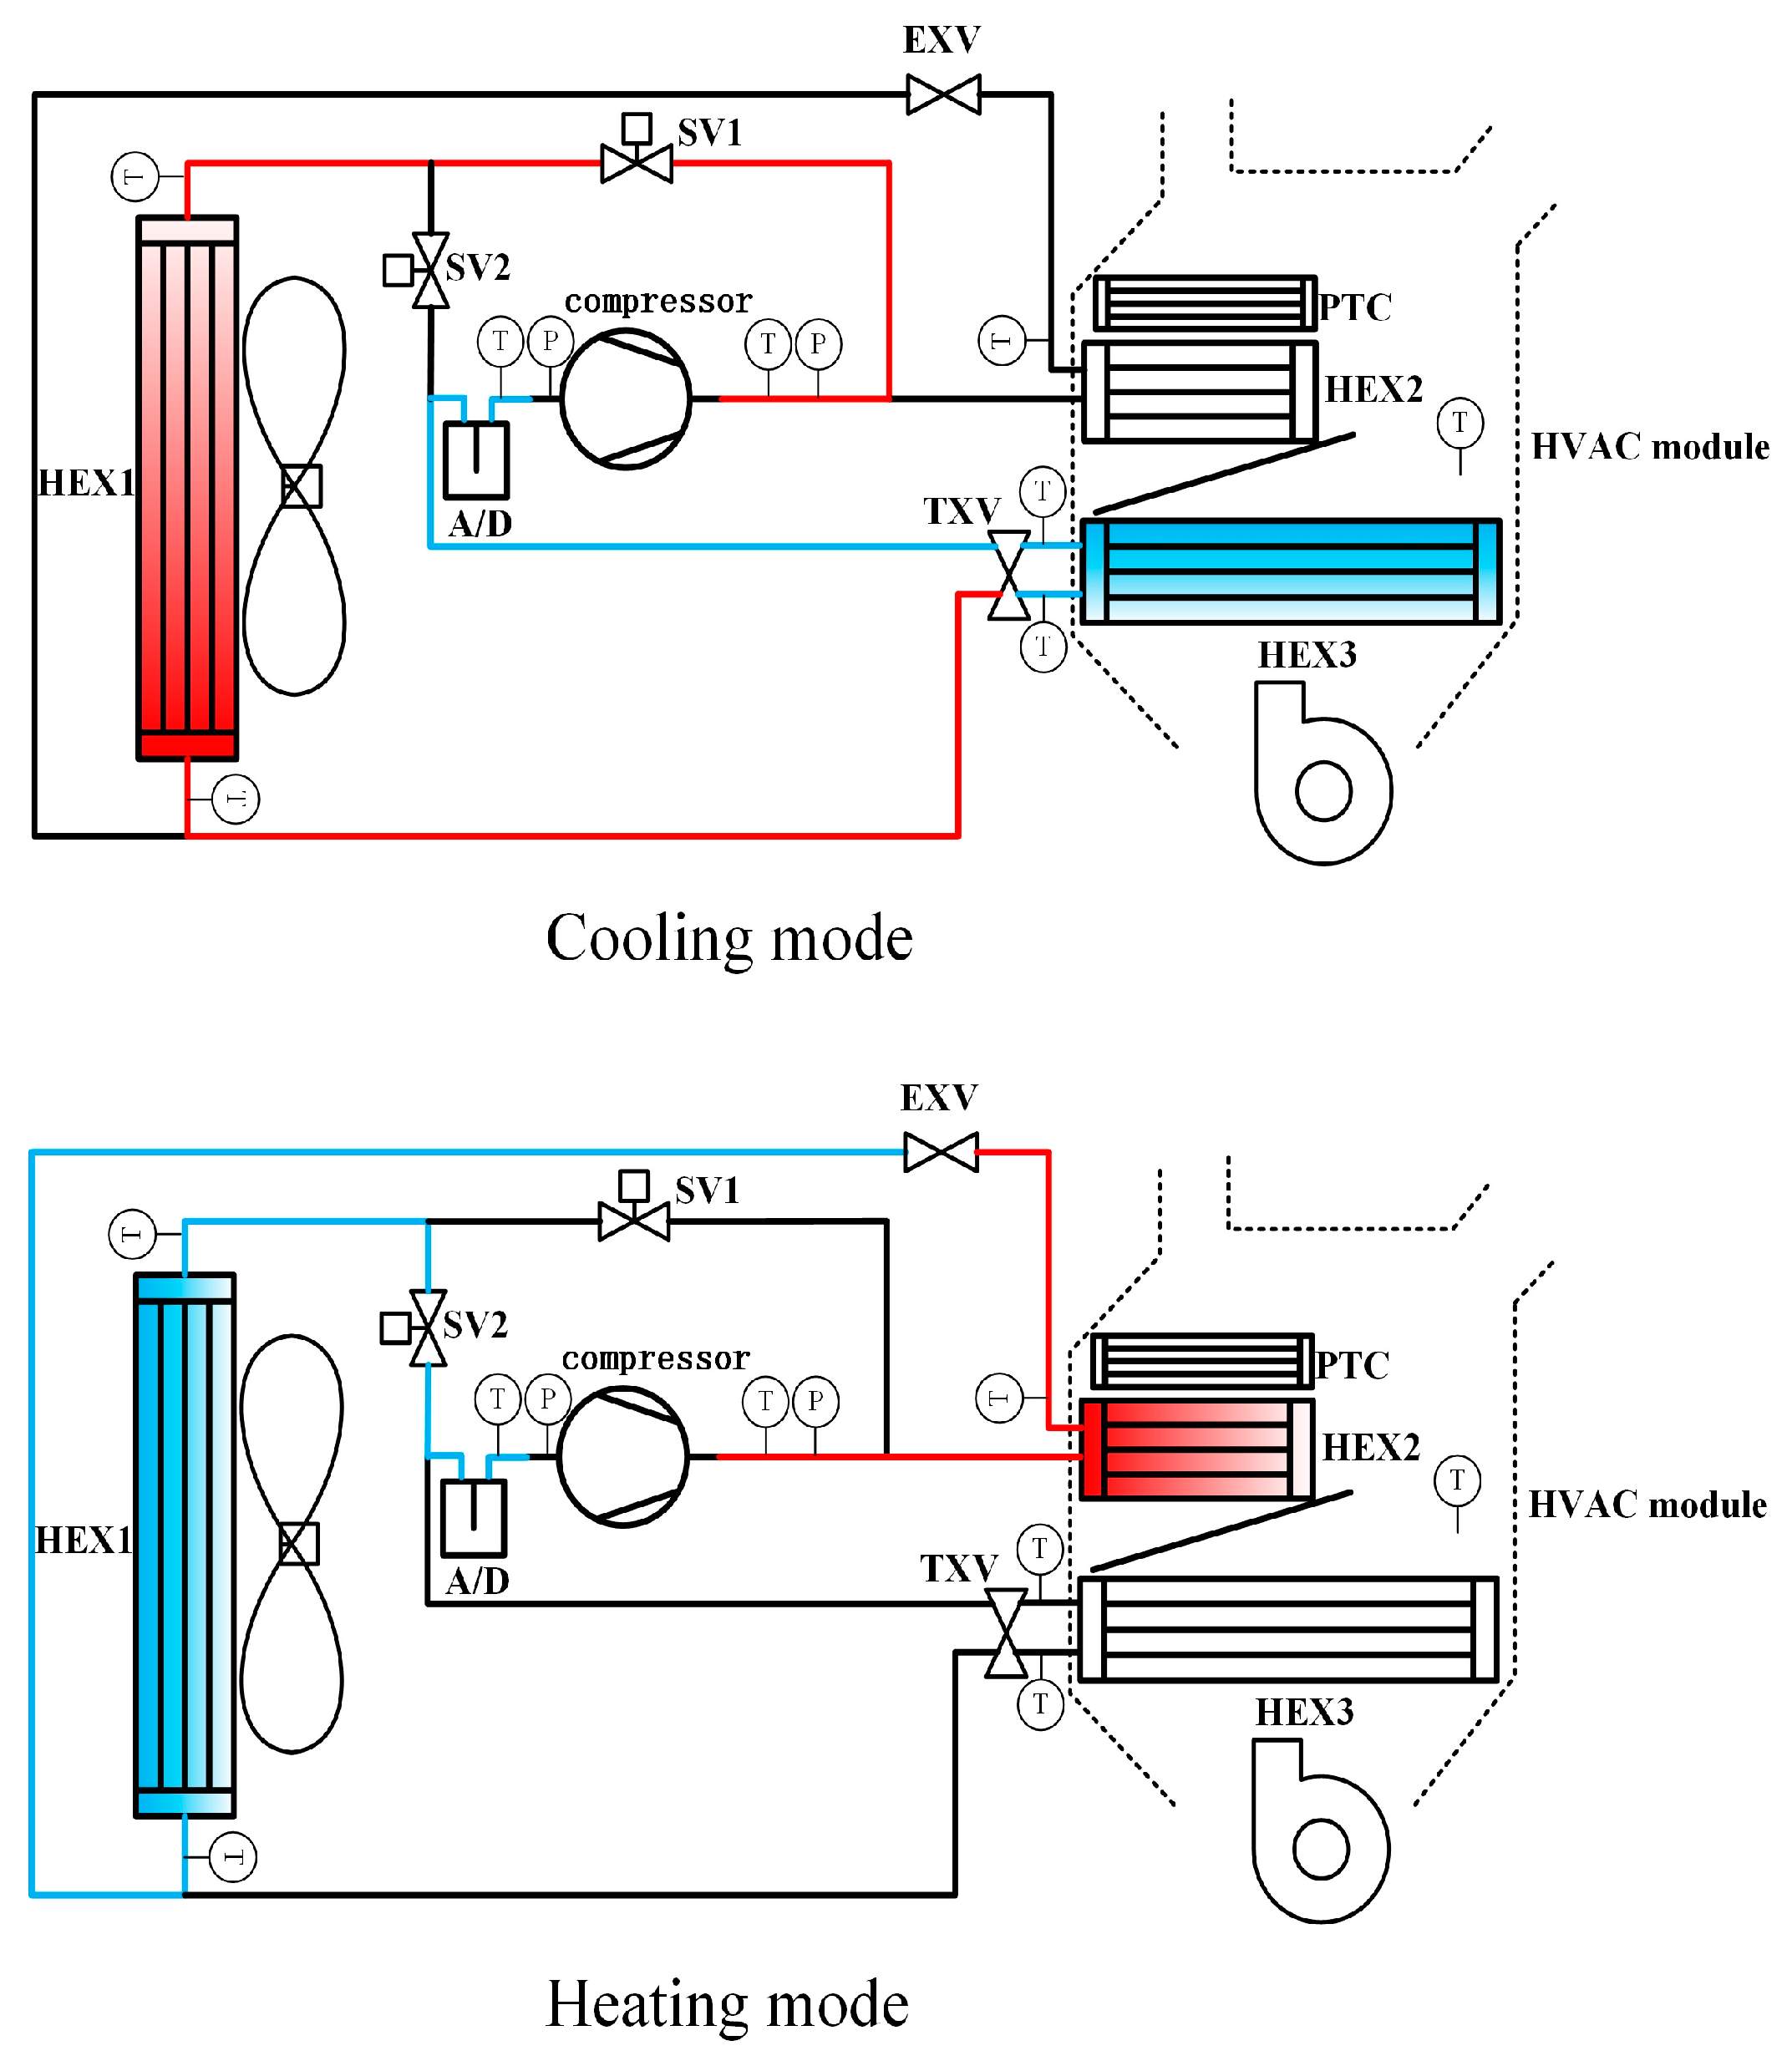
Although the R134a has been on the air-conditioning field obsolescence list, the automobile air-conditioning field renewal also needs time. The system consists of two parts, one is the heating, ventilation and air-conditioning (HVAC) module, the other is outdoor unit. The HVAC module consists of two heat exchangers (HEX2 and HEX3) and one positive temperature coefficient (PTC) for heating air, which is used to adjust the functions of cooling and heating, and to achieve requirements of temperature and humidity control in the passenger compartment. The outdoor unit is mainly outdoor cooling module, including heat exchanger (HEX1) and cooling fan. Two solenoid valves (SV1 and SV2) are used for switching cooling and heating functions. One thermostatic expansion valve (TXV) is used in the throttling of refrigerant for evaporative refrigeration when there is a need for cooling, and one electronic expansion valve (EXV) performs same function as TXV when HEX1 is needed as an evaporator. Also, a compressor and a accumulator/dehydrator (A/D) are connected by aluminium alloy pipes. Cooling and heating cycle modes of the system are shown in
Figure 2, where red colors represent high pressure part, and blue portions represent low pressure.
Cooling and heating capacity required by the system was designed according to heat load of the vehicle under ambient temperature in winter and summer. The heat load of a vehicle consists of all types of heat transferred. The heat transfer formulas are combined with some empirical parameters. The types and design conditions of each vehicle are quite different. Thereby, the heat exchanger which provides cooling and heating capacity is determined. Of course, the design of a heat exchanger needs to consider the size of the peripherals, especially the internal space of the HVAC module. The capacity of a heat exchanger is checked by a one-dimensional design and calculation method. The selection of the electronic expansion valve and thermal expansion valve is through the flow and capacity of the system. The compressor is supplied by specialized parts suppliers. The compressor has passed the performance test and durability test.
As shown in
Figure 3, the experiment is carried out on an air-conditioning enthalpy difference experimental platform, which consists of indoor and outdoor environment chambers with separate temperature and humidity control systems.
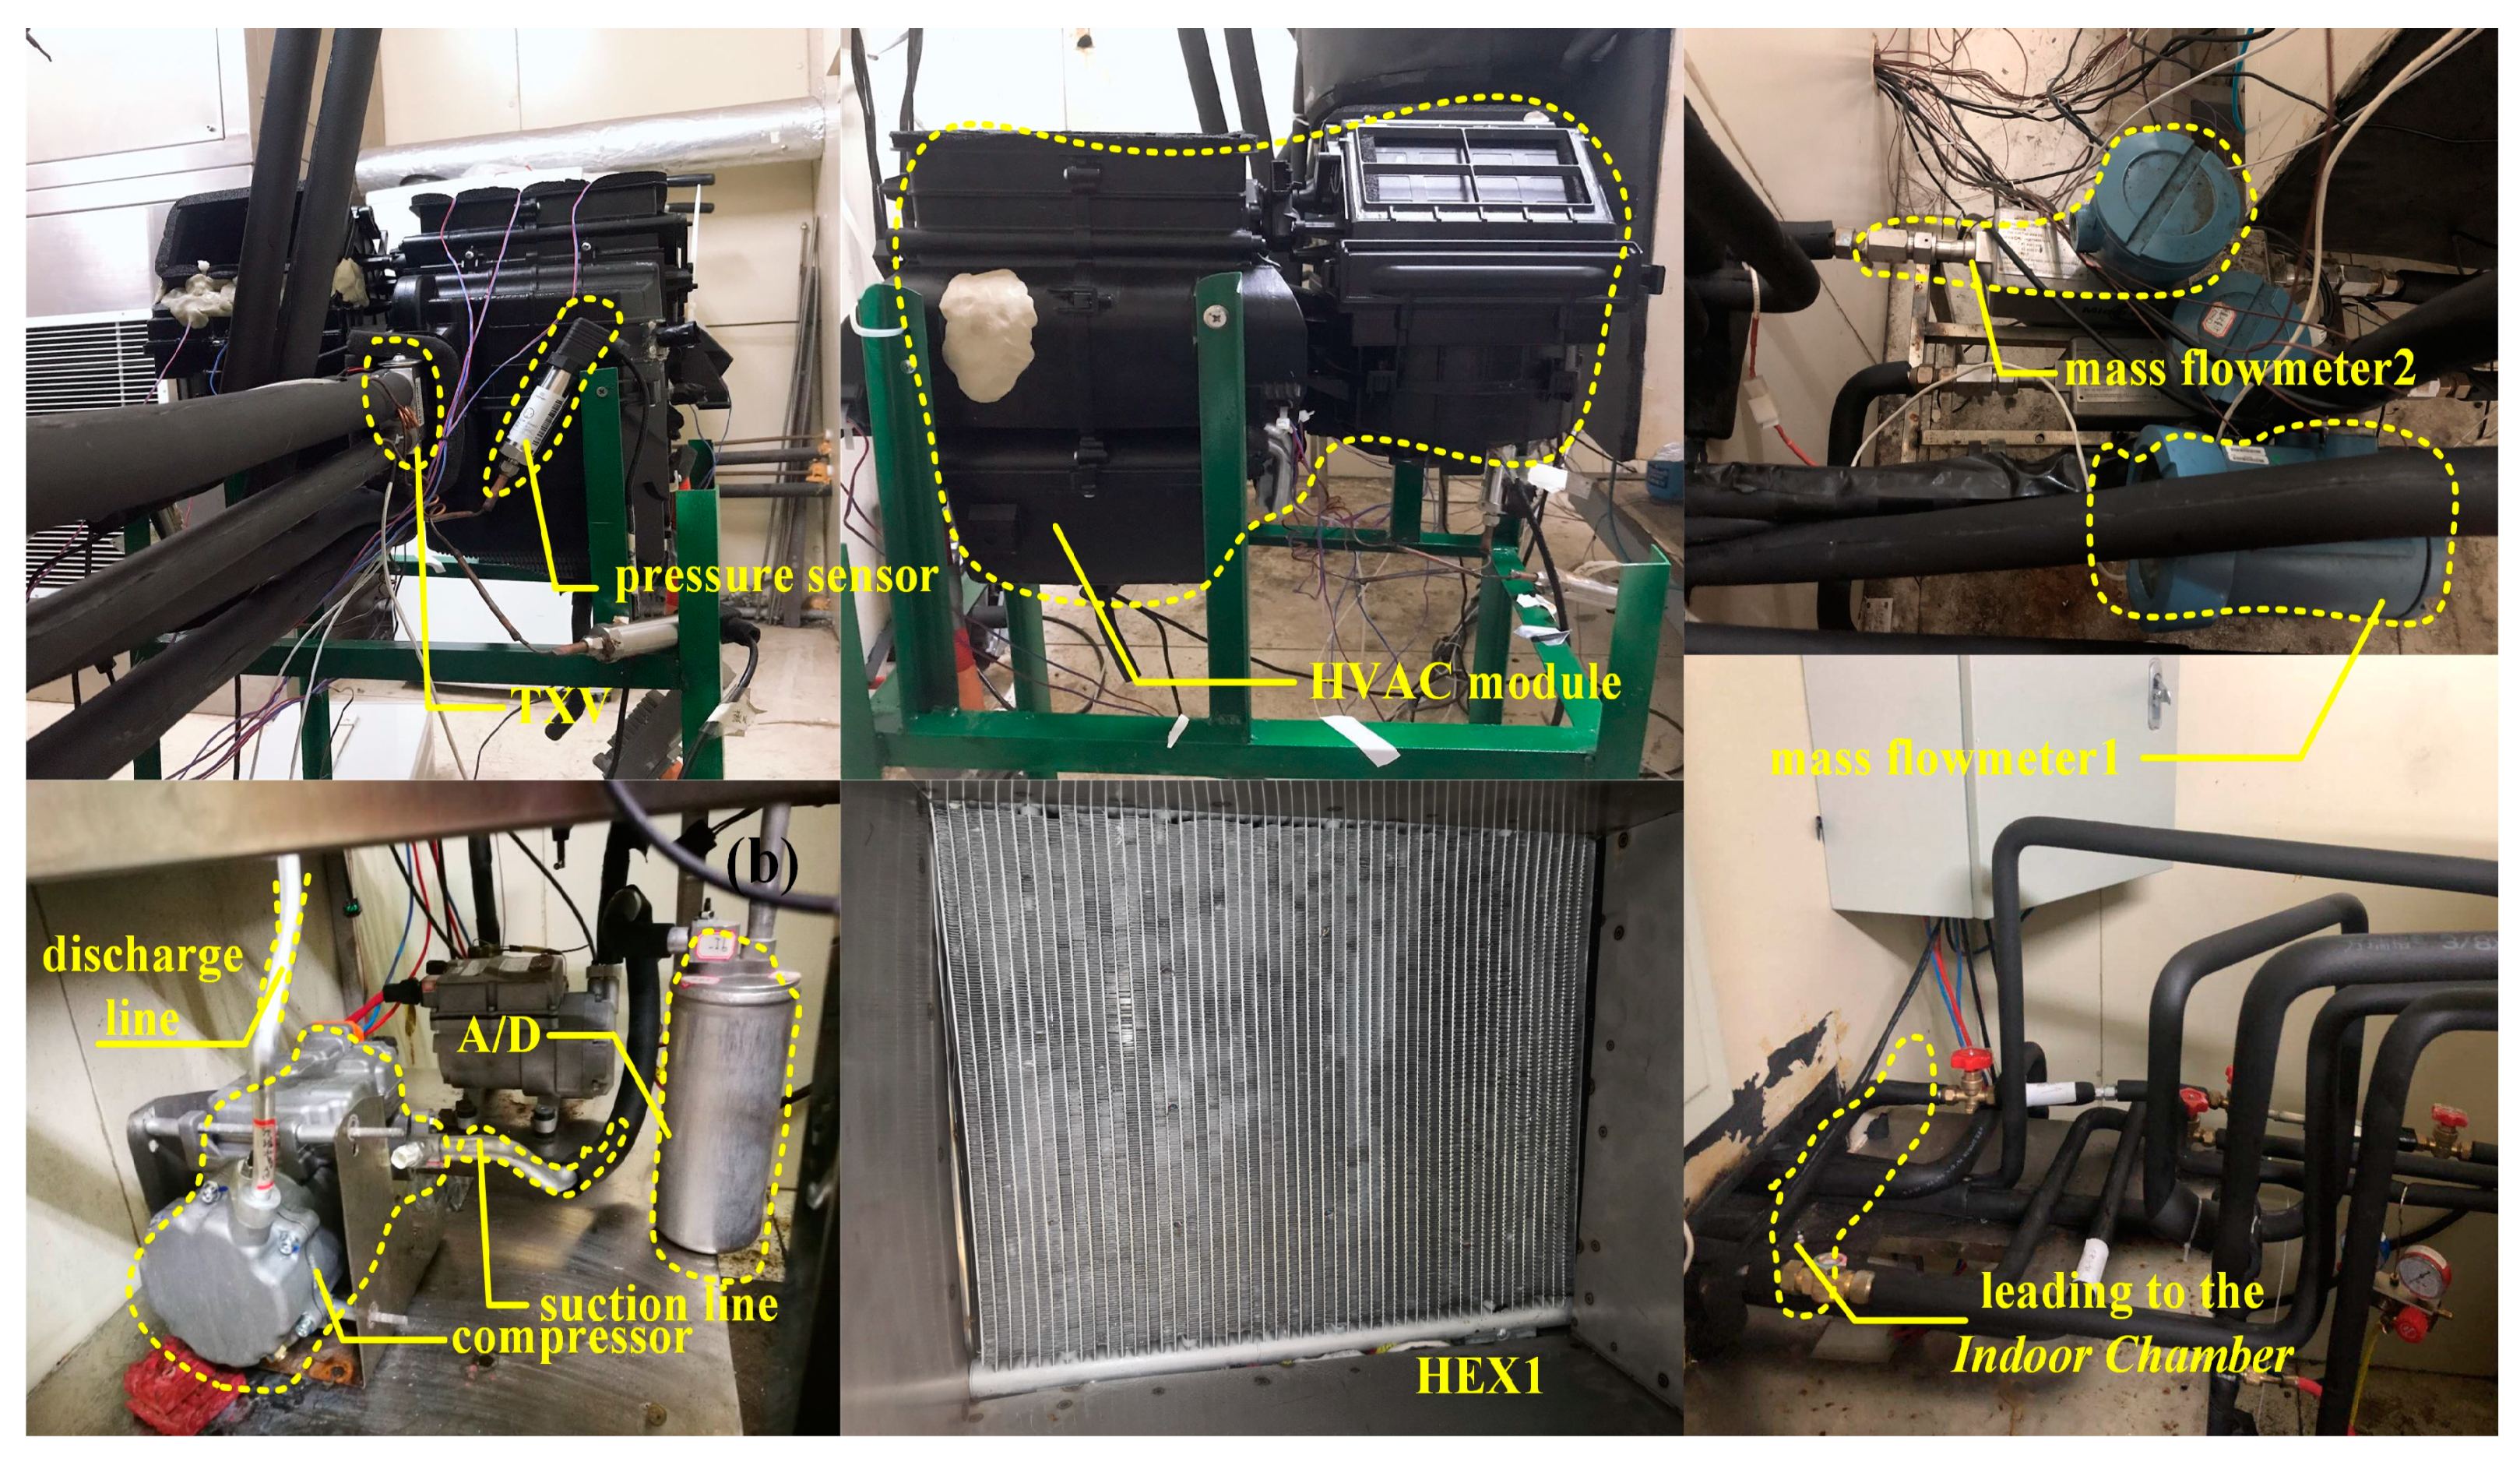
The HEX1 is positioned in the outdoor chamber, and the HVAC module which consists of HEX2, HEX3 and TXV is placed in the indoor chamber. The compressor, A/D, flowmeters and valves are mounted on the experimental bench.
A temperature and pressure sensors array were arranged along the pipeline. Considering the pressure loss, two pressure measuring points were located as close as possible to the suction and discharge ports of the compressor. After the thermocouple temperature measuring points were arranged, the pipelines were coated with insulation layers for heat preservation treatment. Further, sensors for measuring temperature and pressure were arranged at the inlet and outlet of the compressor and three heat exchangers. Subsequently, the principle of mass flowmeter arrangement is to measure mass flow rate of liquid refrigerant in the subcooling section. Compressor power was recorded by a power meter. Finally,
Figure 4 shows a physical picture of experimental system and device, including the main components described above. The data of measurement points were recorded after the system was stable for at least half an hour.
This layout fully considers the convenience of system connection. Each experimental bench, HVAC module and outdoor chamber can be flexibly adjusted. The connecting pipes of each part can be used to connect each system. A parallel flow microchannel heat exchanger (PFM-HEX) is selected as heat exchanger. The type of fin is the louver structure which is widely used. In order to meet the demand of heat transfer, four paths heat exchanger are adopted. The test conditions are typical in summer and winter.
Equipment parameters are shown in
Table 1.
Meanwhile, temperature measurement precision of the refrigerant and air is within ±0.2 °C. The accuracy of the mass flowmeter and the pressure sensor are ±0.2% and ±0.5%, respectively. A pressure-holding test of the experimental system was needed before the experiment begins, with initial 450 g of R134a charged and subsequent increment of 50 g. The air inlet flow of the outdoor crosswind side was controlled to 1600 m3/h. The air inlet flow of the indoor crosswind side were controlled to 350 and 250 m3/h, respectively, under cooling and heating modes. The relative humidity of indoor air inlet under cooling and heating mode was controlled to 40%. The temperature of indoor air inlet under cooling and heating mode were controlled to 27 and 0 °C, respectively. The compressor speed was set to 3000 and 4000 RPM.
2.2. Charge Amount Theoretical Calculation Model
The refrigerant charge of the system includes refrigerants existing in compressors, condensers, evaporators and connecting pipes. Considering the complicated phase change of refrigerants in condensers and evaporators (coexistence of single-phase and two-phase zones), where density cannot be calculated directly in the two-phase region, a parameter of void fraction is introduced for further calculation.
The hypothetical methods for calculating porosity can be found in previous studies [
25,
26,
27]. Three instructive classical models including the Tandon model, the Prelimi empirical formula model, and the mass-flux-dependent empirical model (Hughmark model) would be introduced hereafter.
The formula is shown in Equation (1). The formulas for calculating the charge of each part are shown in Equations (2)–(7). The definition of the void fraction is shown in Equation (8). The tubes of high pressure section are from compressor to condenser and condenser to throttle valve. The tubes of low pressure section are the outlet of the evaporator to A/D (Accumulator/Desiccator). The throttle-to-evaporator and A/D-to-compressor pipes are short enough to be negligible. The single-phase refrigerant charge is calculated in tubes of high pressure and low pressure. The refrigerant charge calculated in condenser and evaporator includes single-phase and two-phase regions.
The total charge amount (
mtotal) includes five parts: compressor (
mcompressor), tubes of high-pressure (
mthp), tubes of low-pressure (
mtlp), condenser (
mcon) and evaporator (
mevp).
The refrigerant charge of the compressor is obtained by multiplying the average values of suction density (
ρsuc) and discharge density (
ρdis) by the volume of the compressor (
Vcompressor).
The refrigerant charge in tubes of high pressure consist of two parts, on the premise of knowing the section area of the pipeline. The refrigerant charge is obtained by multiplying the density of gas (
ρg) and liquid (
ρl) refrigerants by integral along length of the tube. The calculation of refrigerant charge in the low pressure tubes is the same as that in high-pressure tube, which includes the refrigerant charge of A/D (
mA/D).
The refrigerant charge of the condenser and evaporator includes a two-phase region (
mtp). The condenser contains a refrigerant charge of superheated gas and subcooled liquid. The refrigerant charge in these parts is obtained by multiplying density (
ρcong is density of gas section in condenser/
ρconl is density of liquid section in condenser/
ρevag is density of gas section in evaporator) by the integral along the length of tube (
Lg is length of gas section/
Ll is length of liquid section), and then by multiplying the cross-sectional area of the tubes.
The calculation of refrigerant mass in two-phase region needs to know density along the length of the tube (ρg is density of gas/ρl is density of liquid). The calculation of void fraction is used to comprehensively consider the effects of gas and liquid refrigerants on density. Ltp represents length of the two-phase section.
In the charge amount theoretical calculation model,
ε is void fraction, which is defined as:
where
Vg,
Vl are volumes of gas section and liquid section in two-phase section,
Ag and
Al are cross-sectional areas occupied by gas section and liquid section.
Different models for calculating void fraction have been applied. The Tandon calculating model is shown below [
26].
Premoli’s calculating model is shown below [
27].
Hughmark ‘s calculating model is shown below [
27].
Some of these dimensionless numbers and refrigerant state parameters are shown in the Nomenclatures table.
3. Results and Discussion
3.1. Discharge Pressure and Discharge Temperature Variations
The pressure of a vapor compression system can reflect the state of the system well. For the cooling mode of the air-conditioning system, discharge pressure corresponds to condensation temperature. The condensation temperature has significant impact on compressor power and COP of the system’s cooling capacity. For heating mode of heat pump system, discharge pressure also has a decisive influence on exit temperature of the HVAC module and COP of system heating capacity. The discharge temperature is very important to the operating performance and reliability of compressor. Higher discharge temperature corresponds to lower isentropic efficiency and higher compressor power consumption. The results of discharge pressure variations are shown in
Figure 5. The results of discharge temperature variations are shown in
Figure 6.
Under cooling and heating modes, variation trends of discharge temperature are the same for different charge quantities. In other word, the evaporation pressure will increase accordingly. That is to say, the suction pressure would also increase. At the same compressor speed, the small changes in pressure ratio lead to increase of discharge pressure. Under the same working conditions, the higher the speed of the compressor, the greater the compression pressure ratio. For the same refrigerant charge, higher compressor speed can result in higher discharge pressure; while for heating mode, high compressor speed corresponds to a large compressor compression ratio. It is found that the compressor discharge pressure changes sharply with the increase of compressor speed.
It is noteworthy that under cooling or heating mode, continuously increasing charge quantity will reduce discharge temperature. This phenomenon is beneficial to the stability of compressor operation. The greater the quantity of refrigerant the system has, the more liquid refrigerant circulation quantity will be due to enhanced heat absorption (superheat of suction decreases). The evaporation pressure increases slightly with the increase of refrigerant charge based on the experimental results. Slightly higher evaporation pressure is a result of more vapor phase refrigerant by more refrigerant quality in the system cycle. Since compression ratio has little change for the same compressor speed, the discharge temperature of the compressor decreases with the increase of the refrigerant charge. Additionally at the same refrigerant charge, the compressor speed shows a greater impact on the discharge temperature of the compressor in the heating mode. The change of discharge temperature corresponds to the drastic change of discharge pressure. These conclusions are consistent with those of previous studies [
28,
29,
30].
3.2. Exit Temperature Variations of Heating, Ventilation and Air-Conditioning (HVAC)
Exit temperature is an important parameter to evaluate comfort especially for the HVAC module.
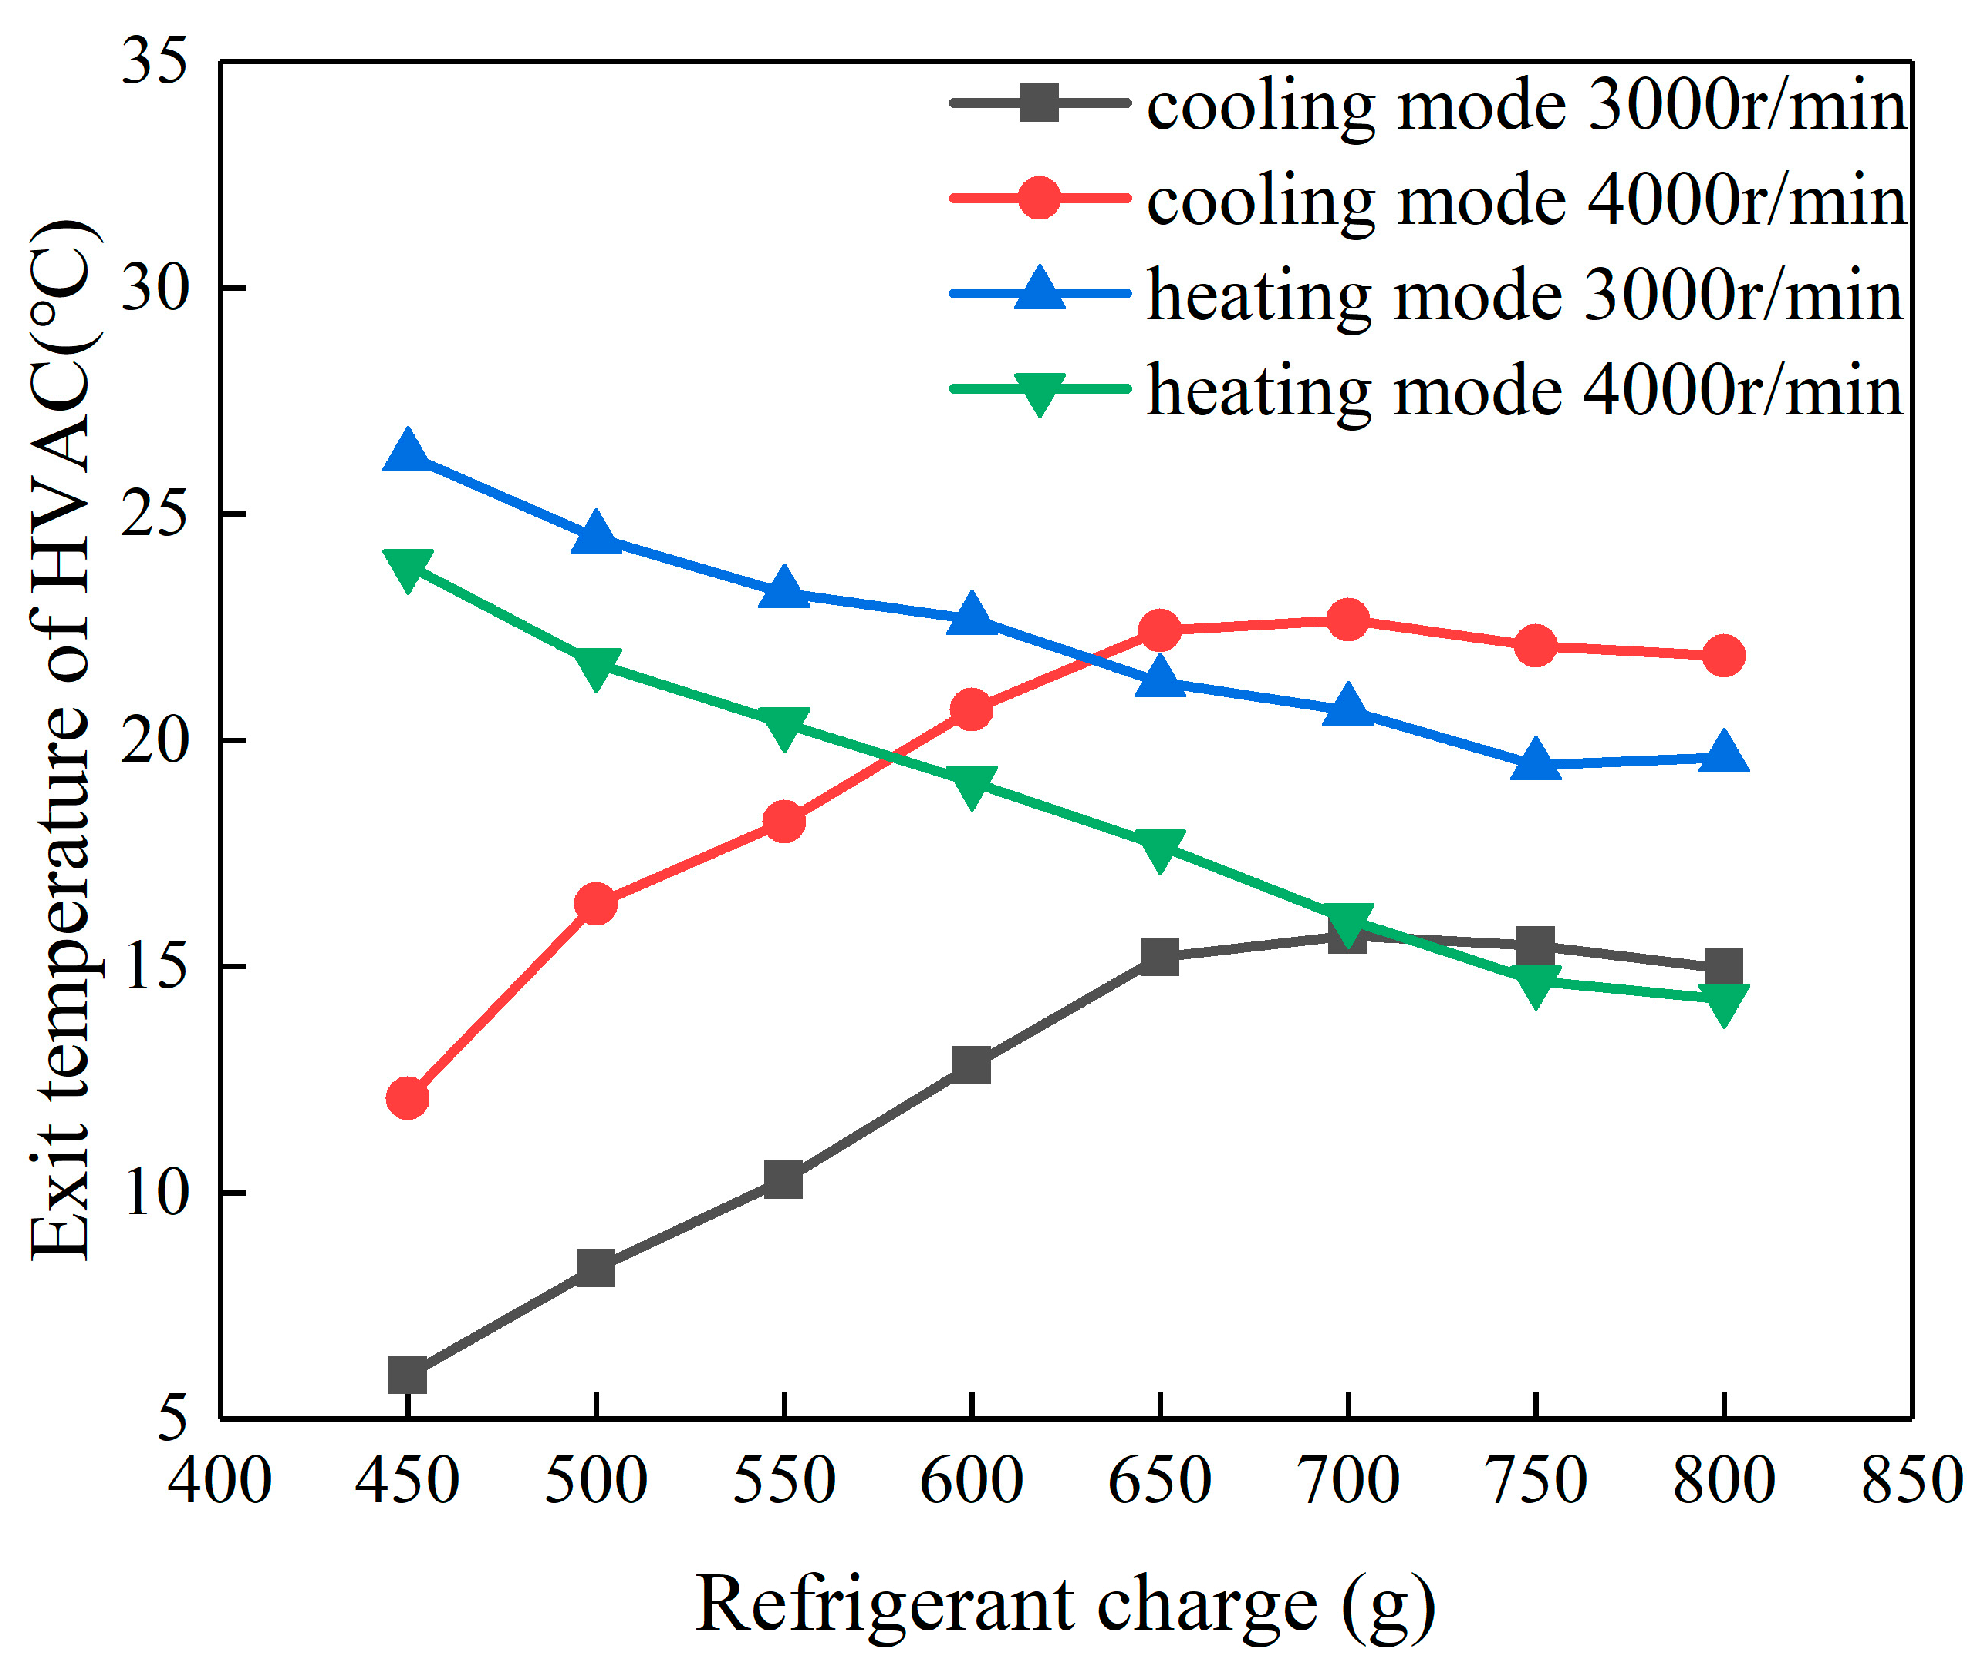
Figure 7 shows the variation of exit temperature of the HVAC module with refrigerant charge.
Exit temperature of the HVAC module in cooling mode of blowing surface gradually increases to stable value. Exit temperature tends to be stable for refrigerant charge exceeding 650 g. At this time, exit temperature can reach 15 °C, which can meet the comfort requirements of a passenger cabin in summer under design conditions. Exit temperature of the HVAC module in the blowing heating mode gradually decreases to stable value. When refrigerant charge reaches to 750 g, the exit temperature also becomes stable, and the minimum exit temperature can reach 14 °C at compressor speed of 4000 r/min. The compressor speed increases but exit temperature decreases, it is obviously due to the impact of reduced discharge pressure.
3.3. Capacity and COP (Coefficient of Performance, Ratio of Capacity to Power) Variations
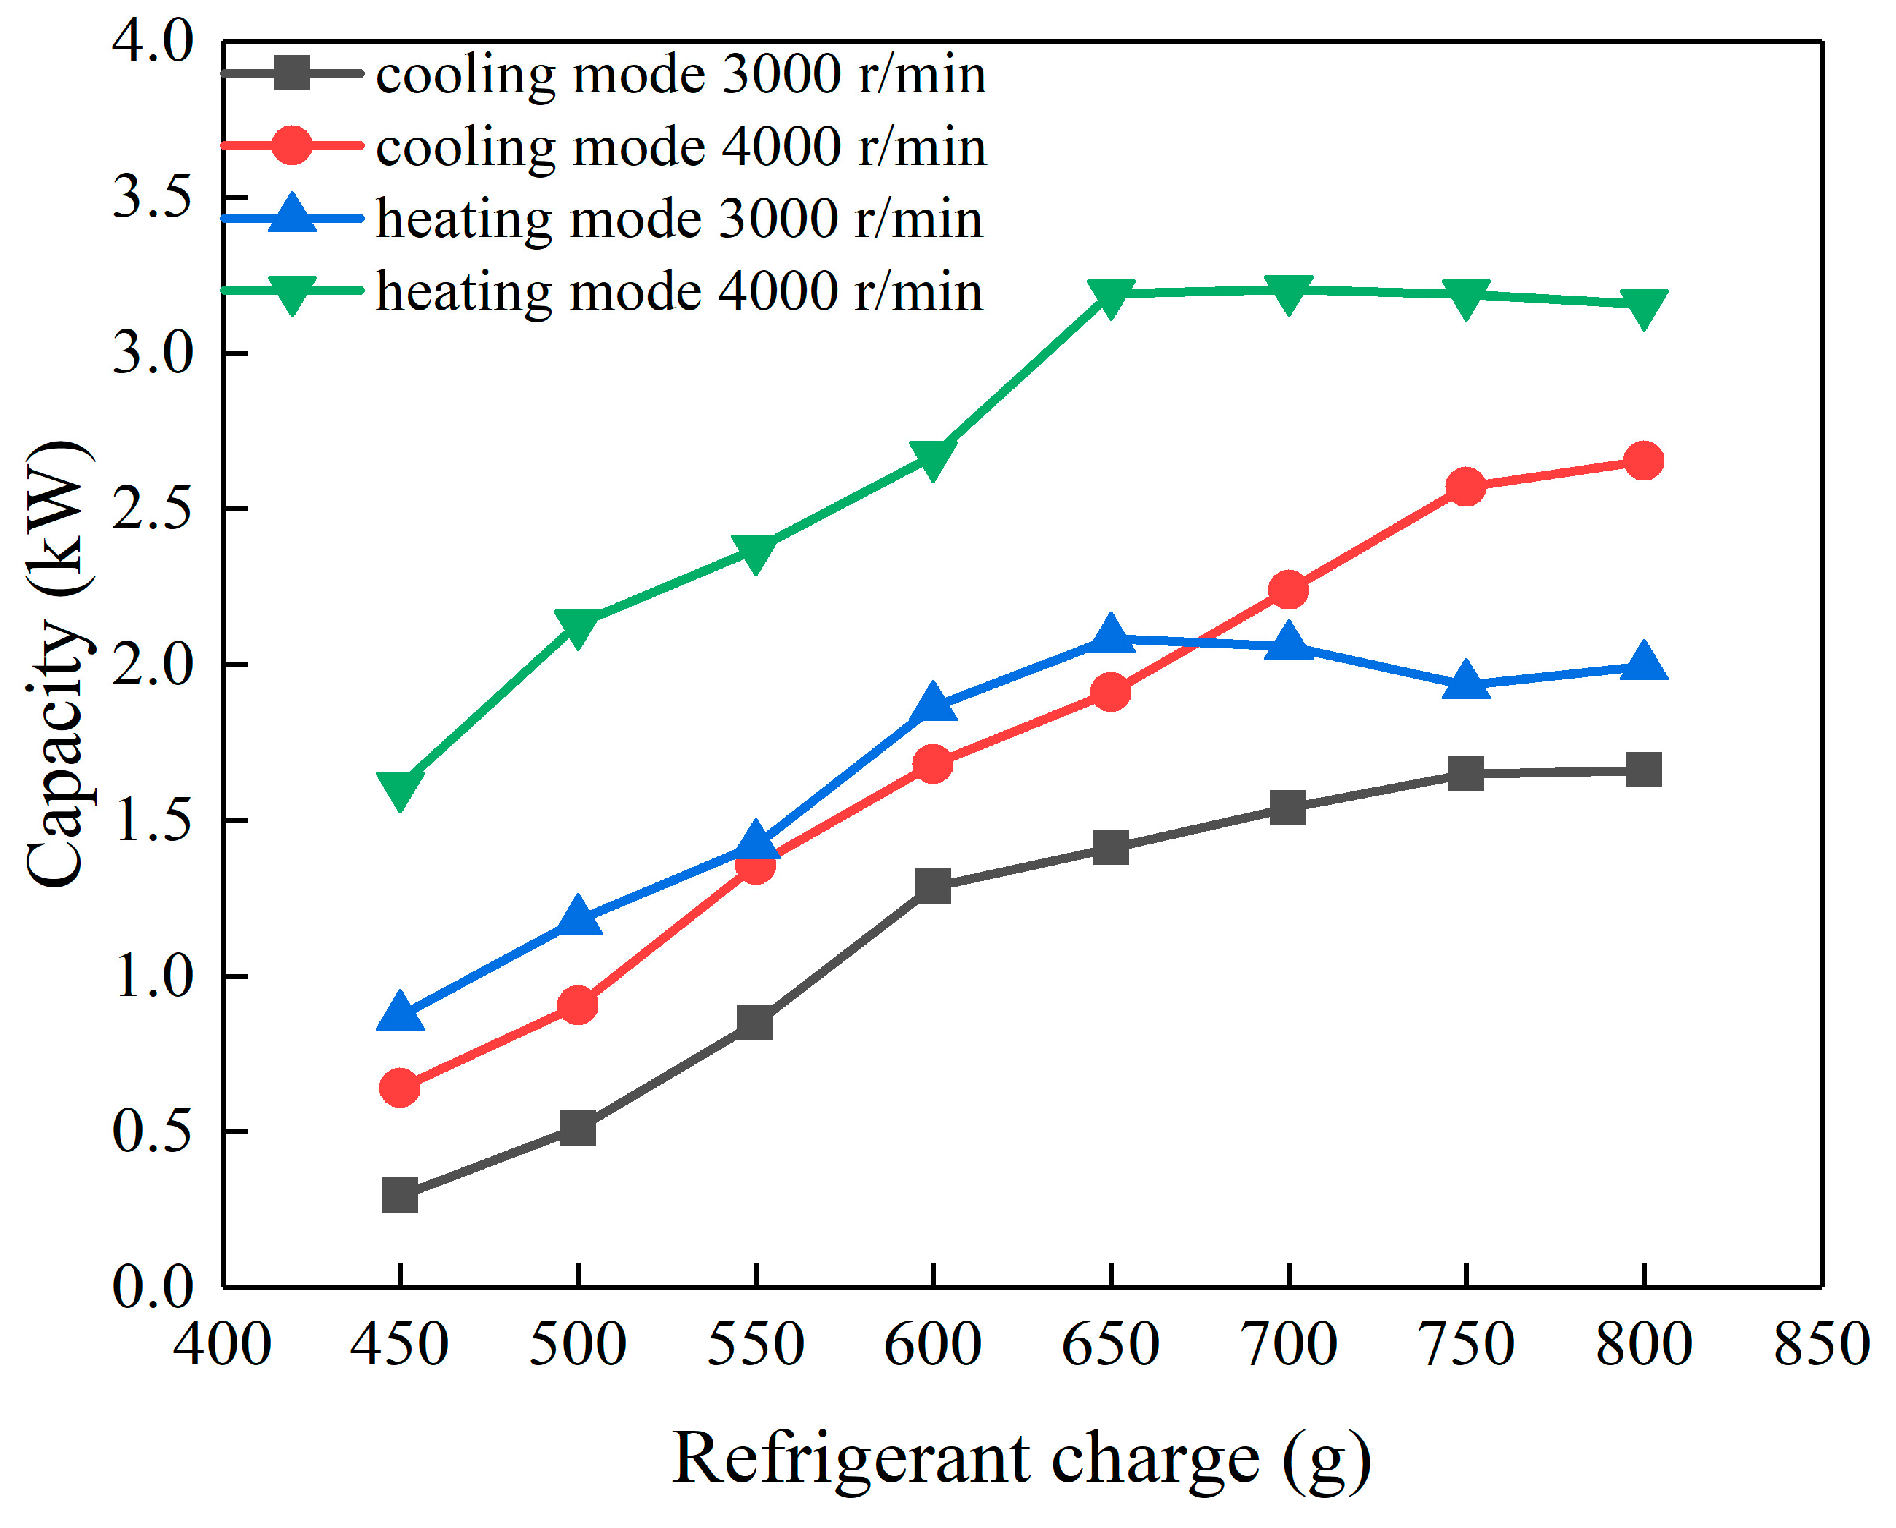
Figure 8 shows the trend of cooling capacity and heating capacity with refrigerant charge.
In the cooling mode, cooling capacity of the system shows positive correlation with refrigerant charge in the system. When refrigerant is gradually charged to 750 g, the cooling capacity reaches the maximum value of 2.63 kW, which can meet the demand of thermal load in the vehicle in summer. It is found that cooling capacity varies slightly when refrigerant charge continues to increase. The reason is suggested to be the lower mass flow of refrigerant through the evaporator when the charge is insufficient. The heat transfer area of the evaporator can not be fully utilized, resulting in a large overheat at the outlet of the evaporator and a low cooling capacity. With the enlarged refrigerant charge, the mass flow of refrigerant through the evaporator is increasing. So the effective heat transfer area of the evaporator is expanded, accompanied by increasing cooling capacity. Before the cooling capacity reaches its peak, the mass flow rate of refrigerant in the evaporator occupies the dominant position in heat transfer. Also, with the increase of refrigerant, the evaporation temperature rises continuously, which leads to the decrease of heat transfer temperature difference. At this time, the heat transfer temperature difference occupies the domination in heat transfer and restrains the further increase of cooling capacity. This is why the cooling capacity increases slowly or decreases slightly after peaking.
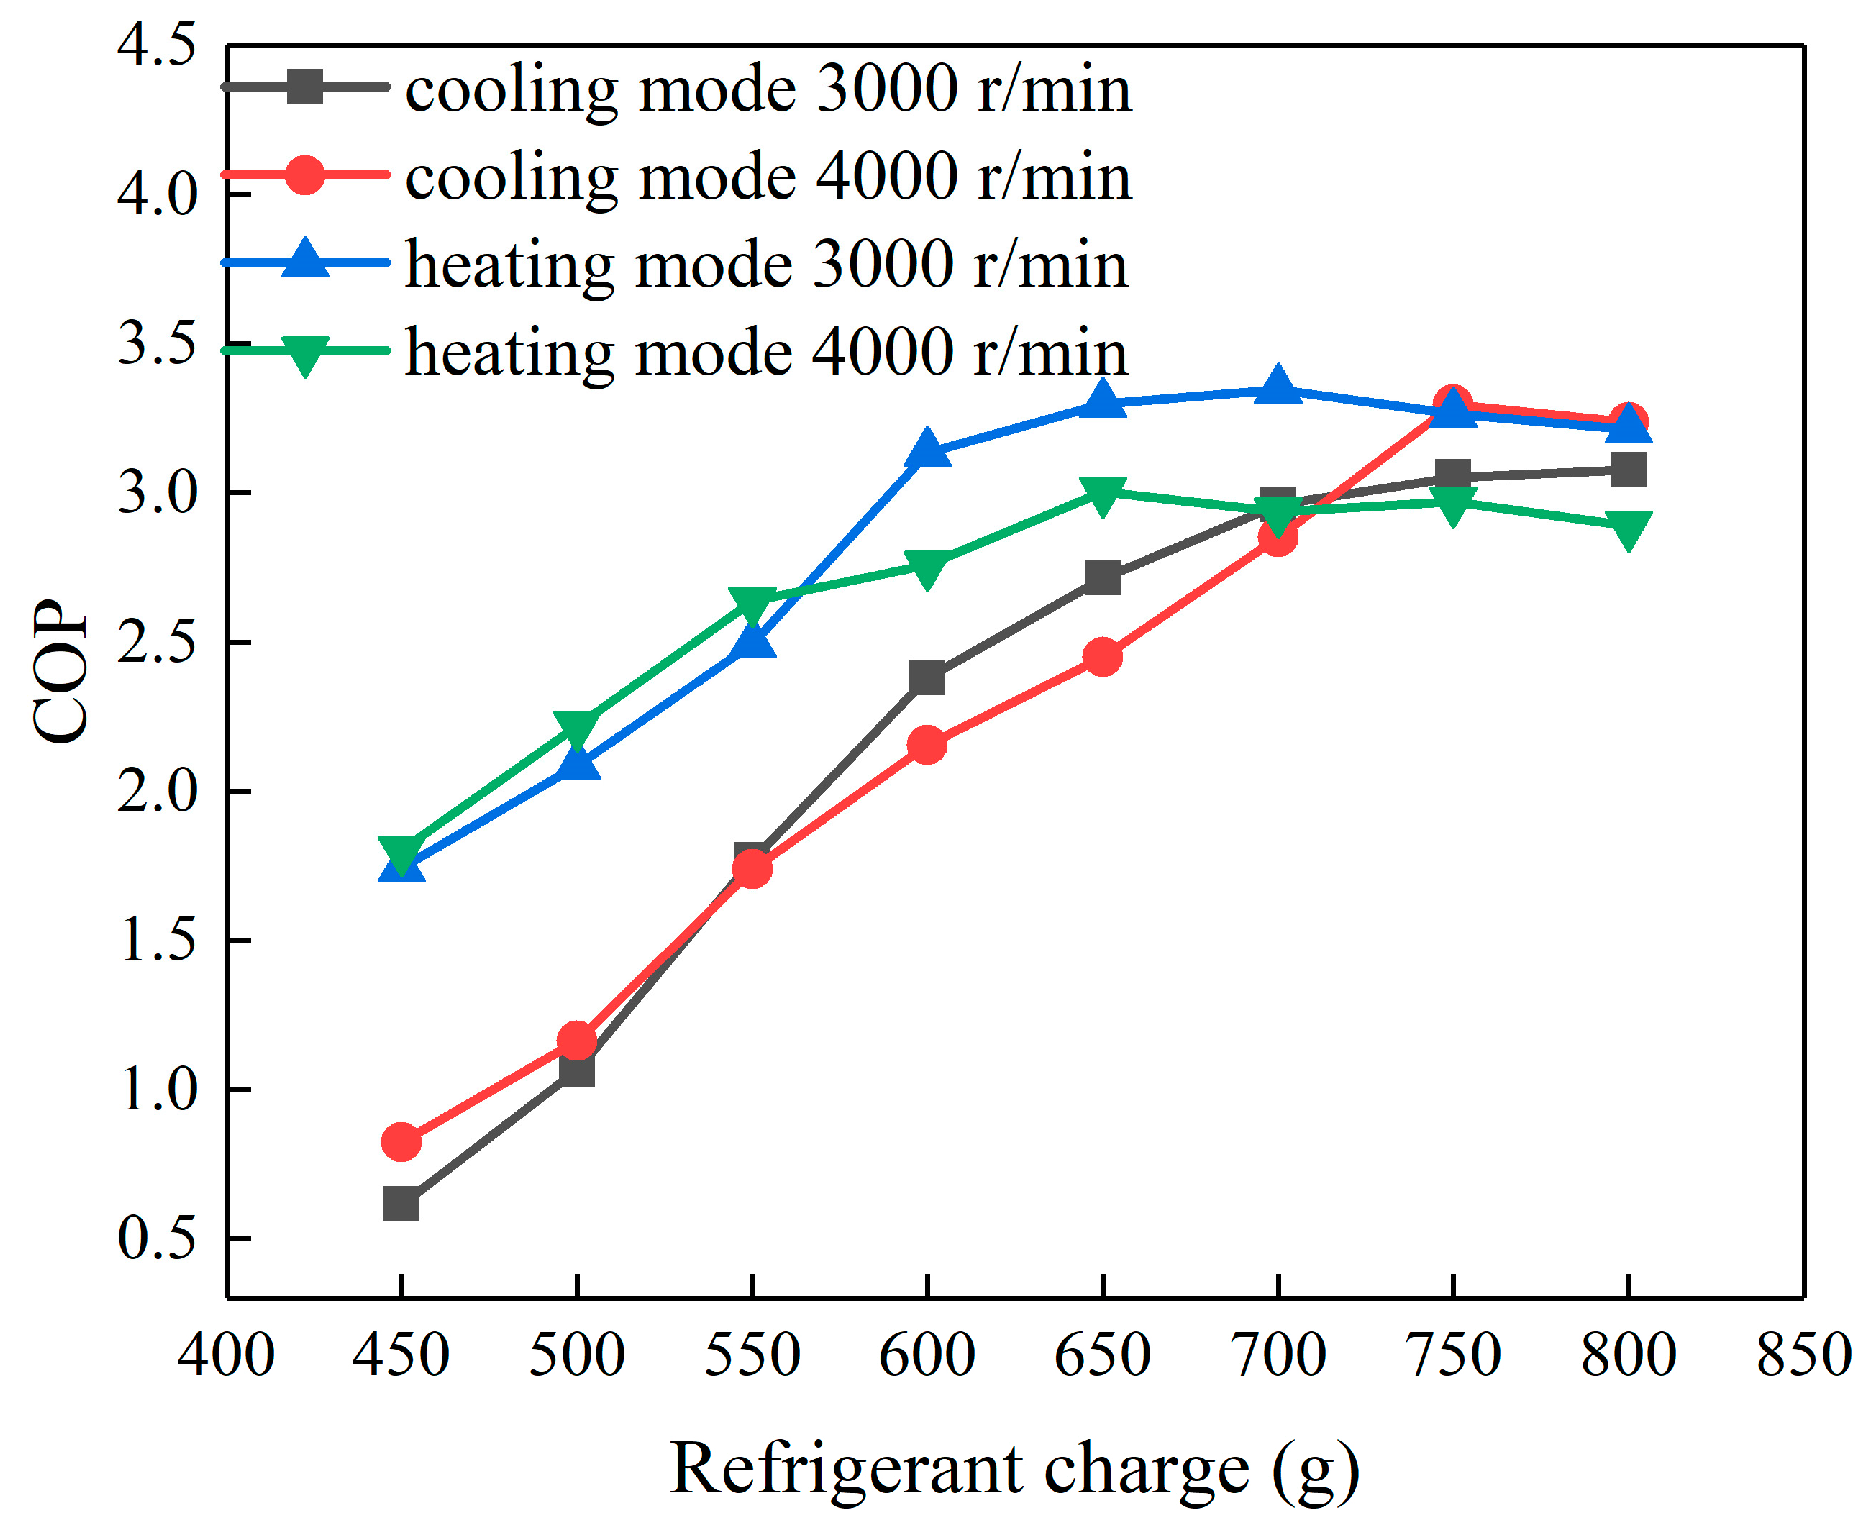
When the system switches to cooling mode, refrigerant charge amount increases gradually, COP reaches its peak at 750 g as shown in
Figure 9 with a maximum 3.29.
When the refrigerant charge is further increased, COP remains stable or decreases slightly. This phenomenon is mainly attributed to the weak pressure ratio (of suction and discharge pressure in compressor) changes with the increasing refrigerant charge. As the power of the compressor changes little, so the trend of COP variation is basically consistent with the trend of cooling capacity variation. Similar tendencies were observed for heating mode. When the system is gradually charged to 650 g, the heat capacity reaches the maximum value of 3.19 kW, which supplies the load demand in winter. When charging again, the heating capacity varies slightly. The reason is also that the lower temperature difference of heat transfer in the evaporator has restrained the increase of heating capacity. At the same time, COP is basically the same as that of heat capacity. It increases with the increase of refrigerant charge, reaching a peak value at 650 g of refrigerant charge. At the same time, a maximum COP 3.34 was found for 4000 r/min.
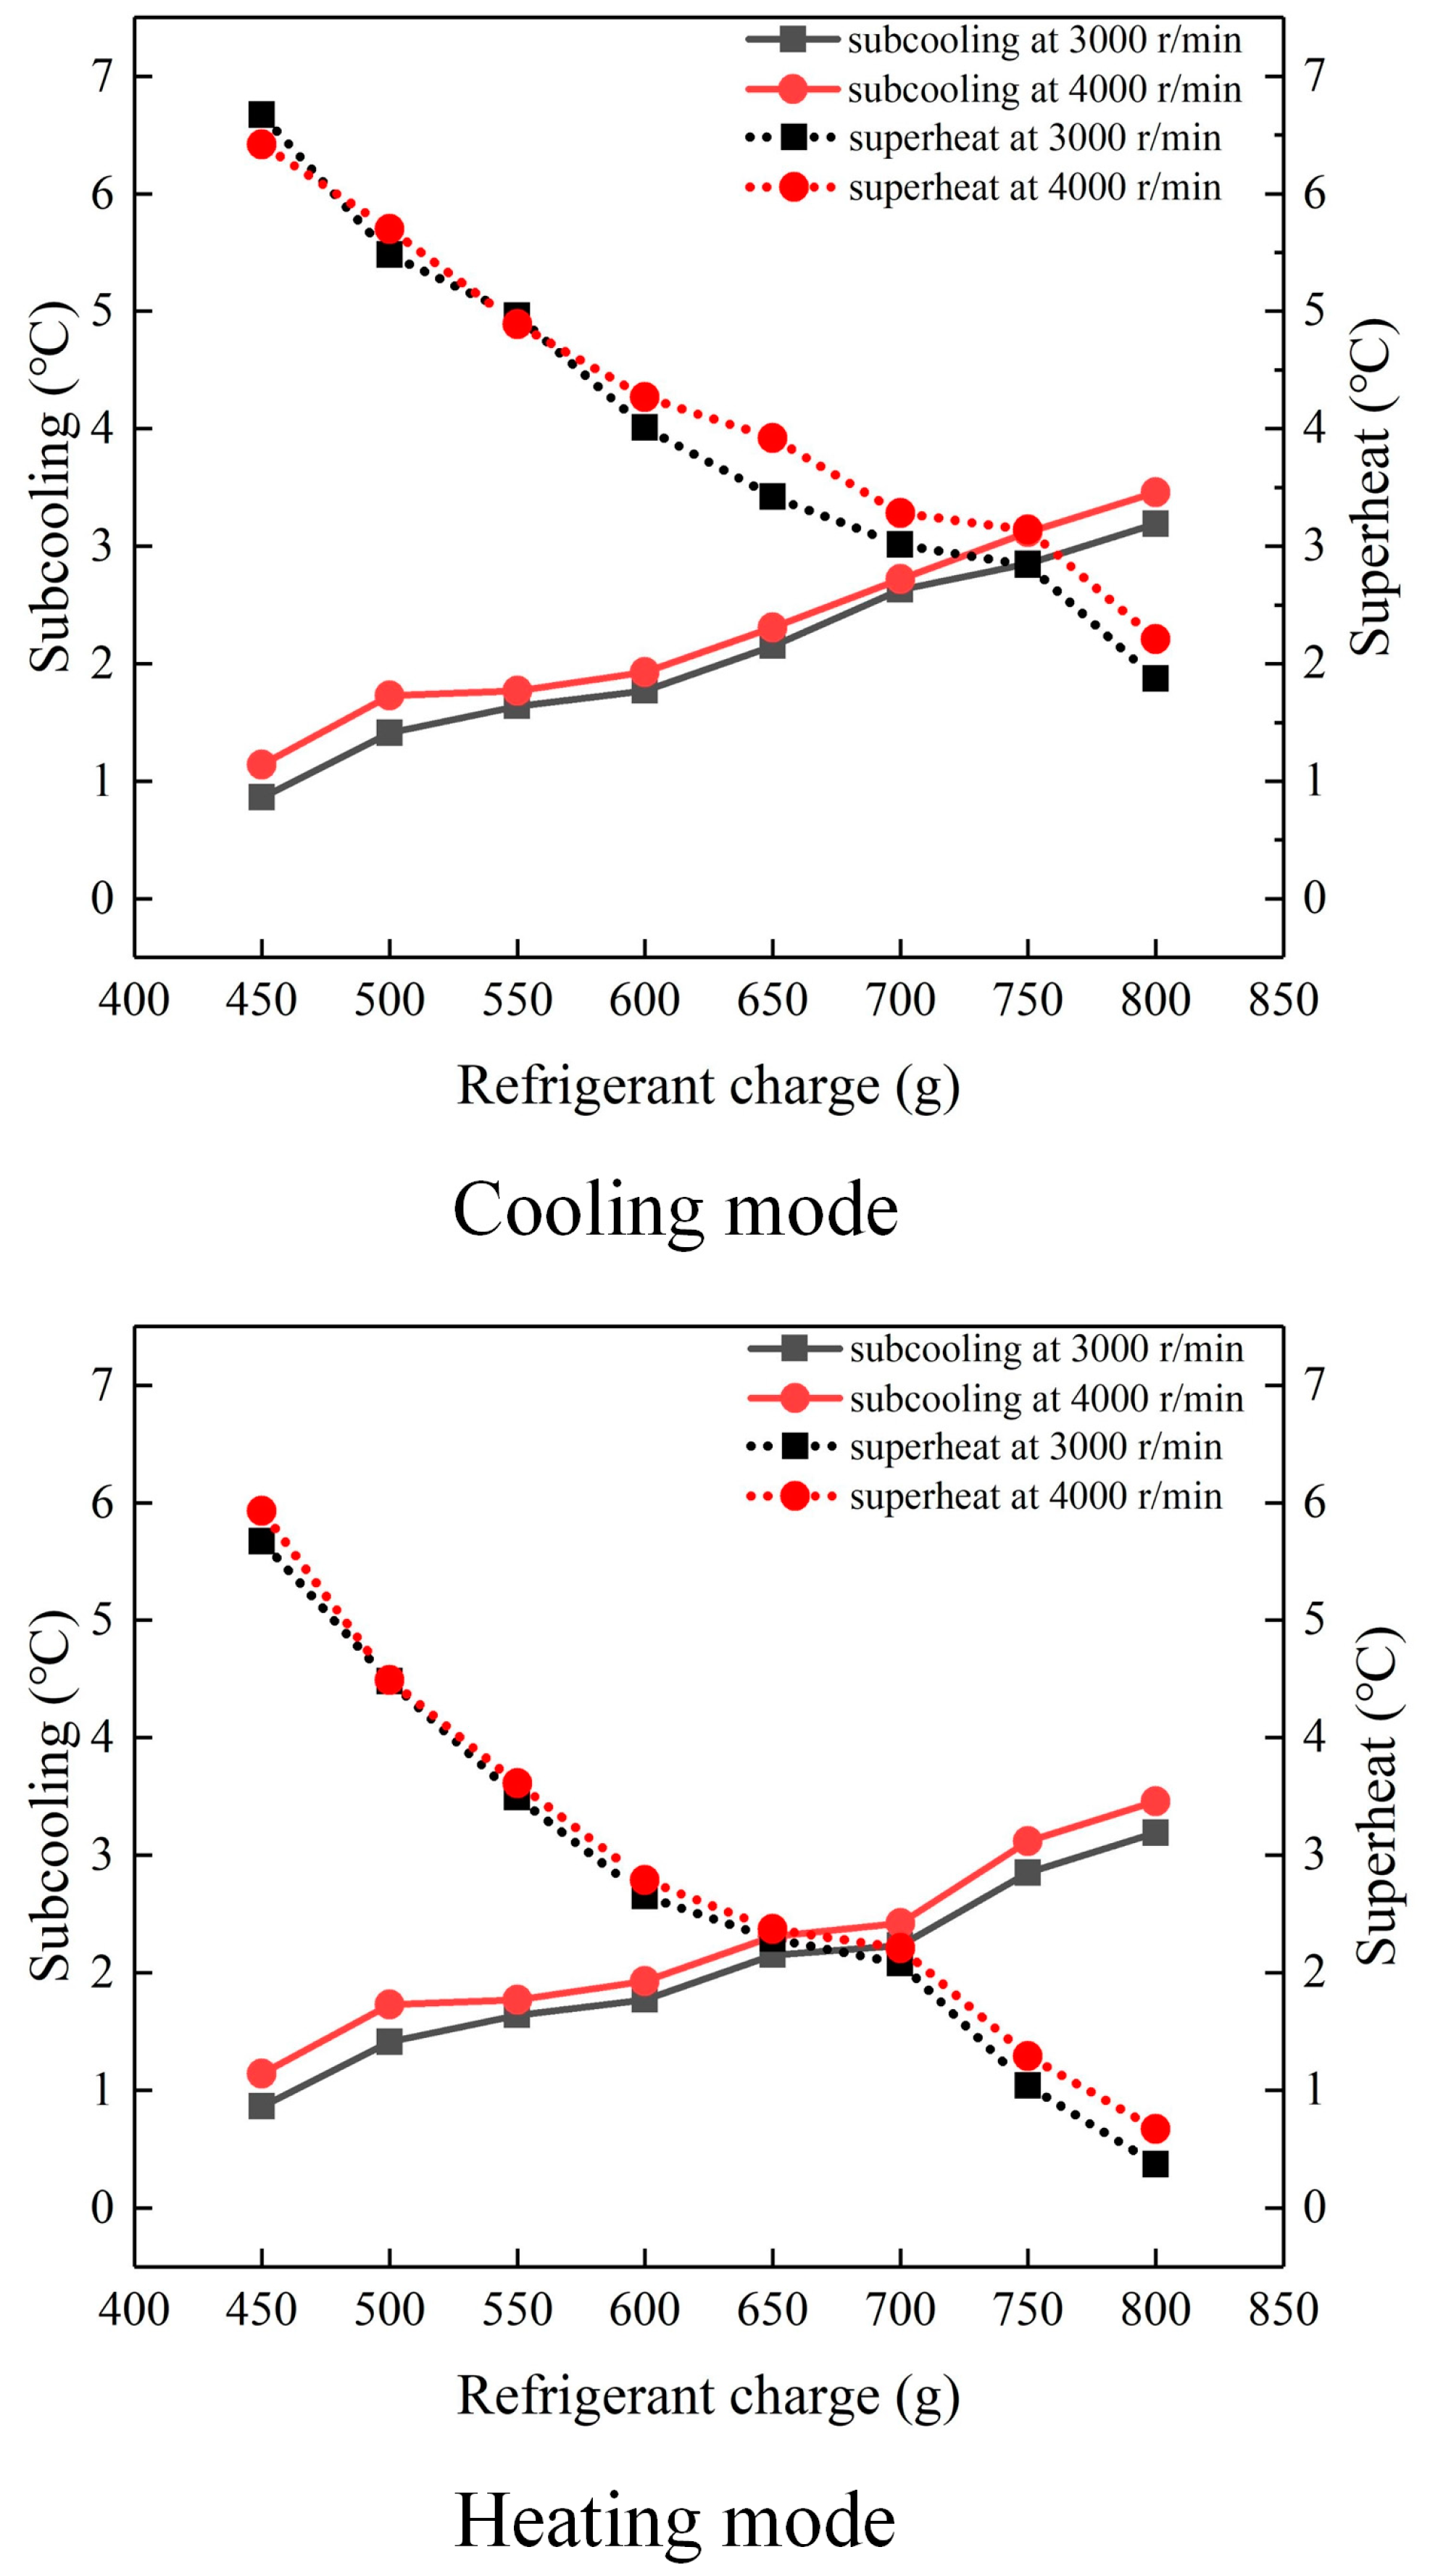
3.4. Subcooling and Superheat Variations
The subcooling degree of condenser outlet and the superheating degree of the evaporator outlet are the most important indicators to judge whether the refrigerant charge is appropriate in an EV (electric vehicle) ACHP system.
Figure 10 shows the trend of subcooling and superheating with refrigerant charge.
It shows that for less refrigerant conditon, the relativel small subcooling and large superheating are unfavorable to the performance of the system in operation. With the enlarged refrigerant charge, the subcooling increases and the superheating decreases. In cooling mode, the curves of subcooling and superheating are relatively stable for charge range of 700–750 g, and the curves intersect when the charge is 750 g; while for heating mode, the stable stage appears in the charge range of 650–700 g and intersect at 650 g. This is due to the fact that within this range, cooling capacity has reached its maximum, which means effective heat transfer area of the evaporator has been fully utilized, resulting in stable capacity and COP. Therefore, we choose the intersection point when the subcooling and superheating are relatively stable as the optimal charge of the system, i.e., optimal charges of ACHP system in the cooling and heating mode are 750 g and 650 g, respectively. However, considering the system can only have one optimal charge, the cross range of 700 g under two modes is selected. Under this optimal charge, cooling capacity decreases 6.7% and heating capacity decreases 1.8% compared with the maximum value, then COP decreases 13.7% and 3.3%. This shows that the system still has good performance in both summer and winter conditions.
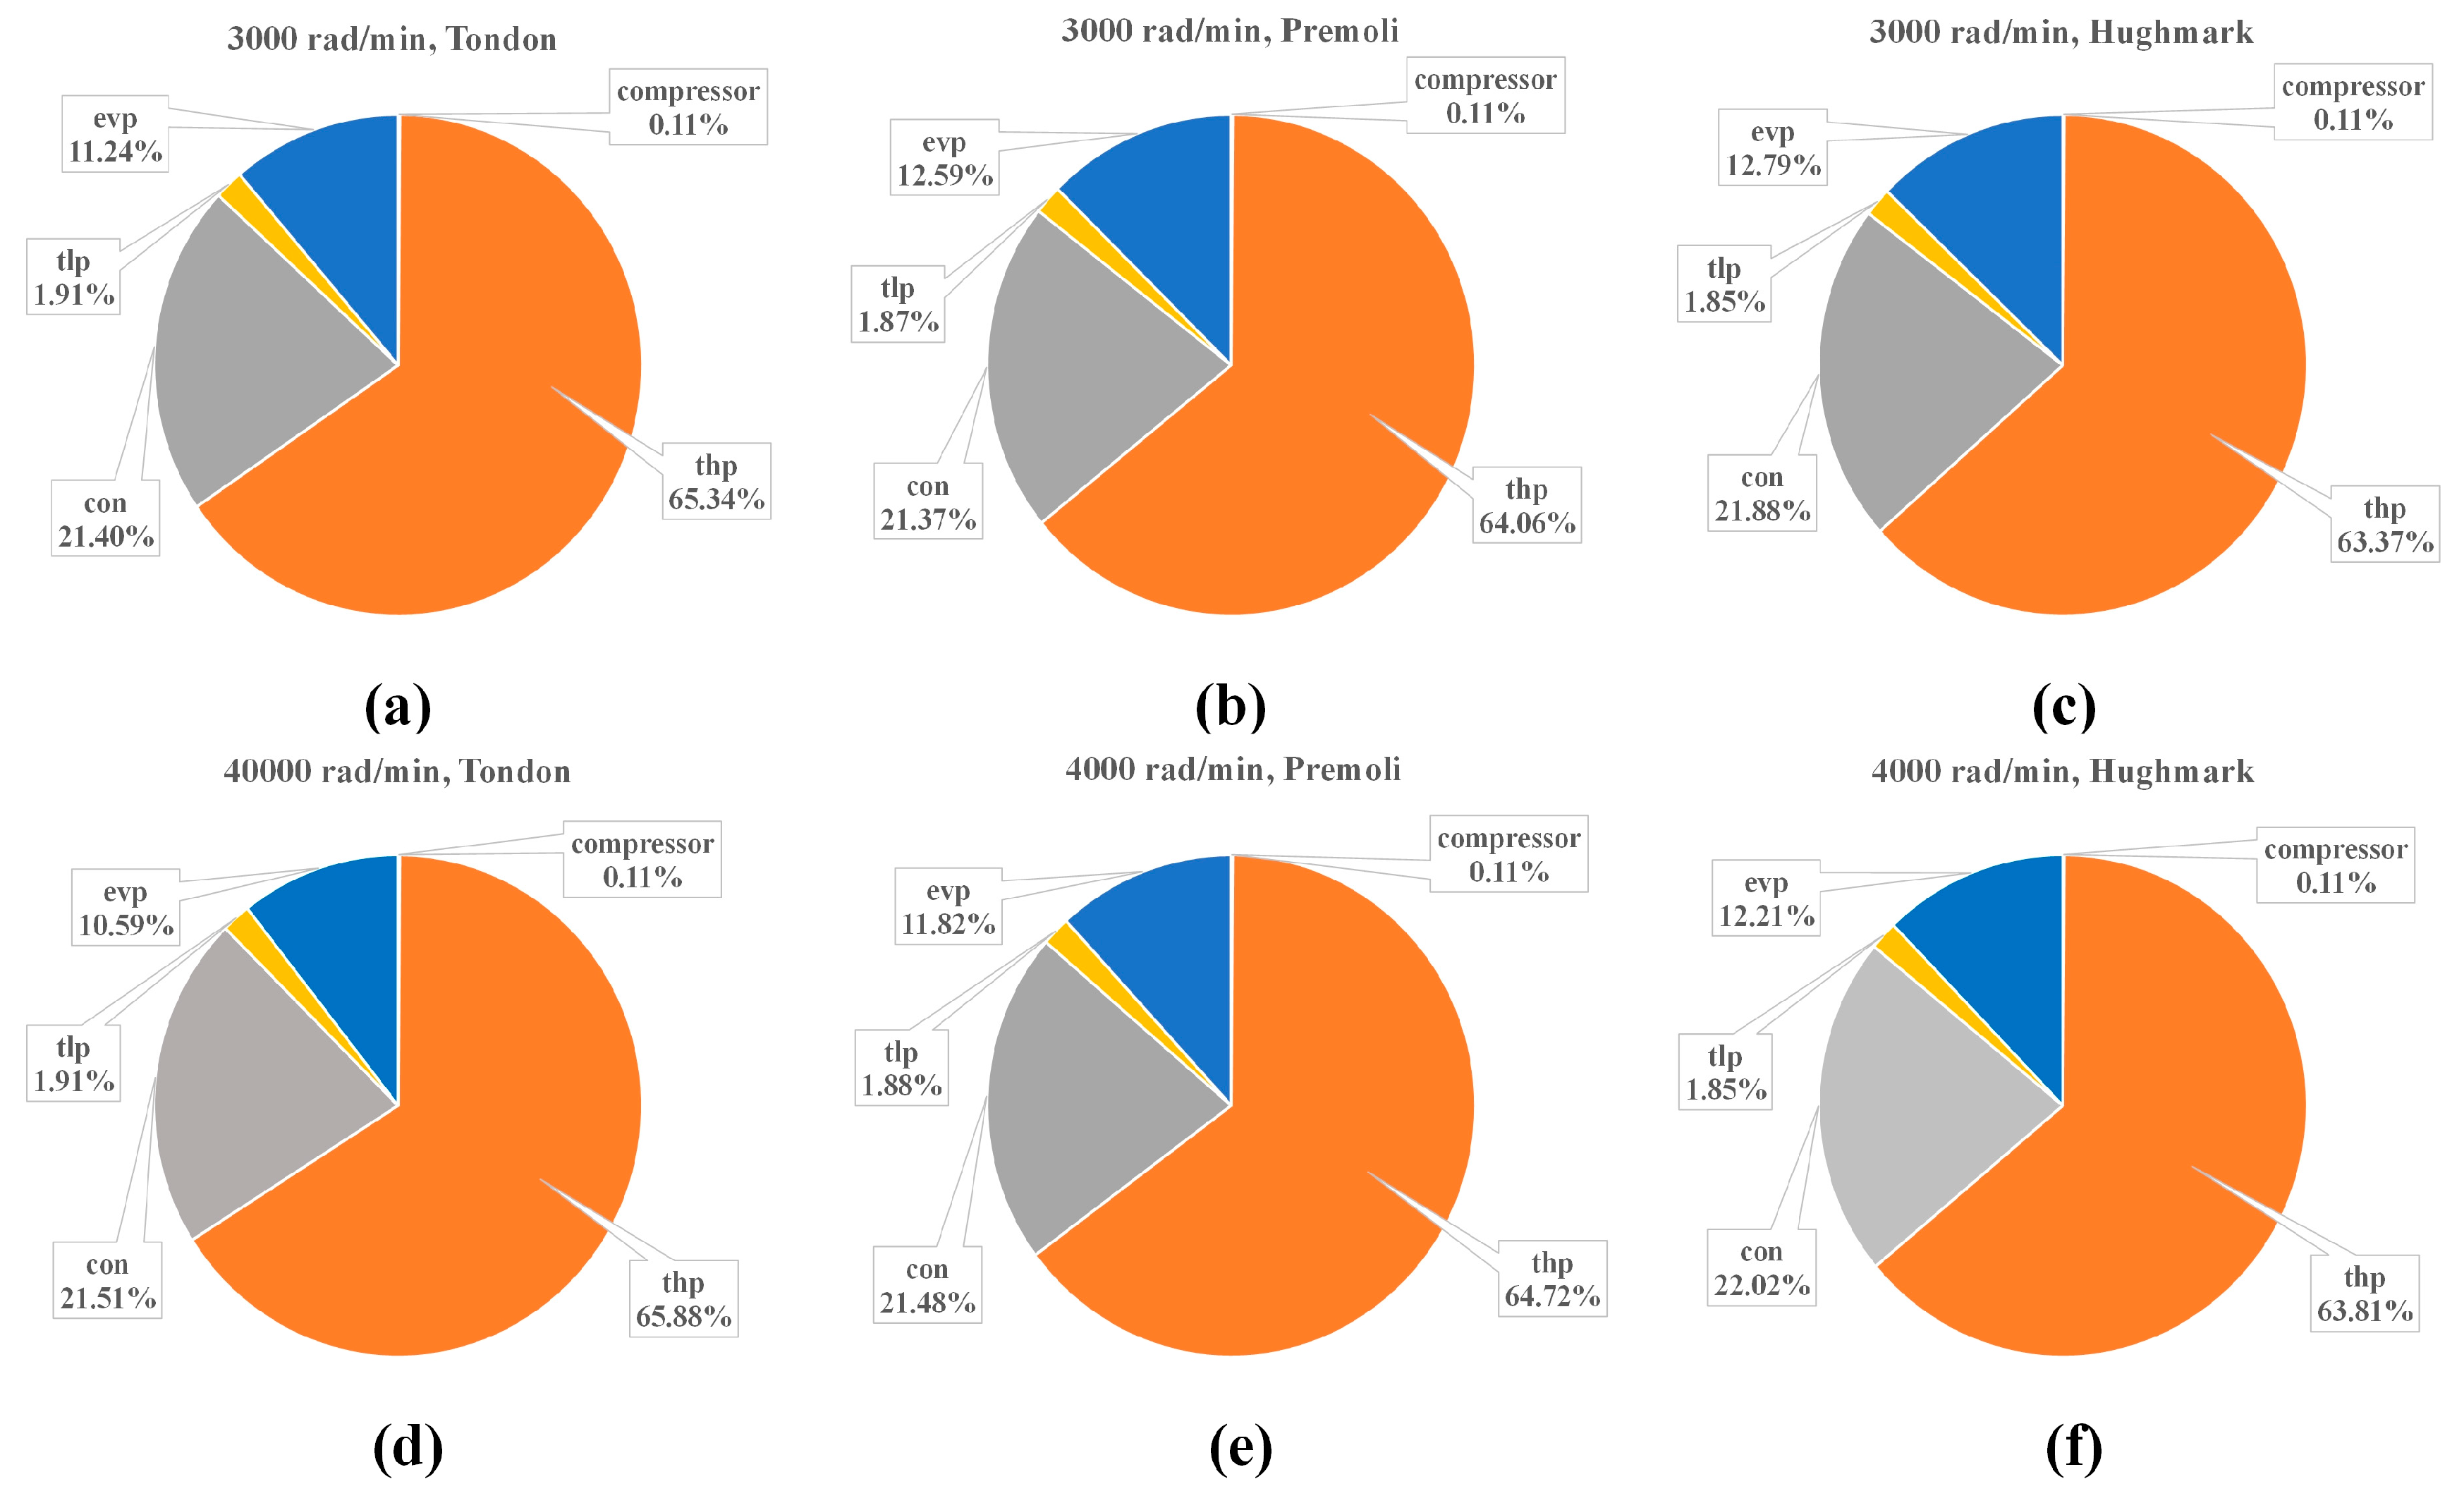
3.5. Results Analysis of Charge Amount Theoretical Calculation Model
The refrigerant charge of each part is calculated by the aforementioned calculation model of the void fraction, combined with the geometrical size and thermodynamic parameters of each part. The calculation results of the refrigerant charge for each part in cooling and heating operating conditions are in the pie charts below, as shown in
Figure 11 and
Figure 12, respectively.
The calculation results indicate that the refrigerant charge in the high-pressure tubes was shown to be the largest in both cooling and heating mode. This means that the tubes from compressor to condenser and condenser outlet to throttle valve should be as short as possible. Optimizing the space layout of tubes is a feasible scheme to reduce refrigerant charge. The second largest refrigerant charge is in the heat exchanger. The scale of micro-channel heat exchanger pipeline, especially the length and diameter of the flat tube, is very important for optimizing refrigerant charge. Overall, the difference of refrigerant charges calculated by each model is not evident, which is of positive significance to the actual system. The pipes used in the test bench are made of aluminium alloy, while the actual pipes are mostly made of rubber hoses. Except for the length variation of the pipelines caused by the actual layout of the vehicle, other effects are small.
Comparisons between calculated results of each model and the optimal charge obtained by experiments are shown in
Figure 13.
The comparison show that the calculated charge of each model is close to the experimental results with relatively small differences. In cooling and heating modes, the Hughmark model has the largest calculation results and smallest error for cooling model, only 5.9% and 6.5% at different compressor speeds. While in the heating model, the Tandon model calculates the minimum charge error, which is only 2.0% and 1.8% at different compressor speeds. According to the comprehensive results of cooling and heating experiments, the optimal charge is 700 g, and the Hughmark model calculating results are much closer. Considering the comprehensive performance of the system, the Hughmark model is selected as the most suitable calculation method for accuracy.
4. Concluding Remarks
In this experiment, a typical ACHP system with three heat exchangers was established to investigate the characteristics of system performance under various refrigerant charges. The cooling and heating performances of the system were analyzed comprehensively for a better understanding of optimal charge. Based on three classical models for calculating void fraction, theoretical charge amount was obtained and compared with the experimental results. The major conclusions are as follows.
With the enlarged refrigerant charge, the discharge pressure of the compressor increases, while the discharge temperature decreases gradually. Exit temperature of the HVAC module tends to become stable, and capacity or COP reach the peak value gradually with increasing refrigerant charge, maintaining with slight variation after that. For the same refrigerant charge in heating mode, the variation of the compressor speed shows significant influence on discharge pressure and temperature.
The intersection platform between subcooling and superheating curves is revealed to obtain OCP. The optimal charge of the system is further obtained by comprehensive performance of cooling and heating.
The charge calculated by the Hughmark model is proved to be the most appropriate for optimal charge determination according to experimental comparisons with the other two classical models of void fraction.
The next investigation on the system performance includes the performance of a cryogenic heat pump, dehumidification and defrosting.


