Article

Evolutionary Game on Government Regulation and Green Supply Chain Decision-Making

1
School of Management, Zhejiang University of Technology, Hangzhou 310023, China
2
Center for Global & Regional Environmental Research, The University of Iowa, Iowa City, LA 52242, USA
3
School of Information Management and Engineering, Zhejiang University of Finance and Economics, Hangzhou 310018, China
*
Author to whom correspondence should be addressed.
Energies 2020, 13(3), 620; https://doi.org/10.3390/en13030620
Submission received: 6 January 2020 / Revised: 20 January 2020 / Accepted: 22 January 2020 / Published: 1 February 2020
(This article belongs to the Section C: Energy Economics and Policy)

Abstract

:
Sustainability issues have gained growing awareness in recent years. Governments play an important role in environment and resources problems since they can affect enterprises’ production activities by enacting policies and regulations. To promote green production in the long term associated with the consideration of financial intervention of governments, we establish a three-population model of suppliers, manufacturers and governments based on evolutionary game theory, and analyze the evolutionary stable strategies (ESS) of their unilateral and joint behaviors. Further, system dynamics (SD) is applied to empirical analysis for exploring the dynamic interaction of the populations’ strategy, and the key factors affecting ESS are also discussed in detail. The results show that: (1) the proportion of green suppliers and manufacturers in their groups determines whether the government implements regulation; (2) any party of the supplier and manufacturer that adopts green strategy could promote green behavior of the other; (3) the government is advised to supervise and implement reward and punishment mechanism under the low proportion of green supply chain; (4) government regulation could promote the corporations to adopt green behavior and should preferentially implements the mechanism on manufacturers. The results provide insights into the policy-making of governments and enterprises management on sustainable development.

1. Introduction

With the increase of various industries and economic development throughout the world, environmental issues such as global warming, resource shortage, and waste pollution have become important concerns for society [1,2,3]. In this context, the green supply chain concept is generated and has gained growing attraction from people who are aware of environmental protection and have a consensus on green and sustainable development [4,5,6]. The enterprises in a green supply chain achieve their profits while adopting green development strategies in different stages of the product life cycle. Governments have also paid special attention to these environmental issues and released related policies to encourage manufacturers to implement green production activities. For example, the Chinese government has embraced green supply chain incorporation into the key national development strategy and stepped up guidance and supervision in a bid to encourage enterprises to develop green development schemes that integrate benefit growth with resource conservation and environmental protection.
In 2001, the National People’s Congress of China (NPCC) passed the Clean Production Propel Law to promote energy conservation, highly efficient utilization of resources, and clean production of manufactured products [7]. In order to regulate recycling and disposal of waste electrical and electronic products, the Regulation on Management of E-waste Disposal implemented since 2011 stipulates the disposal catalogue, disposal plan and qualification standards for e-waste treatment corporations [8,9]. In 2017, the State Council issued the Implementation Plan of Extended Manufacturer Responsibility Principle, which advocates that manufacturers’ responsibilities for products involve the whole life cycle of product design, consumption, recycling and waste disposal [10,11]. With the increasingly stringent environmental regulations, many enterprises cooperate to build a green supply chain for promoting the production and development of green products. In recent years, the market share of green appliances such as high-efficiency and energy-saving air conditioners, refrigerators, and water heaters has gradually increased. For example, inverter air conditioners have accounted for about 58% of the air-conditioning market in 2019. In the auto industry, the share of new-energy vehicles is also rising. Many auto manufacturers such as Geely, Changan, BYD, Chery, and Roewe have launched a series of electric vehicles. Dell, a leading manufacturer of electronic products, minimizes the consumption of resources from materials used to the end-of-life (EOL) products management. In October 2018, more than 150 enterprises including Gree, Midea, Huawei, Yuanda and Schneider, as well as some universities, scientific research institutes, financial institutions and industry associations, established Green Supply Chain Alliance in Beijing, in order to set up a sustainable development mode for enterprises.
In the context of growing consumer environmental protection consciousness and green market development, the long-term dynamic game between government’s environmental regulation and green activities of supply chain members has led to managerial research, which combines participants’ benefits with environmental sustainability. Accordingly, the main objectives of our research are: (1) to identify the relationships of green activity strategies between suppliers and manufacturers, (2) to explore the relationships between the green activity strategy of supply chain and supervision behavior decision of governments and (3) to investigate the effect of environmental regulations, including supervision and reward and punishment mechanism, on the green activity strategies of suppliers and manufacturers.
The issues could be addressed by evolutionary game theory that shows the mutation process of strategy selection and solves multiple equilibriums considering bounded rationality and learning mechanisms [12]. A three-population evolutionary game model is proposed in which each supplier or manufacture in their population can choose to implement green production activity or non-green production activity and the government agency also has two strategies, that is, supervision and non-supervision. In particular, if governments choose to supervise the supply chain, they will execute reward and punishment mechanism where the green corporations are provided for incentives and penalties are levied on the non-green corporations. In this paper, green strategy for suppliers refers to using clean technology to provide or produce environmental-protection raw materials. Manufacturers’ green behavior involves introducing clean and energy-saving technology to produce green products which may contain recyclable materials [13]. The final price of products is considered as being dependent upon whether the suppliers and manufacturers adopt a green strategy. We analyze the evolution path of the population of suppliers, manufacturers and governments under different preconditions. Subsequently, the multi-player evolutionary game is simulated by adopting system dynamics (SD) and the implementation effect of different strategies for the participants are analyzed. This paper makes contributions primarily in the following aspects:
(1)
The government is added to the game between suppliers and manufacturers, and a three-party evolutionary game model is constructed.
(2)
To analytically identify the long-term decision-making about green behavior of the supply chain members from the perspective of internal factors or external environmental regulation.
(3)
To propose the effect of supply chain members’ strategies on government regulation. And the government environmental policy is optimized to encourage more suppliers and manufacturers to take green activities.
The reminder of this paper is organized as follows: A review of the literature is introduced in Section 2. Section 3 describes assumptions and notations and proposes the basic evolutionary game model. Section 4 presents the evolutionary path and strategy stability of each population as well as the equilibrium points of the system. In Section 5, a case study and sensitivity analysis are provided. Finally, Section 6 summarizes the key results and discusses managerial insights and future research directions.

2. Literature Review

The literature associated with our study can be divided into three categories: (i) static and dynamic games between green supply chain members; (ii) influence of government intervention on supply chain members’ behavior; (iii) applications of system dynamics in analyzing supply chain members’ behavior.

2.1. Static and Dynamic Game between Green Supply Chain Members

Game theory is extensively applied in green supply chain research. As remanufacturing is an environmental activity for a supply chain, Savaskan et al. [14] considered three reverse channel formats where the manufacturer acts as the Stackelberg leader, and discussed the most effective undertaker of product collection activity for the manufacturer. Nagarajan and Sošić [15] constructed cooperative bargaining models to find profit allocations between supply chain partners and study coalition formation among the players. Nagurney and Yu [16] developed an oligopoly model for fashion supply chain competition which considers differentiation in product brand and degrees of consumers’ environmental consciousness. Different Nash equilibria are discussed for demonstrating the impact of different factors on product demands, the product prices, and firms’ profits. By incorporating the concept of fairness into a green product supply chain, Shi et al. [17] explored the impacts of fairness concerns and green efficiency on retail price, product’s green degree and profits of the manufacturer and retailer based on a Stackelberg game. Under uncertain market conditions, Bai and Tang [18] developed Nash, Stackelberg, and cooperative game models, respectively, to discuss the relationships of environmental investments, market demand, market price and profits of companies. Hong et al. [19] studied the competitive pricing of green products and non-green products under a Nash game framework. The relationship of pricing strategy and product quality as well as consumers’ environmental awareness are discussed. In order to coordinate the green supply chain members’ interest conflicts, Song and Gao [20] established a retailer-led revenue sharing contract game model and a bargaining revenue-sharing contract game model. They proved that the revenue-sharing contracts can improve the products’ greening level and the overall profitability of the supply chain. Taleizadeh et al. [21] formulated two types of remanufacturing models, where a manufacturer-led Stackelberg game is used, to analyze the effects of remanufacturing characteristics on carbon emissions, quality improvement, and the supply chain’s profit. Capraro et al. [22] proposed that the reduction of air pollution and the redistribution of scarce resources reflected the conflict between pro-self and pro-social behaviors. They used Dictator Game (DG) and Prisoner’s Dilemma (PD) to measure individuals’ altruistic and cooperative attitudes.
The research above concentrates primarily on single- or several-period games between the various entities of a green supply chain to improve the supply chain’s performance and ensure that the production activities cause a minimum amount of environmental degradation. The theme of the research has also been elaborated by evolutionary game theory since this game theory extends the traditional game theory to focus on the multiple-period and long-term evolution process and describe the interaction among different strategies of populations [23]. Barari et al. [24] presented a two-population evolutionary game between manufacturers and retailers with different strategies and derived the stable strategy set by considering the environmental and commercial benefits. Badu and Mohan [25] modeled a supply chain as an evolutionary game to study its sustainability from economic, social and environmental dimensions and analyze how the trivial actions by members of the supply chain affect the equilibrium of the system. Ji et al. [26] applied evolutionary game theory to new energy vehicle diffusion by establishing an interaction mechanism between local governments and auto manufactures. The evolutionary stable strategies with and without government subsidy were demonstrated and the impacts of some parameters on agents’ benefits were discussed.
The work about green supply chain using game theory mainly constructed a two-party game model including enterprise-enterprise game and government-enterprise game. In this research, a tripartite evolutionary game model of suppliers, manufacturers and governments is formulated to analyze their behaviors’ change process.

2.2. Influence of Government Intervention on Supply Chain Members’ Behavior

A capacious body of the work focuses on the impacts of the environmental regulation and financial intervention of governments on enterprises’ decisions on generating green products. Bansal and Gangopadhyay [27] explored the influences of different government incentives and tax policies on enterprises’ green production and social welfare. To investigate the factors which could promote implementation of extended producer responsibility principle for green supply chain firms, Chen and Sheu [28] designed a differential game model in which an integrated financial incentive is provided for treatment agency and regulation standard of recycling rate is imposed for the competitive manufacturers. Zhu and Dou [29] took into account government subsidies, product greenness and competition in the Stackelberg model with two manufacturers and discussed effects of the various factors on decision-making of companies. Krass and Nedorezov [30] examined the role of environmental taxation in environmental pollution reduction and greener technology strategy of the firms. Hafezalkotob [31] investigated the influence of government financial intervention on a competition model consisting of one green supply chain and one regular supply chain, and revealed that governmental tariffs and subsidies exert significant effects on the members’ profits. Wang et al. [32] constructed a reverse supply chain system composed of two manufacturers and a recycler and introduced government recycling reward and punishment mechanism to promote manufacturers’ recycling and remanufacturing.
Besides considering the government environmental policies as exogenous variables, some studies paid attention to government’s decision-making or the relationships between the strategies of government and corporations. Ghosh and Shah [33] established a two-part tariff contract to coordinate the decentralized green channel and found that cooperation between supply chain participants could enhance greening levels. Yang et al. [34] discussed the influence of government subsidies on the cost, output and profit of renewable energy enterprises and traditional energy enterprises under perfect information and asymmetric information conditions. Mahmoudi and Rasti-Barzoki [35] used game theory to analyze the performance of supply chain members under different governmental policies. In a sustainable supply chain with an energy supplier, an energy-efficient manufacturer, and an inefficient manufacturer, Safarzadeh and Rasti-Barzoki [36] proposed two policies, i.e., tax deductions and subsidy schemes, and found that tax deduction was a more effective policy than a subsidy scheme to support the energy-efficient manufacturer, but subsidy policies could help the government reduce the energy consumption better. Zhang et al. [37] demonstrated manufacturer’s low carbon strategy under various governmental cap with three power structures.
In the above research, the scholars have employed traditional game theory, e.g., Cournot and Stackelberg games, which assume that the participants are completely rational to analyze the strategies of participants. Instead, evolutionary game theory regards the participants as bounded rationality, which appears to have more realistic significance. Although Ji et al. [26] and Mahmoudi and Rasti-Barzoki [35] used the evolutionary game theory in their study, but they took the government policy as external factors and did not analyze the equilibrium utility of governments. Accordingly, compared with existing literature about government and green supply chain members’ behavior, our research used evolutionary game theory to analyze the equilibrium points and utility of multiple participants.

2.3. Applications of System Dynamics (SD) in Analyzing Supply Chain Members’ Behavior

The method of SD is used by some scholars on studying government environmental policies and green supply chain operations. Li et al. [38] established a SD model to simulate CO2 emissions under different scenarios, and proposed suggestions on simultaneously reducing CO2 emissions and environmental costs. Yang et al. [39] applied SD to ordering strategy simulation, by which they analyzed the impacts of emission cap policy and carbon tax policy on the decision-making of the supplier and retailer as well as supply chain efficiency. Taking the Chinese automobile manufacturing industry as an example, Tian et al. [40] discussed the relationship of the government, enterprises and consumers through system dynamics and evolutionary game theory and provided guidance for the development of green supply chain. Gupta [41] used a SD model in radial tyre manufacturing for computing lean–green performance of the plant, which helps predicting their performance in dynamic scenarios. Zhou et al. [42] introduced various governmental regulation parameters into a system dynamics model and compared the effects of different policies. Tong et al. [43] developed an evolutionary game model concerning cap-and-trade mechanism to analyze the evolutionary behavior of the retailers and the manufacturers.
From the above studies, we can see that SD is a common and important method in the research of evolutionary game. However, the above research mainly focuses on the influence of government regulation on supply chain members’ behavior. In this paper, we investigate the influence of corporations’ decision-making on environmental regulation formulation for the government and describes the long-term dynamic interaction of strategies of multiple participants including suppliers, manufacturers and governments by SD.

2.4. Research Gaps and Contributions to Literature

Some literature has studied the behavior of corporations from the perspective of sustainability or has discussed the influence of environmental regulations on enterprises’ green behavior. Moreover, some scholars also use the system dynamics method to simulate players’ behavior under different government environmental policies. Our contributions to existing research lie in two aspects. First, in the decision-making process of government and supply chain members, we simultaneously analyze the dynamic equilibrium of government’ utility and supply chain members’ profits. Second, combined with SD, the long-term interaction among governments, suppliers and manufacturers is discussed from the perspective of equilibrium. In reality, the government’ decision-making changes with the green product market and the relationship between the government and enterprises is more in line with the process of dynamic game, so it is of practical guiding significance to discuss the long-term dynamic relationship between government environmental regulation and enterprise green behavior based on evolutionary game.

3. Model Formulation

3.1. Assumptions and Notations

Consider a population of suppliers and a population of manufacturers in a specific industry and local governments that supervise the industry. Manufacturers procure raw materials from their suppliers and sell their products to consumers. It is assumed that the suppliers and manufacturers can adopt green behaviors in the production processes of raw materials and finished products, respectively. For the suppliers, the green activities include investing the research and development of green and cleaner technology, energy-saving and clean production process, utilizing renewable materials and etc [44,45]. Green manufacturers choose to apply low-carbon and eco-friendly production process, reduce the emission of harmful substances, etc [46,47]. Two strategies, green behavior and non-green behavior, are defined for suppliers and manufacturers. Local governments could monitor the activities of suppliers and manufacturers or not. If the governments choose supervision strategy, they would subsidize suppliers and manufacturers that perform green behaviors and punish the non-green corporations. Suppose that the suppliers, manufacturers and governments are all rationally bound, and they change their strategies dynamically based on the principle of maximizing their own benefit. In order to explore the relationship and benefit balance among government environmental regulations, green decisions of suppliers and manufacturers, we make the following assumptions:
Assumption 1.
A population of suppliers, a population of manufacturers and local governments are the participants of the game; they use bounded rationality and continuous learning from multiple gaming and seeking the Evolutionary Stable Strategy (ESS) to achieve the optimal equilibrium.
Assumption 2.
The suppliers and manufacturers have two strategies: adopt green behavior and keep traditional non-green behavior. The governments also have two strategies, that is, to supervise the suppliers and manufacturers, and not supervise them.
Assumption 3.
If the suppliers choose to adopt green behavior, they need additional cost including production equipment improvement and investment in R&D for green and cleaner technologies. The unit cost for green (non-green) suppliers is c g ( c n ), respectively, and it is generally believed that c g > c n . The wholesale price of green (non-green) raw materials sold to manufacturers is viewed as w g ( w n ), and it satisfies that w g > w n .
Assumption 4.
The raw material greenness affects the production process and green investment of manufacturers, the unit production cost for manufacturers can be described in the following four scenarios:
i.
When the suppliers adopt green behavior and the manufacturers keep non-green behavior, the unit cost for non-green manufacturers is c g n ;
ii.
When the suppliers offer non-green raw materials or components while the manufacturers adopt green strategy, the unit cost for green manufacturers is c n g ;
iii.
When both the suppliers and the manufacturers choose to perform green behaviors, the cost of manufacturers is c g g ;
iv.
When both the suppliers and the manufacturers choose to perform non-green behaviors, the cost of manufacturers is c n n .
Consider that manufacturers’ cost is related to greenness of raw materials and green raw materials could reduce manufacturers’ green cost, so manufacturers’ cost under various conditions meets with c n g > c g g > c n n > c g n .
Assumption 5.
The manufacturers add their profit margin to the procurement and production cost and decide the final sale price which is related to the environment investment, thus the final price of the products differ under different strategies of the supply chain members, as is shown as follow:
i.
If the suppliers and manufacturers are both non-green, the products offered by the supply chain is also non-green, and the final price is regarded as p n n ;
ii.
If the suppliers and manufacturers both implement green activity, the final price is p g g ;
iii.
If only the suppliers adopt green behavior, the price is denoted as p g n ;
iv 
If only the manufacturers adopt green behavior, the price is p n g .
Suppose the green behavior of suppliers and manufacturers affects final prices equally, p g g > p g n = p n g > p n n should be satisfied.
Assumption 6.
With the increasing green awareness of consumers, product value and corporate reputation can be enhanced through green activity implementation. Assume that producing green products per unit increases the reputation of the suppliers and the manufacturers by r S and r M , respectively.
Assumption 7.
When the governments choose supervision strategy, they undertake supervisory cost and implement reward and punishment mechanism. The government subsidy to the suppliers and manufacturers that perform green activities is i S and i M for per unit product, respectively; the non-green suppliers and manufacturers are punished by f S and f M of per unit product, respectively.
Assumption 8.
Assume that the social benefit generated by both the suppliers and manufacturers adopting green behaviors is φ , so only one of the parties performing greenly causes φ / 2 social benefit. When any party fails to take green actions, the governments should bear the cost of pollution treatment c G d .
The parameters and variables and their descriptions are shown in Table 1.

3.2. Basic Model

According to the aforementioned assumptions, payoff matrixes of the suppliers, manufacturers and governments can be obtained. Table 2 shows the payoff matrix without government supervision, and the payoff matrix under government regulation is presented in Table 3.
It is assumed that the probability of the supplier to adopt or not adopt green strategy is x and 1 − x, x [ 0 , 1 ] , and the probability of the manufacturer to adopt green strategy is y, y [ 0 , 1 ] . Suppose z and 1 − z represent the probability of the governments to implement or not implement regulation, z [ 0 , 1 ] .
Let E S g and E S n be respectively the expected profit of “adopt green behavior” and “adopt non-green behavior” for suppliers. Combined Table 2 and Table 3, the expected profit of the suppliers with the two different behavior strategies are as follows:
E S g = y z ( w g c g + r S + i S ) + z ( 1 y ) ( w g c g + r S + i S ) + y ( 1 z ) ( w g c g + r S ) + ( 1 y ) ( 1 z ) ( w g c g + r S )
E S n = y z ( w n c n f S ) + z ( 1 y ) ( w n c n f S ) + y ( 1 z ) ( w n c n ) + ( 1 y ) ( 1 z ) ( w n c n )
According to Equations (1) and (2), the average expected payoff of the suppliers is calculated:
E ¯ S = x E S g + ( 1 x ) E S n
Similarly, let E M g and E M n represent the expected profit of “adopt green behavior” and “adopt non-green behavior” for manufacturers, respectively, which are presented as:
E M g = x z ( p g g w g c g g + r M + i M ) + z ( 1 x ) ( p n g w n c n g + r M + i M ) + x ( 1 z ) ( p g g w g c g g + r M ) + ( 1 x ) ( 1 z ) ( p n g w n c n g + r M )
E M n = x z ( p g n w g c g n f M ) + z ( 1 x ) ( p n n w n c n n f M ) + x ( 1 z ) ( p g n w g c g n ) + ( 1 x ) ( 1 z ) ( p n n w n c n n )
According to Equations (4)–(5), the average expected payoff of the manufacturers is:
E ¯ M = y E M g + ( 1 y ) E M n
For the governments, their expected benefits that choose “implement supervision” and “not supervision” are:
E G y = x y ( φ i S i M c G e ) + x ( 1 y ) ( φ / 2 i S c G e + f M c G d ) + y ( 1 x ) ( φ / 2 i M c G e + f S c G d ) + ( 1 x ) ( 1 y ) ( f S + f M c G 0 2 c G d )
E G n = x y φ + x ( 1 y ) ( φ / 2 c G d ) + y ( 1 x ) ( φ / 2 c G d ) + ( 1 x ) ( 1 y ) ( 2 c G d )
The average benefit of governments is:
E ¯ G = z E G y + ( 1 z ) E G n
In the evolutionary game theory, the replicator dynamic system is dynamic differential equations that describes the frequency of an especial strategy used in a population [48]. Therefore, the replicator dynamic equations of “adopt green behavior” chosen by suppliers and manufacturers are presented as:
F ( x ) = d x d t = x ( E S g E ¯ S ) = x ( 1 x ) [ w g w n + c n c g + r S + z ( i S + f S ) ]
F ( y ) = d y d t = y ( E M g E ¯ M ) = y ( 1 y ) [ x ( p g g p g n c g g + c g n ) + ( 1 x ) ( p n g p n n c n g + c n n ) + r M + z ( i M + f M ) ]
Similarly, the replicator dynamic equation for the governments is:
F ( z ) = d z d t = z ( 1 z ) [ x i S c G e y i M + ( 1 y ) f M + ( 1 x ) f S ]

4. Model Analysis

In what follows, we investigate the strategy of each group based on replicator dynamic Equations (10)–(12).

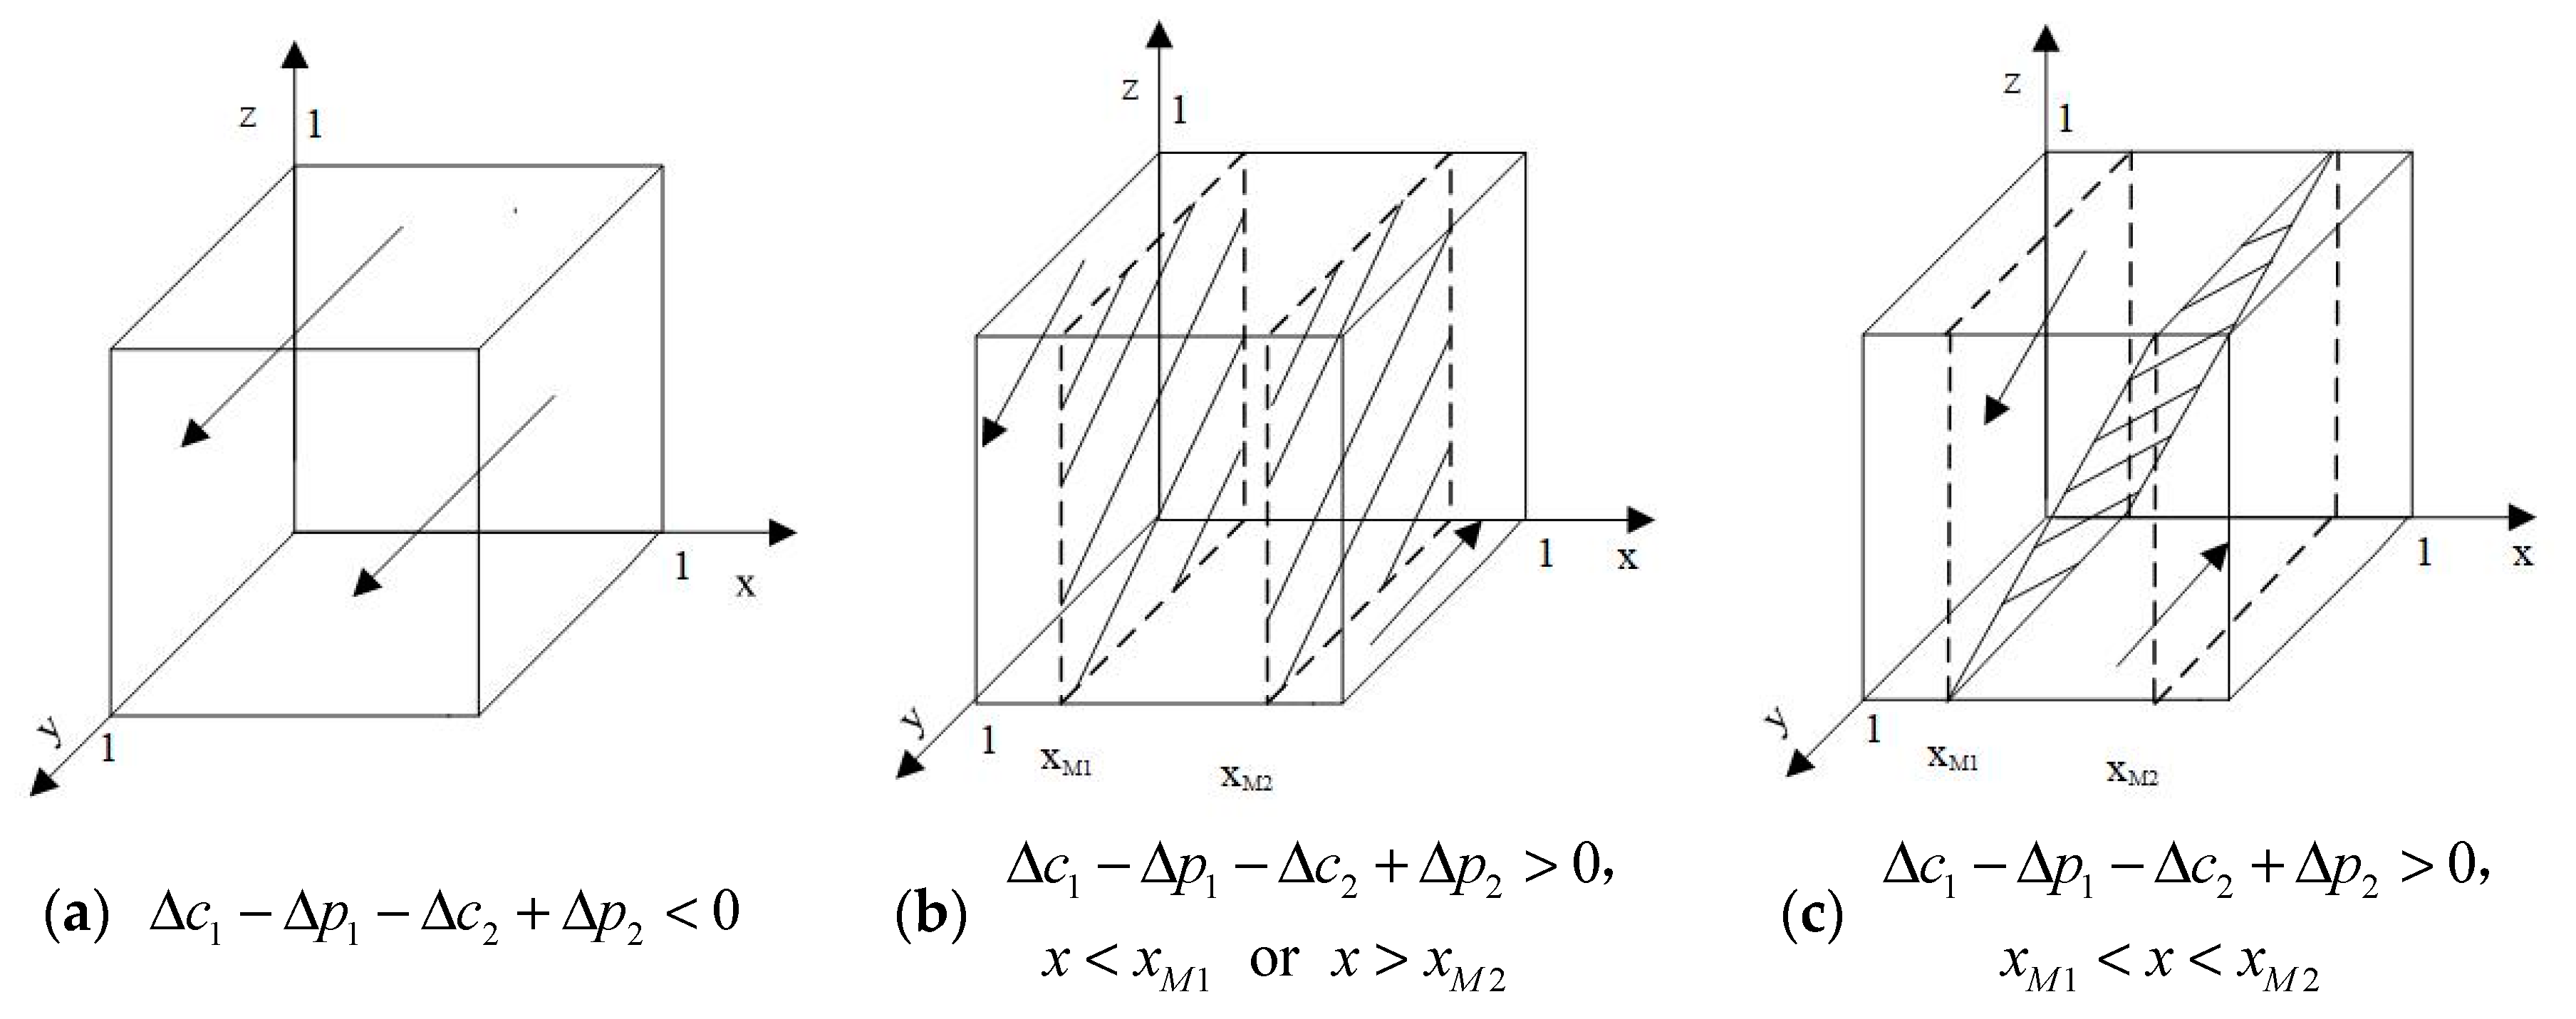
4.1. Strategy Stability Analysis for Suppliers

Let Δ w = w g w n , Δ c = c g c n , and the replicator dynamic equation of suppliers Equation (4) can be transformed into:
F ( x ) = d x d t = x ( 1 x ) [ Δ w Δ c + r S + z ( i S + f S ) ]
The first derivative of F ( x ) is as follows:
d F ( x ) d x = ( 1 2 x ) [ Δ w Δ c + r S + z ( i S + f S ) ]
Observing Equation (13), x = 0 , x = 1 , z = Δ c Δ w r S i S + f S are the roots of F ( x ) = d x / d t = 0 . Based on stability theorem of replication dynamic equation, when F ( x ) = 0 , F ( x ) 0 , the ESS is x [49]. Let A 1 = Δ c Δ w r S i S + f S , then the following discussion is conducted:
If z = A 1 , for any x, F ( x ) 0 , then axis x is in a stable state, i.e., any strategy of the suppliers is a stable strategy.
If z A 1 , the different cases are analyzed as follows:
Case 1: if Δ c Δ w r S < 0 , then z > A 1 , for two solutions x = 0 and x = 1 of Equation (13), F ( x ) | x = 0 > 0 and F ( x ) | x = 1 < 0 , so x = 1 is the ESS, that is, suppliers will implement a green activity.
Case 2: if Δ c Δ w r S > i S + f S , then z < A 1 , for two solutions x = 0 and x = 1 of Equation (13), F ( x ) | x = 0 < 0 and F ( x ) | x = 1 > 0 , so x = 0 is the ESS, that is, suppliers will not implement a green activity.
Case 3: if 0 < Δ c Δ w r S < i S + f S , there are two scenarios.
(1)
when z > A 1 , F ( x ) | x = 0 > 0 and F ( x ) | x = 1 < 0 , so x = 1 is the ESS;
(2)
when z < A 1 , F ( x ) | x = 0 < 0 and F ( x ) | x = 1 > 0 , so x = 0 is the ESS.
The corresponding evolutionary paths of suppliers’ strategy are illustrated in Figure 1.
As shown in Figure 1a, when Δ c Δ w r S < 0 , no matter what the initial state of the system is, the suppliers will eventually adopt a green strategy. It indicates that whether the government regulates the supply chain or not, the profit of the suppliers choosing a green strategy is greater than that of not adopting one. The proportion of suppliers choosing green behavior strategy increases after a long-term game between the corporations and governments, and finally all suppliers choose to implement green activity.
When Δ c Δ w r S > i S + f S , the suppliers maintain non-green behavior and their strategies are not affected by governments’ action, as described in Figure 1b. Under this condition, adopting green activity cannot improve the suppliers’ profit, thus a non-green strategy is adopted by the suppliers.
When 0 < Δ c Δ w r S < i S + f S , in Figure 1c, the ESS of suppliers is related to government behavior. If the possibility of government regulation is higher than Δ c Δ w r S i S + f S , the trend of suppliers’ strategy is to implement green activity; otherwise, a non-green strategy is the suppliers’ choice.

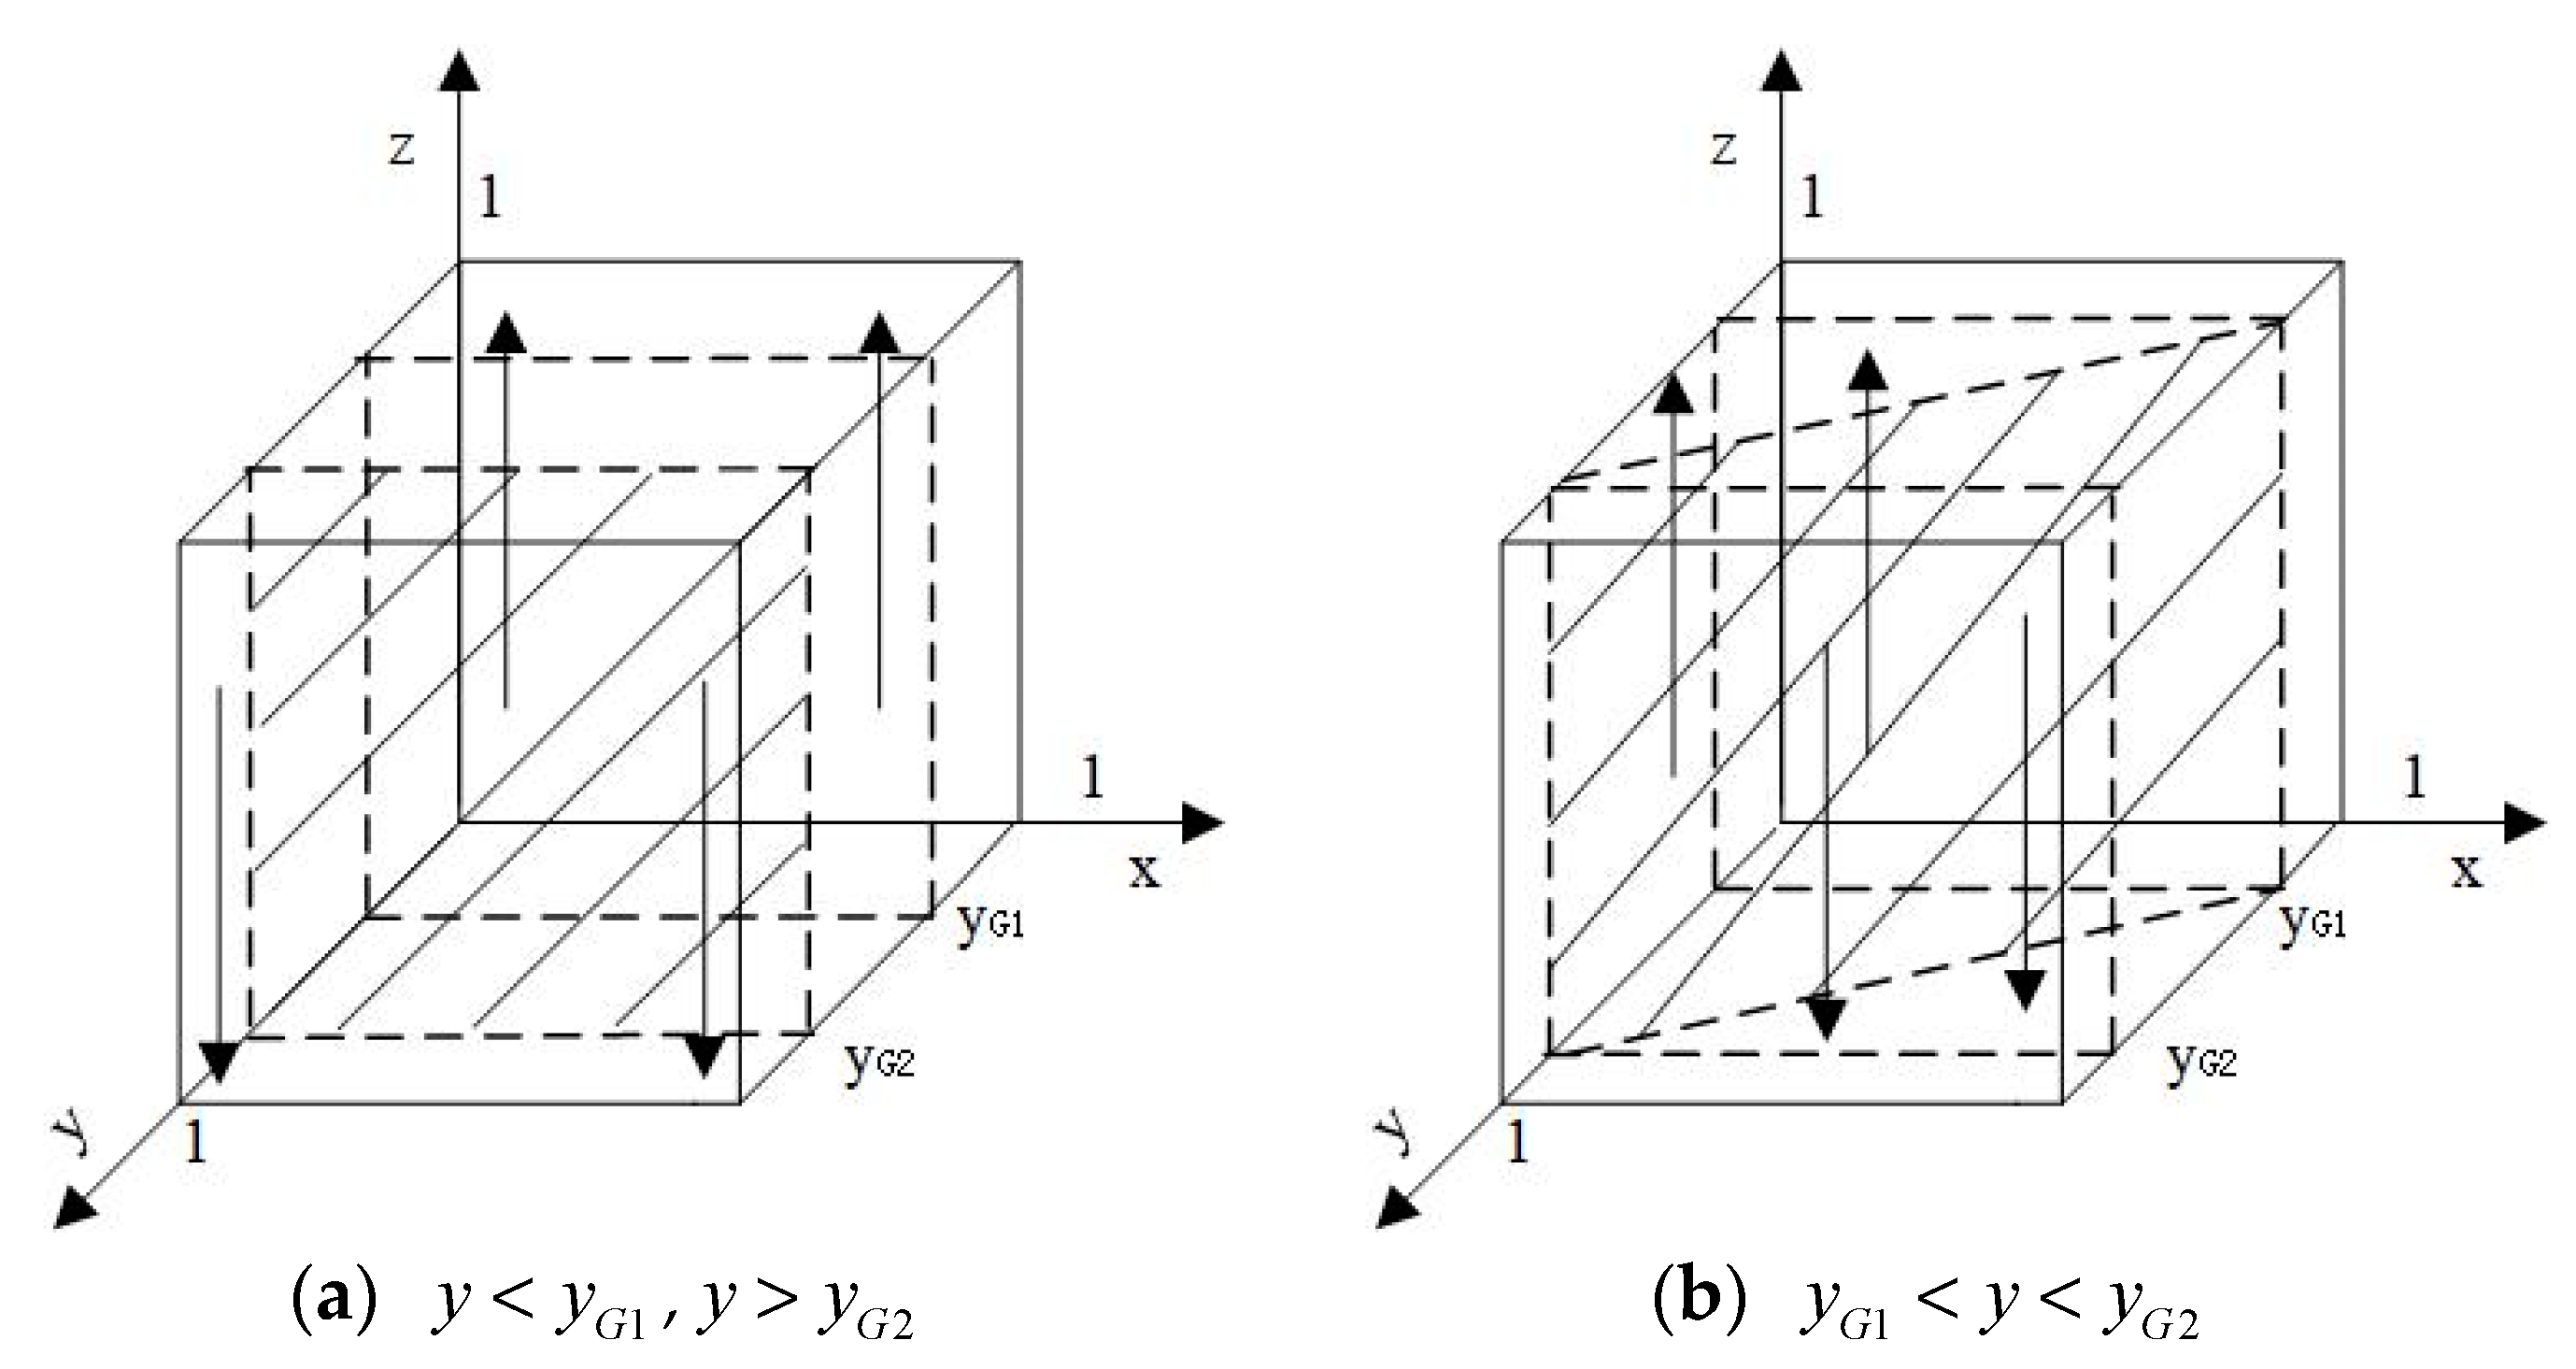
4.2. Strategy Stability Analysis for Manufacturers

Equation (11) indicates that the manufacturers’ strategy relates to the probability of suppliers’ green behavior and government regulation. Let Δ p 1 = p g g p g n , Δ p 2 = p n g p n n , Δ c 1 = c g g c g n , Δ c 2 = c n g c n n and A 2 = x ( Δ c 1 Δ p 1 ) + ( 1 x ) ( Δ c 2 Δ p 2 ) r M i M + f M , we can obtain the following results (the specific steps of the proof are provided in Appendix A):
If z = A 2 , then for any y, F ( y ) 0 , i.e., for an arbitrary y, any strategy of the suppliers and governments is a stable strategy.
If z A 2 , we demonstrate different cases as follows:
Case 4: if x ( Δ c 1 Δ p 1 ) + ( 1 x ) ( Δ c 2 Δ p 2 ) r M < 0 , then z > A 2 , for two solutions y = 0 and y = 1 of Equation (15), F ( y ) | y = 0 > 0 and F ( y ) | y = 1 < 0 , so y = 1 is the ESS, that is, manufactures will implement a green activity.
Case 5: if x ( Δ c 1 Δ p 1 ) + ( 1 x ) ( Δ c 2 Δ p 2 ) r M > i M + f M , then z < A 2 . We can get F ( y ) | y = 0 < 0 and F ( y ) | y = 1 > 0 , so y = 0 is the ESS, that is, the manufacturers will not implement green activity.
Case 6: if 0 < x ( Δ c 1 Δ p 1 ) + ( 1 x ) ( Δ c 2 Δ p 2 ) r M < i M + f M , there are two scenarios.
(1)
when z > A 2 , F ( y ) | y = 0 > 0 and F ( y ) | y = 1 < 0 , so y = 1 is the ESS;
(2)
when z < A 2 , F ( y ) | y = 0 < 0 and F ( y ) | y = 1 > 0 , so y = 0 is the ESS.
The dynamic evolutionary path and stability of the manufacturers are shown in Figure 2, where x M 1 = r M Δ c 2 + Δ p 2 Δ c 1 Δ p 1 Δ c 2 + Δ p 2 , x M 2 = r M Δ c 2 + Δ p 2 + i M + f M Δ c 1 Δ p 1 Δ c 2 + Δ p 2 .
Figure 2a indicates that the manufacturers ultimately adopt green activity regardless of the initial state of the system when Δ c 1 Δ p 1 Δ c 2 + Δ p 2 < 0 . Δ c 1 Δ p 1 depends on the values of the difference in production costs between green and non-green manufacturers and the difference in selling prices when suppliers adopt a green strategy; when suppliers adopt a non-green strategy, by subtracting the difference in selling prices between green and non-green manufacturers from the difference in selling prices, we get Δ c 2 Δ p 2 . In this case where Δ c 1 Δ p 1 < Δ c 2 Δ p 2 , the behavior of the suppliers and the governments will not affect the manufacturers’ decisions, and the profit of each manufacturer choosing green strategy is greater than that of not performing green behavior. Therefore, after a long-term game, all manufacturers choose green strategy.
Figure 2b,c show the dynamic evolution of manufacturers’ strategies when Δ c 1 Δ p 1 Δ c 2 + Δ p 2 > 0 . If x < x M 1 , that is, the probability of suppliers adopting green activity is at a low level, the manufacturers will finally choose the strategy “adopt green behavior”; if x > x M 2 , “adopt non-green behavior” strategy is preferred by the manufacturers (see Figure 2b). If x M 1 < x < x M 2 , manufacturer’s ESS is related to both supplier’s decision and government’s action. When the probability of government regulation is at high level, i.e., z > A 2 , manufacturers will adopt a green strategy; otherwise, they choose to remain non-green (see Figure 2c). Therefore, increasing the proportion of green suppliers and strengthening government supervision can promote green production by manufacturers.

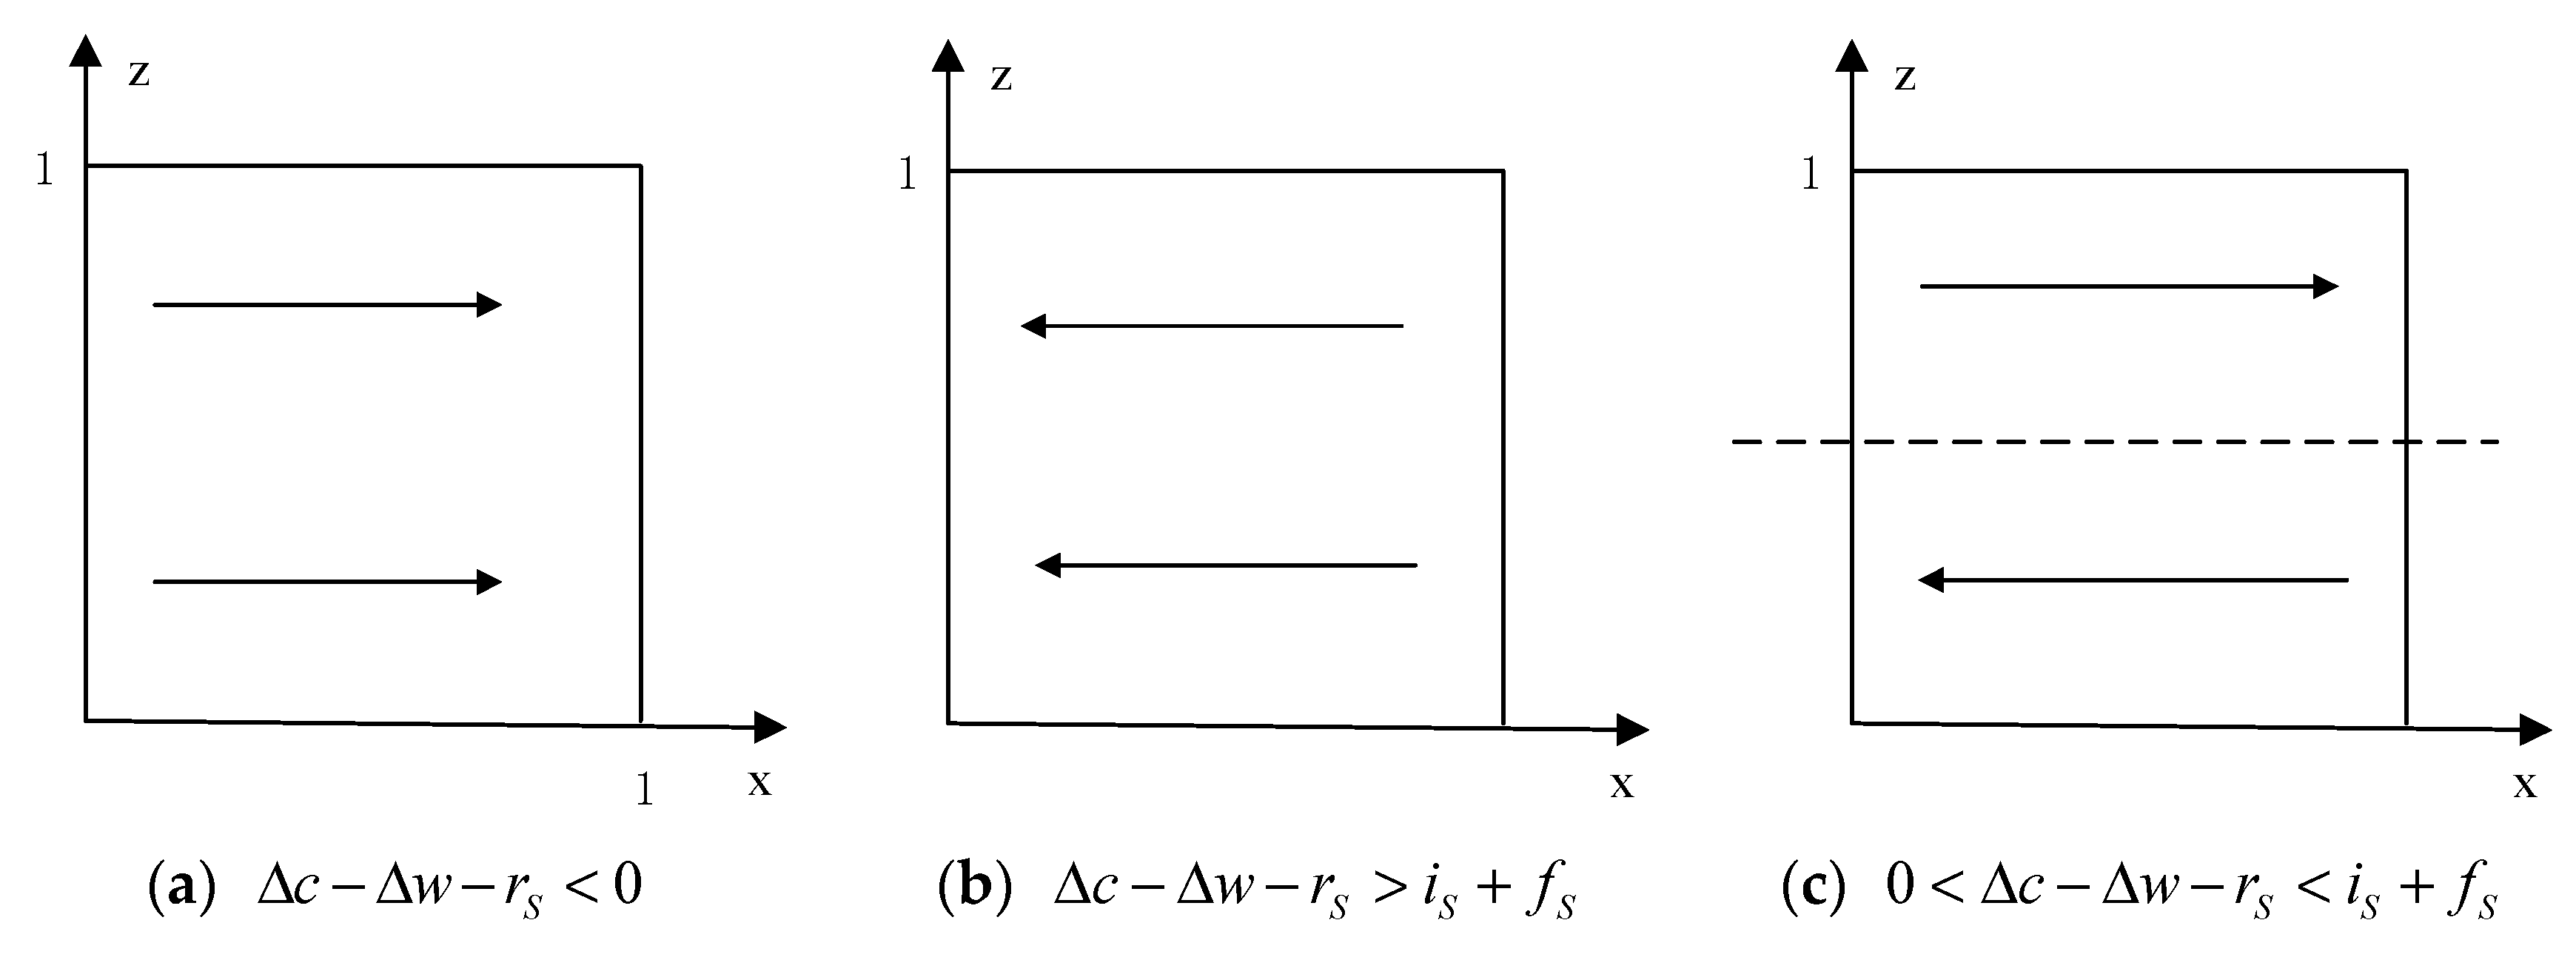
4.3. Strategy Stability Analysis for Governments

It can be seen that government’s strategy has an impact on the suppliers’ and manufacturers’ decisions, so in what follows, we analyze the evolutionary process and stability of government’s strategy. Let A 3 = ( 1 y ) f M + f S y i M c G e i S + f S , the derivation procedure is similar with Section 4.1 and Section 4.2, and the results are as follows (The specific steps of the proof are provided in Appendix B).
If x = A 3 , then for any z, F ( z ) 0 , that is, for an arbitrary z, any strategy of the suppliers and manufacturers is a stable strategy.
If x A 3 , different cases are as follows:
Case 7: if ( 1 y ) f M + f S y i M c G e < 0 , then x > A 3 , for two solutions z = 0 and z = 1 of Equation (12), F ( z ) | z = 0 < 0 and F ( z ) | z = 1 > 0 , so z = 0 is the ESS, that is, governments will not regulate the supply chain.
Case 8: if ( 1 y ) f M + f S y i M c G e > i S + f S , for any x, x < A 3 can be satisfied, and we can get F ( z ) | z = 0 > 0 and F ( z ) | z = 1 < 0 , so z = 1 is the ESS.
Case 9: if 0 < ( 1 y ) f M + f S y i M c G e < i S + f S , there are two scenarios.
(1)
when x > A 3 , F ( z ) | z = 0 < 0 and F ( z ) | z = 1 > 0 , so z = 0 is the ESS;
(2)
when x < A 3 , F ( z ) | z = 0 > 0 and F ( z ) | z = 1 < 0 , so z = 1 is the ESS.
Figure 3 demonstrates the dynamic evolutionary path and stability of the governments, where y G 1 = f M i S c G e f M + i M and y G 2 = f M + f S c G e f M + i M .
Figure 3a illustrates two cases of the governments’ strategy. When y < y G 1 , the governments’ strategy is supervision; when y > y G 2 , they will not supervise the supply chains. It means that if the proportion of green manufacturers in its population is lower than y G 1 , the governments will supervise the supply chains and implement a reward and punishment mechanism to improve the number of green manufacturers. If the proportion is high enough ( y > y G 2 ), it is unnecessary to be regulated.
When y G 1 < y < y G 2 , as depicted in Figure 3b, the strategy of governments is related to both the suppliers’ and manufacturers’ actions. If x > [ ( 1 y ) f M + f S y i M c G e ] / ( i S + f S ) , the governments will not regulate the supply chains; if x < [ ( 1 y ) f M + f S y i M c G e ] / ( i S + f S ) , governmental supervision should be implemented. Combined with Figure 3a, we see that when the proportion of suppliers or manufacturers taking green actions is high ( x > [ ( 1 y ) f M + f S y i M c G e ] / ( i S + f S ) or y > y G 2 ), they are not needed to be supervised, but if most suppliers and manufacturers do not adopt a green strategy, the governments should choose a supervision strategy and implement a reward and punishment mechanism.

4.4. ESS Analysis for Participants

By combining the replicator dynamic equations of suppliers, manufacturers and governments, we can obtain the replicator dynamic system:
{ F ( x ) = d x d t = x ( 1 x ) [ w g w n + c n c g + r S + z ( i S + f S ) ] F ( y ) = d y d t = y ( 1 y ) [ x ( p g g p g n c g g + c g n ) + ( 1 x ) ( p n g p n n c n g + c n n ) + r M + z ( i M + f M ) ] F ( z ) = d z d t = z ( 1 z ) [ x i S c G e y i M + ( 1 y ) f M + ( 1 x ) f S ]
According to the above dynamic system, the equilibrium points of this game are deduced.
Proposition 1.
The equilibrium points of the game are E 1 ( 0 , 0 , 0 ) , E 2 ( 0 , 0 , 1 ) , E 3 ( 0 , 1 , 0 ) , E 4 ( 0 , 1 , 1 ) , E 5 ( 1 , 0 , 0 ) , E 6 ( 1 , 0 , 1 ) , E 7 ( 1 , 1 , 0 ) , E 8 ( 1 , 1 , 1 ) and E 9 ( x * , y * , z * ) . x * , y * and z * meet with
x * = ( i S + f S ) ( Δ p 2 Δ c 2 + r M ) + ( i M + f M ) ( Δ c Δ w r S ) ( i S + f S ) ( Δ p 2 Δ p 1 + Δ c 1 Δ c 2 )
y * = 1 i M + f M [ ( i S + f S ) ( Δ p 2 Δ c 2 + r M ) + ( i M + f M ) ( Δ c Δ w r S ) Δ p 1 Δ p 2 + Δ c 2 Δ c 1 + f S + f M c G e ]
z * = Δ c Δ w r S i S + f S
Proof. 
See Appendix C. □
The equilibrium points obtained by the replicator dynamic system are not necessarily the ESS. According to Friedman [48] and Mahmoudi [35], the stability of the equilibrium points can be analyzed using the Jacobian matrix. The Jacobian matrix of the game is:
J = [ F ( x ) / x F ( x ) / y F ( x ) / z F ( y ) / x F ( y ) / y F ( y ) / z F ( z ) / x F ( z ) / y F ( z ) / z ] = [ a 11 a 12 a 13 a 21 a 22 a 23 a 31 a 32 a 33 ]
where a 11 = ( 1 2 x ) [ Δ w Δ c + r S + z ( i S + f S ) ] , a 12 = 0 , a 13 = x ( 1 x ) ( i S + f S ) , a 21 = y ( 1 y ) ( Δ p 1 Δ p 2 Δ c 1 + Δ c 2 ) , a 22 = ( 1 2 y ) [ x ( Δ p 1 Δ c 1 ) + ( 1 x ) ( Δ p 2 Δ c 2 ) + r M + z ( i M + f M ) ] , a 23 = y ( 1 y ) ( i M + f M ) , a 31 = z ( 1 z ) ( i S + f S ) , a 32 = z ( 1 z ) ( i M + f M ) , and a 33 = ( 1 2 z ) [ x i S c G e y i M + ( 1 y ) f M + ( 1 x ) f S ] .
The det J and tr J of the fixed strategies are shown in Table 4. When the equilibrium point satisfies the conditions det J > 0 and tr J < 0, the equilibrium point is an ESS. But as presented in Table 4, due to the complexity of the values, there is no evidence to directly determine whether these equilibrium points are greater or less than zero. We then use SD to analyze the stability of each equilibrium point.

5. Numerical Simulation

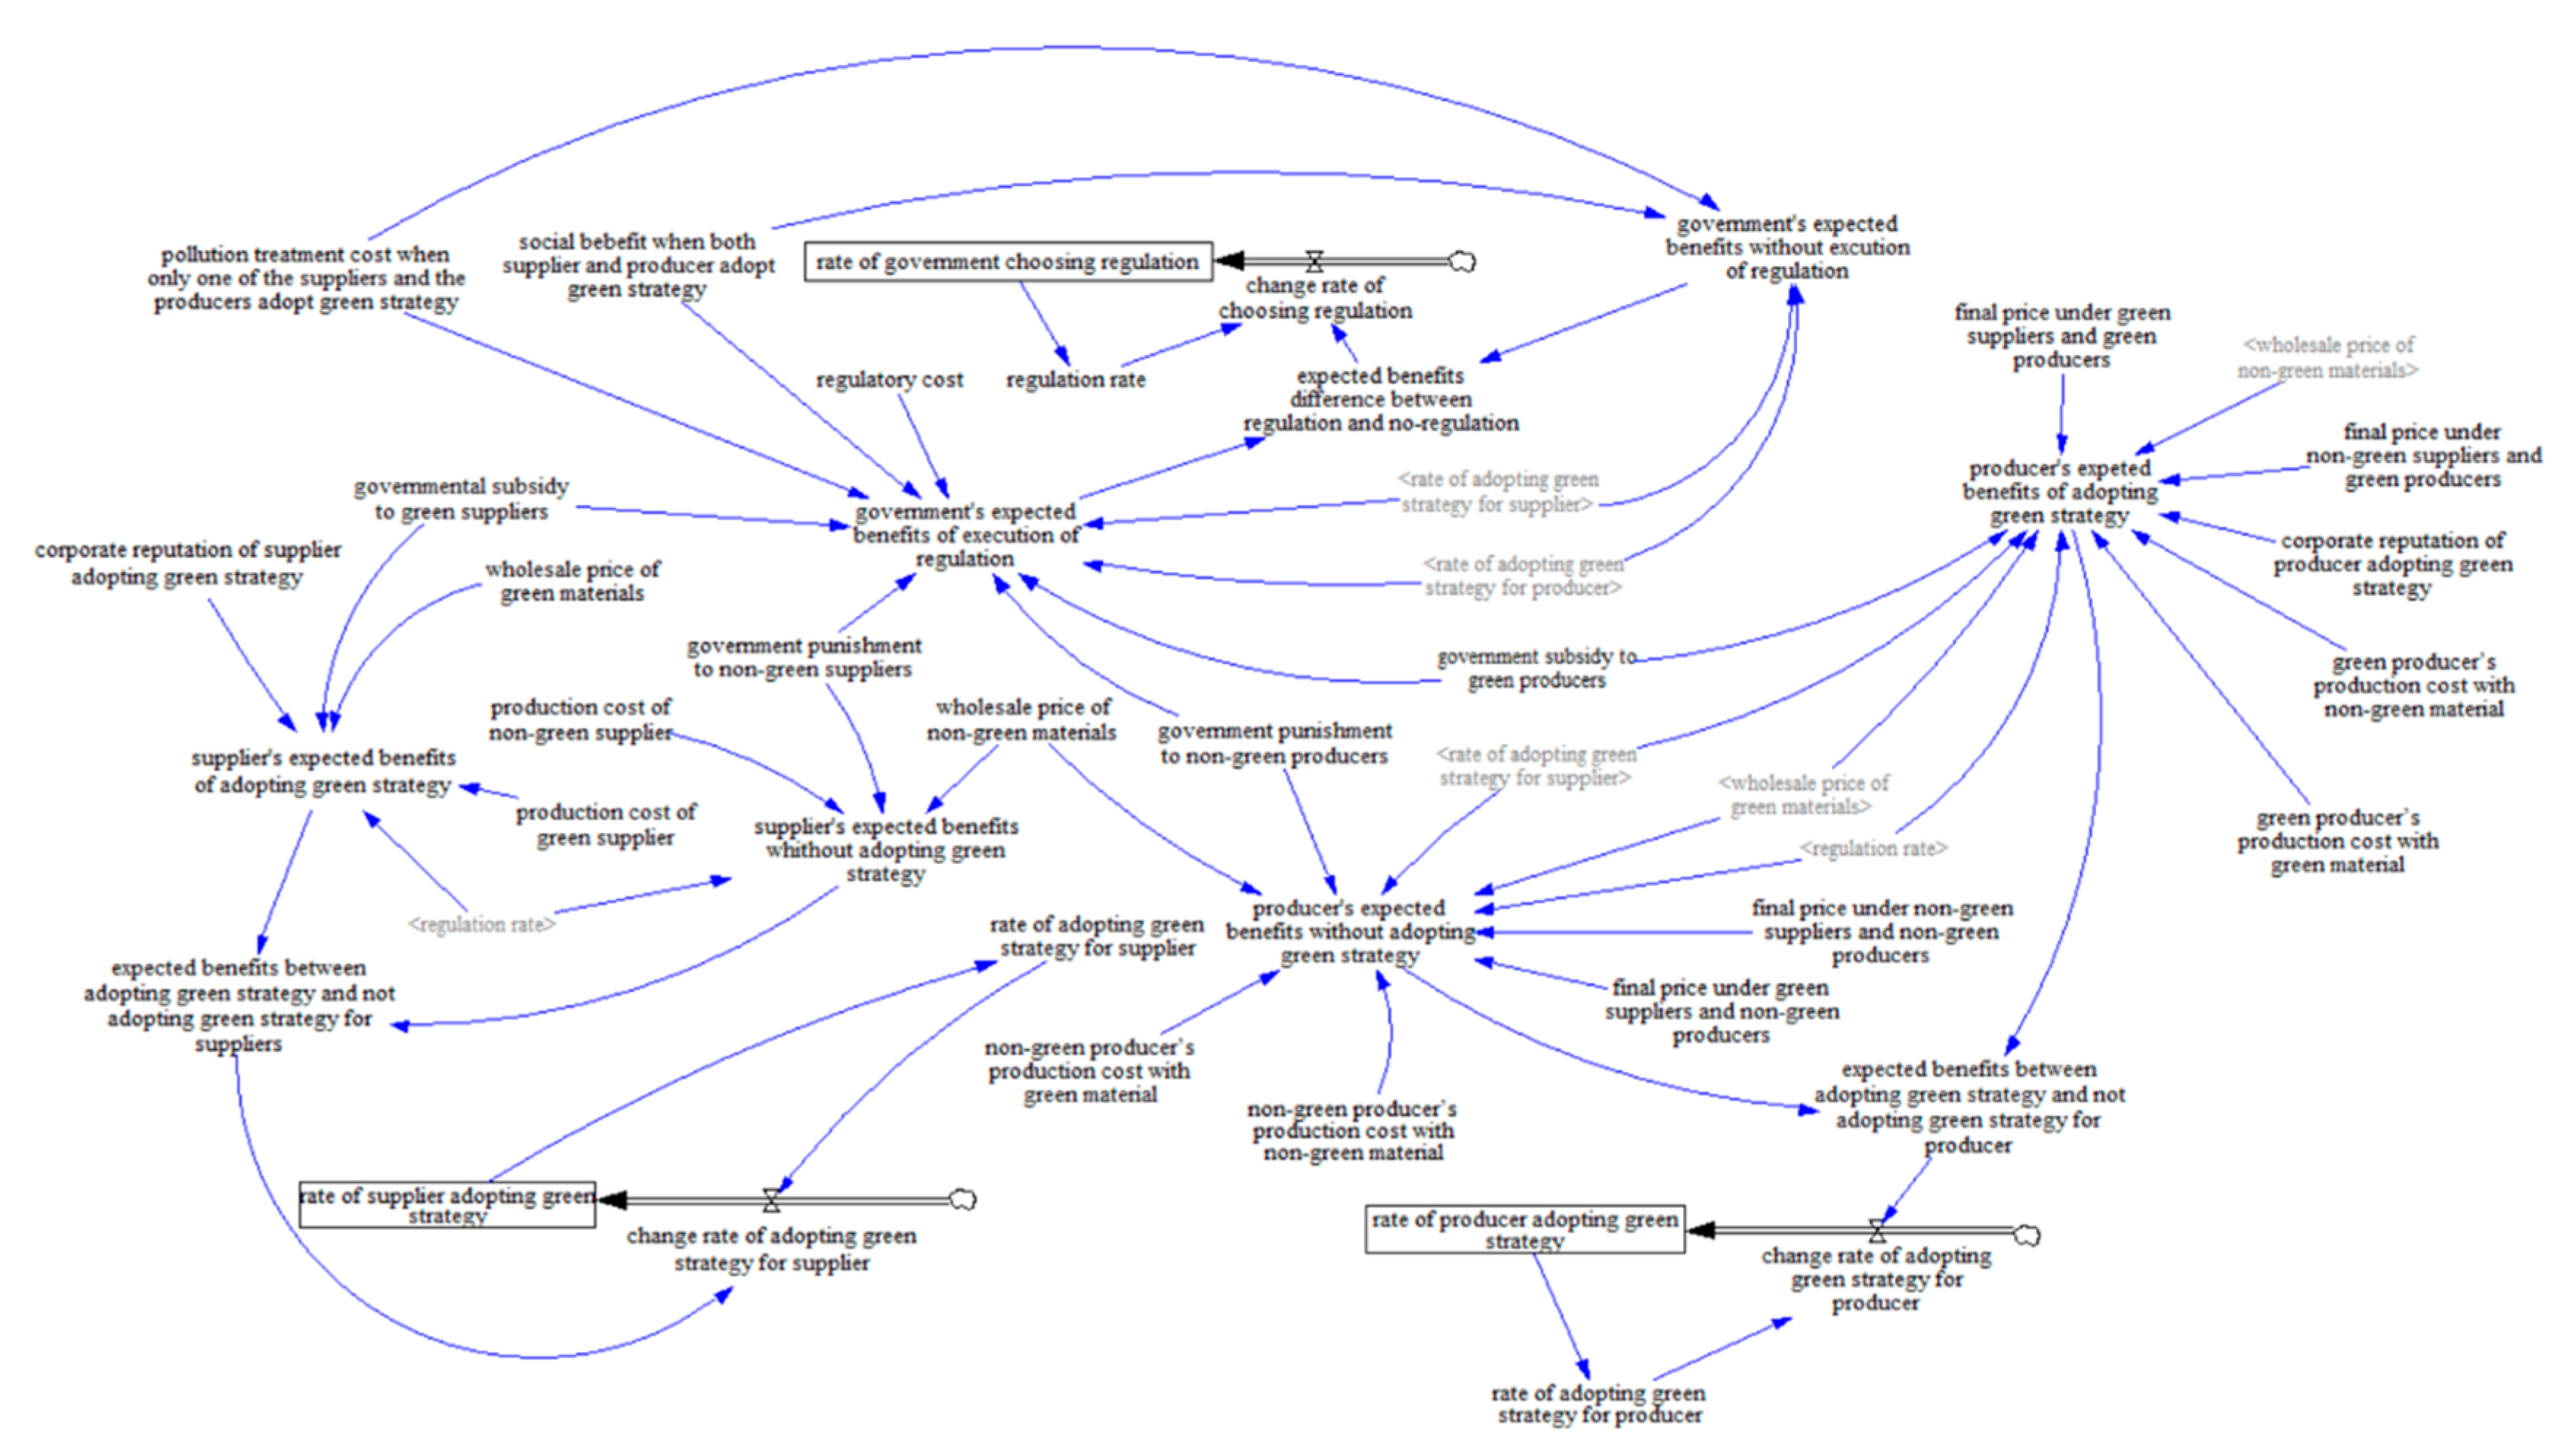
5.1. Simulation Model Construction Based on SYSTEM Dynamics (SD)

In the multi-player game, the individuals constantly imitate and learn from other individuals by observing and comparing their payoffs with others and then adjusting their strategy selection, which constitutes the feedback behavior in the group. Therefore, based on above evolutionary game model, we establish a system dynamic model of the suppliers, manufacturers and governments by Vensim PLE 5.6a to analyze the participants’ dynamic behavior trends and their long-term game relationships, which is shown in Figure 4. The SD model consists of three level variables, three rate variables, twelve intermediate variables and twenty external variables. The three level variables are used to indicate the probability of the government choosing regulation strategy or not, the probability of suppliers adopting green strategy or not, and the probability of suppliers adopting green strategy or not. The rate variables are used to describe the change in the probability of the participants’ strategies, which are presented as d x / d t , d y / d t , d z / d t in replicator dynamic equations.
Since increasing quantity of waste electrical and electronic equipment in China gives rise to a serious environmental problem, in recent years, governments have enacted some laws and regulations on electrical and electronic equipment management. Administrative measures on collection and use of waste electrical and electronic products treatment fund, issued in 2012, states that the corporations which recycle TVs, refrigerators, air conditioners, washing machines and computers can get 35–85 CNY (~$5–12) for per unit product [50]. In 2017, the Guidance on Strengthening the 13th Five-Year Energy Conservation and Emission Reduction Work promulgated by Ministry of Industry and Information Technology (MIIT) of China requires that environmental protection and energy saving should be considered in the electrical and electronic equipment’s whole life cycle including R&D, producing, transportation, recycling. Zhejiang Province, a major manufacturing region in China, has developed an electrical and electronic equipment management system of legislation and promulgated corresponding government financial policy [51]. The government of Zhejiang Province issued Regulations on the promotion of comprehensive utilization of resources in Zhejiang Province in 2011. It emphasizes the dismantling and recycling process of waste electrical and electronic products which conforms to environmental protection standard, technical specifications and product quality standard. In 2018, Economy and Information Technology Department of Zhejiang Province proposed the Implementation Plan of Green Manufacturing System Construction From 2018 to 2020, which stipulates that governments should provide financial support to the qualified green corporations, green products and green supply chains. In this paper, the electrical and electronic corporations that recycle the products are regarded as green corporations including suppliers and manufacturers. As the front-runner of electrical and electronic equipment manufacturers in Zhejiang Province, Company M has launched many self-owned brand electrical and electronic products. Company S is one of the suppliers of Company M and has two strategies for its production process: developing environmentally friendly raw materials or traditional raw materials. If Company S adopts a green strategy, i.e., it develops environmentally friendly raw materials, the unit production cost is 670 CNY (~$95.6), the wholesale price to Company M is 880 CNY (~$126); otherwise, the unit production cost and wholesale price are 450 CNY (~$64.2) and 720 CNY (~$103), respectively. The production cost and final price for Company M are related to the green-degree of the products, which are shown in four scenarios.
i.
Suppose Company M implements recycling activity and procures environmentally friendly materials from Company S, the unit production cost is 700 CNY (~$99.9) and the final price is 2350 CNY (~$335);
ii.
If Company M does not consider green activity or procures non-green materials, the unit production cost and final price are 660 CNY (~$94.1) and 2190 CNY (~$313), respectively;
iii.
If Company M implements recycling activity but Company S offers non-green materials, the unit production cost and final price are 780 CNY (~$111) and 2280 CNY (~$325), respectively;
iv.
If Company M purchases environmentally friendly materials but does not embrace recycling strategy, it would spend 500 CNY (~$71.3) for unit production and selling at 2280 CNY (~$325).
Besides, green activity could improve corporations’ reputations that are qualified as 20 CNY (~$2.85). It costs 15 CNY (~$2.14) for the government to supervise Company S and Company M on per unit product. The waste electrical and electronic products are disposed by the government and if Company S does not produce green materials or Company M does not recycle used products, the government tends to pay 50 CNY (~$7.13) per unit. The two companies can receive 50 CNY (~$7.13) per unit incentives for green production action, or the same amount of punishment is gotten for non-green production.
So the parameters are as follows: w g = 880, w n = 720, c n = 450, c g = 670, c g g = 700, c n g = 780, c g n = 500, c n n = 660, p g g = 2350, p n g = 2280, p g n = 2280, p n n = 2190, r S = 20, r M = 20, i S = i M = 50, f S = f M = 50, c G e = 15, c G d = 50.

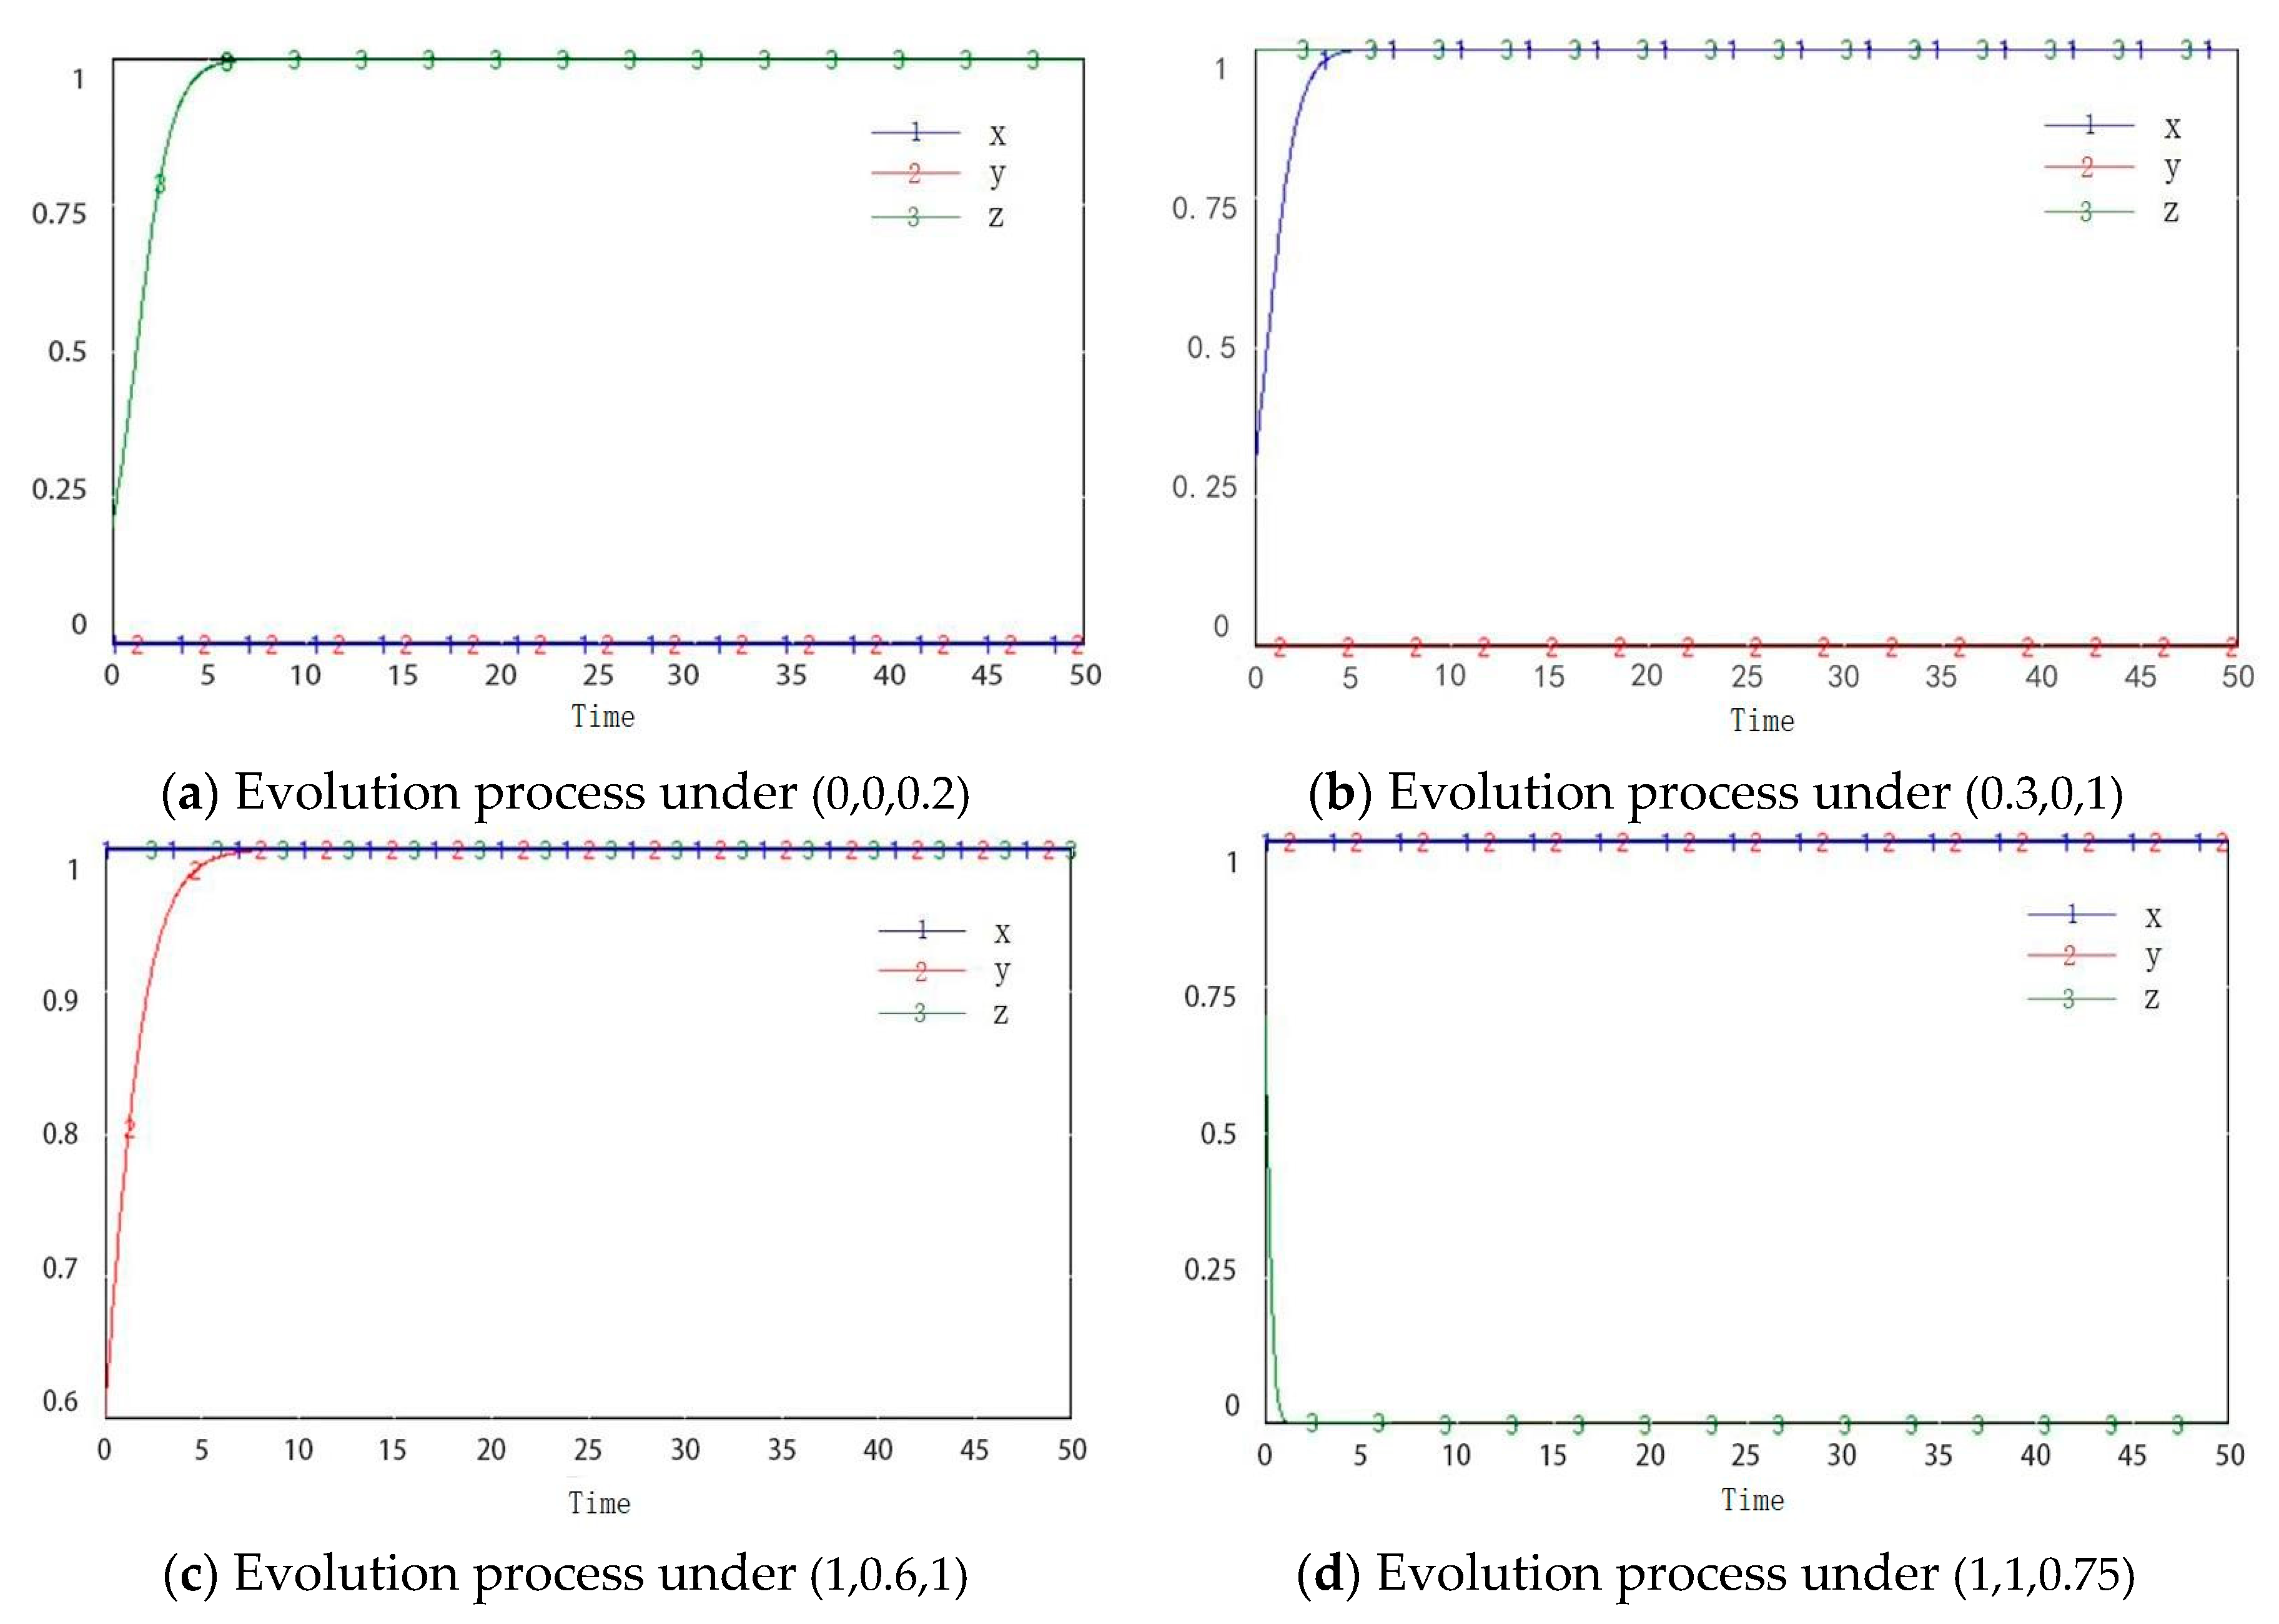
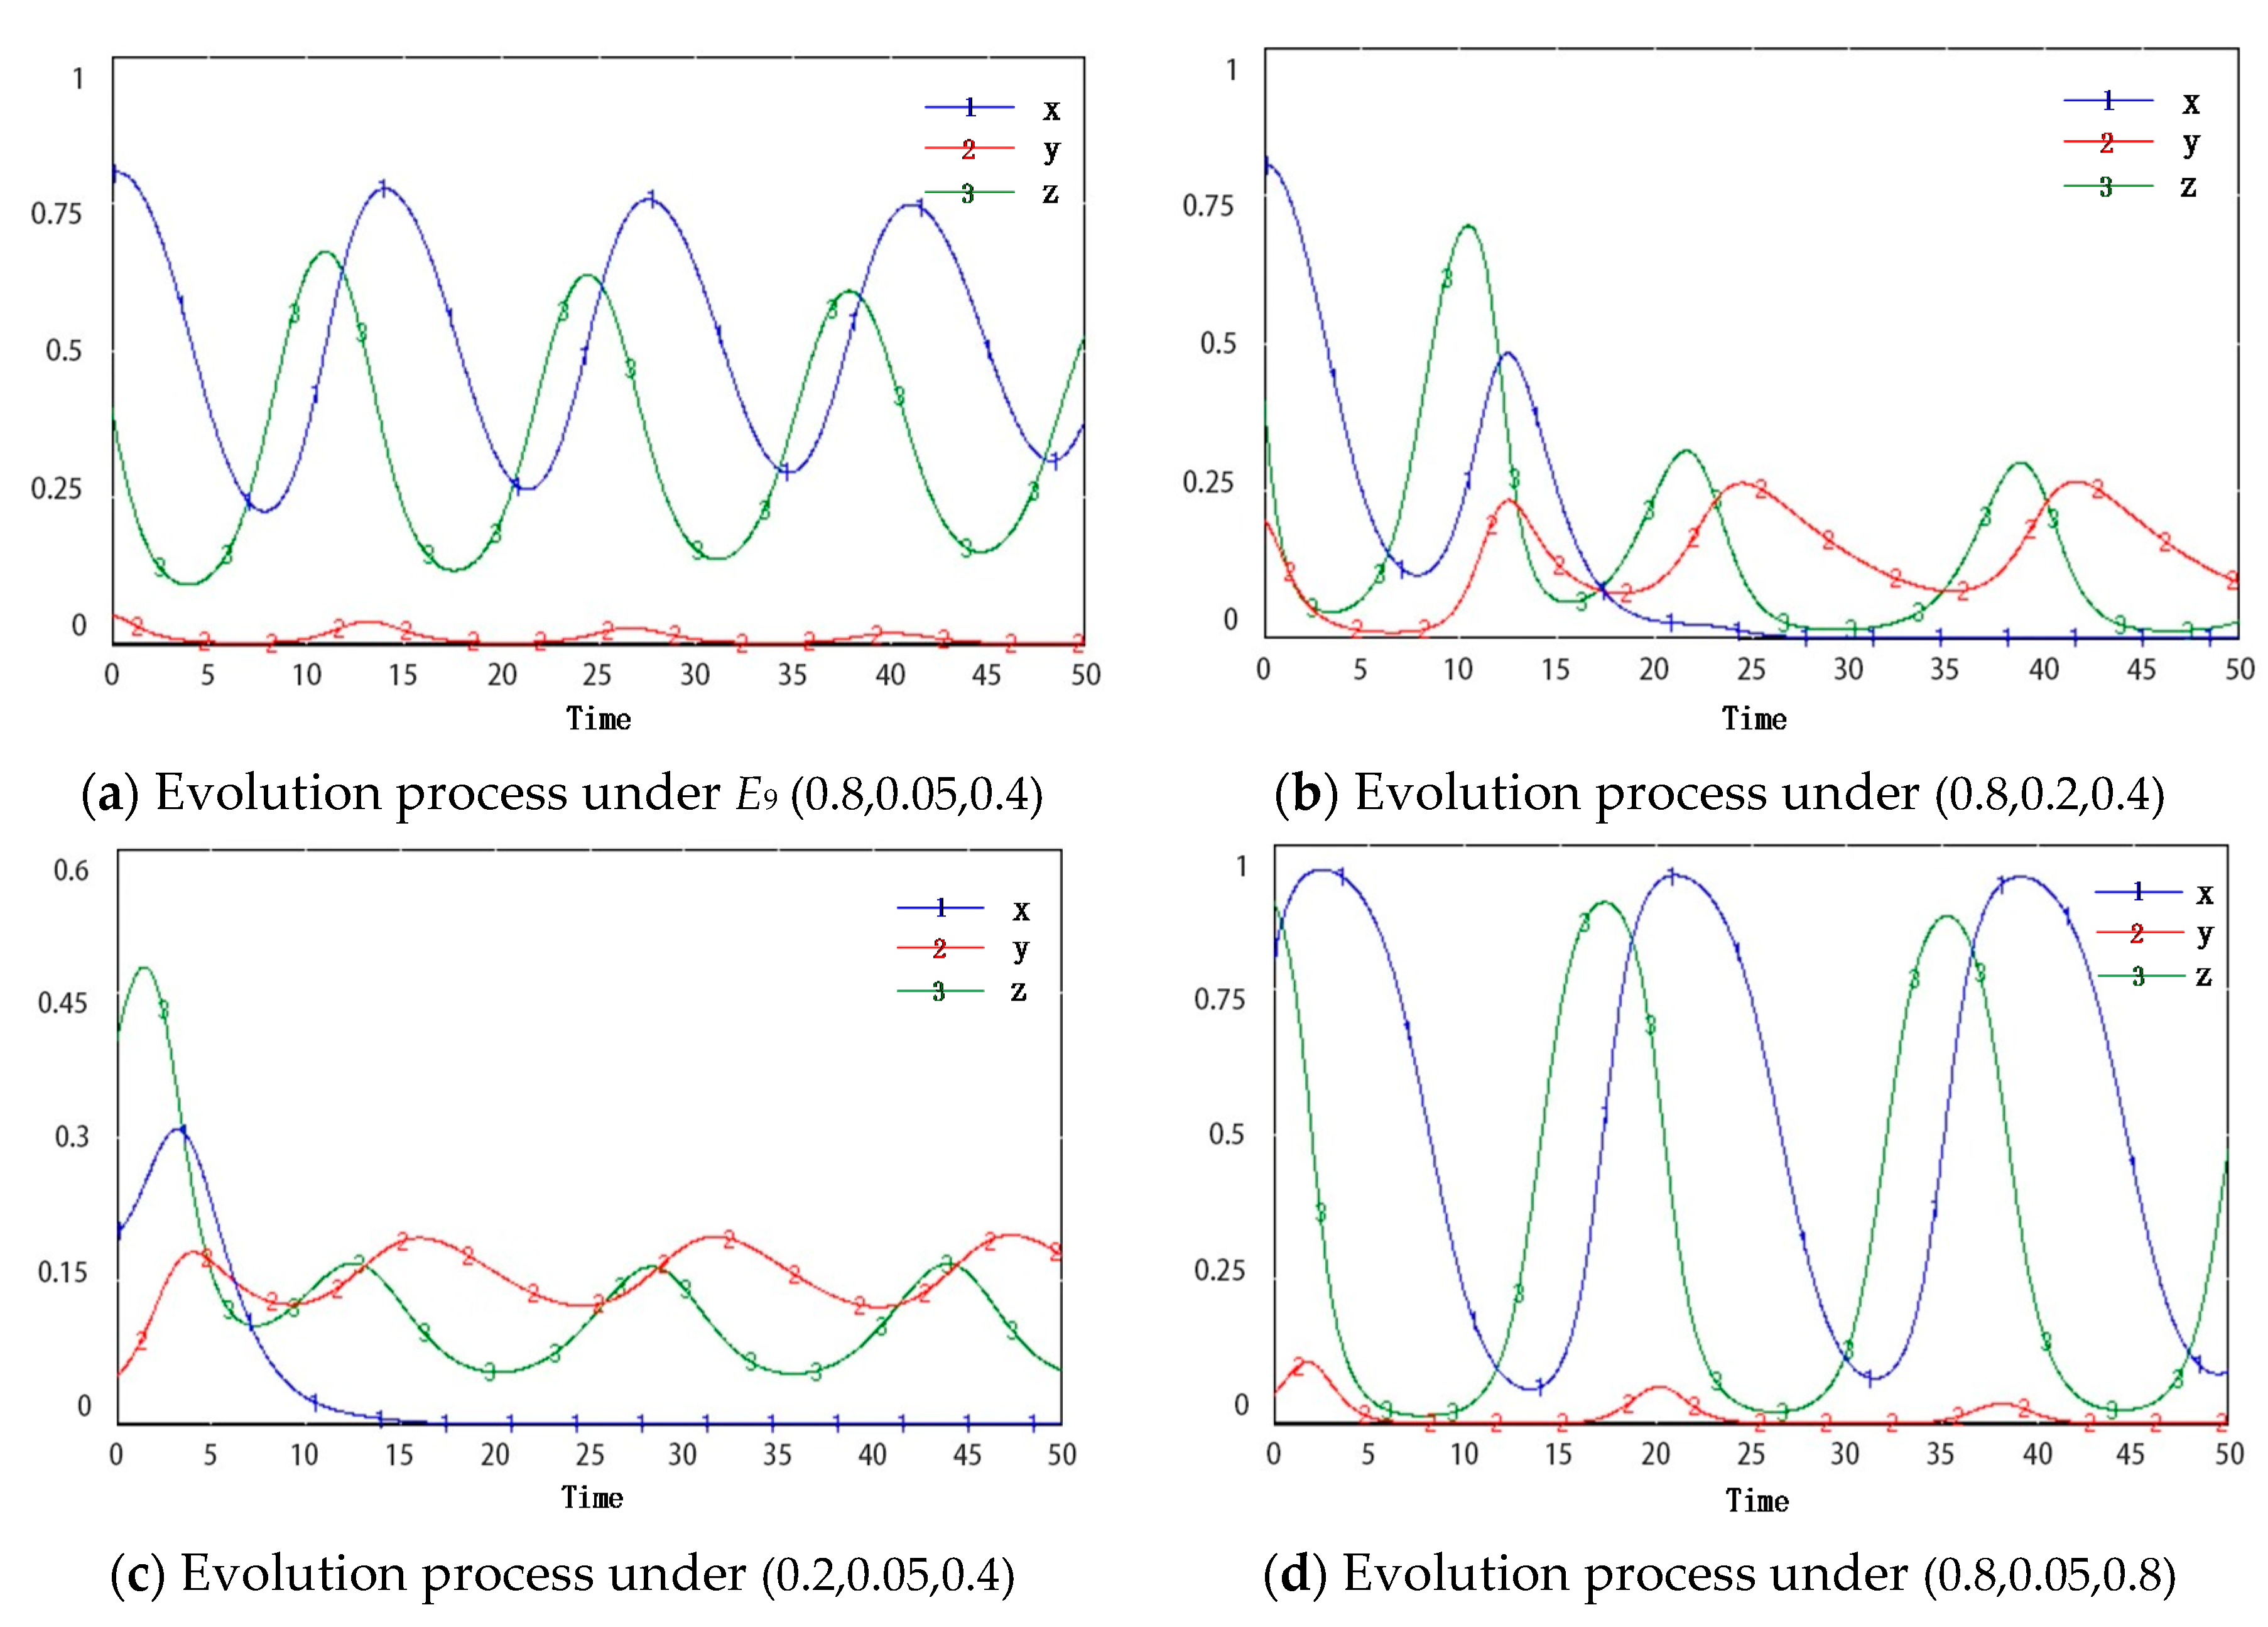
5.2. Equilibrium Stability Analysis

(1) Equilibrium stability analysis of pure strategies
We take the eight pure strategies E 1 ~ E 8 as the initial strategies of the model based on SD to investigate their stability. Under the initial strategy E 1 ( 0 , 0 , 0 ) , if the government supervision is strengthened and z changes from 0 to 0.2, government will obtain more benefit, thereby being motivated to supervise continuously. The strategy selection changes from the original non-regulatory (z = 0) to supervision (z = 1). The evolutionary game state of the system also changes from E 1 ( 0 , 0 , 0 ) to E 2 ( 0 , 0 , 1 ) , indicating that the pure equilibrium solution E 1 ( 0 , 0 , 0 ) is not the ESS, only the source (the unstable point) or the saddle point (see Figure 5a), so it can be seen that when both suppliers and manufacturers do not adopt a green strategy, even if the government supervises them and implements a reward and punishment system, suppliers and manufacturers still maintain non-green production.
As shown in Figure 5b, assuming that the current state is E 2 ( 0 , 0 , 1 ) , when probability of the green strategy of suppliers increases from 0 to 0.3, the equilibrium state of the evolutionary game system will transform into E 6 ( 1 , 0 , 1 ) , so E 2 ( 0 , 0 , 1 ) is not the ESS. With government’ reward and punishment mechanism, adopting green strategy could increase suppliers’ profits. However, due to the “free-rider” behavior of the manufacturer, the final state is that suppliers adopt green strategy while manufacturers still maintain the non-green behavior.
Suppose the probability of the green strategy of suppliers grows to 0.6 under the initial state of E 6 ( 1 , 0 , 1 ) , then both the suppliers and manufacturers will implement green activity eventually (see Figure 5c). Compared with the evolutionary process E 2 E 6 , the increase in the probability of the manufacturer adopting green strategy at this stage leads to the further increase of the manufacturer’s profit, so they are willing to produce green products, and E 8 ( 1 , 1 , 1 ) is the final evolutionary strategy.
Assuming that the current state is E 8 ( 1 , 1 , 1 ) , the supplier produces green materials and the manufacturer conducts recycling activity, and the government weakens the regulation slightly (z decreases to 0.75). Because taking green strategy could bring the supplier and manufacturer more profit, their strategy is not affected by the probability of government’s supervision when they initially implement green activity (see Figure 5d).
Under the initial strategy E 7 ( 1 , 1 , 0 ) , if either the supplier or manufacturer reduces the probability of green behavior, the final equilibrium strategy after long-term evolutionary game process is E 3 ( 0 , 1 , 0 ) and E 5 ( 1 , 0 , 0 ) , respectively. Similarly, E 3 ( 0 , 1 , 0 ) , E 4 ( 0 , 1 , 1 ) and E 5 ( 1 , 0 , 0 ) are not ESS for the evolutionary state will be changed when the strategy of one party changes.
(2) Equilibrium stability analysis of mixed strategy
By substituting the parameter values in Section 5.1 to Equations (16)–(18), we obtain E 9 = ( 0.8 , 0.05 , 0.4 ) . Considering the E 9 ( 0.8 , 0.05 , 0.4 ) as the initial state, we observe the influence of the strategy change on the evolutionary process.
When the initial state is E 9 ( 0.8 , 0.05 , 0.4 ) , the evolutionary process is illustrated in Figure 6a. The probability values of green strategies for the supplier and manufacturer as well as government regulation fluctuate over time, and the fluctuation ranges of manufacturer’s and government’s probability decrease with time. If the probability of the manufacturer’s green behavior increases from 0.05 to 0.2, the supplier tends to be stable after a period of fluctuation, but the probabilities of the manufacturer’s green behavior and the government’s regulatory still fluctuate with time (see Figure 6b). If the probability of the supplier reduces to 0.2, with the process of long-term continuous gaming, the supplier tends to take non-green action after short-term fluctuations, while the probability of the manufacturer and the government tends to fluctuate with stable amplitude (see Figure 6c). Figure 6d shows the evolutionary process when the probability of government regulation increases to 0.8, of which the trend is similar with Figure 6a.
Thus E 9 ( 0.8 , 0.05 , 0.4 ) is not a stable equilibrium point because the groups’ strategies constantly fluctuate with time. Increase in the proportion of green manufacturers will cause the supplier group to keep non-green production and volatility in green supplier proportion will be greater with the probability of government’s regulation increases. For the manufacturers, when the initial probability of their taking green actions is not high, increasing green supplier proportion promotes manufacturers to adopt green strategy, while the increase in the probability of government regulation cannot stimulate them to be greener.

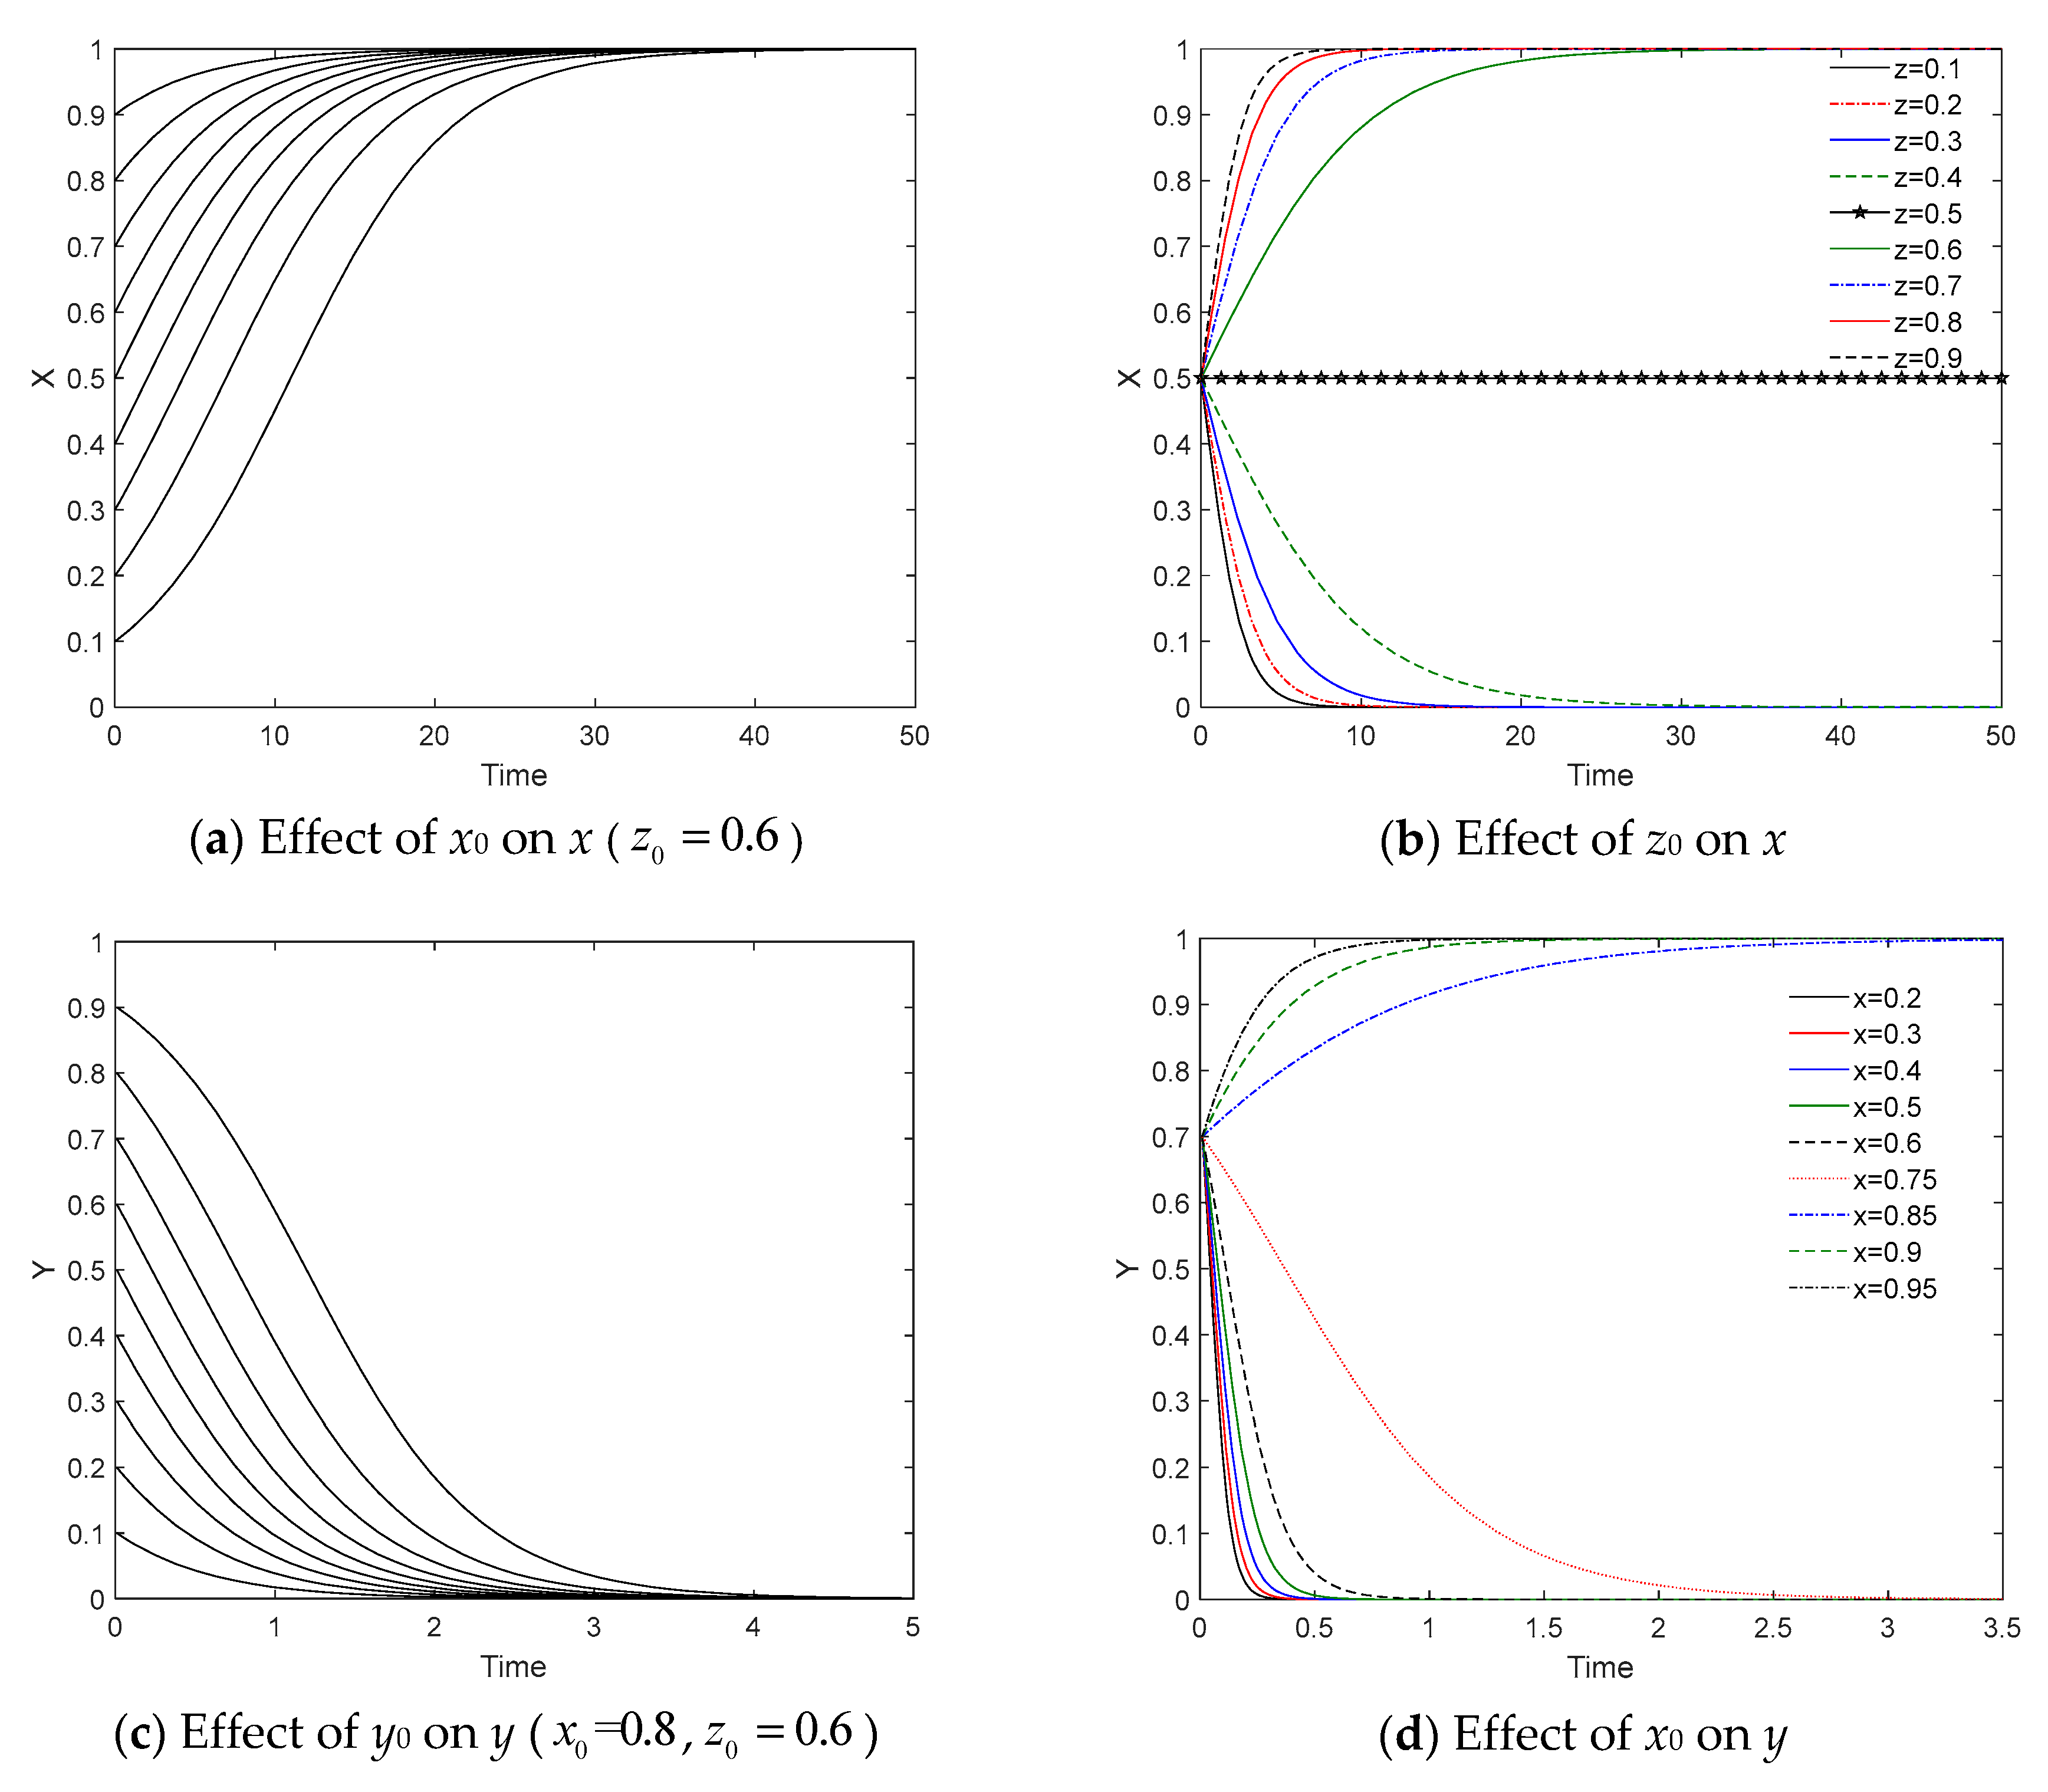
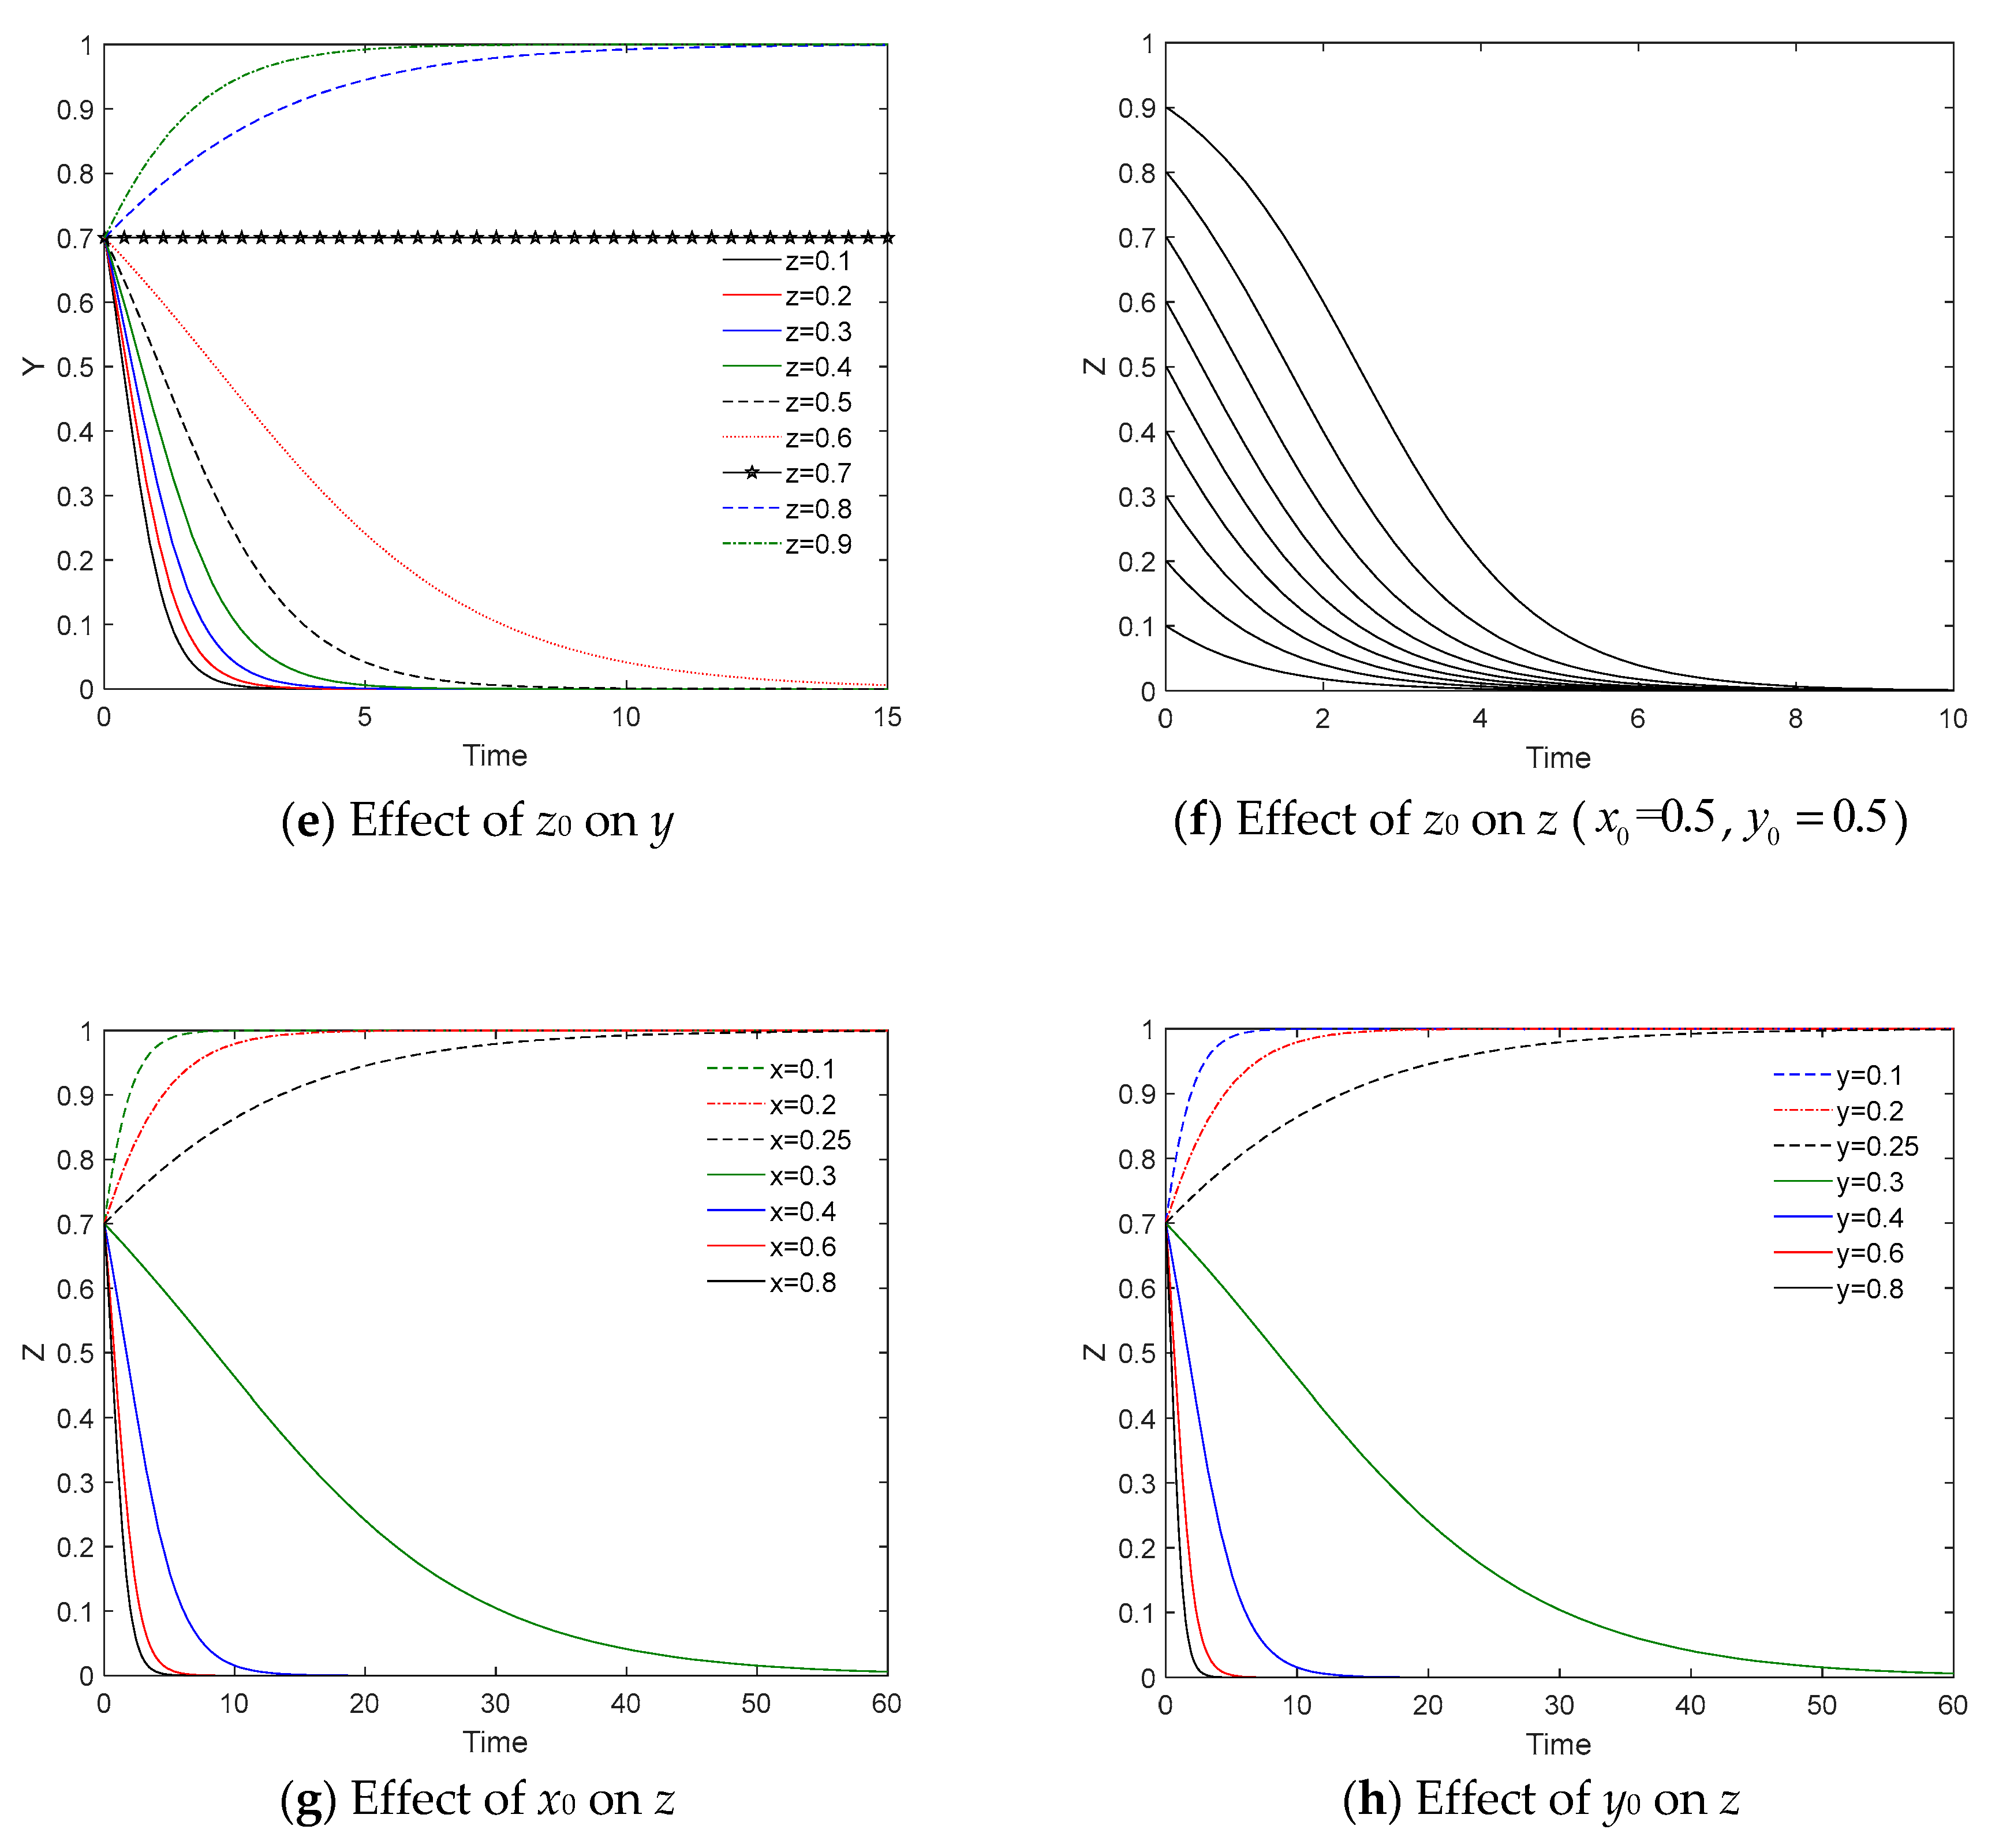
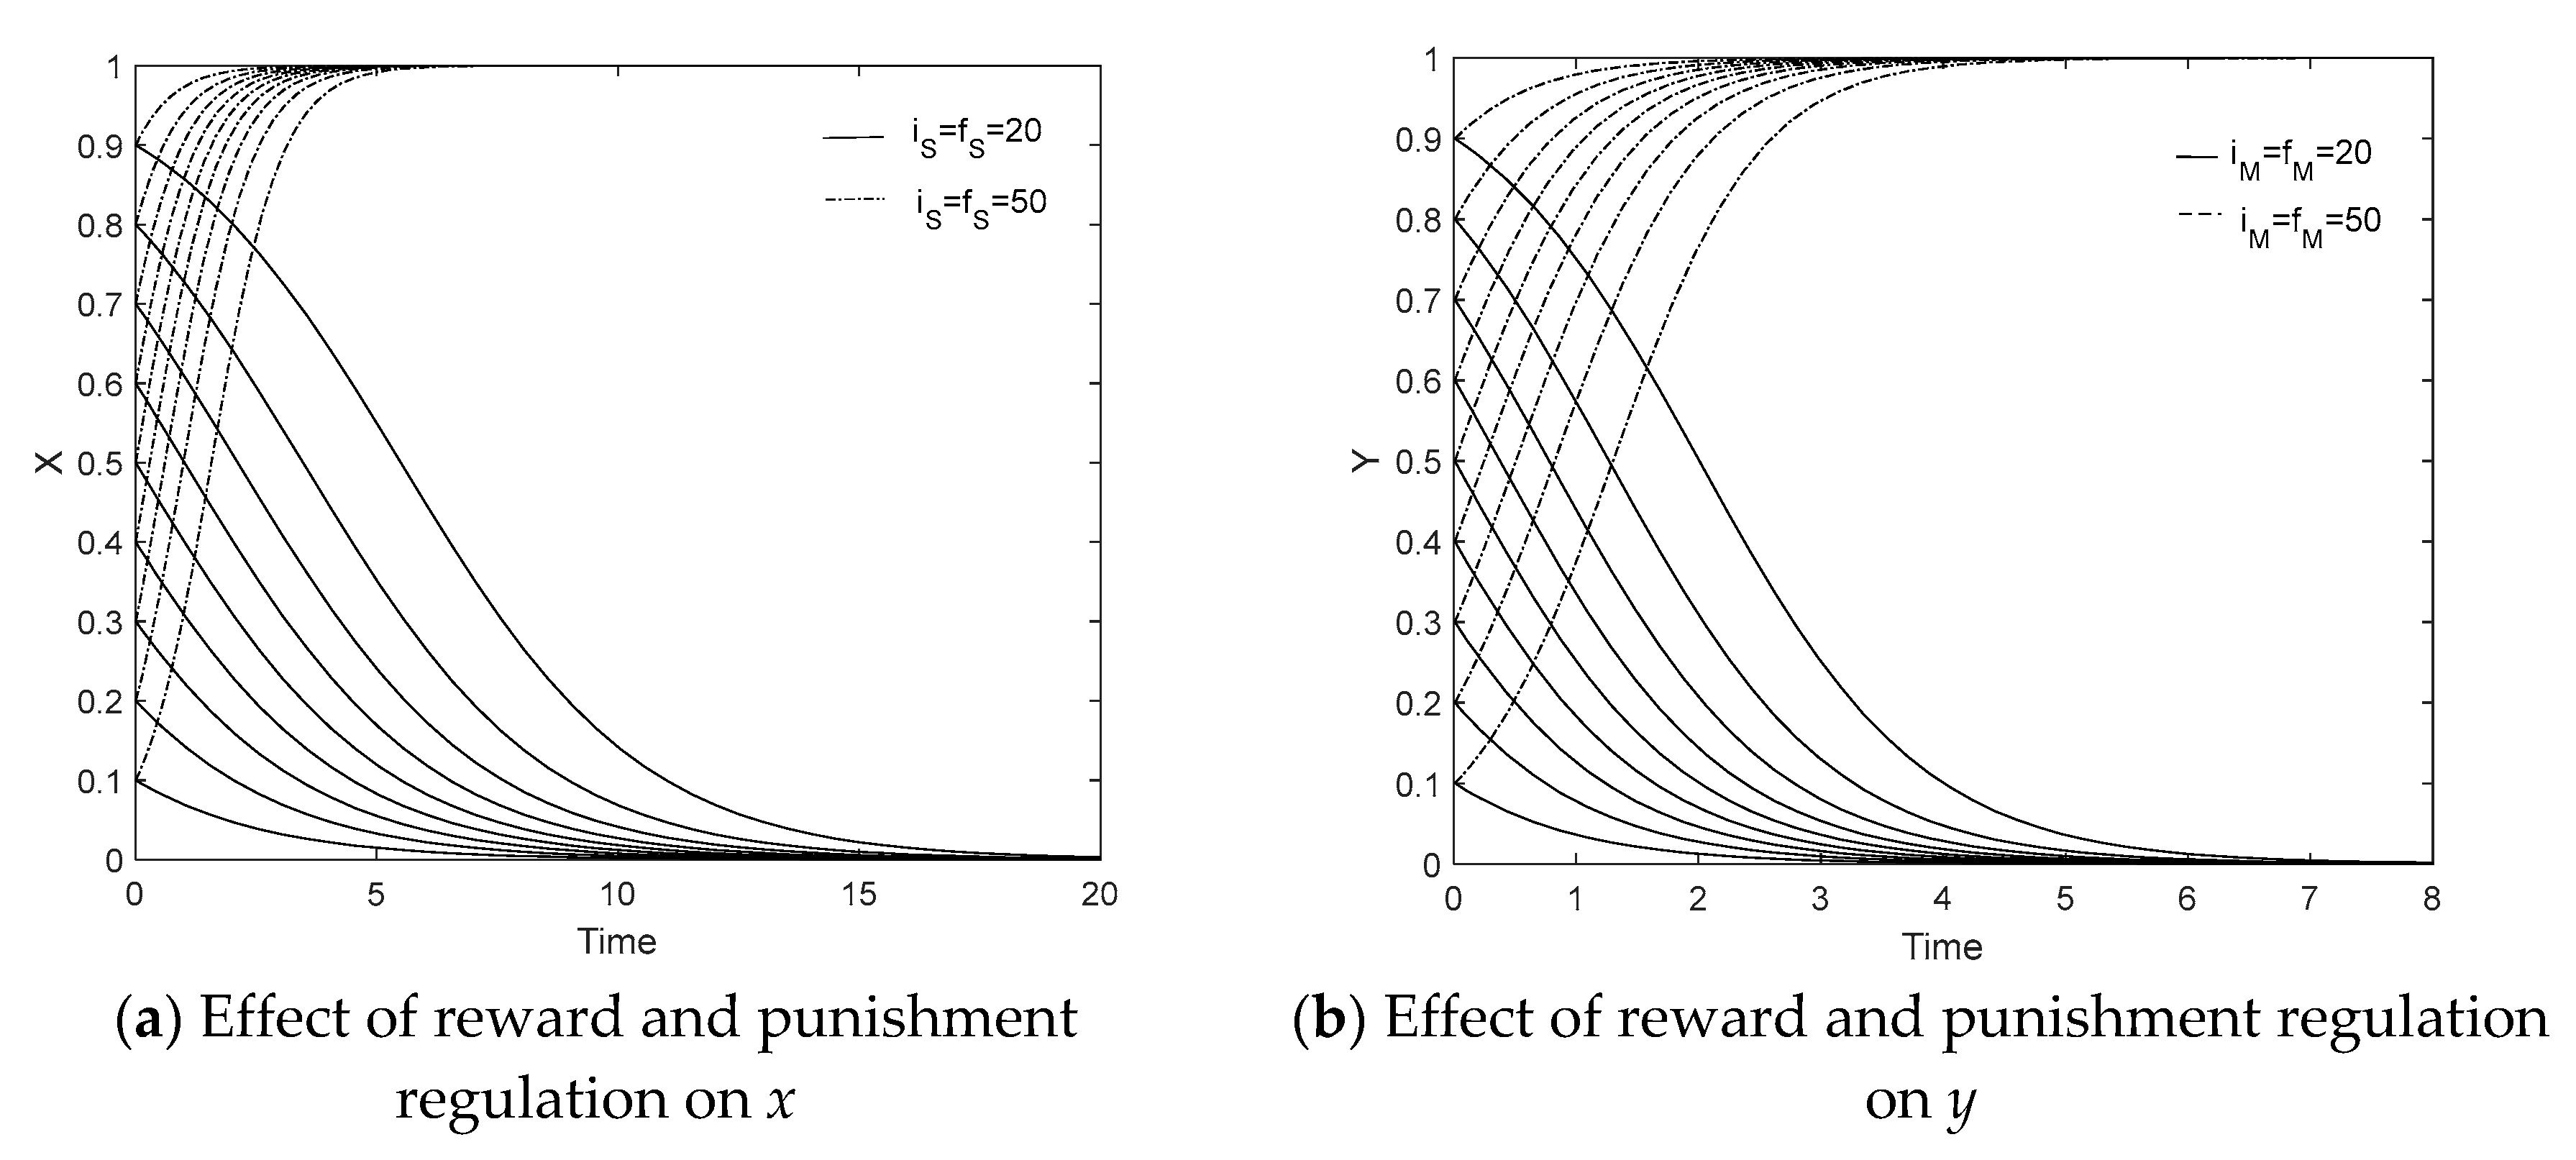
5.3. Sensitivity Analysis

In this section, a set of sensitivity analysis is conducted to further clarify the impact of key parameters on the evolutionary process. The parameter setting is consistent with Section 5.1.
(1) Effect of initial strategy on game equilibrium
As can be seen from Equation (10), the evolutionary process of the suppliers is related to their initial state and government regulatory probability, so we firstly analyze the initial probabilities of suppliers implementing green activities and government’s regulation on game equilibrium of supplier group. Let the probability value of the government’s regulatory strategy be 0.6, and the impact of different initial values x 0 on x can be observed in Figure 7a. As the value of x 0 increases, that is, more green suppliers are in the group at the beginning of the evolutionary game, the likelihood and speed of the evolution of supplier groups toward adopting green strategies enhance. Suppose the initial probability value of the government’s regulatory strategy z 0 ranges from 0.1 to 0.9, and Figure 7b elaborates the supplier’s strategy x under different values of z 0 . If z 0 < 0.5 , the supplier group finally choose not to adopt green behavior and the evolution speed to greening strategy slows down with the increase of the value; if z 0 = 0.5 , the supplier group also maintains a probability value of 0.5; in order to promote suppliers to take green production measures, the government should strengthen supervision, i.e., if z 0 > 0.5 , all suppliers will adopt green strategies and the evolution rate increases with the increase of value z 0 .
Figure 7c–e depict the effects of the initial green strategy likelihood of manufacturers y 0 and the probability of suppliers x 0 as well as initial probability of regulation z 0 on the manufacturer’s green behavior y, respectively. As shown in Figure 7c, for any initial probability of manufacturers themselves taking green behavior, the manufacturer group tends to choose not to take green actions, and with the increase of y 0 , the evolutionary speed toward non-green actions slows down. Suppose y 0 = 0.7 , the proportion of manufacturers who adopt green strategy changes with the values of x 0 and z 0 (see Figure 7d). If x 0 0.85 , the manufacturer group gradually take green actions, and the evolution to green strategy accelerates with x 0 increases; if x 0 0.75 , non-green strategy is all the manufacturers’ choice. The influence of z 0 on the evolutionary process of the manufacturer is similar with that on the supplier, shown in Figure 7e. High probability of government regulation stimulates manufacturers to adopt green strategies.
For the government, according to Equation (12), their evolutionary process is related to x 0 , y 0 and z 0 . When x 0 = y 0 = 0.5 , no government will adopt regulatory strategy no matter what their initial state is and the change rate gets smaller as z 0 increases (see Figure 7f). The values of x 0 and y 0 have the same influence on government decision. If x 0 = y 0 0.25 , regulatory strategy will be adopted by all governments. If x 0 = y 0 0.8 , that is, the proportions of green suppliers and manufacturers in their group are high, the government do not need to supervise them, as presented in Figure 7g,h.
From the above simulation analysis, it is clear that increasing the initial probability of government supervision, namely, the reward and punishment regulation is strengthened, could promote suppliers and manufacturers to carry out green production, and the stronger the supervision, the faster the two groups adopt green behaviors. In addition, suppliers’ green activity would improve the willingness of adopting green strategy for manufacturers. Low probability of suppliers and manufacturers adopting green strategy will provoke governments to execute supervision and implement reward and punishment mechanism.
(2) Effect of reward and punishment mechanism on game equilibrium
Considering the influence of different degree of government’s reward and punishments on the strategies of suppliers and manufacturers, we set high level of reward to suppliers and manufacturers as i ¯ S = i ¯ M = 50 , high level of punishment as f ¯ S = f ¯ M = 50 , low level of reward as i _ S = i _ M = 20 and low level of punishment as f _ S = f _ M = 20 . According to the replicator dynamic Equations (10) and (11), we see that the reward and penalty values have the same role in the evolution of the enterprise groups, so the influence of incentives and penalties are reflected in the same figure.
Figure 8a demonstrates the evolutionary game process of suppliers under different reward and punishment regulations. When incentives and penalties are relatively low ( i S = f S = 20 ), suppliers will not implement green production no matter what the initial probability of them adopting green strategy is. With higher initial probability, the evolution to x = 0 is faster. When incentives and penalties are relatively high ( i S = f S = 50 ), in contrast, regardless of the probability of suppliers’ initial choice, the group will eventually evolve toward green behavior, and the higher the initial probability is, the faster the evolution to x = 1 becomes.
The simulation results show that Figure 8b has evolutionary characteristics similar to those of Figure 8a, with the same management implications. A high level of incentives to green activity and penalties to non-green activity provided by governments could enhance the enthusiasm for adopting green strategy for suppliers and manufacturers, and the higher the initial willingness of enterprises to green production, the greater the incentive effect is.

6. Conclusions and Management Implications

In developing economies such as China, India and Brazil, green products are in their initial stage and enterprises are faced with challenges such as insufficient funds for research and immature production technology. The increasing costs for enterprises due to adopt green behavior, including green production technology development, new equipment introduction, utilization of clean energy and green raw materials, have greatly reduced the enthusiasm of enterprises for green production [52]. On the other hand, an increasing number of consumers in China with environmental awareness are pursuing eco-friendly products, providing driving force for the green development of enterprises [53]. At the same time, governments attach great importance to the sustainable development and have implemented a set of policies and regulations to promote green manufacturing, constantly strengthening the detection and supervision of the emission of enterprises and the greenness of products. This paper explores the use of evolutionary game theory to describe the long-term dynamic process of game among suppliers, manufacturers and governments on green activities and regulation. We firstly investigate evolutionary path of individual group and find equilibrium strategies of the system. Furthermore, we take a numerical example to analyze the interaction of participants’ strategies and the implementation effects of initial probability and different reward and punishment strategies on game process and game equilibrium. The main conclusions from this study are as follows:
(1)
Suppliers’ strategy depends on production cost, reputation gained by green behavior and the government’s reward and punishment mechanism. Manufacturers’ strategy is influenced by production cost, retail price, reputation gained by green behavior and government reward and punishment mechanism. In particular, whether the cooperated supplier adopts green behavior affects the manufacturer’s production cost and the price of the final product, so manufacturer’s strategy is also related to supplier’s action. Reducing the cost of green raw materials (green production cost), increasing consumer acceptance of green products, and strengthening the rewards and punishments mechanism contribute to the evolution of suppliers and manufacturers to green behavior strategies.
(2)
The government’s strategy is related to the degree of incentives and penalties, supervision cost, and the cost of pollution treatment. When a high proportion of suppliers or manufacturers adopt green strategy, governments do not need to supervise them. On the contrary, if most of the suppliers or manufacturers maintain a non-green strategy, supervision and reward and punishment mechanism should be applied.
(3)
In the long-term game process, the strategies of suppliers, manufacturers and the governments change with the behavior of other groups. Under the condition that suppliers and manufacturers do not adopt green strategy and governments do not execute regulatory strategy, strengthening government’s regulation could promote suppliers to implement green production but the manufacturers will remain non-green as a free rider. If the suppliers adopt green strategy and the government carry out regulation, raising the probability of green decision-making for the non-green manufacturers leads to both the two enterprises groups finally take greening measures. Under this situation, reduction on the probability of regulatory behaviors will not affect the enterprises’ green behavior strategy.
(4)
The strategies of suppliers, manufacturers, and governments are related to the initial probability of themselves and other groups. For suppliers, high initial probability of their adopting green strategy lead to high evolution speed to green behavior of all group when the probability value of government regulation behavior is a constant. When government’s regulation is strengthened and a large number of suppliers implement green production, the manufacturers tend to keep non-green behavior. Both the strategies of suppliers and manufacturers affect governments’ evolutionary path and speed. Government’s regulation is taken when most suppliers and manufacturers do not adopt green strategy, and strengthening incentives and penalties could provoke enterprises to take green actions.
Based on the above conclusions, we provide the following recommendations for governments and enterprises:
(1)
Immature eco-friendly production technology and high production cost are the main factors restricting enterprises to implement green activities, thus the government should increase the investment in new technology research and development, cultivating innovative and technical personnel, and providing subsidies for green enterprises.
(2)
The strategies of the enterprises (suppliers and manufacturers) and governments cannot reach an stable evolutionary point. Therefore, governments should focus on production behavior of enterprises and the development of green product market, so as to adjust existing mechanism to formulate the best possible reward and punishment regulation for suppliers and manufacturers to adopt green technology. More incentives should be provided for green enterprises and penalties should be strengthened for non-green enterprises.
(3)
When both the supplier and manufacturer in the supply chain are less likely to adopt green strategies, the government could first implement regulation on the manufacturer because the supplier will also be greener if its cooperating manufacturer adopts a green strategy after a long-term evolution process.
(4)
Governments are supposed to distinguish the non-green enterprises that are to be supervised and guided to carry out green production, thereby enhancing the proportion of green suppliers and manufacturers in their group. A high proportion of green enterprises contributes to accelerating the green product development.
(5)
The probability of the government regulation will decrease with the increase of governmental regulation cost, and vice versa. Therefore, the governments not only constantly improve their regulatory capability to monitor the production activity of enterprises enough, but also gradually reduce the supervision cost, and improve regulatory efficiency and effectiveness by formulating a more perfect information disclosure system and standardized enterprise green assessment system.
The paper expounds the long-term and dynamic interaction between government regulation and green behavior of supply chain enterprises and provides some recommendations on the formulation and improvement of environmental policy for governments. There also exists several limitations in our work: (1) Only one type of mechanism providing a fixed subsidy and punishment is considered, while in reality, the government can formulate various forms of reward and punishment. For instance, the government can construct different reward and punishment systems according to greenness of products or carbon emissions; (2) The evolutionary game model construction is based on profit of unit product, without considering the quantity of products. For the future research, it is of more value in practical guidance to consider the different market demand for green products in different development stages and the total profit for the participants; (3) Behaviors of governments and enterprises can be analyzed by empirical research which may provide more objective and practical results. The impact of environmental policy on the strategy of corporations and other parameters should be evaluated by conducting a future survey and experiment of firms and governments.

Author Contributions

Conceptualization, X.S. & J.C.; Data curation, Y.W. and X.S; Formal analysis, J.X. and X.S; Investigation, Y.W. and J.Z.; Writing-original draft, J.X.; Writing-review & editing, J.X. & J.C. All authors have read and agreed to the published version of the manuscript.

Funding

This work was partially supported by the National Natural Science Foundation of China (71874159, 71371169), National Social Science Foundation of China (17BGL047) and the Natural Science Foundation of Zhejiang, China (LY18G020020).

Conflicts of Interest

The authors declare no conflict of interest.

Appendix A. Proof for Strategy Stability of Manufacturers

Translate Equation (11) into:
F ( y ) = d y d t = y ( 1 y ) [ x ( Δ p 1 Δ c 1 ) + ( 1 x ) ( Δ p 2 Δ c 2 ) + r M + z ( i M + f M ) ]
The first derivatie of F ( y ) is as follows:
F ( y ) = ( 1 2 y ) [ x ( Δ p 1 Δ c 1 ) + ( 1 x ) ( Δ p 2 Δ c 2 ) + r M + z ( i M + f M ) ]
We can easily get that y = 0 , y = 1 and z = x ( Δ c 1 Δ p 1 ) + ( 1 x ) ( Δ c 2 Δ p 2 ) r M i M + f M are the solutions of F ( y ) = d y / d t = 0 . And when F ( y * ) = 0 , F ( y * ) 0 , the ESS is y*.

Appendix B. Proof for Strategy Stability of Governments

Based on the replicator dynamics equation of governments (Equation (12)), we can get the first derivative of F ( z ) as follows:
F ( z ) = ( 1 2 z ) [ x i S c G e y i M + ( 1 y ) f M + ( 1 x ) f S ]
It can be calculated that z = 0 , z = 1 and x = ( 1 y ) f M + f S y i M c G e i S + f S are solutions of F ( z ) = d z / d t = 0 .

Appendix C. Proof of Proposition 1

Let F ( x ) = 0 , F ( y ) = 0 , F ( z ) = 0 in the replicator dynamic system (15), we can get eight fixed equilibrium points E 1 ( 0 , 0 , 0 ) , E 2 ( 0 , 0 , 1 ) , E 3 ( 0 , 1 , 0 ) , E 4 ( 0 , 1 , 1 ) , E 5 ( 1 , 0 , 0 ) , E 6 ( 1 , 0 , 1 ) , E 7 ( 1 , 1 , 0 ) , E 8 ( 1 , 1 , 1 ) .
Let:
{ w g w n + c n c g + r S + z ( i S + f S ) = 0 x ( p g g p g n c g g + c g n ) + ( 1 x ) ( p n g p n n c n g + c n n ) + r M + z ( i M + f M ) = 0 x i S c G e y i M + ( 1 y ) f M + ( 1 x ) f S = 0
and combining with Δ w = w g w n , Δ c = c g c n , Δ p 1 = p g g p g n , Δ p 2 = p n g p n n , Δ c 1 = c g g c g n , Δ c 2 = c n g c n n , we obtain x * = ( i S + f S ) ( Δ p 2 Δ c 2 + r M ) + ( i M + f M ) ( Δ c Δ w r S ) ( i S + f S ) ( Δ p 2 Δ p 1 + Δ c 1 Δ c 2 ) , y * = 1 i M + f M [ ( i S + f S ) ( Δ p 2 Δ c 2 + r M ) + ( i M + f M ) ( Δ c Δ w r S ) Δ p 1 Δ p 2 + Δ c 2 Δ c 1 + f S + f M c G e ] , and z * = Δ c Δ w r S i S + f S .

References

  1. Gupta, S.; Palsule-Desai, O. Sustainable supply chain management: Review and research opportunities. IIMB Manag. Rev. 2011, 23, 234–245. [Google Scholar] [CrossRef] [Green Version]
  2. Bazan, E.; Jaber, M.Y.; Zanoni, S. Supply chain models with greenhouse gases emissions, energy usage and different coordination decisions. Appl. Math. Model. 2015, 39, 5131–5151. [Google Scholar] [CrossRef]
  3. Cao, J.; Zhang, X.M.; Hu, L.L.; Xu, J.Y.; Zhao, Y.W.; Zhou, G.G.; Schnoor, J.L. EPR regulation and reverse supply chain strategy on remanufacturing. Comput. Ind. Eng. 2018, 125, 279–297. [Google Scholar] [CrossRef]
  4. Ma, C.S.; Chen, X.; Luo, Z.Y. Production strategy of considering low carbon emission policies regulation under stochastics demand. Control Decis. 2015, 30, 969–976. [Google Scholar]
  5. Centobelli, P.; Cerchione, R.; Esposito, E. Environmental sustainability and energy-efficient supply chain management: A review of research trends and proposed guidelines. Energies 2018, 11, 275. [Google Scholar] [CrossRef] [Green Version]
  6. Sellitto, M.A.; Hermann, F.F.; Blezs, A.E. Describing and organizing green practices in the context of green supply chain management: Case studies. Resour. Conserv. Recycl. 2019, 145, 1–10. [Google Scholar] [CrossRef]
  7. Kumar, A.; Holuszko, M.; Espinosa, D.C.R. E-waste: An overview on generation, collection, legislation and recycling practices. Resour. Conserv. Recycl. 2017, 122, 32–42. [Google Scholar] [CrossRef]
  8. Ji, G.J.; Huang, W.W. Effective implementation of WEEE take-back directive. J. Manag. Sci. China 2012, 15, 1–9. [Google Scholar]
  9. Zhao, X.M.; You, J.J.; Li, Y.Q. The effect of government fund policy in promoting WEEE recycling. Chin. J. Manag. Sci. 2018, 26, 42–53. [Google Scholar]
  10. Li, C.F.; Zhu, L.M. Optimal recovery strategies of home appliance trade-in scheme under EPR. Oper. Res. Manag. Sci. 2017, 26, 67–75. [Google Scholar]
  11. Cao, J.; Xu, J.Y.; Wang, H.; Zhang, X.M.; Chen, X.H.; Zhao, Y.W.; Yang, X.L.; Zhou, G.G.; Schnoor, J.L. Innovating collection modes for waste electrical and electronic equipment in China. Sustainability 2018, 10, 1446. [Google Scholar] [CrossRef] [Green Version]
  12. Chatterjee, K.; Zufferey, D.; Nowak, M.A. Evolutionary game dynamics in populations with different learners. J. Theor. Biol. 2012, 301, 161–173. [Google Scholar] [CrossRef] [Green Version]
  13. Nimse, P.; Vijayan, A.; Kumar, A.; Varadarajan, C. A review of green product databases. Am. Inst. Chem. Eng. 2007, 26, 131–137. [Google Scholar] [CrossRef]
  14. Savaskan, R.C.; Bhattacharya, S.; Van Wassenhove, L.N. Closed-loop supply chain models with product remanufacturing. Manag. Sci. 2004, 50, 239–252. [Google Scholar] [CrossRef] [Green Version]
  15. Nagarajan, M.; Sošić, G. Game-theoretic analysis of cooperation among supply chain agents: Review and extensions. Eur. J. Oper. Res. 2008, 187, 719–745. [Google Scholar] [CrossRef]
  16. Nagurney, A.; Yu, M. Sustainable fashion supply chain management under oligopolistic competition and brand differentiation. Int. J. Prod. Econ. 2012, 135, 532–540. [Google Scholar] [CrossRef]
  17. Shi, P.; Yan, B.; Shi, S. Pricing and product green degree decisions in green supply chains with fairness concerns. Syst. Eng. Theory Pract. 2016, 36, 1937–1950. [Google Scholar]
  18. Bai, C.G.; Tang, J.F. Manufacturing-marketing green supply chain cooperative game analysis. J. Syst. Eng. 2017, 32, 818–828. [Google Scholar]
  19. Hong, Z.F.; Wang, H.; Yu, Y. Green product pricing with non-green product reference. Transp. Res. E 2018, 115, 1–15. [Google Scholar] [CrossRef]
  20. Song, H.; Gao, X. Green supply chain game model and analysis under revenue-sharing contract. J. Clean. Prod. 2018, 170, 183–192. [Google Scholar] [CrossRef]
  21. Taleizadeh, A.A.; Alizadeh-Basban, N.; Niaki, S.T.A. A closed-loop supply chain considering carbon reduction, quality improvement effort, and return policy under two remanufacturing scenarios. J. Clean. Prod. 2019, 232, 1230–1350. [Google Scholar] [CrossRef]
  22. Capraro, V.; Jagfeld, G.; Klein, R.; Mul, M.; Pol, I.V.D.; Van de Pol, I. Increasing altruistic and cooperative behaviour with simple moral nudges. Sci. Rep. 2019, 9, 11880. [Google Scholar] [CrossRef] [PubMed]
  23. Alboszta, J.; Miȩkisz, J. Stability of evolutionarily stable strategies in discrete replicator dynamics with time delay. J. Theor. Biol. 2004, 231, 175–179. [Google Scholar] [CrossRef] [PubMed] [Green Version]
  24. Barari, S.; Agarwal, G.; Zhang, W.J.; Mahanty, B.; Tiwari, M.K. A decision framework for the analysis of green supply chain contracts: An evolutionary game approach. Expert Syst. Appl. 2012, 39, 2965–2976. [Google Scholar] [CrossRef]
  25. Babu, S.; Mohan, U. An integrated approach to evaluating sustainability in supply chains using evolutionary game theory. Comput. Oper. Res. 2018, 89, 269–283. [Google Scholar] [CrossRef]
  26. Ji, S.F.; Zhao, D.; Luo, R.J. Evolutionary game analysis on local governments and manufacturers’ behavioral strategies: Impact of phasing out subsidies for new energy vehicles. Energy 2019, 189, 11064. [Google Scholar] [CrossRef]
  27. Bansal, S.; Gangopadhyay, S. Tax/subsidy policies in the presence of environmentally aware consumers. J. Environ. Econ. Manag. 2003, 45, 333–355. [Google Scholar] [CrossRef]
  28. Chen, Y.J.; Sheu, J.B. Environmental-regulation pricing strategies for green supply chain management. Transp. Res. E Logist. 2009, 45, 667–677. [Google Scholar] [CrossRef] [Green Version]
  29. Zhu, Q.H.; Dou, Y.J. A game model for green supply chain management based on government subsidies. J. Manag. Sci. China 2011, 14, 86–95. [Google Scholar]
  30. Krass, D.; Nedorezov, T.; Ovchinnikov, A. Environmental taxes and the choice of green technology. Prod. Oper. Manag. 2013, 22, 1035–1055. [Google Scholar] [CrossRef]
  31. Hafezalkotob, A. Competition of two green and regular supply chains under environmental protection and revenue seeking policies of government. Comput. Ind. Eng. 2015, 82, 103–114. [Google Scholar] [CrossRef]
  32. Wang, W.B.; Deng, W.W.; Bai, T. Design the reward-penalty mechanism for reverse supply chains based on manufacturers’ competition and carbon footprint constraints. J. Ind. Eng. 2016, 30, 188–194. [Google Scholar] [CrossRef]
  33. Ghosh, D.; Shah, J. A comparative analysis of greening policies across supply chain structures. Int. J. Prod. Econ. 2012, 135, 568–583. [Google Scholar] [CrossRef]
  34. Yang, D.X.; Chen, Z.Y.; Nie, P.Y. Output subsidy of renewable energy power industry under asymmetric information. Energy 2016, 117, 291–299. [Google Scholar] [CrossRef]
  35. Mahmoudi, R.; Rasti-Barzoki, M. Sustainable supply chains under government intervention with a real-world case study: An evolutionary game theoretic approach. Comput. Ind. Eng. 2018, 116, 130–143. [Google Scholar] [CrossRef]
  36. Safarzadeh, S.; Rasti-Barzoki, M. A game theoretic approach for pricing policies in a duopolistic supply chain considering energy productivity, industrial rebound effect, and government policies. Energy 2019, 167, 92–105. [Google Scholar] [CrossRef]
  37. Zhang, S.Y.; Wang, C.X.; Yu, C.; Ren, Y.J. Governmental cap regulation and manufacturer’s low carbon strategy in a supply chain with different power structures. Comput. Ind. Eng. 2019, 134, 27–36. [Google Scholar] [CrossRef]
  38. Li, F.J.; Dong, S.C.; Li, Z.H. The improvement of CO2 emission reduction policies based on system dynamics method in traditional industrial region with large CO2 emission. Energy Policy 2012, 51, 683–695. [Google Scholar] [CrossRef]
  39. Yang, J.; Li, J.B.; Lu, W. The impact of emission policies on supply chain base on system dynamics. Ind. Eng. Manag. 2012, 17, 21–30. [Google Scholar]
  40. Tian, Y.; Govindan, K.; Zhu, Q. A system dynamics model based on evolutionary game theory for green supply chain management diffusion among Chinese manufacturers. J. Clean. Prod. 2014, 80, 96–105. [Google Scholar] [CrossRef]
  41. Gupta, V.; Narayanamurthy, G.; Acharya, P. Can lean lead to green? Assessment of radial tyre manufacturing processes using system dynamics modelling. Comput. Oper. Res. 2018, 89, 284–306. [Google Scholar] [CrossRef]
  42. Zhou, X.Y.; Xu, Z.R.; Xi, Y.Q. The system dynamic model and policy optimized simulation of energy conservation and emission reduction in China. Syst. Eng. Theory Pract. 2018, 38, 1422–1444. [Google Scholar]
  43. Tong, W.; Mu, D.; Zhao, F.; Mendis, G.P.; Sutherland, J.W. The impact of cap-and-trade mechanism and consumers’ environmental preferences on a retailer-led supply Chain. Resour. Conserv. Recycl. 2019, 142, 88–100. [Google Scholar] [CrossRef]
  44. Chen, C. Design for the environment: A quality-based model for green product development. Manag. Sci. 2001, 47, 250–263. [Google Scholar] [CrossRef]
  45. Atasu, A.; Guido, V.; Wassenhove, L.N.V. Product reuse economics in closed-loop supply chain research. Prod. Oper. Manag. 2008, 17, 483–496. [Google Scholar] [CrossRef]
  46. Giudice, F.; Rosa, G.; Risitano, A. Product Design for the Environment a Life Cycle Approach; BAS 01; CRC/Taylor & Francis: Boca Raton, FL, USA, 2006. [Google Scholar]
  47. Gu, W.J.; Chhajed, D.; Petruzzi, N.C.; Yalabik, B. Quality design and environmental implications of green consumerism in remanufacturing. Int. J. Prod. Econ. 2015, 162, 55–69. [Google Scholar] [CrossRef] [Green Version]
  48. Friedman, D. Evolutionary games in economics. Economyetrica 1991, 59, 637. [Google Scholar] [CrossRef] [Green Version]
  49. Barron, E.N. Game Theory: An Introduction, 2nd ed.; John Wiley & Sons: Loyola University Chicago, Chicago, IL, USA, 2013. [Google Scholar]
  50. Gao, Y.H.; Chen, D.M.; Tan, Z.X. Subsidy policy optimization and exit, and tax regulation for disposal of waste electric and electronic products. J. Syst. Manag. 2016, 25, 725–732. [Google Scholar]
  51. Cao, J.; Lu, B.; Chen, Y.Y.; Zhang, X.M.; Zhai, G.S.; Zhou, G.G.; Jiang, B.X.; Schnoor, J.L. Extended producer responsibility system in China improves e-waste recycling: Government policies, enterprise, and public awareness. Renew. Sustain. Energy Rev. 2016, 62, 882–894. [Google Scholar] [CrossRef]
  52. Lyeonov, S.; Pimonenko, T.; Bilan, Y.; Ŝtreimikienė, D.; Mentel, G. Assessment of green investments’ impact on sustainable development: Linking gross domestic product per capita, greenhouse gas emissions and renewable energy. Energies 2019, 12, 3891. [Google Scholar] [CrossRef] [Green Version]
  53. Cao, J.; Chen, X.H.; Zhang, X.M.; Gao, Y.C.; Zhang, X.P.; Kumar, S. Overview of remanufacturing industry in China: Government policies, enterprise, and public awareness. J. Clean. Prod. 2020, 242, 118450. [Google Scholar] [CrossRef]
Figure 1. Evolutionary path of suppliers’ strategy.
Energies 13 00620 g001
Figure 2. Evolutionary path of manufacturers’ strategy.
Energies 13 00620 g002
Figure 3. Evolutionary path of governments’ strategy.
Energies 13 00620 g003
Figure 4. SD model of evolutionary game among suppliers, manufacturers and governments.
Energies 13 00620 g004
Figure 5. Evolutionary game process of one population’s mutation when initial state is pure strategies.
Energies 13 00620 g005
Figure 6. Evolutionary game process of one population’s mutation when initial state is mixed strategies.
Energies 13 00620 g006
Figure 7. Effect of initial probability on the evolution process of suppliers, manufacturers and governments.
Energies 13 00620 g007aEnergies 13 00620 g007b
Figure 8. Effect of reward and punishment regulation on strategies of suppliers and manufacturers.
Energies 13 00620 g008
Table 1. Parameters and variables.
NotationsDescriptions
Parameter
c n The cost per unit for each non-green supplier
c g The greening cost per unit for each green supplier
w g The wholesale price of green materials
w n The wholesale price of non-green materials
c g g Each green manufacturer’s production cost per unit with green materials
c n g Each green manufacturer’s production cost per unit with non-green materials
c g n Each non-green manufacturer’s production cost per unit with green materials
c n n Each non-green manufacturer’s production cost per unit with no-green materials
p g g The final price under green suppliers and green manufacturers
p n g The final price under non-green suppliers and green manufacturers
p g n The final price under green suppliers and non-green manufacturers
p n n The final price under non-green suppliers and non-green manufacturers
r S Each supplier’s corporate reputation by adopting green strategy
r M Each manufacturer’s corporate reputation by adopting green strategy
i S Government subsidy to green suppliers for per unit of products
i M Government subsidy to green manufacturers for per unit of products
f S Government punishment to non-green suppliers for per unit of products
f M Government punishment to non-green manufacturers for per unit of products
c G e Government regulatory cost on per unit of products
c G d Pollution treatment cost on per unit product
φ The social benefit when both suppliers and manufacturers adopt green behaviors
Variables
xThe probability that the suppliers adopt green behavior
yThe probability that the manufacturers adopt green behavior
zThe probability that governments implement the regulation
Table 2. Payoff matrix without government supervision.
When the Government does not Supervise the Supply Chain
Manufacturers
Adopt Green BehaviorAdopt Non-Green Behavior
SuppliersManufacturersGovernmentsSuppliersManufacturersGovernments
SuppliersAdopt green behavior w g c g + r S p g g w g c g g + r M φ w g c g + r S p g n w g c g n φ / 2 c G d
Adopt non-green behavior w n c n p n g w n c n g + r M φ / 2 c G d w n c n p n n w n c n n 2 c G d
Table 3. Payoff matrix with government supervision.
When the Government Supervises the Supply Chain
Manufacturers
Adopt Green BehaviorAdopt Non-Green Behavior
SuppliersManufacturersGovernmentsSuppliersManufacturersGovernments
SuppliersAdopt green behavior w g c g + r S + i S p g g w g c g g + r M + i M φ i M i S c G e w g c g + r S + i S p g n w g c g n f M φ / 2 i S c G e + f M c G d
Adopt non-green behavior w n c n f S p n g w n c n g + r M + i M φ / 2 i M c G e + f S c G d w n c n f S p n n w n c n n f M f S + f M c G e 2 c G d
Table 4. The det J and tr J of eight strategies.
Strategydet Jtr J
E 1 ( 0 , 0 , 0 ) ( Δ w Δ c + r S ) ( Δ p 2 Δ c 2 + r M ) ( f M + f S c G e ) Δ w Δ c + r S + Δ p 2 Δ c 2 + r M + f M + f S c G e
E 2 ( 0 , 0 , 1 ) ( Δ w Δ c + r S + i S + f S ) ( Δ p 2 Δ c 2 + r M + i M + f M ) ( c G e f M f S ) Δ w Δ c + r S + i S + Δ p 2 Δ c 2 + r M + i M + c G e
E 3 ( 0 , 1 , 0 ) ( Δ w Δ c + r S ) ( Δ c 2 Δ p 2 r M ) ( f S c G e i M ) Δ w Δ c + r S + Δ c 2 Δ p 2 r M + f S c G e i M
E 4 ( 0 , 1 , 1 ) ( Δ w Δ c s + r S + i S + f S ) ( Δ c 2 Δ p 2 r M i M f M ) ( c G e + i M f S ) Δ w Δ c + r S + i S + Δ c 2 Δ p 2 r M f M + c G e
E 5 ( 1 , 0 , 0 ) ( Δ c Δ w r S ) ( Δ p 2 Δ c 1 + r M ) ( f M i S c G e ) Δ c Δ w r S + Δ p 2 Δ c 1 + r M + f M i S c G e
E 6 ( 1 , 0 , 1 ) ( Δ c Δ w r S i S f S ) ( Δ p 1 Δ c 1 + r M + i M + f M ) ( i S + c G e f M ) Δ c Δ w r S f S + Δ p 1 Δ c 1 + r M + i M + c G e
E 7 ( 1 , 1 , 0 ) ( Δ c Δ w r S ) ( Δ c 1 Δ p 1 r M ) ( i S c G e i M ) Δ c Δ w r S + Δ c 1 Δ p 1 r M i S c G e i M
E 8 ( 1 , 1 , 1 ) ( Δ c Δ w r S i S f S ) ( Δ c 1 Δ p 1 r M i M f M ) ( i S + c G e + i M ) Δ c Δ w r S f S + Δ c 1 Δ p 1 r M f M + c G e

