Article

Experimental Investigation on the Post-Peak Short-Term and Creep Behavior of Fractured Sandstone

1
School of Transportation Engineering, Jiangsu Vocational Institute of Architectural Technology, Xuzhou 221116, China
2
State Key Laboratory for Geomechanics and Deep Underground Engineering, China University of Mining and Technology, Xuzhou 221116, China
3
Faculty of Engineering, University of Nottingham, Nottingham NG7 2RD, UK
4
Institute of Mining Engineering, Guizhou Institute of Technology, Guiyang 550003, China
*
Author to whom correspondence should be addressed.
Energies 2020, 13(3), 598; https://doi.org/10.3390/en13030598
Submission received: 27 December 2019 / Revised: 22 January 2020 / Accepted: 24 January 2020 / Published: 29 January 2020

Abstract

:
Short-term and creep tests of fractured sandstone with different degrees of damage prepared using pre-peak and post-peak unloading tests on intact sandstone were carried out using a servo-controlled rock mechanics system. Based on our experimental results, the influence of confining pressure and damage on short-term mechanical behavior of fractured sandstone with different degrees of damage was first analyzed. The results show that the peak strength, residual strength, elastic modulus, and secant modulus of fractured sandstone increase linearly with increasing confining pressure, but decrease with increasing damage. The short-term failure modes depend on the damage and change from typical shear failure modes to multiple shear failure modes with increasing damage. Then, the influence of the differential stress, confining pressure, and the degree of damage on the creep mechanical behavior of fractured specimens was further investigated. The axial instantaneous strain and creep strain increase linearly with increasing differential stress, and the specimens exhibit significant time-dependent behavior under high stress. The steady creep rate increases with increasing stress, but it decreases with increasing confining pressure and damage. However, the long-term strength and creep failure strength of fractured specimens increase linearly with increasing confining pressure, but they decrease linearly with increasing damage. The creep failure modes of fractured specimens are also the main shear failure modes, which are similar to the short-term failure modes.

Graphical Abstract

1. Introduction

With the increasing demand for mineral resources and continuous consumption of shallow resources, a large number of mines are gradually turning to deep mining [1]. In China, more than 53% of the total coal resources lie at depths of 1000 m or deeper [2]. In deep coal mines, the surrounding rocks under high ground stress and mining disturbance undergo the process of elastic-plastic deformation to fracture and re-fracture. The rocks are mainly the post-peak fractured rocks, which have a certain residual-bearing capacity [3,4]. Fractured rocks under high ground stress present significant time-dependent behavior, resulting in continuous rheological deformation and failure of the surrounding rocks [5]. However, the mechanical behavior of fractured rocks is complex and difficult to study using classical strength theory [6,7]. Therefore, research on the post-peak short-term and creep mechanical behavior of fractured rocks is of great theoretical and engineering significance for the design, construction, and long-term stability of deep underground engineering [8].
Several laboratory experiments have been carried out to explore the post-peak behavior of damaged rocks or rock masses with joints [9,10]. Tiwari and Rao [11] conducted triaxial and true triaxial experiments on physical models to observe the post-failure behavior of rock masses under different confining pressure. They proposed a zoning table to assess the strain hardening, softening, and plastic behavior of the specimens depending on the joint geometry and confining pressure. Yang et al. [12,13] carried out a series of triaxial compression experiments on samples with fractures to investigate the influence of fracture geometry and confining pressure on the strength and deformation properties. They discovered a nonlinear increase in the peak strength and Young’s modulus with increasing confining pressure. Niu et al. [14] presented an experimental study on the strength degradation laws of damaged rocks and determined that the peak strength, cohesion, and internal friction angle decrease with increasing damage. However, few experimental studies have investigated the post-peak behavior of fractured rocks with different degrees of damage.
Extensive laboratory investigations have been conducted to investigate the creep mechanical behavior of intact rocks or rock masses. These studies mainly focused on the pre-peak creep behavior of the rocks under uniaxial [15,16] and triaxial compression [17,18], but only a few studies have been reported regarding the post-peak creep mechanical behavior of fractured rocks under triaxial compression. Bieniawski [19] conducted a series of creep tests on fine-grained sandstone after strength failure to investigate the time-dependent behavior of fractured sandstone. His results indicate that the resistance and deformation of fractured rock are time-dependent, and the creep failure time of fractured rock increases exponentially with confining pressure. Guo et al. [20] conducted an experimental study on the creep mechanical behavior of fractured sandstone from Yongchuan mine. They found that the creep deformation of fractured sandstone can be divided into three stages, a primary creep stage, a steady-rate creep stage, and an attenuated creep stage, which can be described by the modified Nishihara model. Hamza and Stace [21] compared the time-dependent behavior of intact and fractured muddy siltstone and found that the creep deformation of fractured rock was largely influenced by the fractures shape and fragmentation degree compared to intact rock. Niu et al. [22] analyzed the influence of damage on the creep properties of fractured sandstone under uniaxial compression. They reported a linear increase in the instantaneous strain and an exponential increase in the creep strain with increasing stress.
However, few experimental studies have investigated the post-peak creep mechanical behavior of fractured rocks with different degrees of damage. Therefore, in this study, we carried out a series of triaxial compression and creep experiments on fractured sandstone with different degrees of damage prepared using pre-peak and post-peak unloading experiments on intact sandstone under triaxial compression. Based on our experimental results, the effects of the confining pressure and damage on the short-term strength, deformation, and failure modes of fractured sandstone with different degrees of damage were investigated. The influence of the differential stress, confining pressure, and damage on the creep strain, creep strain rate, long-term strength, and creep failure modes of fractured specimens with different degrees of damage were investigated in detail. The results of this study are of great theoretical and engineering significance to the design, construction, and long-term stability of underground engineering.

2. Experimental Materials and Methods
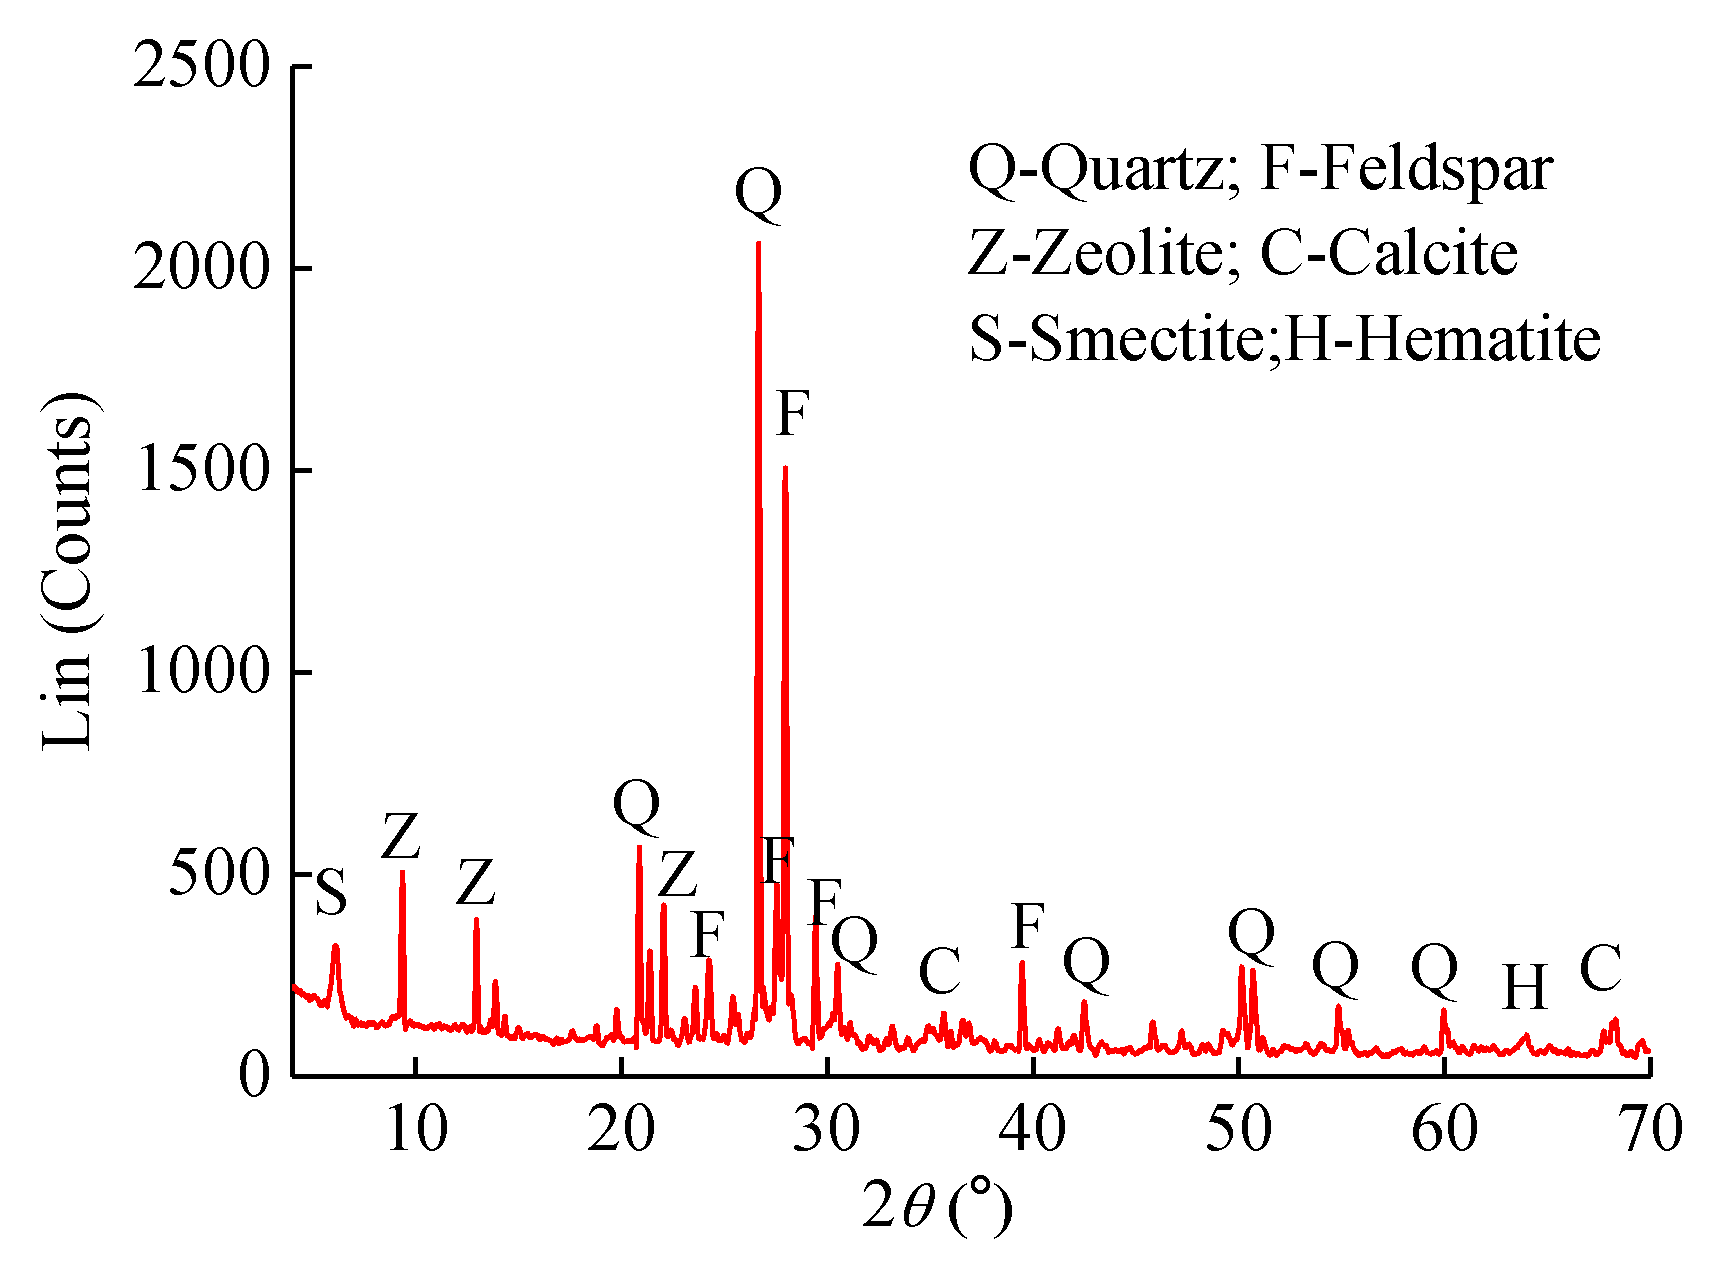
2.1. Red Sandstone

To investigate the post-peak mechanical behavior of fractured rock, red sandstone from Linyi in Shandong Province, China, was chosen as the experimental material for this research [8,23]. The red sandstone we used is a fine-grained homogeneous material with a bulk density of 2435 kg/m3. According to X-ray diffraction (Figure 1), the minerals in the red sandstone specimens are mainly quartz and feldspar, with some zeolite, calcite and smectite, and very minor quantities of hematite [24]. All of the test specimens were cylindrical, i.e., 50 mm in diameter and 100 mm in length. The specimens were soaked in distilled water for more than 72 h to ensure that they were fully saturated, which can reduce the post-peak brittleness of sandstone and guarantee post-peak unloading effects [25,26].

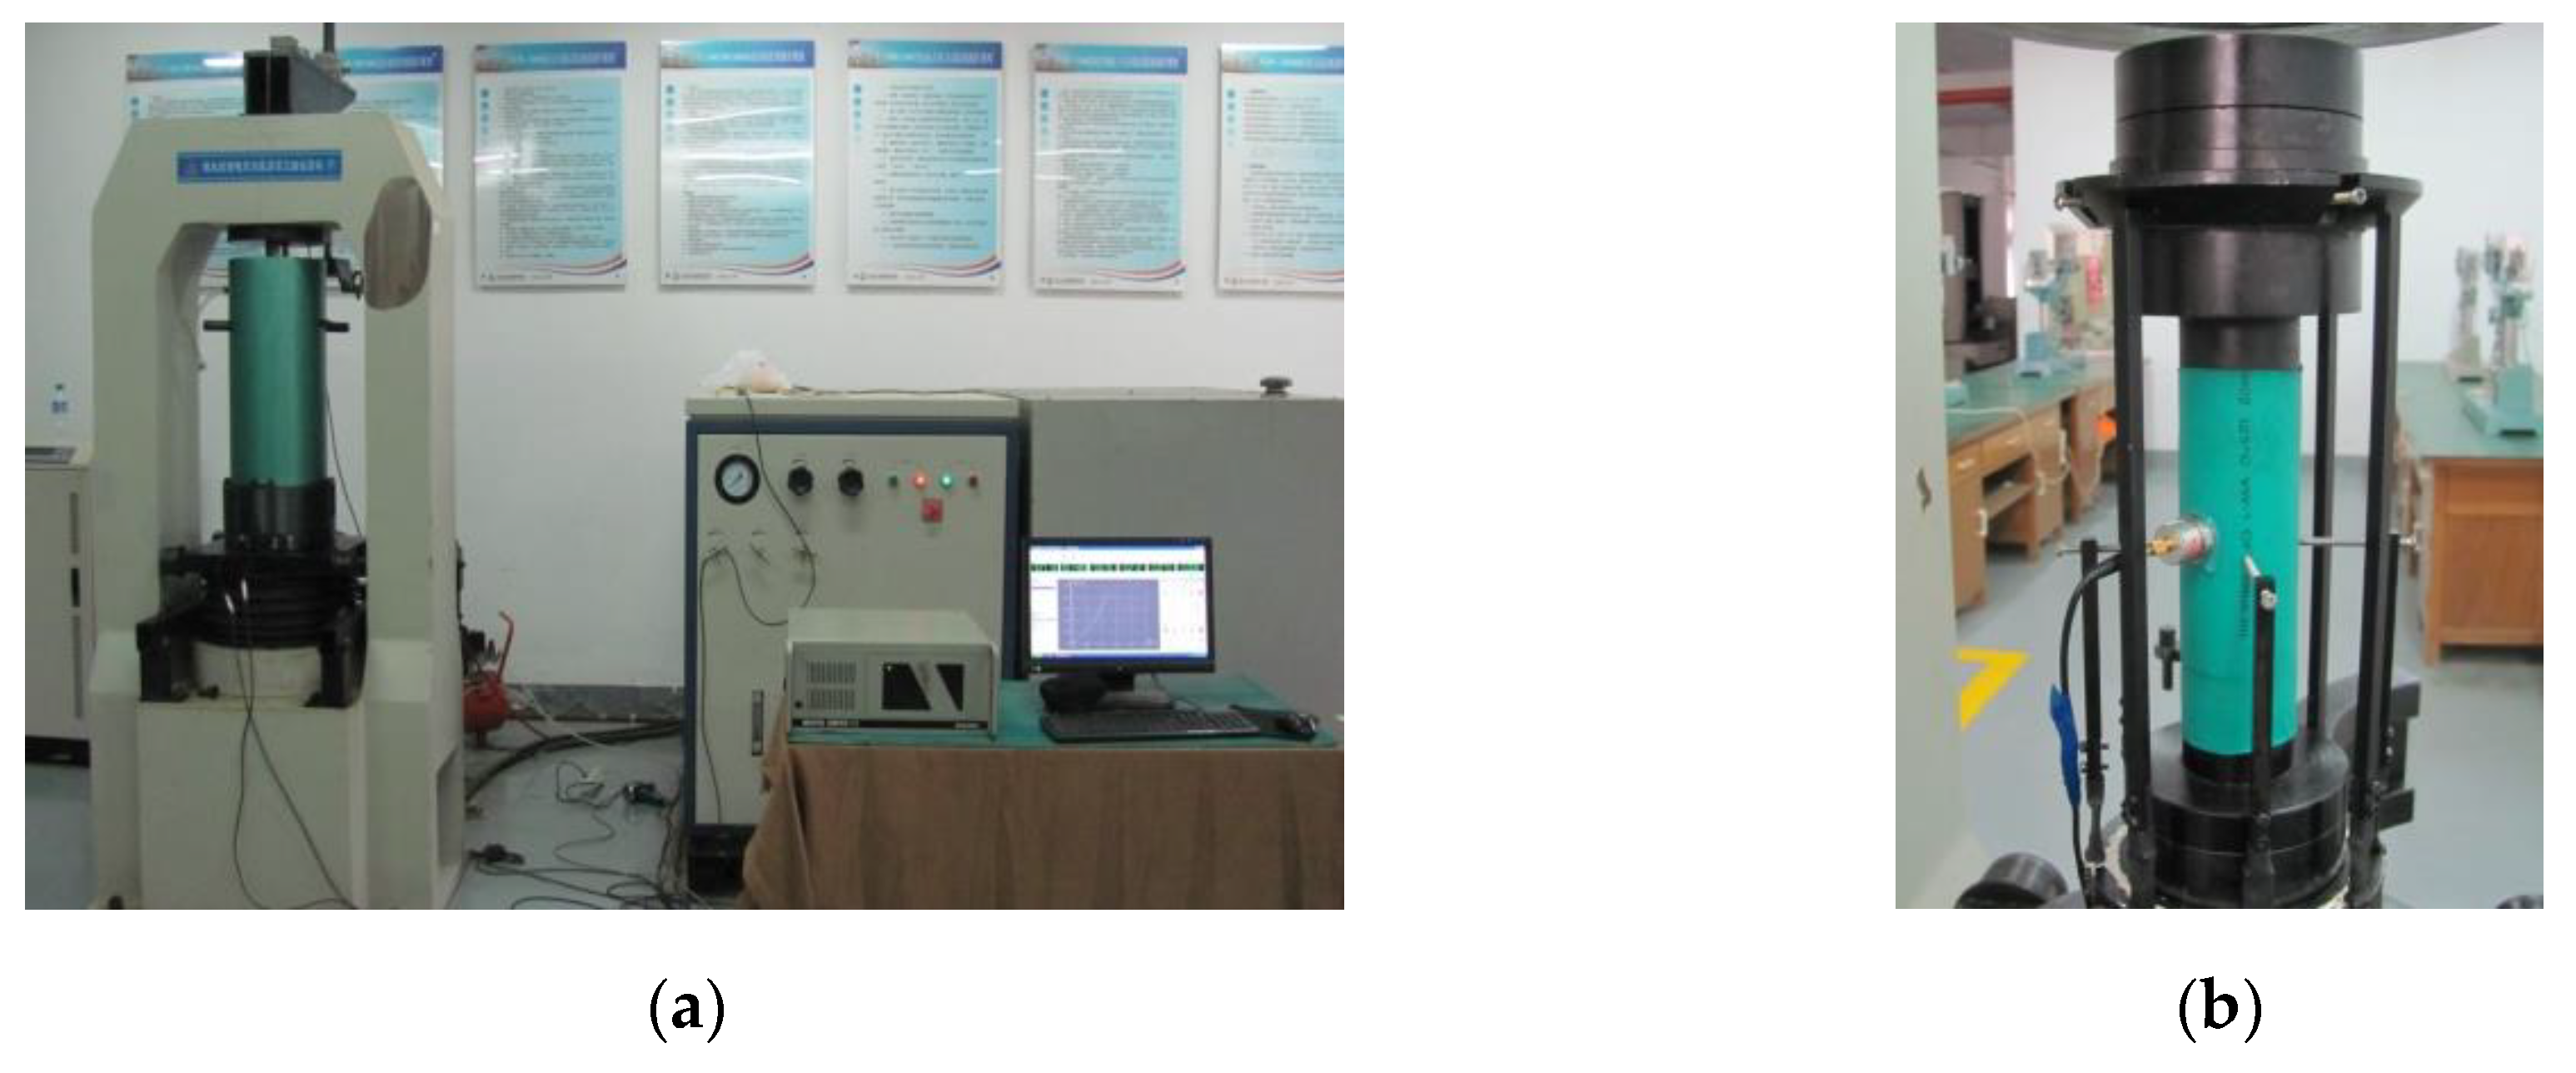
2.2. Experimental Equipment

All of the triaxial compression and creep tests on the sandstone specimens were carried out on a TAW-2000 servo-controlled rock mechanics system with a maximum loading capacity of 2000 kN and confining pressure of 60 MPa [27,28]. During the tests, the axial and radial deformations were measured with axial and radial extensometers with a range of 10 mm and 5 mm, respectively (Figure 2).

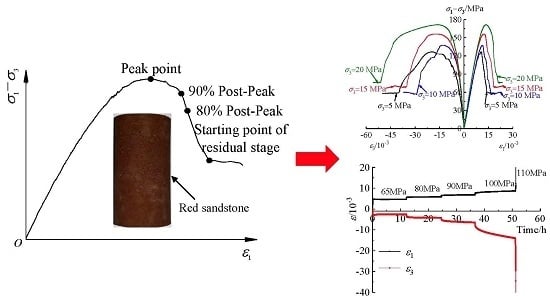
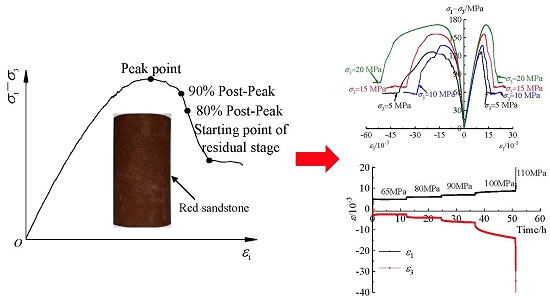
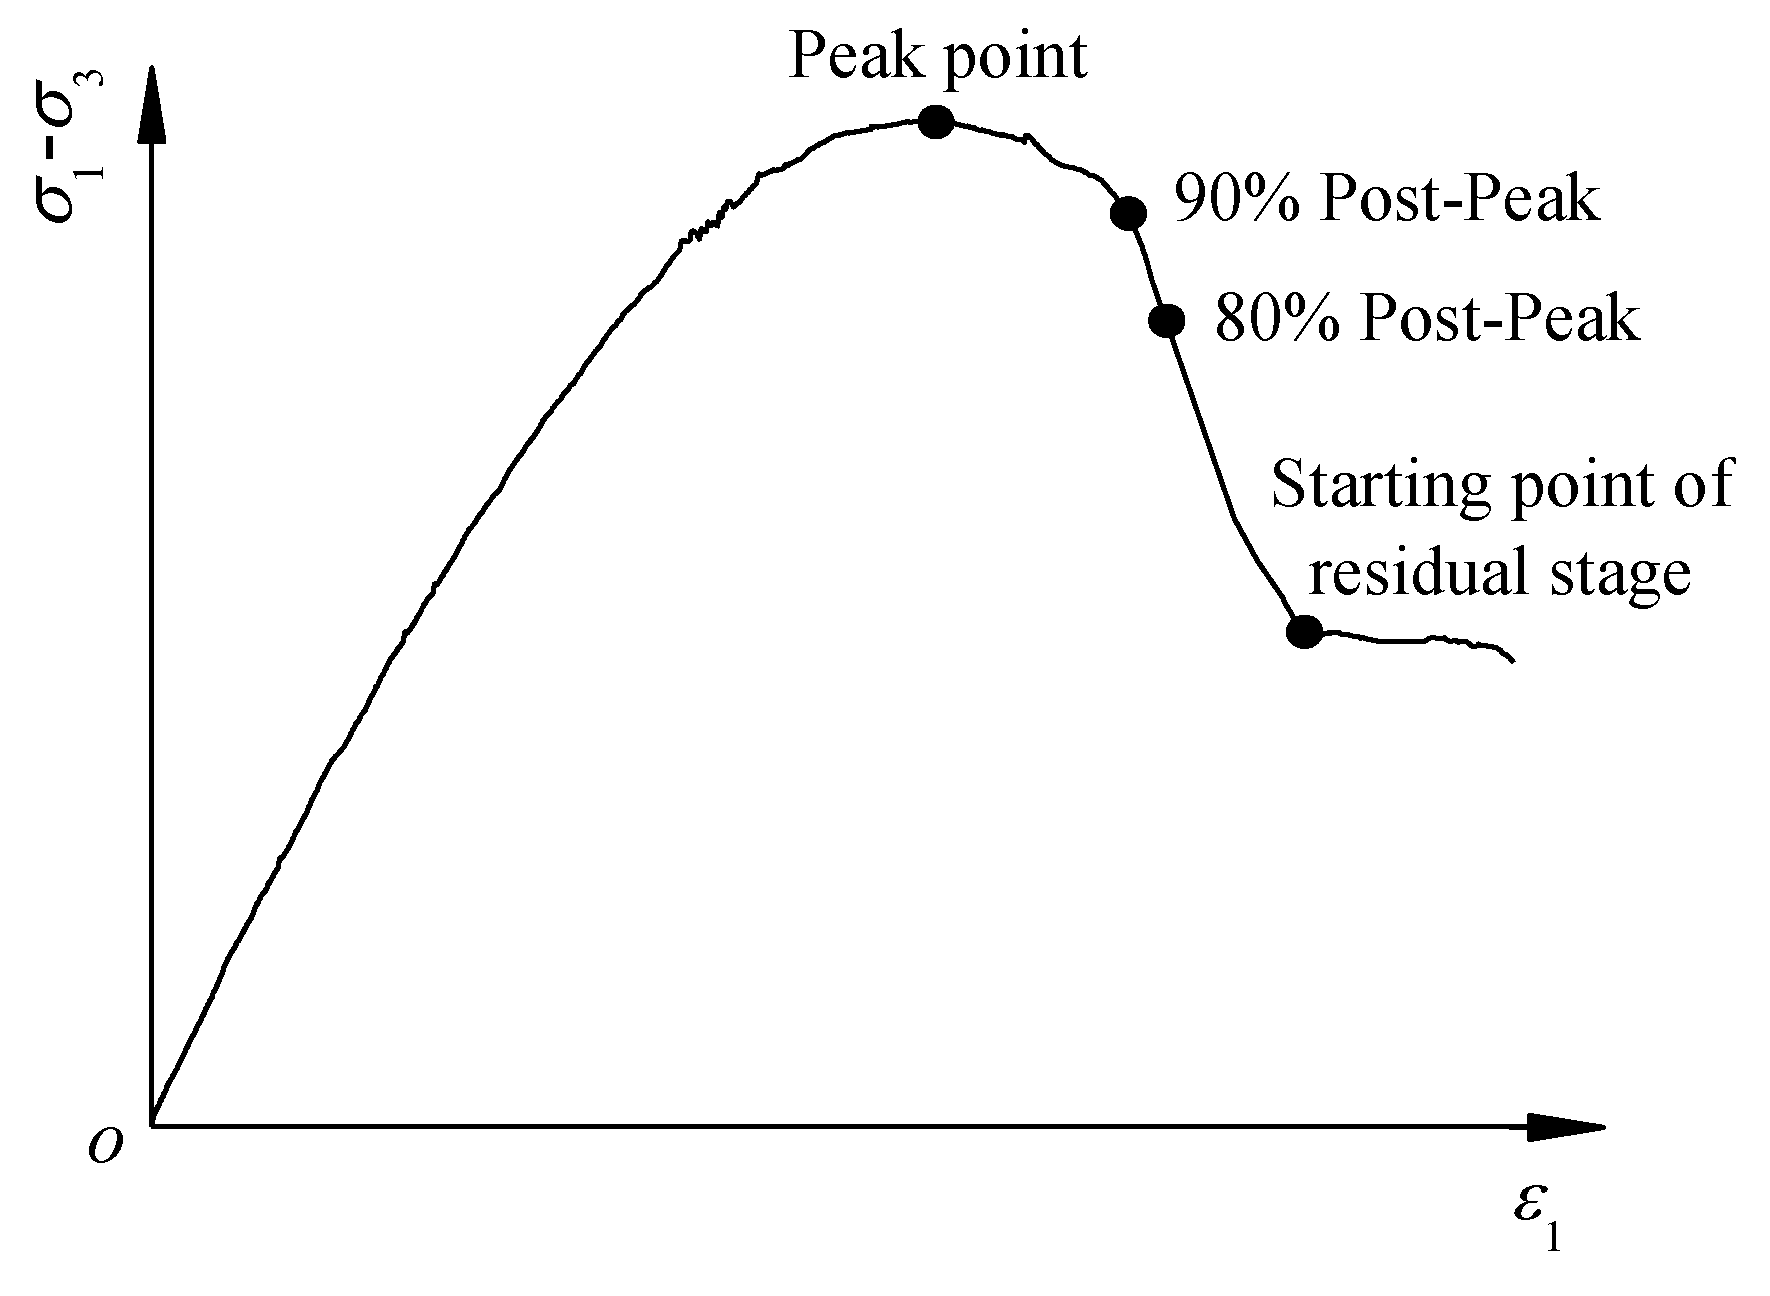
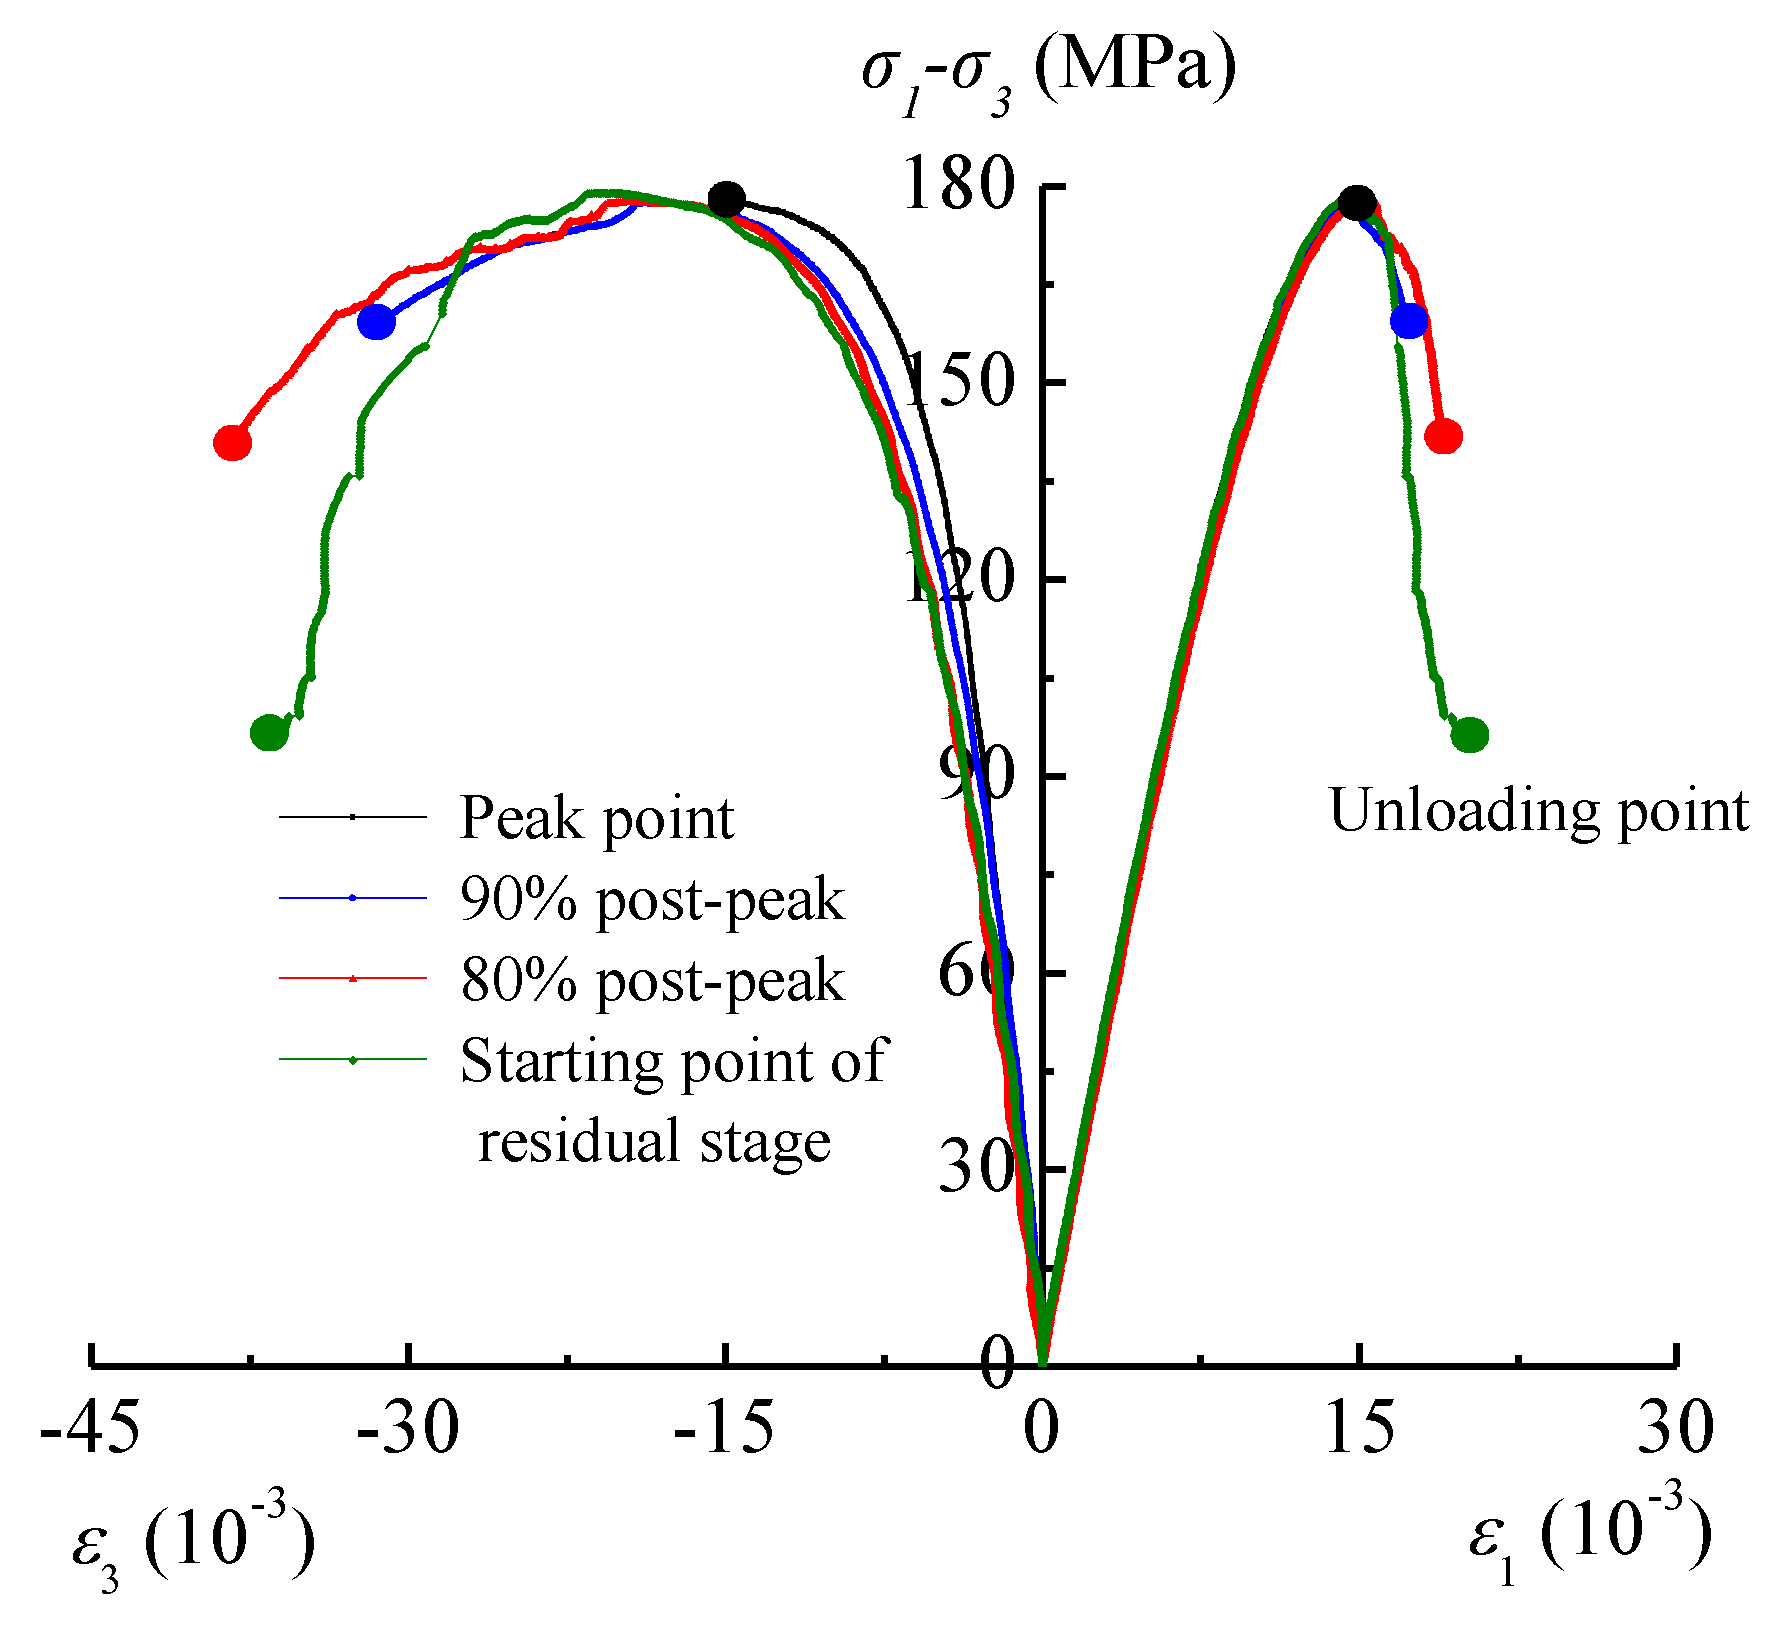
2.3. Fractured Specimen Preparation

Fractured sandstone specimens with different degrees of damage were prepared using pre-peak and post-peak unloading tests on intact sandstone under triaxial compression [14,22]. The preparation of fractured specimens consisted of the following loading and unloading steps. First, the confining pressure was applied to the specimens at a constant rate of 0.05 MPa/s until the design value of 30 MPa was reached, ensuring that the specimen was under uniform hydrostatic stress. Second, the axial stress was applied to the specimen at a constant axial displacement rate of 0.002 mm/s until the desired unloading points under the confining pressure of 30 MPa. Then, the axial stress and confining pressure were alternately unloaded to zero to obtain fractured specimens with different degrees of damage. The desired unloading points were set as the peak point, post-peak 90% and 80% peak strengths, and the starting point of the residual stage (Figure 3). The stress-strain curves during the preparation of fractured specimens are presented in Figure 4, and the mechanical parameters of the specimens at the unloading points are reported in Table 1. In Figure 3 and Figure 4, σ1 and σ3 are the axial stress and confining pressure, ε1 and ε3 are the axial strain and radial strain, respectively.
From Figure 4 and Table 1, it can be seen that the stress-strain curves of the specimens at different unloading points are very similar. The peak strength of the specimens is 175.02–181.05 MPa, and the standard deviation is only 1.10 MPa. The deviation of the ratio of the actual designed stress at the unloading points to the peak strength is only −0.46% to 2.20%. Therefore, unloading tests can be carried out at the design unloading points to obtain fractured specimens with a certain degree of damage, which can produce fractured specimens required for the creep tests [28].
To quantify the damage (D) of fractured specimens, we defined the volumetric dilatation strain ratio between the points in the complete stress-strain curves and the starting points in the residual stage of the specimens under a confining pressure of 30 MPa to calculate D, which can be expressed by the following equation [28,29]:
{ D = 0 ε 1 ε 1 d D = K ( ε v ε v d ) ε v r ε v d ε 1 > ε 1 d
where εv, εvd, and εvr are the volumetric strain, the maximum compressive volumetric strain, and the volumetric strain of the starting points of the residual stage, respectively; ε1 is the axial strain; ε1d is the axial strain of the corresponding point for the maximum compressive volumetric strain; and K is a correction factor, which can be calculated by Equation (2) [28,29]:
K = 1 σ r / σ p
where σr and σp are the residual strength and the peak strength of the specimen under a confining pressure of 30 MPa, respectively [28,29]. By substituting the mechanical parameters of the specimens listed in Table 1 into Equations (1) and (2), the damage of fractured specimens can be determined. The results are listed in Table 1.

2.4. Experimental Procedures

The short-term triaxial compression tests of fractured specimens were carried out under confining pressures of 5, 10, and 20 MPa. The short-term experimental procedure conducted on fractured specimens is as follows. The axial stress and confining pressure were gradually applied to fractured specimens at a constant rate of 0.05 MPa/s until the desired confining pressure was reached to ensure that the specimens were under uniform hydrostatic stress. According to the test methods suggested by the International Society for Rock Mechanics (ISRM) [30], the axial stress was loaded on fractured specimens at a constant axial displacement rate of 0.002 mm/s until failure occurred [28,29].
The multi-stage creep test procedure consisted of the following steps [31]. First, the axial stress and confining pressure were gradually applied to fractured specimens at a constant rate of 0.05 MPa/s until the desired confining pressure was reached to ensure that the specimens were under a uniform hydrostatic stress. Then, the axial stress was increased to the first stress level at a constant rate of 0.2 MPa/s while the stress and deformation of fractured specimens were recorded. After this, the axial stress and confining pressure were maintained for no less than 12 h until the creep deformation increment was less than 0.001 mm/h. After the creep test at the first stress level, fractured specimens were tested at the successive stress levels until the final failure occurred [32].

3. Short-Term Strength and Deformation Failure Behavior

In order to confirm the multi-stage stress levels of the triaxial creep tests, a series of short-term triaxial compression tests were conducted on fractured specimens before the creep tests [31]. The triaxial stress-strain curves of fractured sandstone specimens with different degrees of damage are presented in Figure 5, and the mechanical parameters for the different degrees of damage and confining pressures are reported in Table 2.

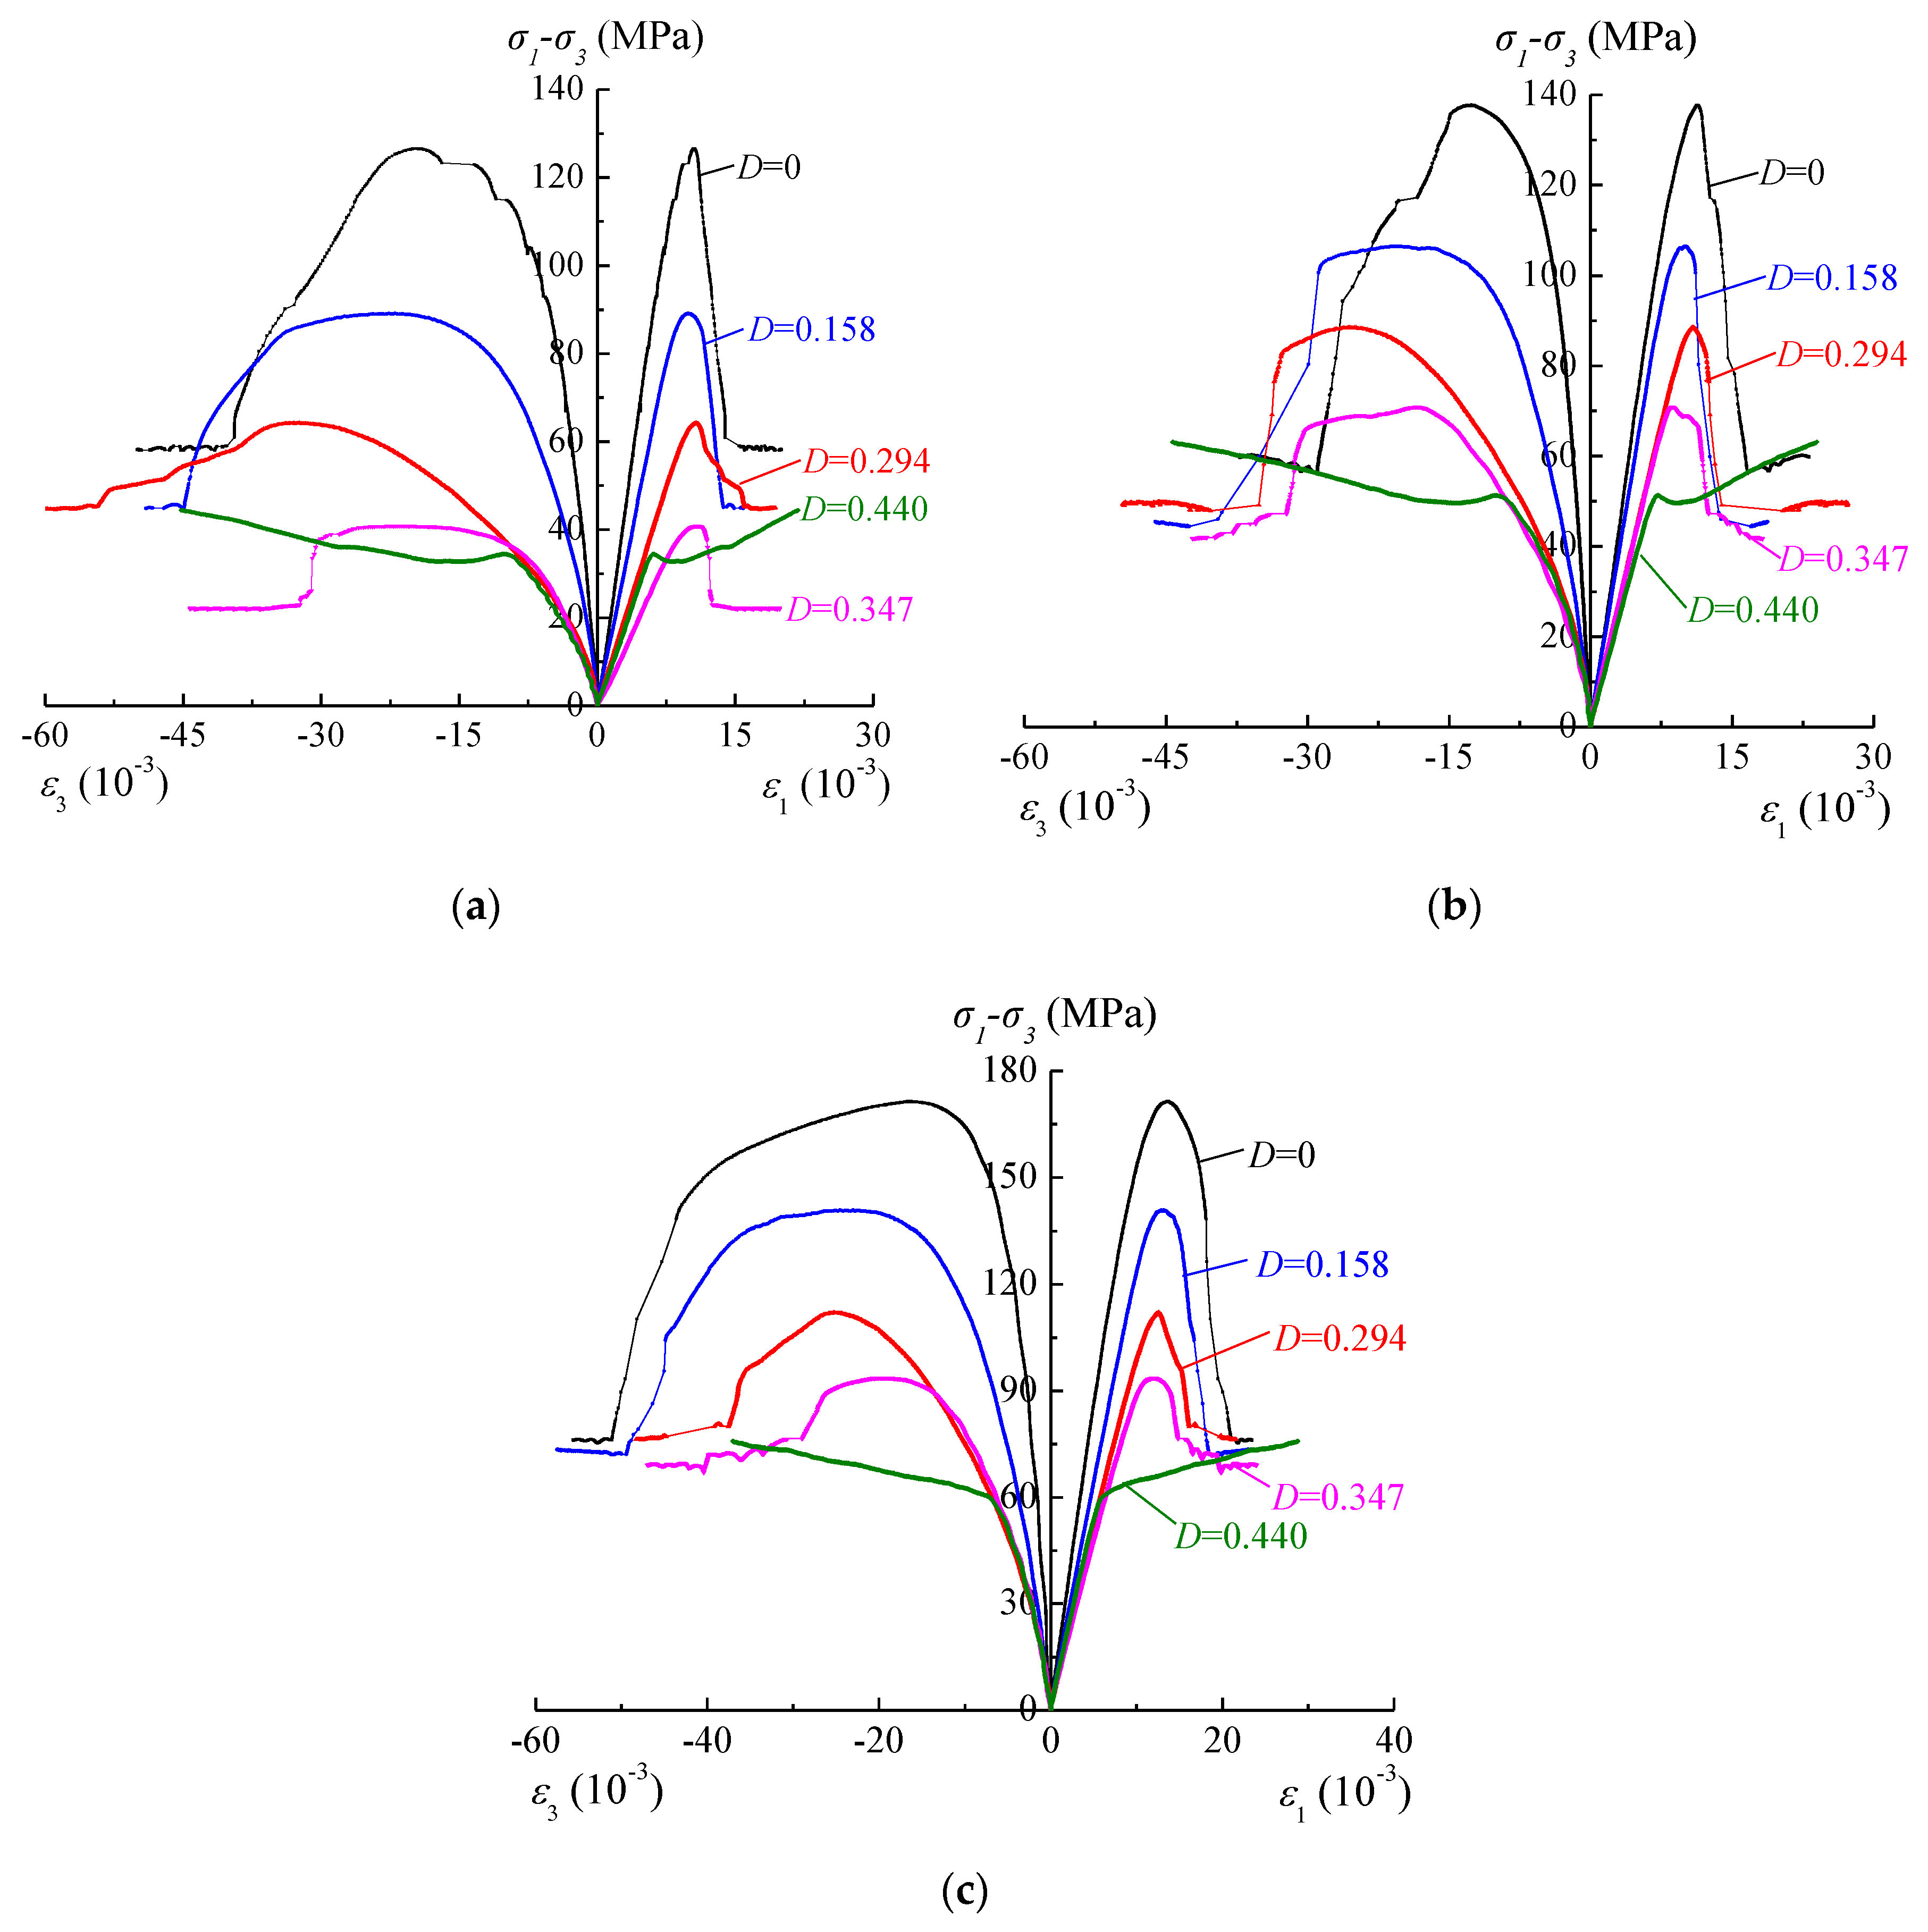
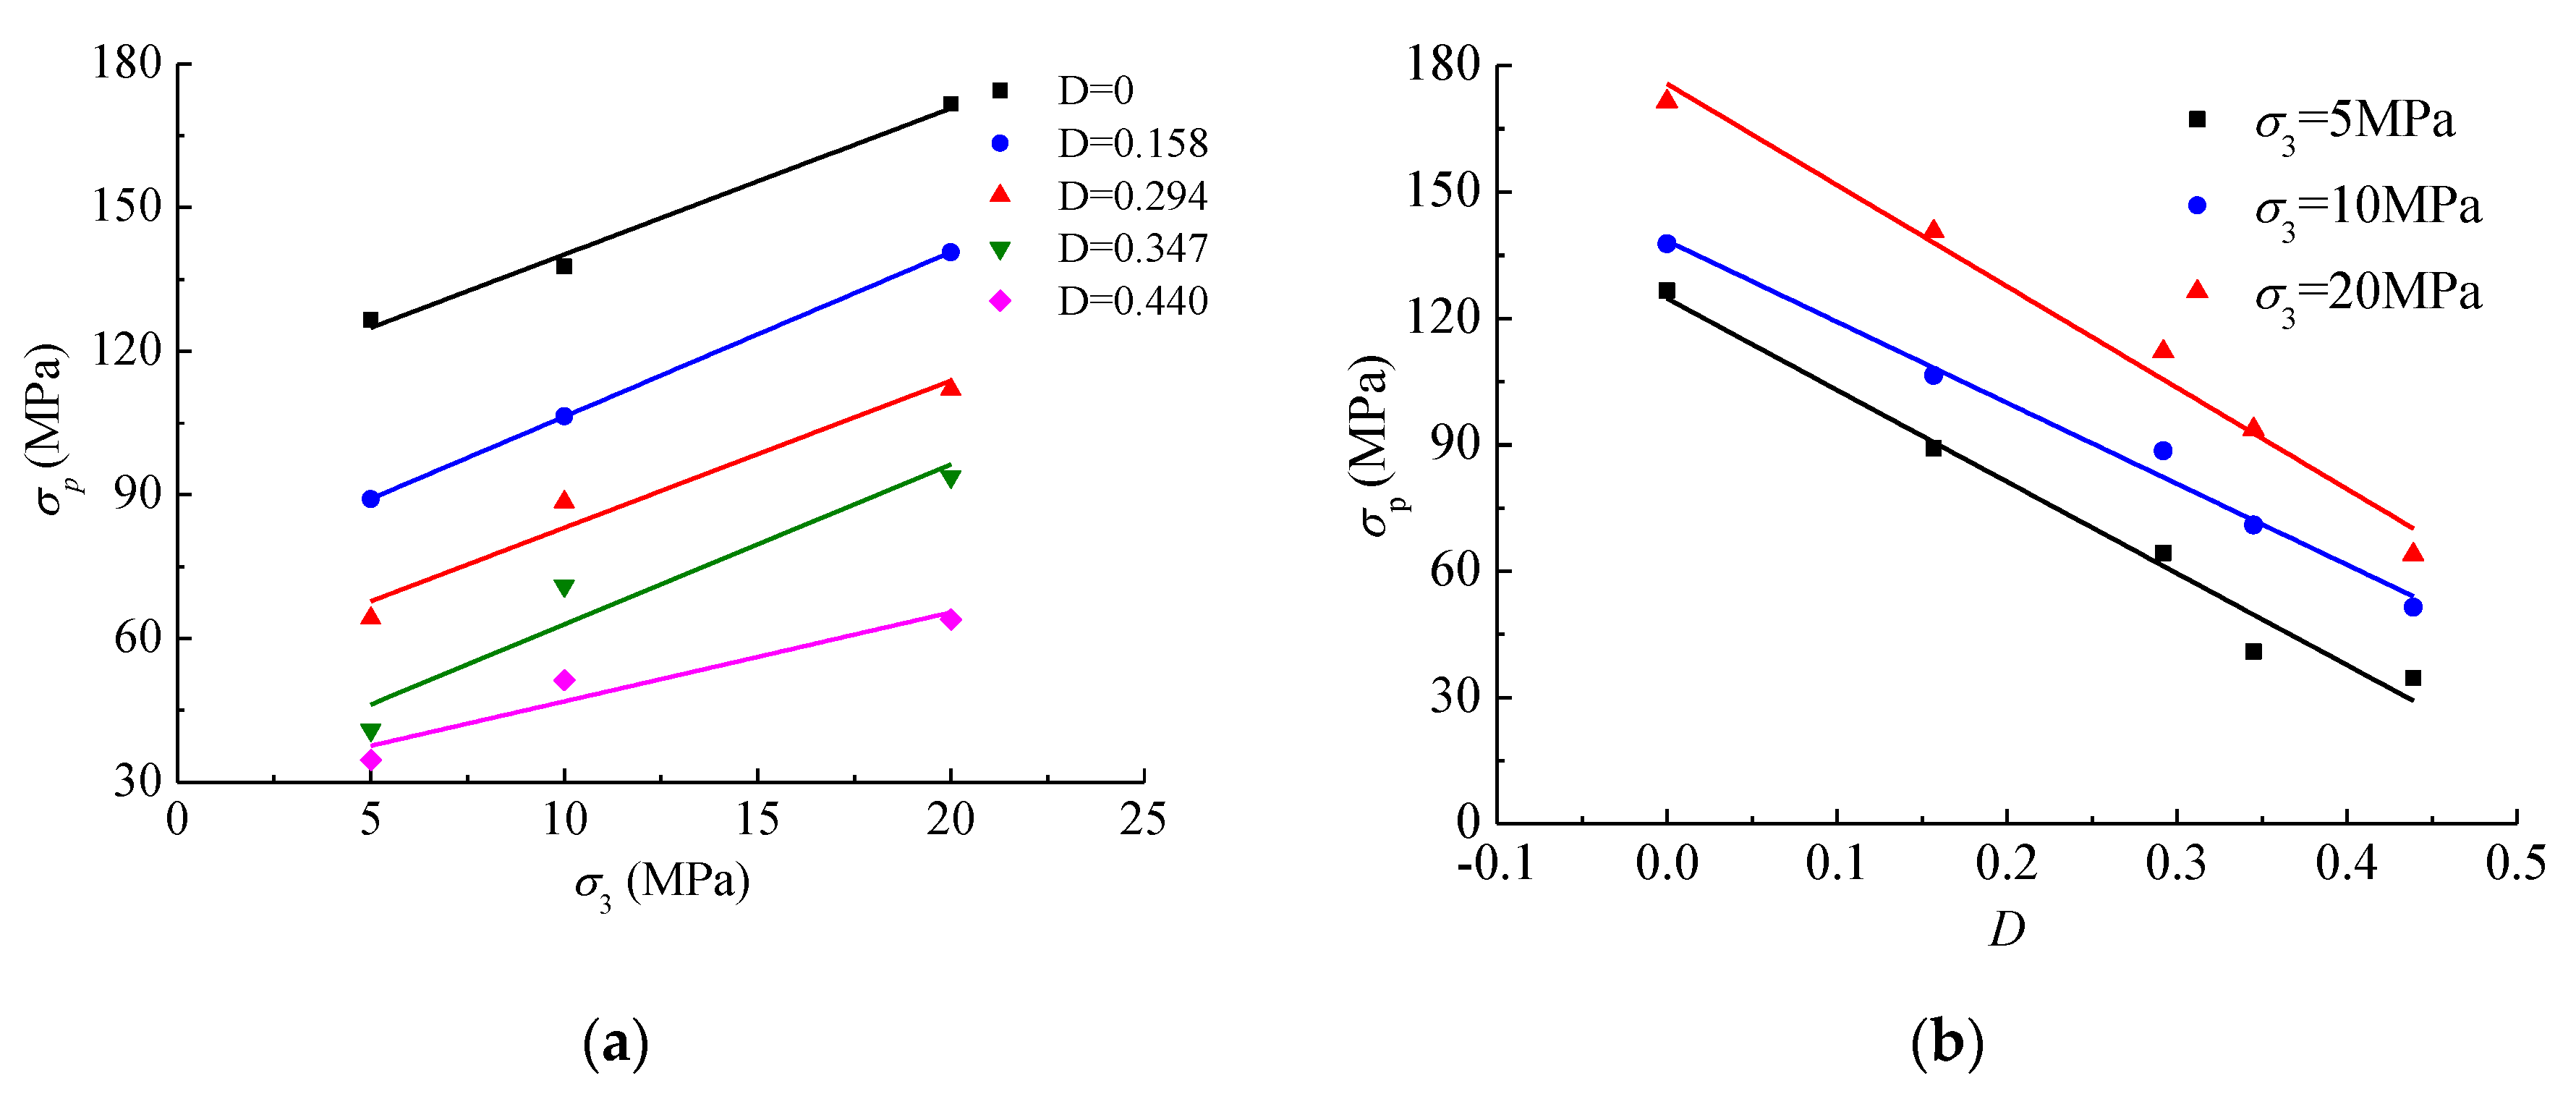
3.1. Short-Term Strength and Failure Behavior

From Figure 5 and the data listed in Table 2, it can be determined that the confining pressure (σ3) and damage (D) have significant effects on the peak strength (σp) and residual strength (σr) of fractured specimens. Figure 6 further illustrates the effect of confining pressure and damage on the peak strength of fractured specimens. From Figure 6, we can conclude that the peak strength of intact and fractured specimens under triaxial compression increase linearly with increasing confining pressure but decreases linearly with increasing damage [33,34].
Based on the peak strength values listed in Table 2, the equivalent cohesion (c) and internal friction angle (φ) can be calculated using the linear Mohr-Coulomb criterion [8,28], as listed in Table 3. From the data given in Table 3, it can be seen that the equivalent cohesion of fractured specimens decreases with increasing damage, as shown in Figure 7. The damage has little effect on the equivalent internal friction angle of fractured specimens at D < 0.440, and the range of the equivalent internal friction angle is only 0.60%−7.25%. When the damage reaches to 0.440, the irregular fractures of fractured specimens were gradually filled with small rocks and grains, and the sensitivity of the peak strength to confining pressure dropped quickly, resulting in a sharp drop of the equivalent internal friction angle, as listed in Table 3.
Based on the data given in Table 2, it can be seen that the residual strength of fractured specimens increases linearly with increasing confining pressure, and tends to a relatively stable value, which can be explained as follows. The confining pressure can effectively constrain the sliding and expansion of fractured specimens, resulting in the compression of fractured specimens. With increasing deformation and damage, the irregular fractures of fractured specimens are gradually filled with small rocks and grains, which can maintain the good structure and bearing capacity of fractured specimens, showing significant strain hardening behavior. The bearing capacity of fracture specimens after final failures under the same confining pressure is relatively consistent.
Figure 8 illustrates the failure modes of fractured specimens with different degrees of damage. From Figure 8, it can be seen that the damage significantly influences the failure modes of fractured specimens. For intact specimens, the micro-fractures firstly initiated along the mineral grain boundaries or through the grains, and the tensile stress and shear stress existed at the fracture tip. The tensile stress at the fracture tip was restricted by confining pressure in triaxial compression, so the shear fracture was mainly formed by the shear stress. The intact specimens all experienced typical shear failure modes with a single fracture, which did not depend on the confining pressure. But for fractured specimens, micro-fractures and shear fractures extended with increasing stress, which caused some secondary fractures to initiate and extend near the main shear fractures. With increasing damage, the failure modes of fractured specimens changed from single shear failures to multiple shear failures with two or more fractures. One main shear fracture penetrated fractured specimen to divide the specimen into two blocks, and one or more secondary fractures perpendicular to or oblique to the main fracture were also observed, resulting in multiple shear failures of fractured specimens.

3.2. Short-Term Deformation Behavior

Based on the triaxial stress-strain curves of fractured sandstone specimens with different degrees of damage shown in Figure 4, we conclude that the confining pressure and damage significantly influence the mechanical properties of fractured specimens. When D < 0.440, the triaxial stress-strain curves of the intact and fractured specimens can be divided into four stages: the elastic deformation stage, the yield deformation stage, the strain softening stage, and the residual strength stage. With increasing confining pressure, the deformation of fractured specimens changed from elastic-brittle to elastic-plastic, indicating obvious strain softening [35,36]. When the damage was increased to 0.440, the mechanical behaviors of fractured specimens converted from strain softening to strain hardening with increasing confining pressure. According to the data in Table 2, the elastic modulus and the secant modulus increase linearly with increasing confining pressure [28], but they decrease linearly with increasing damage (Figure 9). Furthermore, the sensitivity of the elastic modulus to damage decreases linearly with increasing confining pressure. The peak axial strain and the radial strain of fractured specimens depend on both the confining pressure and the damage. The peak axial strain of the intact and fractured specimens increases linearly with increasing confining pressure, whereas the peak radial and volumetric strains have a nonlinear relationship with the confining pressure.

4. Creep Mechanical Behavior of Intact and Fractured Sandstone

Triaxial multi-stage creep tests of fractured specimens were carried out under confining pressures of 5, 10, and 20 MPa. Table 4 lists the pre-confirmed stress levels of fractured specimens used in the triaxial creep tests. In Table 4, the stress levels were pre-confirmed in accordance with the short-term strength of fractured specimens.
From Table 4, it can be seen that the first stress level S1 was designed to be 48.6%–71.1% of the corresponding short-term peak strength (σp) [8,20].

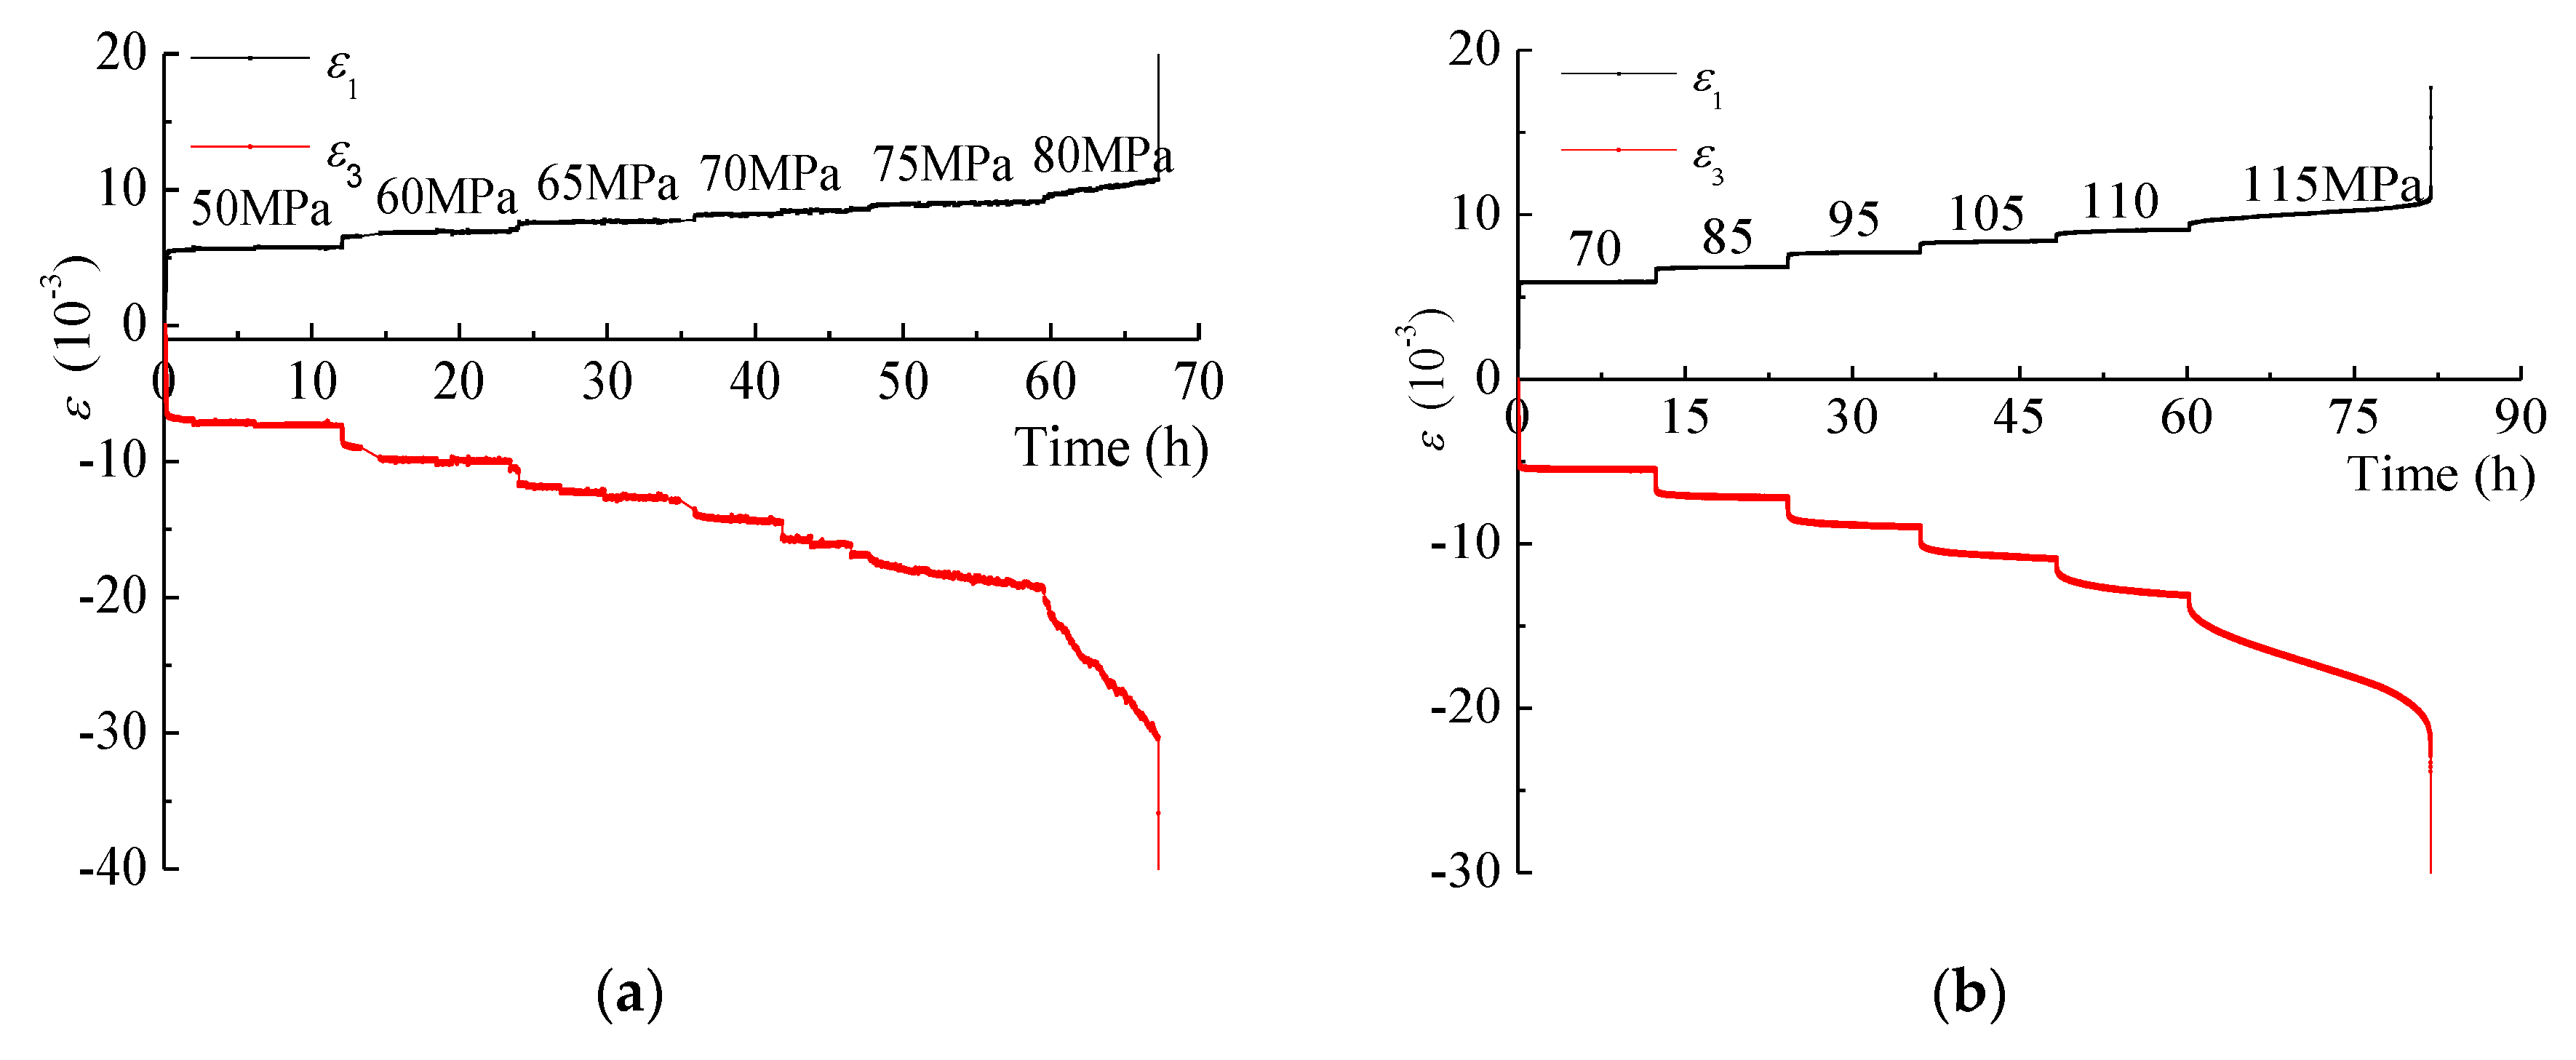
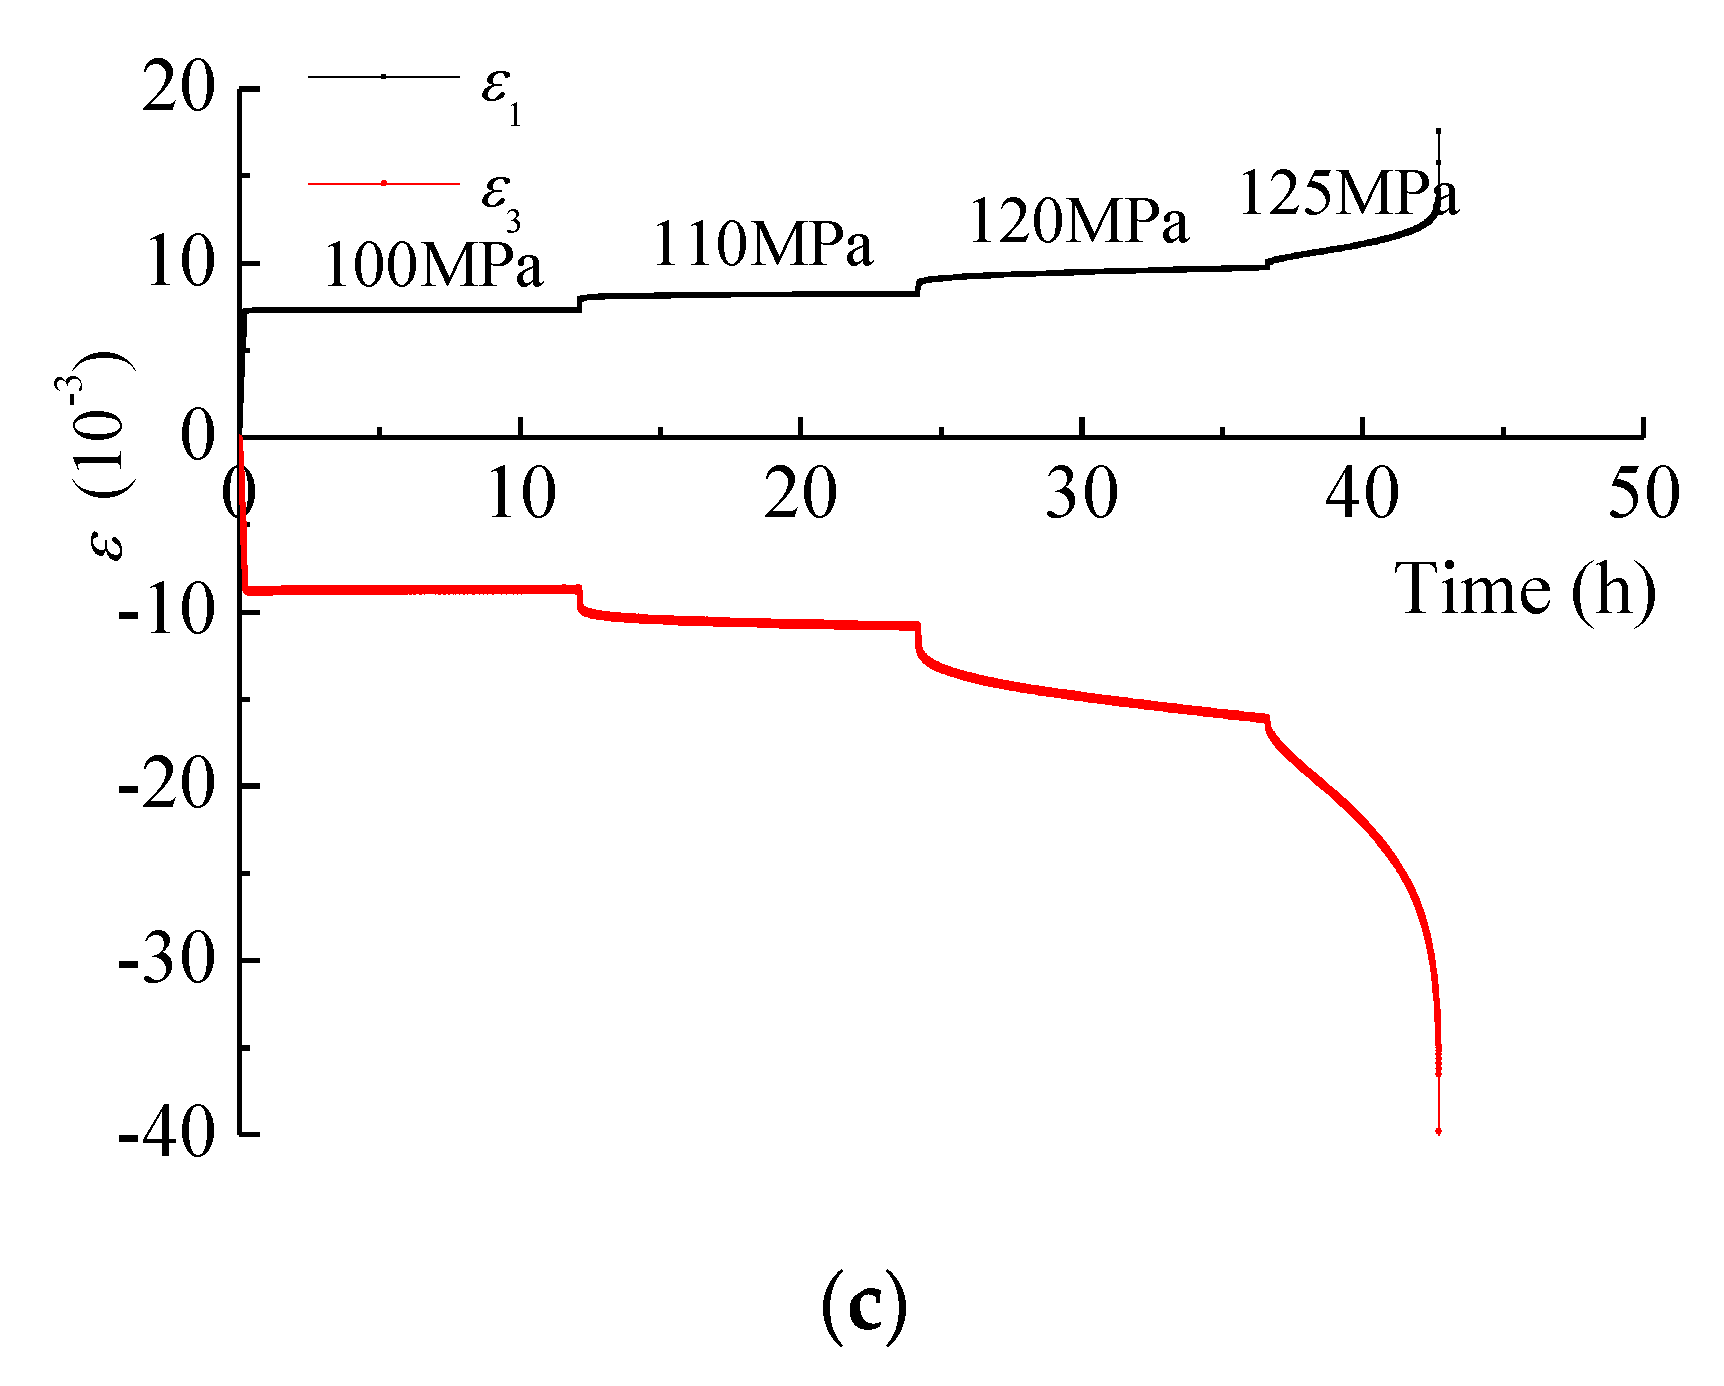
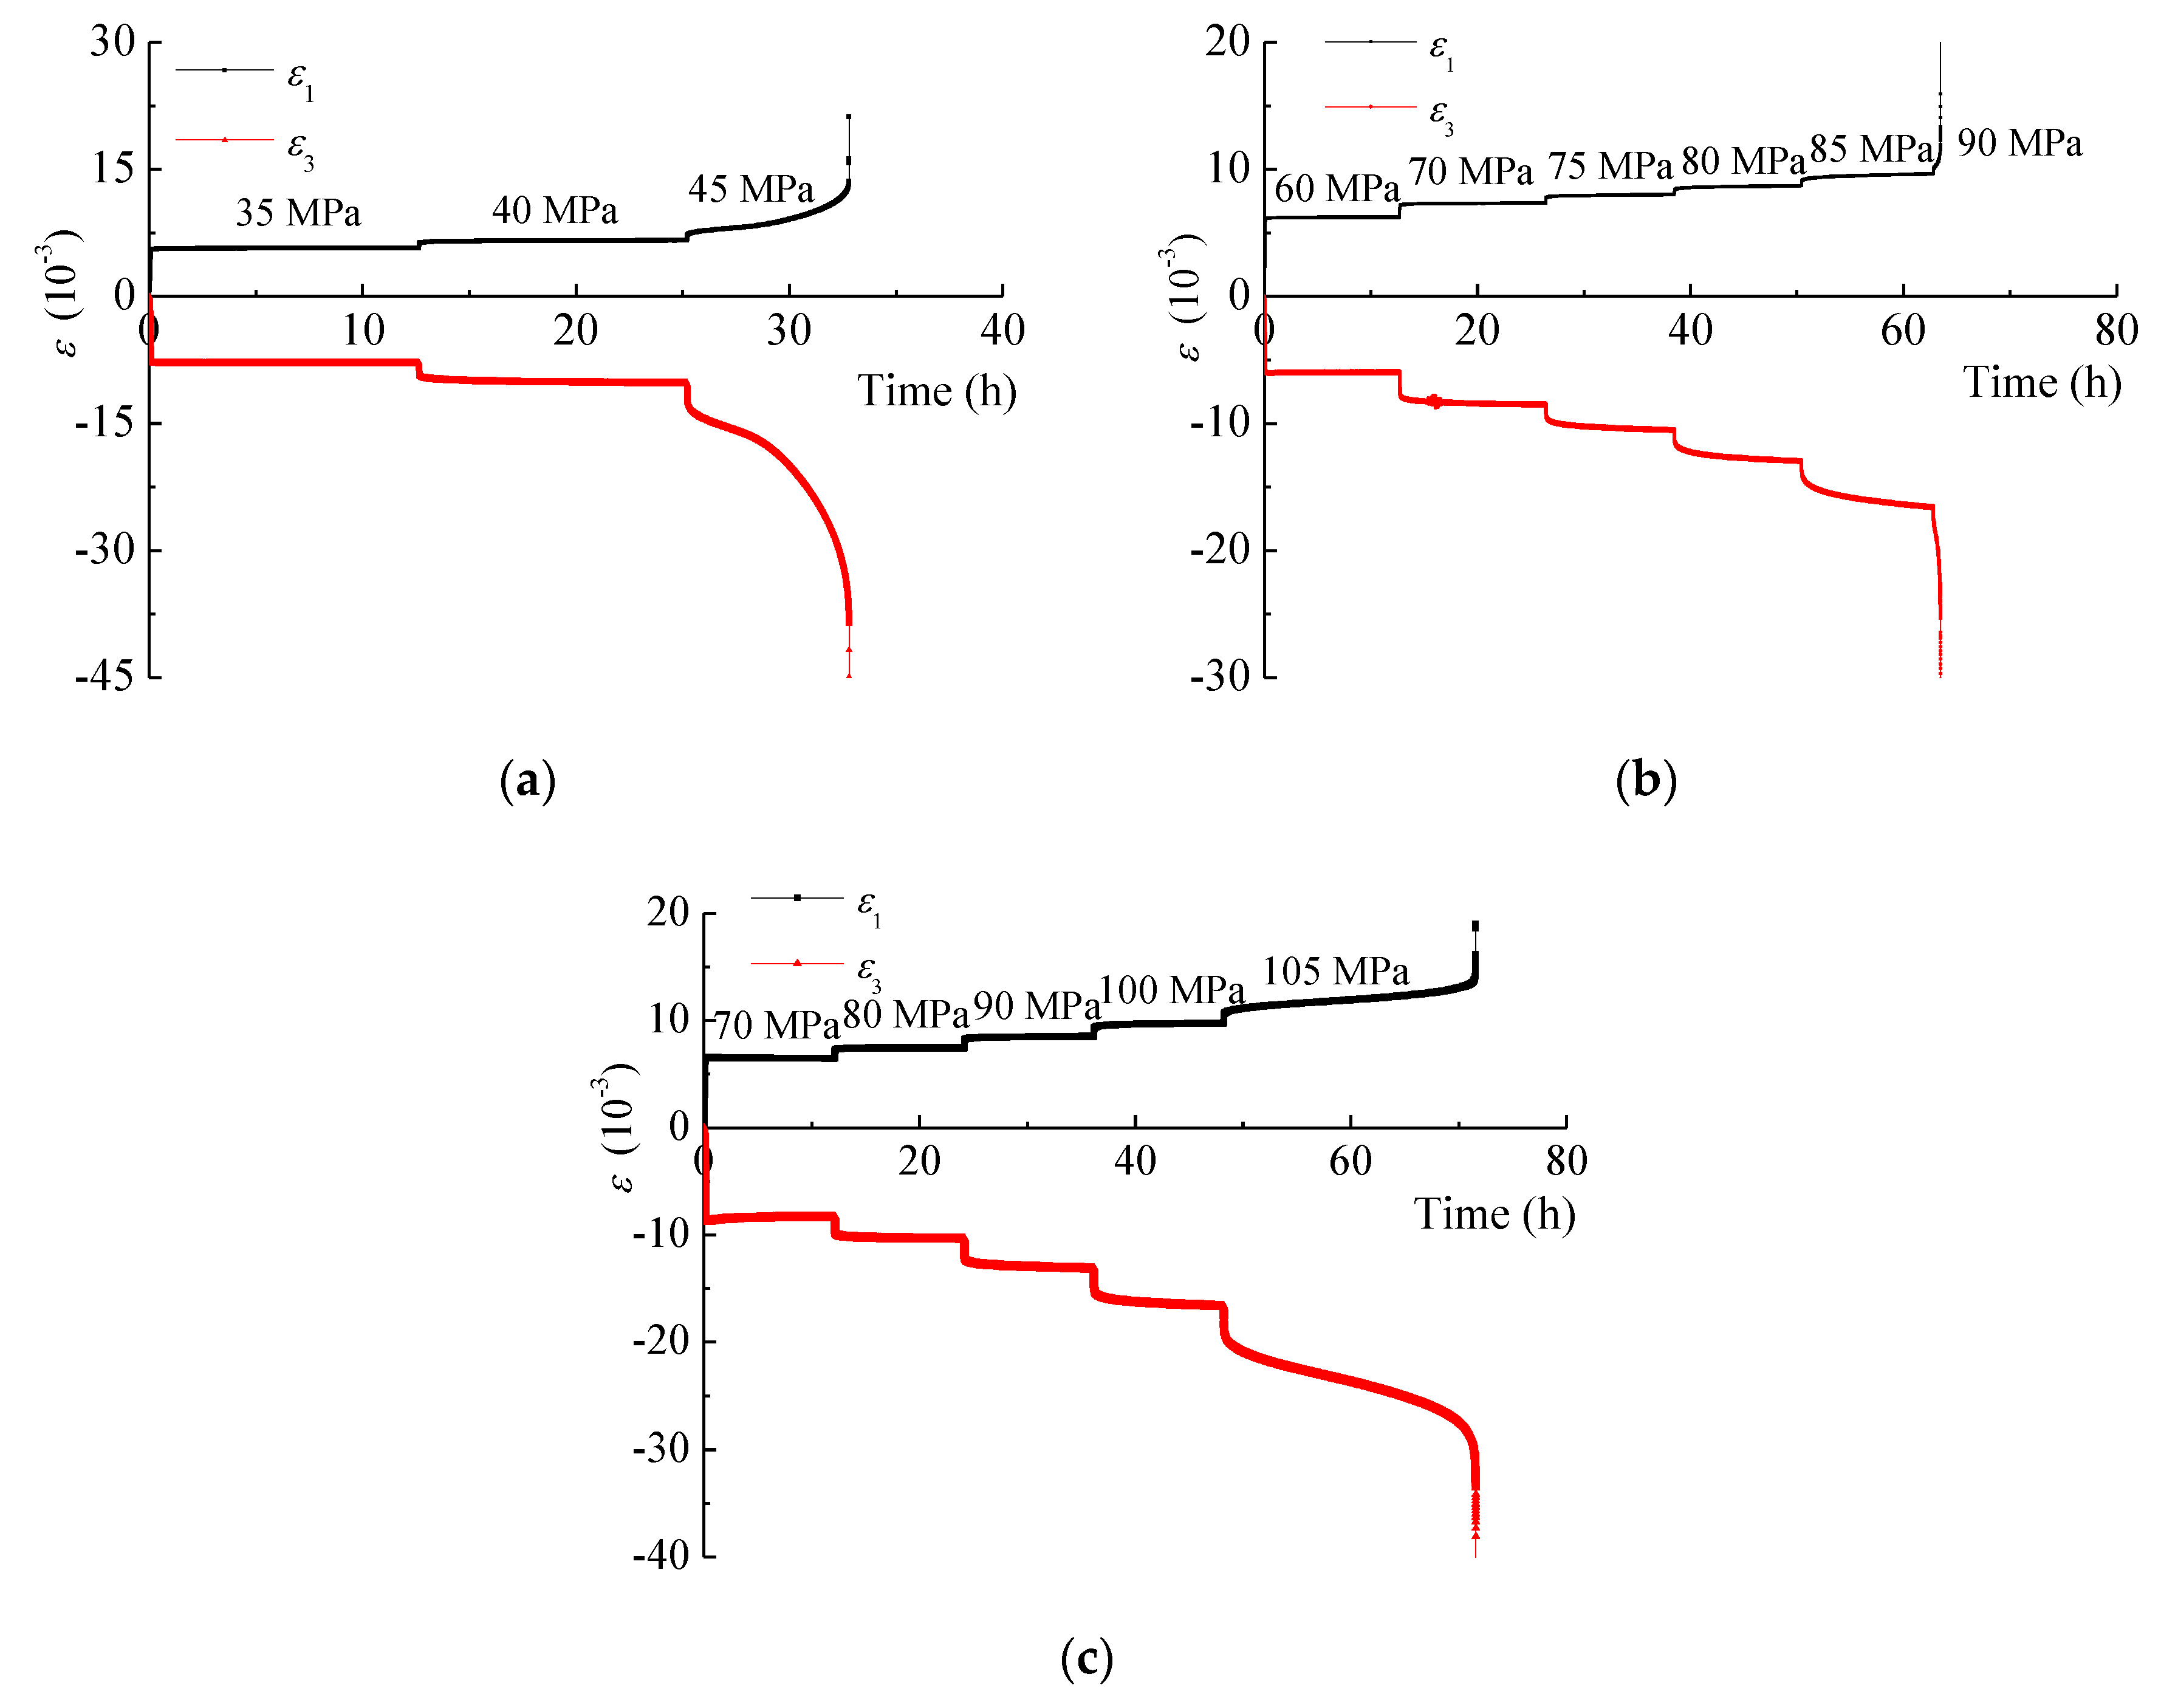
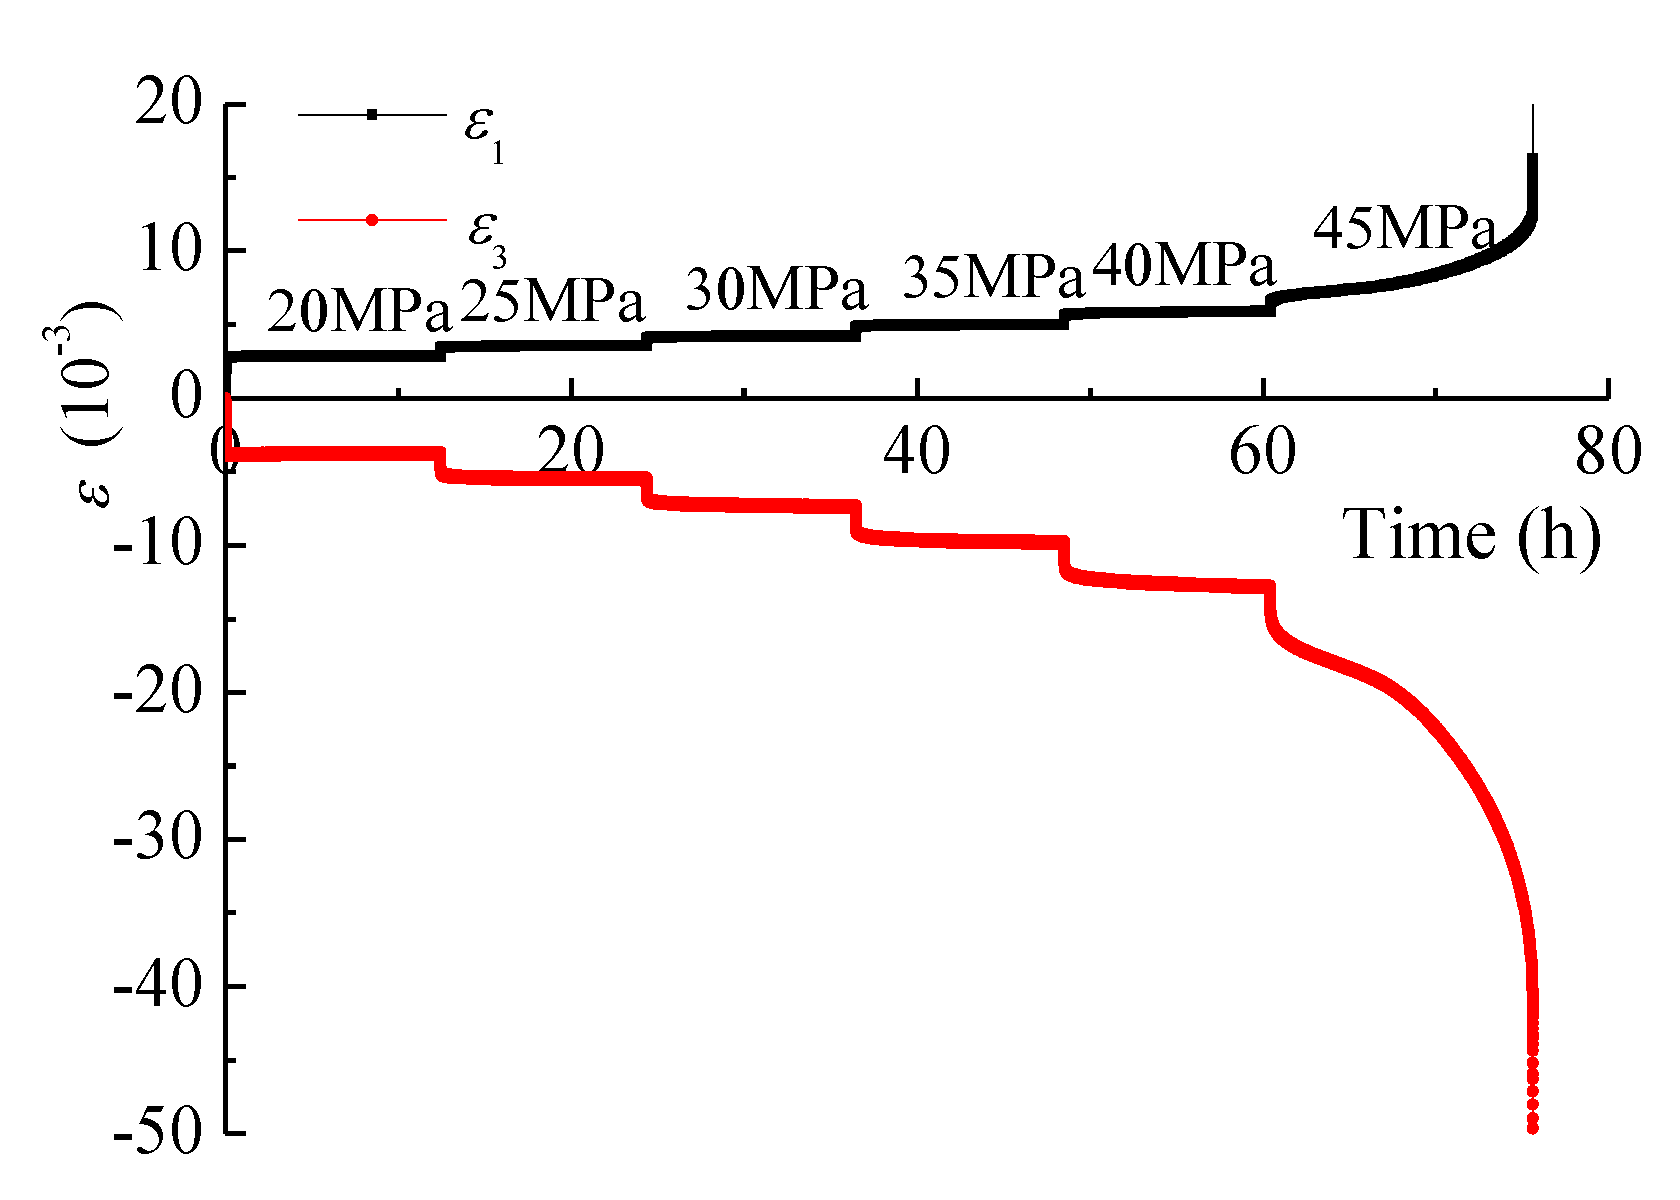
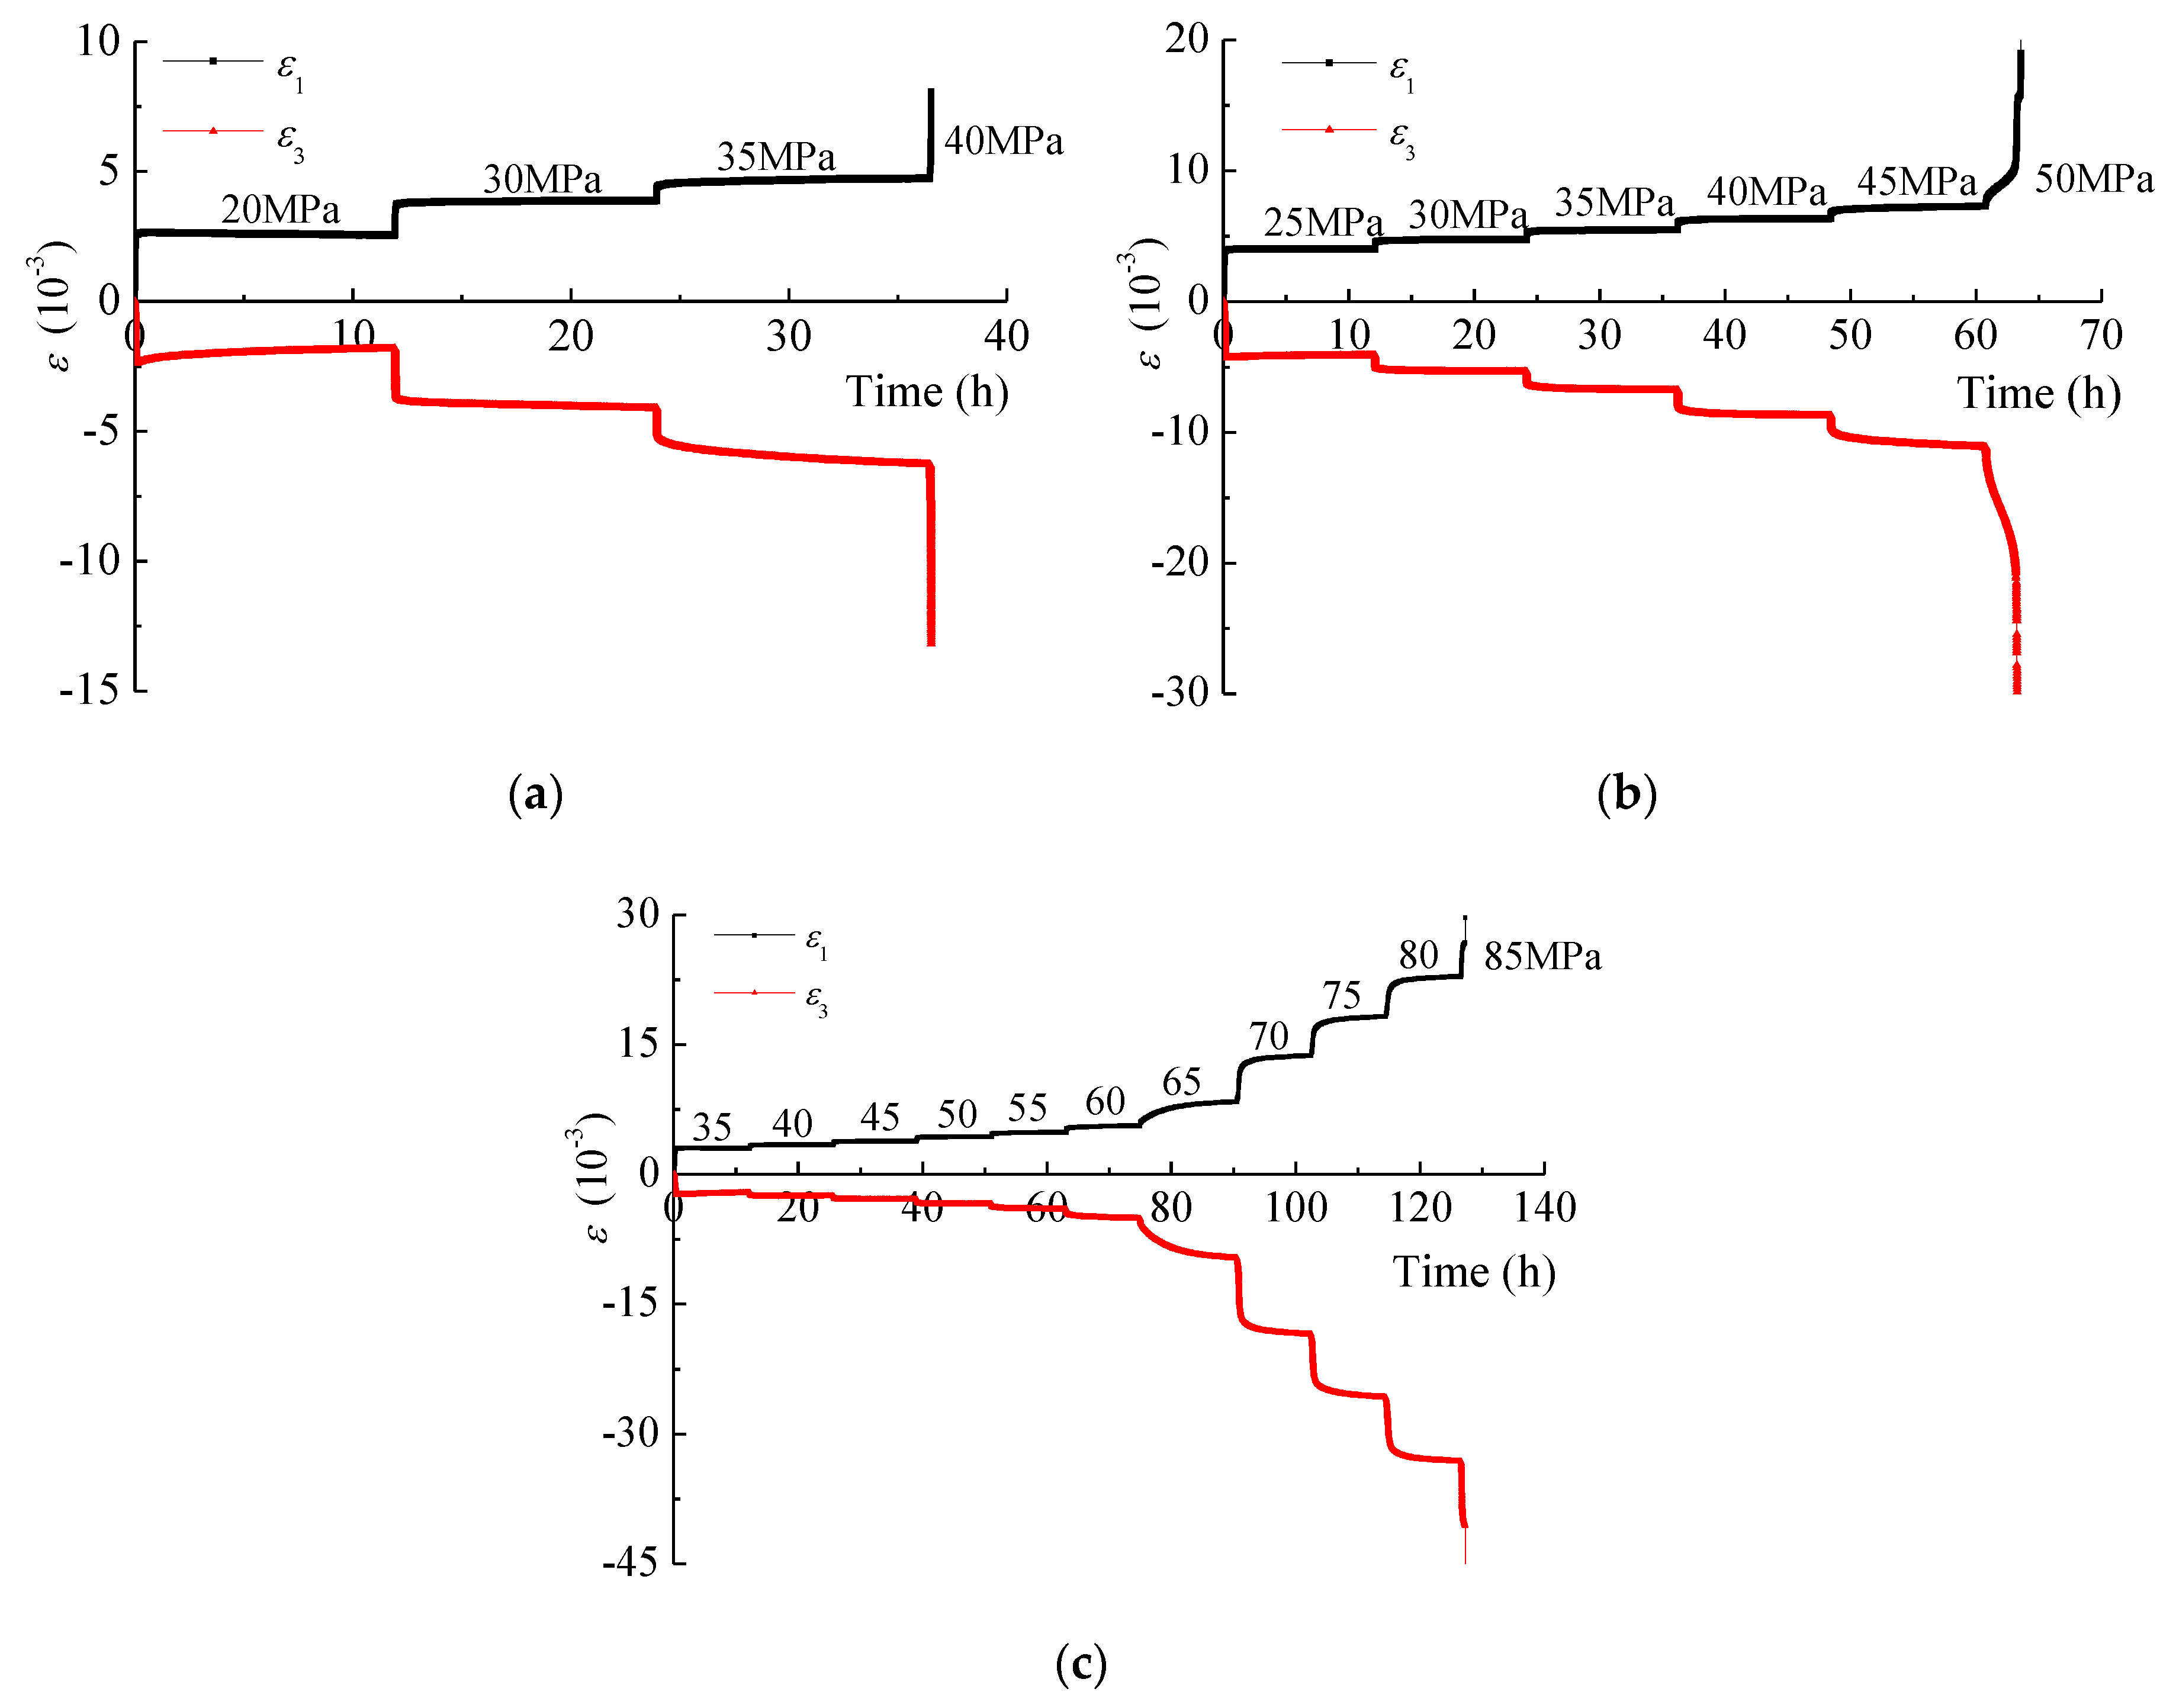
4.1. Creep Strain Behavior

Figure 10, Figure 11, Figure 12, Figure 13 and Figure 14 show the typical creep tests curves of the intact and fractured specimens under different confining pressures. Table 5 lists the triaxial creep strain of the intact and fractured specimens under different differential stress. In Table 5, εo and εc are the instantaneous and creep strain of the specimens, respectively.
Based on Figure 10, Figure 11, Figure 12, Figure 13 and Figure 14 and Table 5, we conclude that the differential stress, confining pressure, and damage significantly affect the instantaneous and creep strain behavior of the intact and fractured specimens. Figure 15 further illustrates the effect of stress ratio (S/σp) on the instantaneous axial strain of fractured specimens with different degrees of damage.
From Figure 15, we can conclude that the axial instantaneous strain increases linearly with increasing stress ratio, mainly caused by the closure of initial fractures at low differential stress and the initiation and extension of secondary fractures at high differential stress. However, with increasing damage, the irregular fractures of fractured specimens were gradually filled with small rocks and grains, maintaining the good structural and bearing capacity of fractured specimens, which led to the linear decrease of the sensitivity coefficient of the axial instantaneous strain to the stress ratio.
The creep contribution to the deformation of fractured specimens increases with increasing differential stress, and the specimens exhibit significant time dependent behavior at high differential stress. At low axial stress, the creep deformation of the specimens was mainly attenuated creep caused by the closure of initial fractures, and was characterized by a decreasing deformation rate. With increasing axial stress, the creep deformation of fractured specimens with different degrees of damage underwent the steady creep stage and the accelerated creep stage. At the steady creep stage, the micro-fractures of fractured specimens under sustained stress initiated and extended with time, which led to the continuous creep deformation of fractured specimens with a steady creep rate. When the axial stress was increased to the final creep failure level, the micro-fractures further expanded and connected to form the main fracture. With the further expansion of main fractures and micro-fractures, the creep deformation and creep rate increased rapidly, which resulted in the accumulation of creep damage and final creep failure of fractured specimens. We took the specimen R-10 (D = 0.347) at σ3 = 5 MPa as an example. The axial creep strain of specimen R-10 was 0.245 × 10⁻³, which was 8.593% of the total strain at the first stress level of 20 MPa. When the axial stress was increased to the second stress level of 25 MPa, the creep strain was about 0.216 × 10⁻³, which was 30.901% of the total strain. With increasing axial stress, the axial creep strain of the specimen at the third, fourth, and fifth stress levels reached 0.284 × 10⁻³, 0.341 × 10⁻³, and 0.456 × 10⁻³, which were 40.571%, 43.550%, and 53.584% of the total strain of the corresponding stress level, respectively. The creep deformation of the specimen was mainly characterized by attenuated and steady creep behavior. At the final stress level, the differential stress was increased to 45 MPa and maintained for about 15.19 h. The creep strain increased rapidly to 14.879 × 10⁻³, which was more than the sum of the creep strain of the five previous stress levels, indicating significant accelerated creep behavior, leading to creep failure.
For a given stress and damage, the creep contribution to the deformation of fractured specimens decreases with increasing confining pressure; however, the creep stress threshold and the creep strength of the intact and fractured specimens increase with increasing confining pressure. We take the specimens with D = 0.440 under the differential stress of 35 MPa as examples for further analysis. At σ3 = 5 MPa, the creep strain of specimen R-13 was 0.464 × 10⁻³, which was 54.02% of the total strain. When the confining pressure was increased to 10 MPa, the creep strain of specimen R-14 was about 0.341 × 10⁻³, which was 46.52% of the total strain [8]. However, when the confining pressure was increased to 20 MPa, the creep strain of specimen R-15 was 0.129 × 10⁻³, which was significantly lower than the values that at σ3 = 5 MPa and 10 MPa.
Based on the data in Table 5, we conclude that the creep contribution to the deformation of a specimen decreases with increasing damage. We took the specimens under a confining pressure of 20 MPa as an example. At D = 0, the creep strain of specimen R-3 at a stress level of 78.70% σp was about 0.620 × 10⁻³, which was 53.219% of the total strain. When the damage was increased to 0.158, the creep strain of specimen R-6 at a stress level of 78.22% σp decreased to 0.384 × 10⁻³, which was 40.982% of the total strain. The creep strain of specimen R-9 (D = 0.294) at a stress level of 80.31% σp was 0.391 × 10⁻³, which was 37.35% of the total strain. When the damage was increased to 0.440, the creep strain of specimen R-15 at a stress level of 78.16% σp decreased to 0.224 × 10⁻³, which was significantly lower than the values at D = 0, 0.158, and 0.294.

4.2. Creep Strain Rate

By calculating the slope of the strain curves shown in Figure 10, Figure 11, Figure 12, Figure 13 and Figure 14, the creep strain rate of specimens with different degrees of damage during the creep deformation process can be obtained [8]. The results show that the creep rate of specimens with different degrees of damage depends on both the differential stress and the damage. For lower differential stress values, the creep deformation of all of the specimens contained two stages: a primary creep stage with a decreasing strain rate, and a steady-rate creep stage with a constant strain rate [37]. In the primary creep stage, the axial creep strain increased with time, but the creep rate decreased rapidly to the steady creep rate. With increasing stress, the steady creep rate increased rapidly (Figure 16). For example, at the differential stress of 80 MPa (63.22% σp), the steady creep rate of specimen R-1 was 1.22 × 10⁻⁵/h. When the differential stress was increased to 90 MPa (71.12% σp) and 100 MPa (79.03% σp), the steady creep rate of specimen R-1 was 2.57 × 10⁻⁵/h and 6.14 × 10⁻⁵/h, respectively, which were significantly higher than the value at the differential stress of 80 MPa.
For a given differential stress, the steady creep rate decreases with increasing confining pressure. We took differential stress of 100 MPa and 35 MPa as examples. For the differential stress of 100 MPa, the steady creep rate of specimen R-1 at σ3 = 5 MPa was 6.14 × 10⁻⁵/h. However, when the confining pressure was increased to 10 MPa, the steady creep rate of specimen R-2 decreased to 0.60 × 10⁻⁵/h, which was merely 10% of that at σ3 = 5 MPa. For the differential stress of 35 MPa, the steady creep rate of specimen R-13 at σ3 = 5 MPa, specimen R-14 at σ3 = 10 MPa, and specimen R-15 at σ3 = 15 MPa was 1.79 × 10⁻⁵/h, 0.78 × 10⁻⁵/h, and 0/h, respectively, exhibiting a significant decrease with increasing confining pressure. This occurs because the confining pressure inhibits the initiation and propagation of fractures in fractured specimens.
The calculation results show that at a given differential stress, the steady creep rate of the specimens decreases linearly with increasing damage. We took the specimens with different degrees of damage under a confining pressure of 20 MPa as an example. At D = 0, the steady creep rate of specimen R-3 at a stress level of 78.70% σp was 2.94 × 10⁻⁵/h. When the damage was increased to 0.158, the steady creep rate of specimen R-6 at a stress level of 78.22% σp decreased to 1.50 × 10⁻⁵/h. The steady creep rate of specimen R-9 with D = 0.294 at a stress level of 80.31% σp was 1.29 × 10⁻⁶/h. When the damage was increased to 0.440, the creep strain of specimen R-15 at a stress level of 78.16% σp was about 0.58 × 10⁻⁶/h, which is significantly lower than the values at D = 0, 0.158, and 0.294.
When the differential stress was increased to the final stress level, the creep deformation of the specimens was mainly accelerated creep or steady creep followed by accelerated creep, and all of the specimens experienced creep failure, as shown in Figure 17.

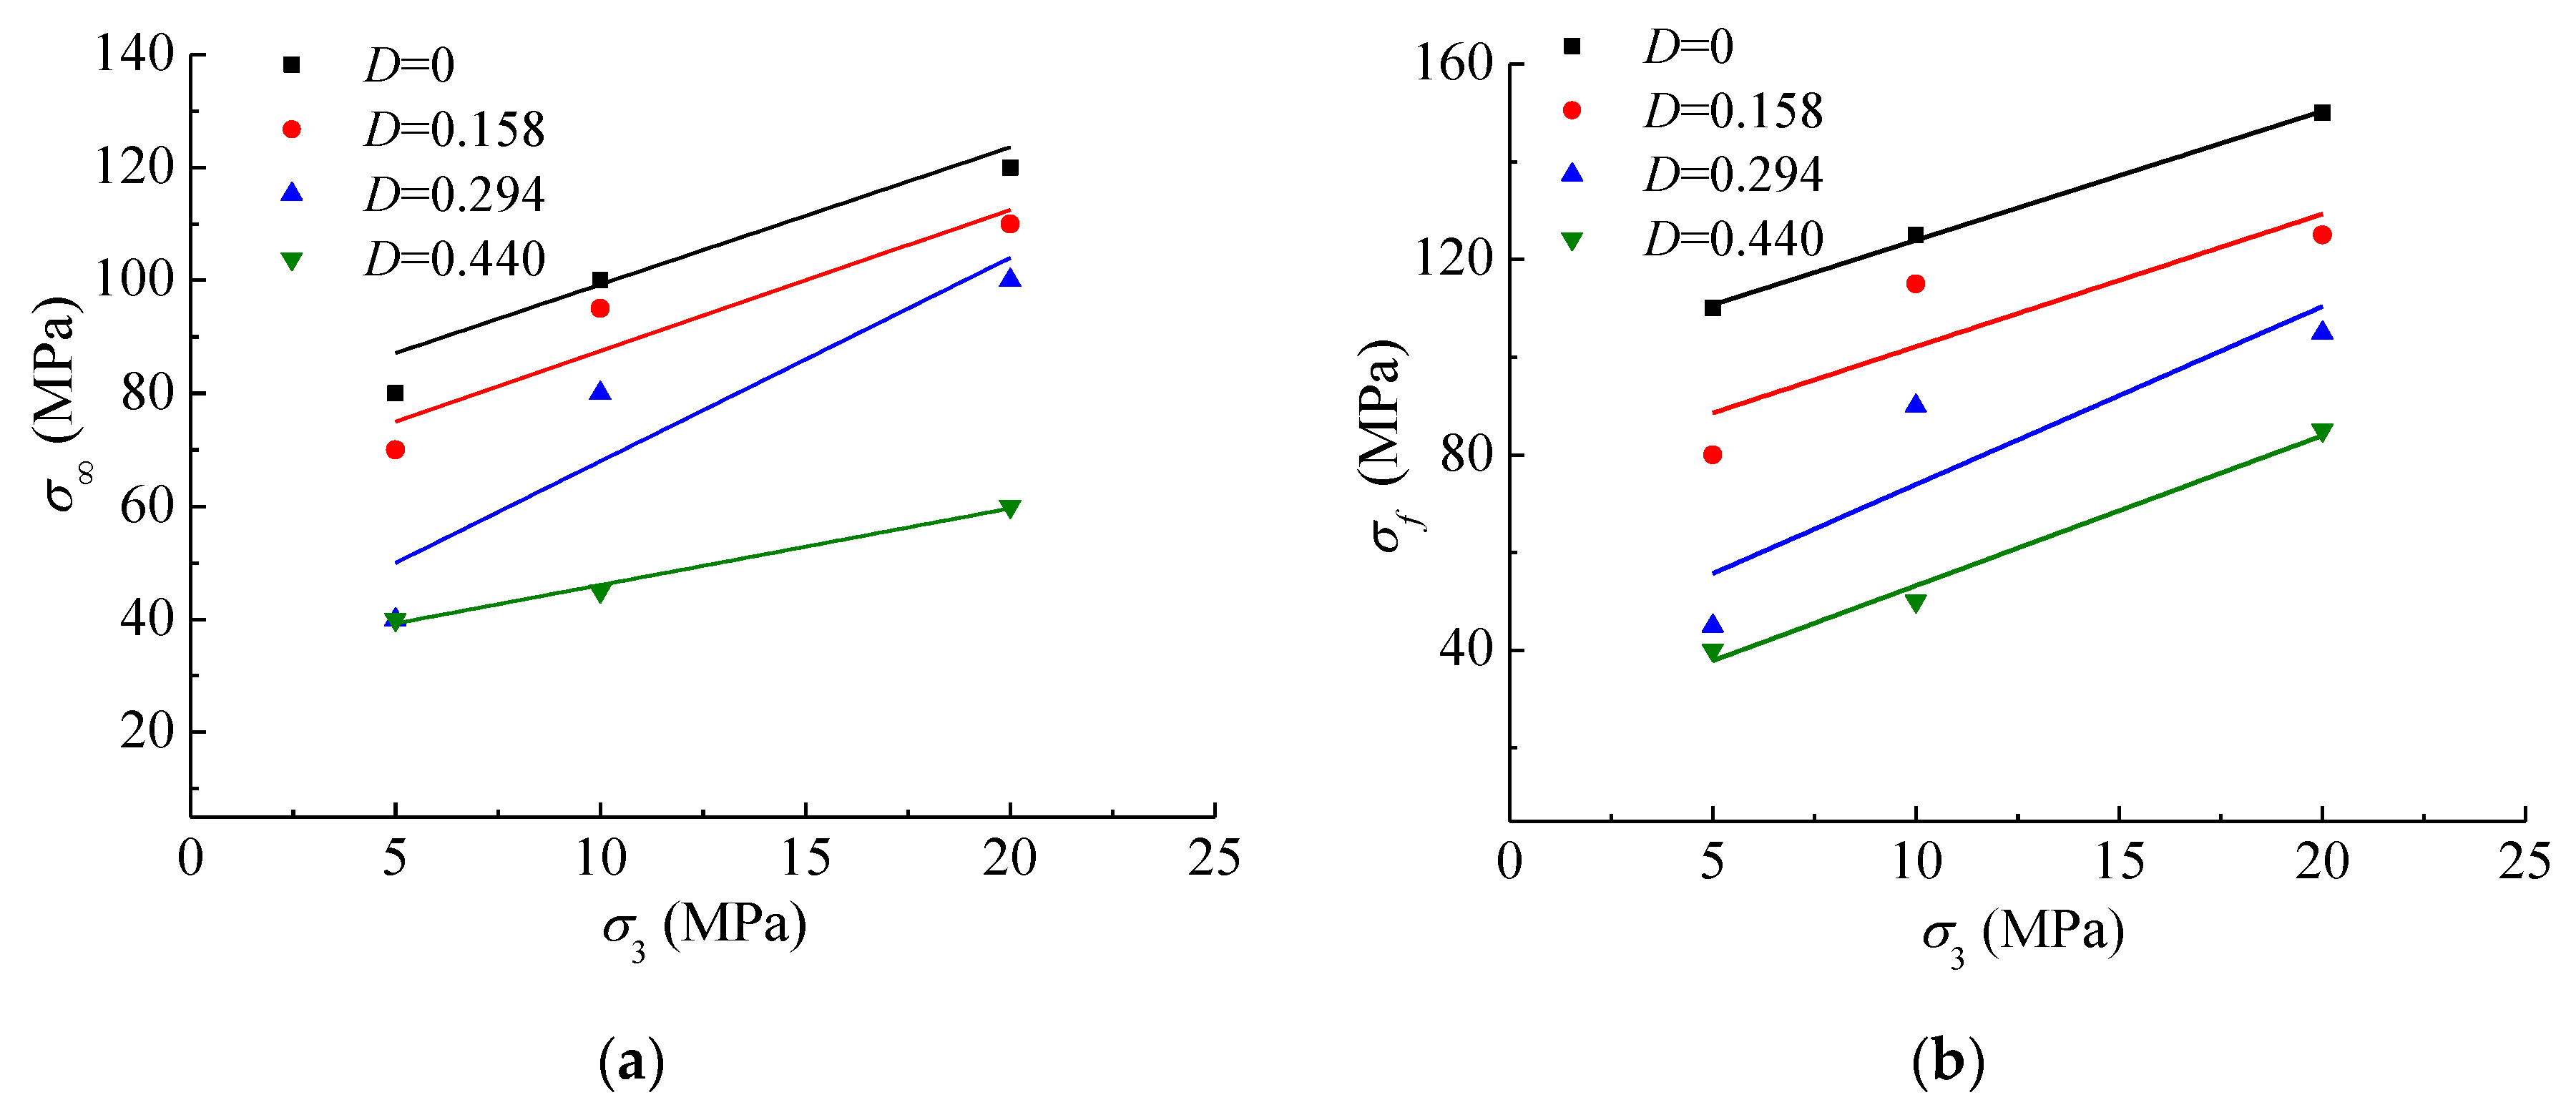
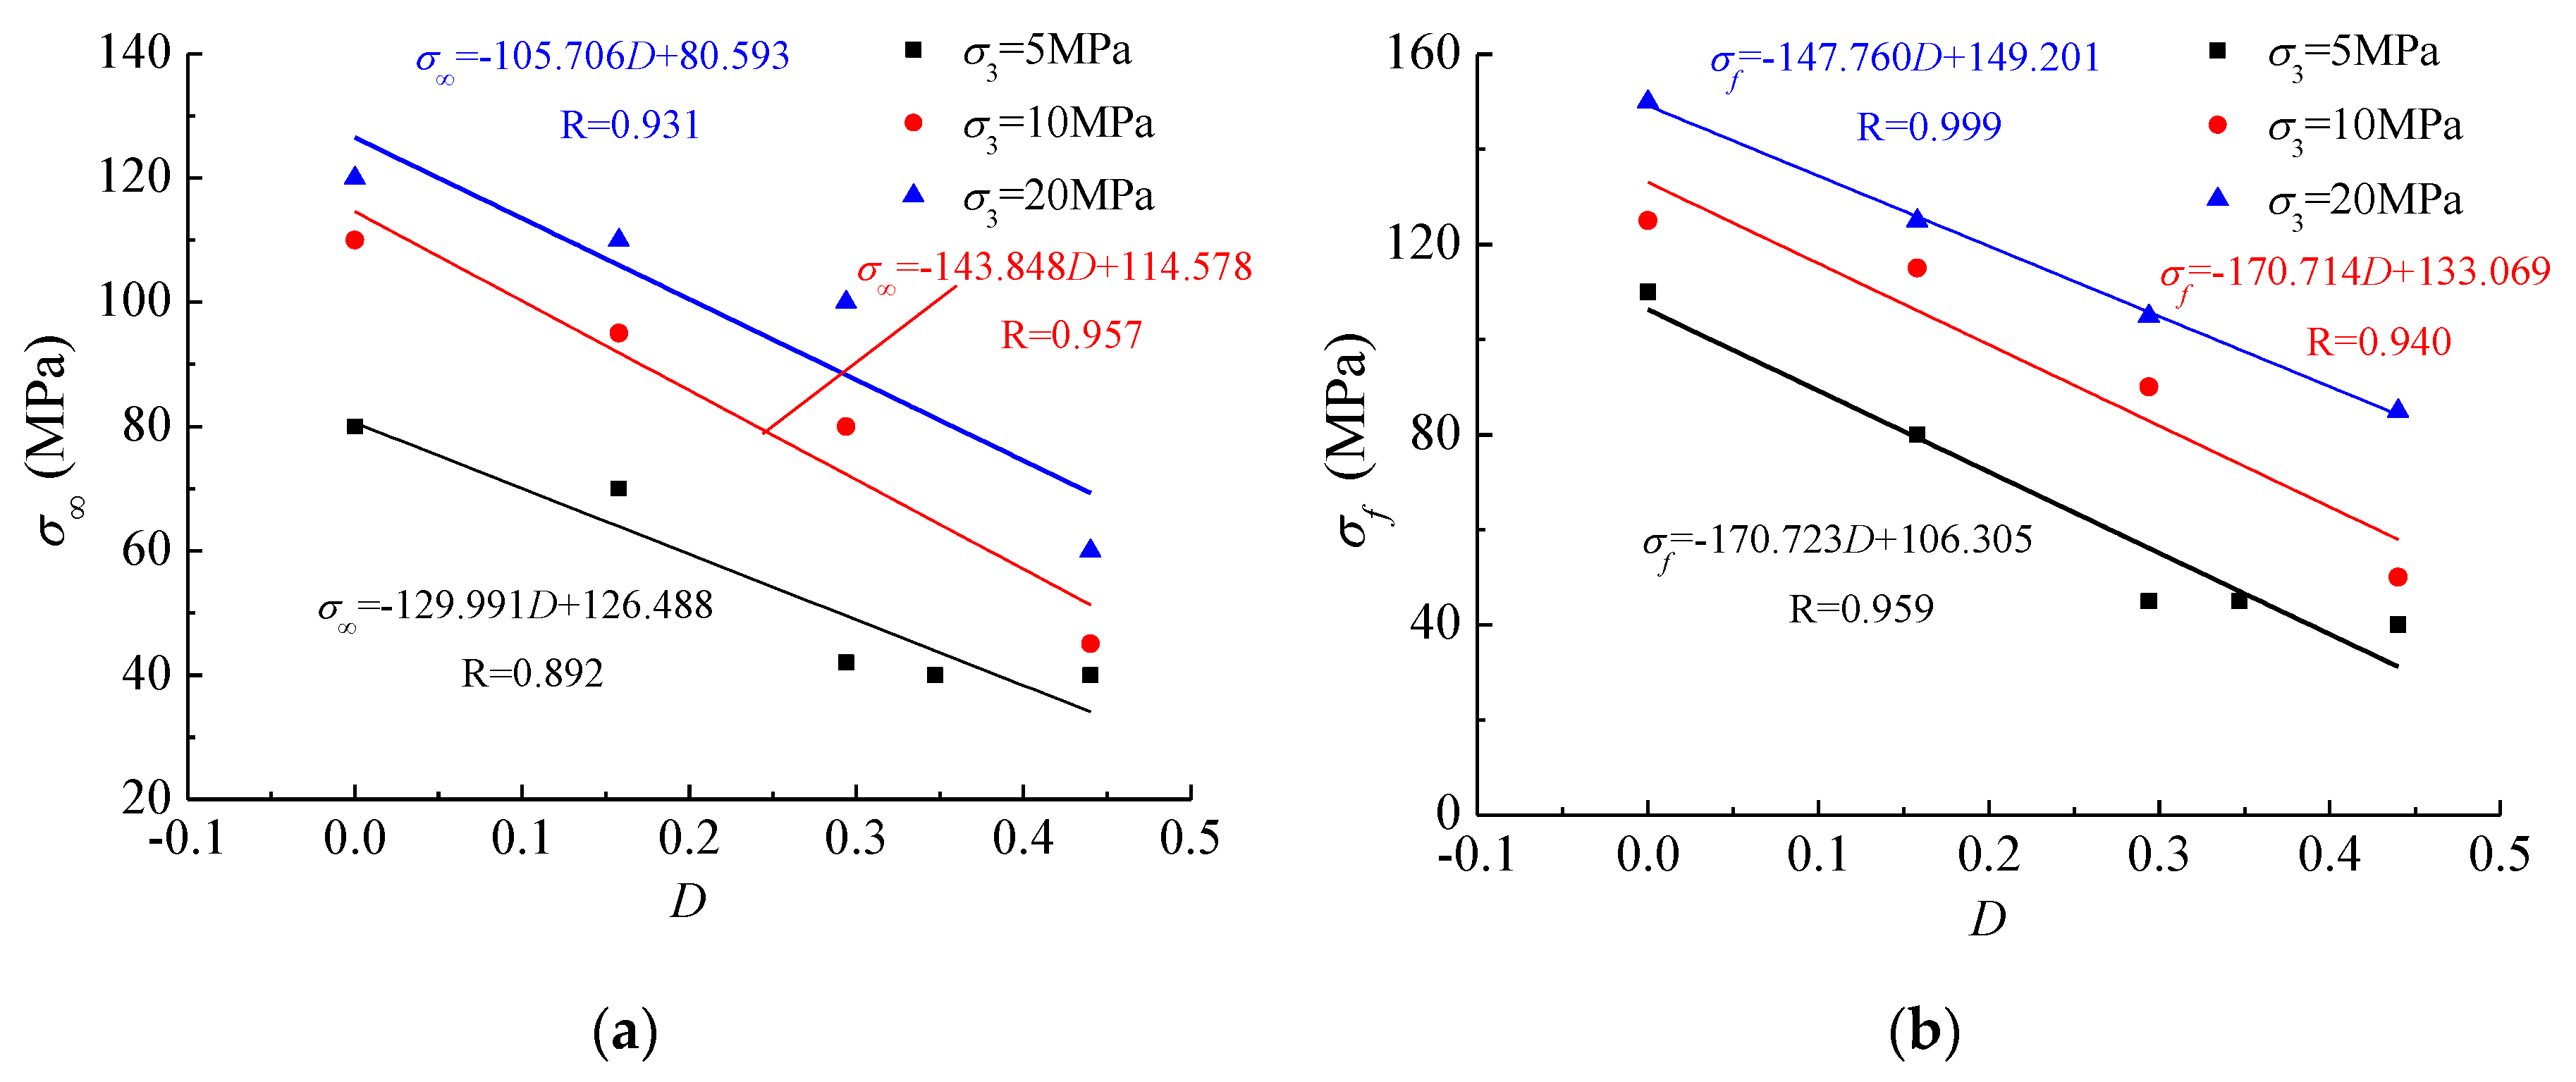
4.3. Long-Term Strength and Failure Behavior

Based on the creep curves for different stress levels, stress-strain isochronal curves were created for fractured specimens (Figure 18). The stress value corresponding to the inflection point of the stress-strain isochronal curve can be defined as the long-term strength of fractured specimens [38,39].
Figure 19 and Figure 20 further illustrate the effect of confining pressure and damage on the long-term strength and creep failure strength of fractured specimens.
From Figure 19 and Figure 20, it can be seen that the long-term strength and creep failure strength of fractured specimens increase along with increasing confining pressure, but decrease linearly with increasing damage. For example, the long-term strength of specimen R-2 was 110.00 MPa at σ3 = 10 MPa and D = 0, which was 88.00% of the creep failure strength and 79.89% of the short-term strength. When the damage was increased to 0.158, the long-term strength of specimen R-5 was about 95.00 MPa, which was 82.61% of the creep failure strength and 89.26% of the short-term strength. The long-term strength of the specimens with damage of 0.294 and 0.440 decreased to 40.00 MPa and 45 MPa, accounting for 88.89% and 90.00% of the creep failure strength, respectively.
Figure 21 illustrates the creep failure modes of fractured specimens with different degrees of damage. From Figure 21, we can conclude that the creep failure modes of the intact and fractured specimens depend on the confining pressure and damage and are mainly shear failure modes, which were similar to the short-term failure modes. The fractured specimens at D = 0 and 0.158 experienced typical shear failure modes with a single fracture after the creep tests. Obvious friction slip marks and some rock debris were observed on the shear failure surface of the specimens after creep failure. When the damage was increased to 0.294, 0.347 and 0.440, the creep failure modes of fractured specimens were mainly multiple shear failure modes. One main fracture surface penetrated the fractured specimen, which divided the specimen into two blocks, and one or more secondary fractures perpendicular to or oblique to the main fracture surfaces were also observed, resulting in multiple shear failure of the fractured specimen.

5. Conclusions

In this research, a series of short-term and creep experiments were conducted to explore the time-dependent behavior of fractured specimens with different degrees of damage. Based on the experimental results, the following conclusions can be drawn:
(1)
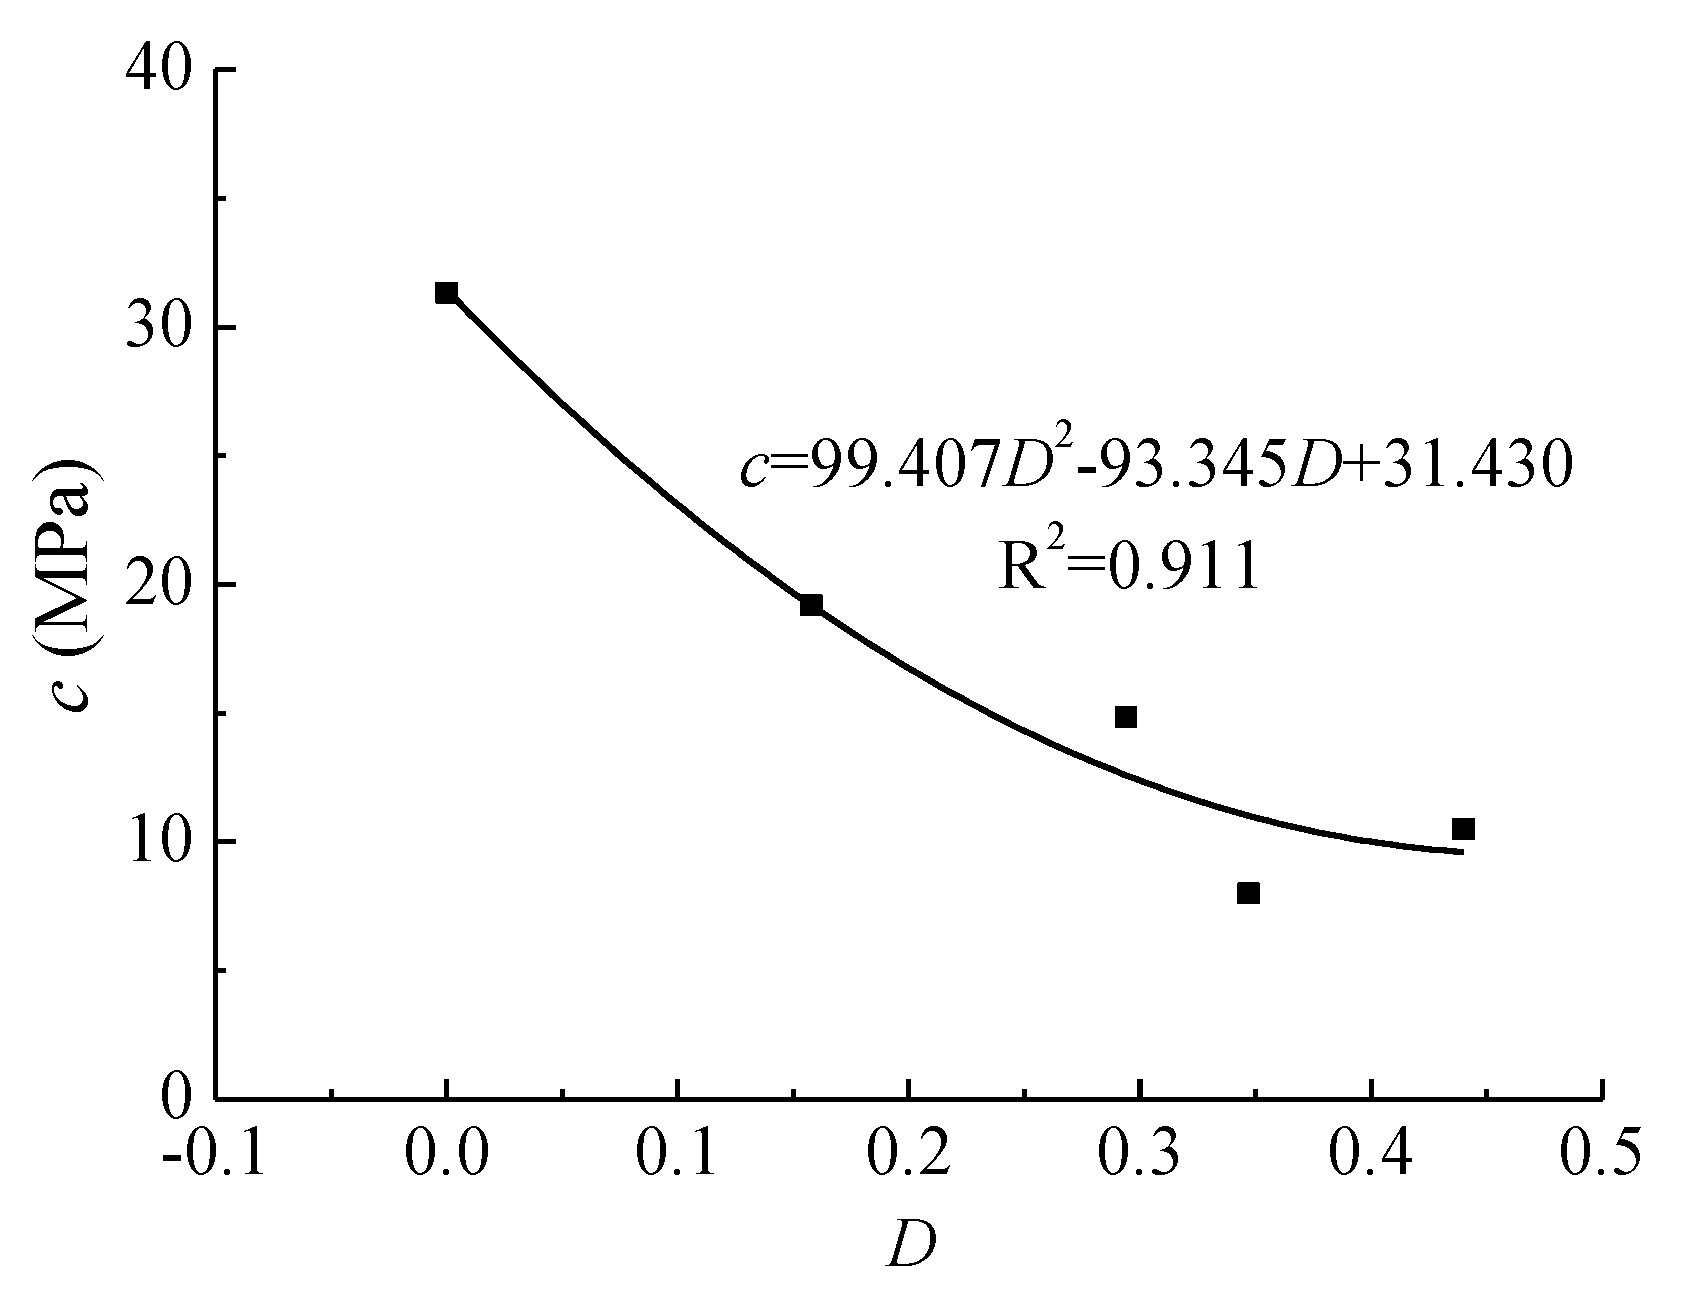
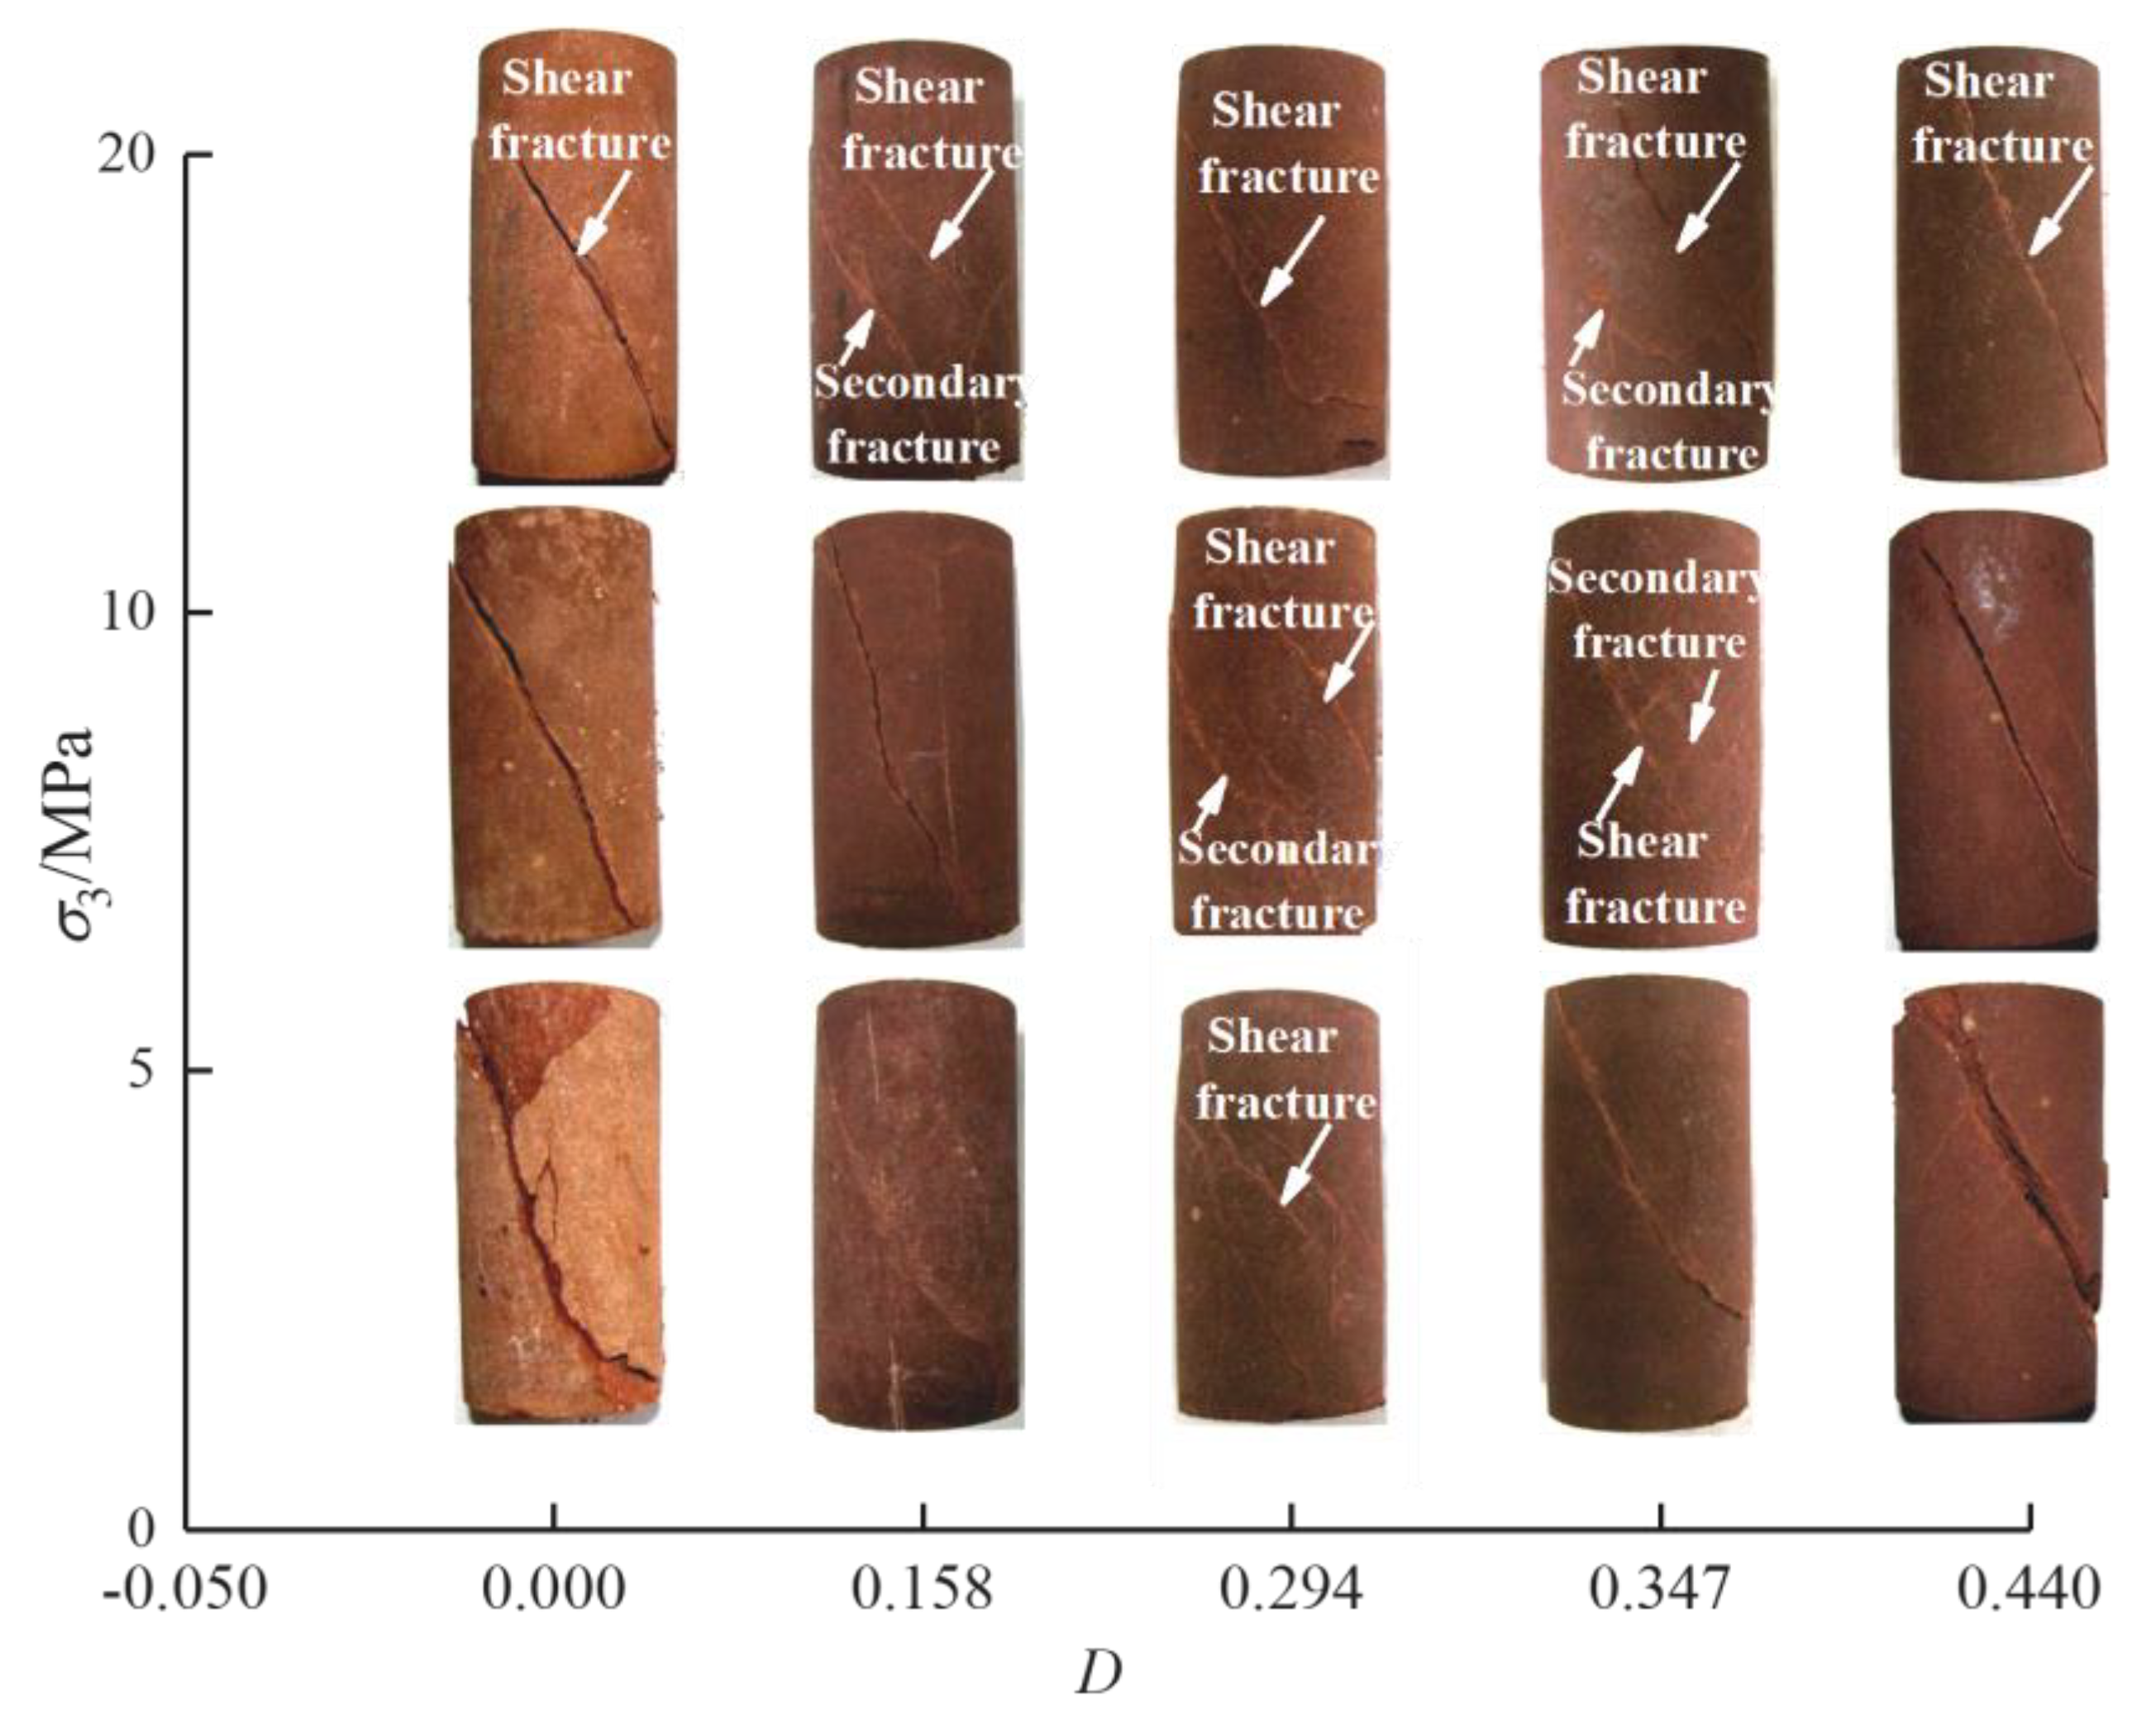
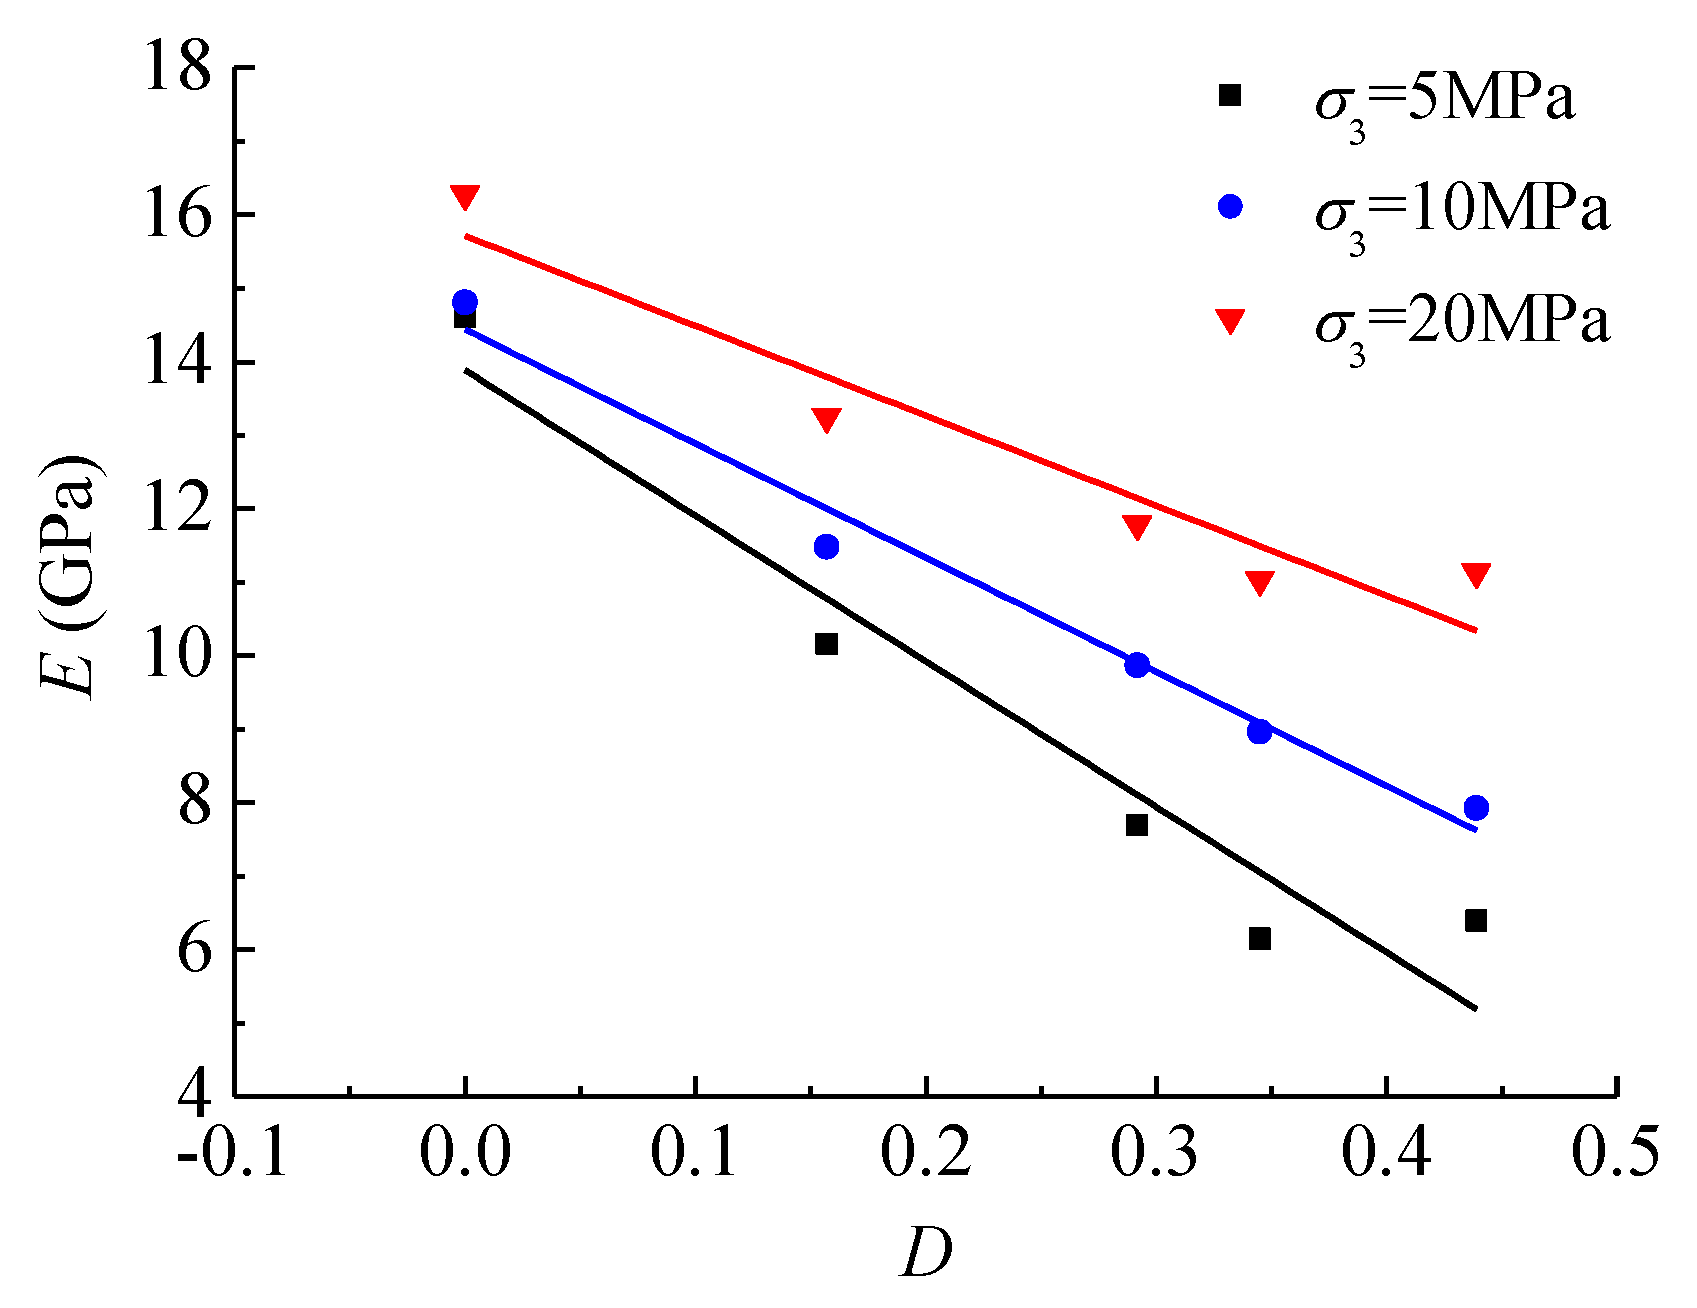
The peak strength and residual strength of intact and fractured specimens increase linearly with increasing confining pressure, which is in good agreement with the linear Mohr-Coulomb criterion. However, the peak strength and the equivalent cohesion of fractured specimens decrease linearly and non-linearly with increasing damage, respectively. The elastic and secant modulus of fractured specimens increase linearly with increasing confining pressure but decrease with the damage. The short-term failure modes depend on the damage and change from typical shear failure modes to multiple shear failure modes with increasing damage.
(2)
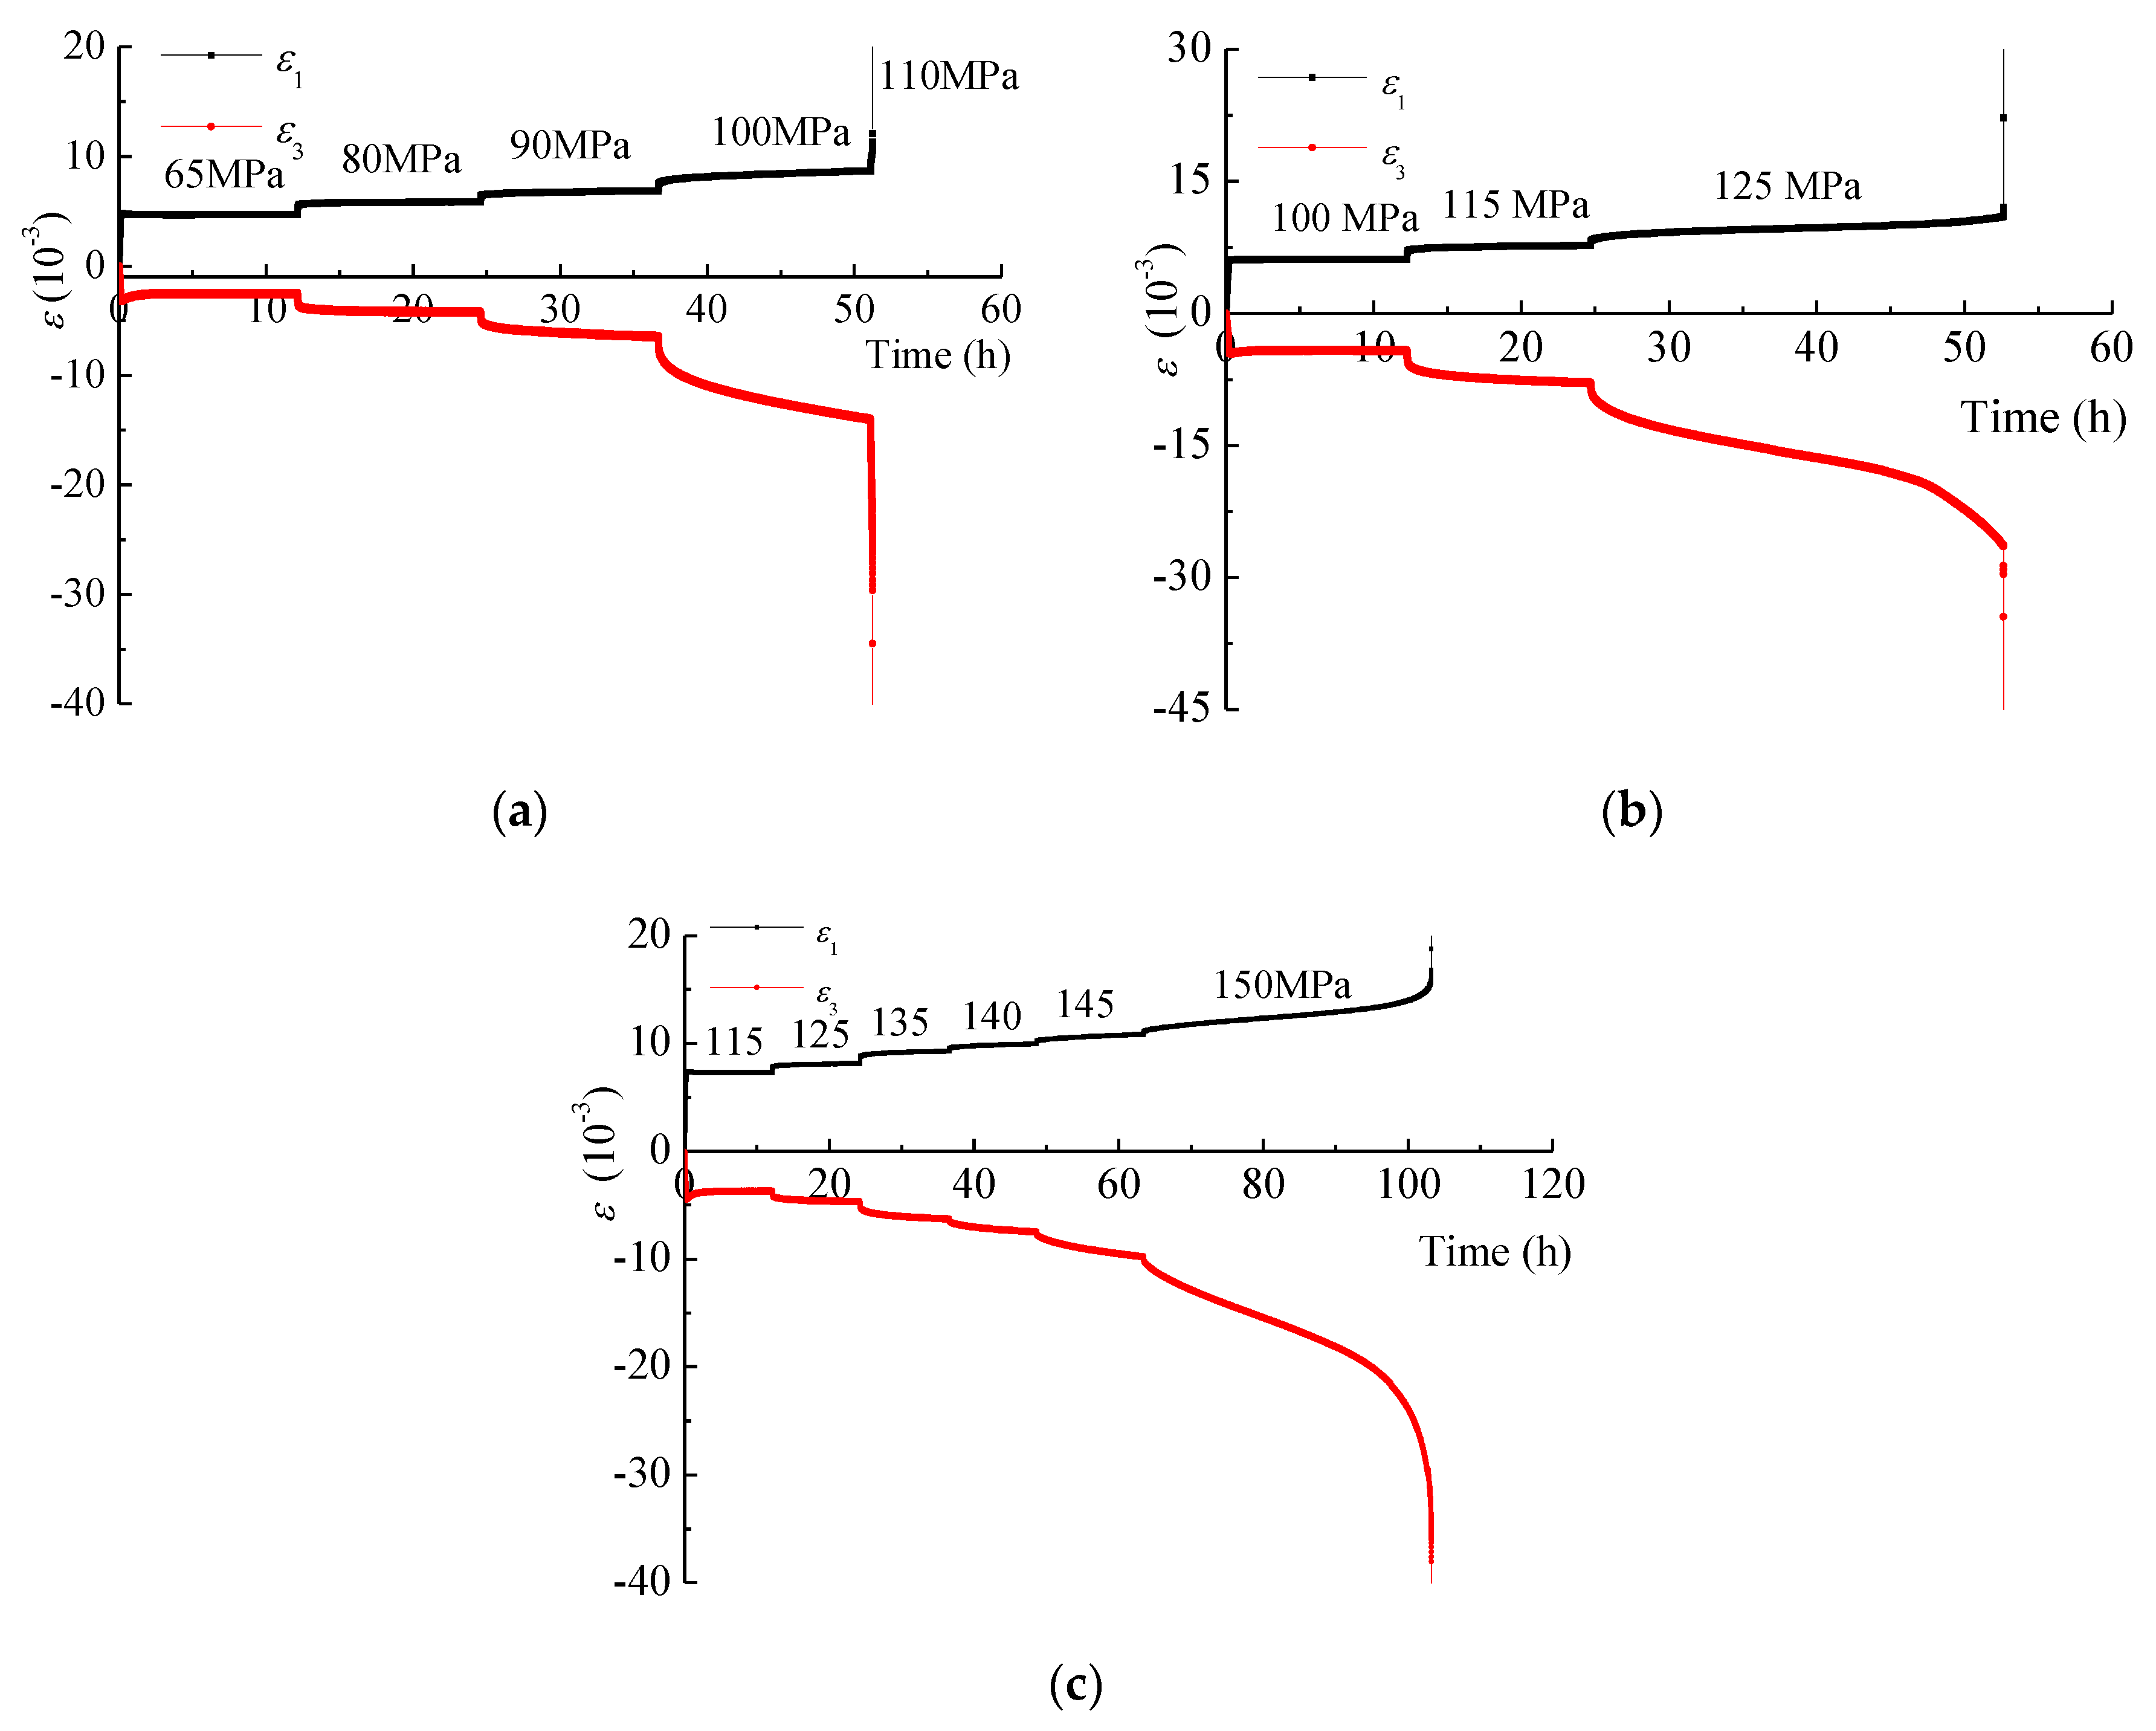
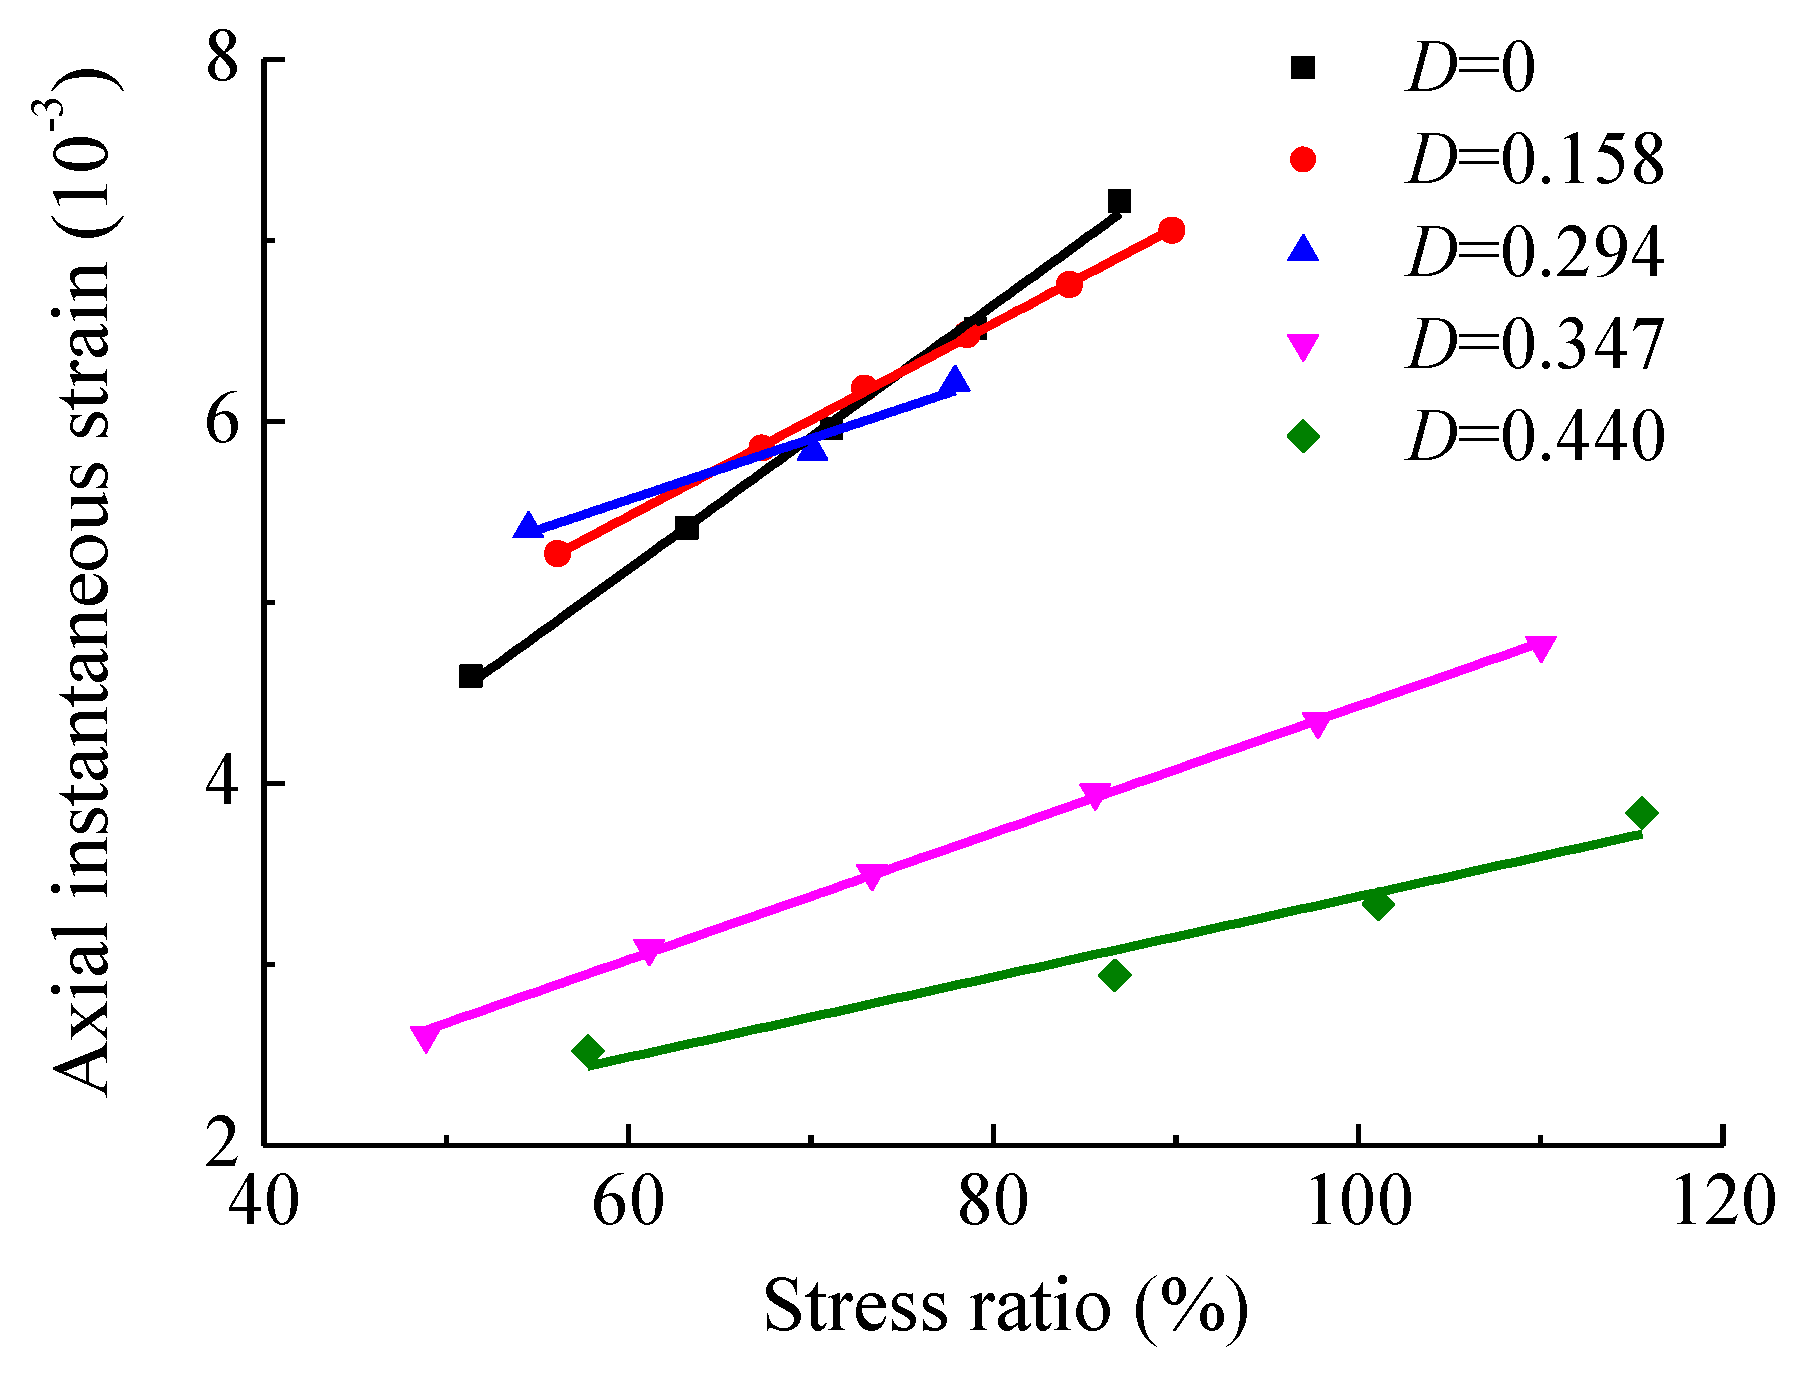
The differential stress, confining pressure, and damage significantly affect the instantaneous and creep strain behavior of intact and fractured specimens. The instantaneous axial strain and creep strain increase linearly with increasing differential stress, exhibiting significant time-dependent behavior at high differential stress. However, for a given differential stress, the creep contribution to the deformation of specimens decreases with increasing confining pressure and damage.
(3)
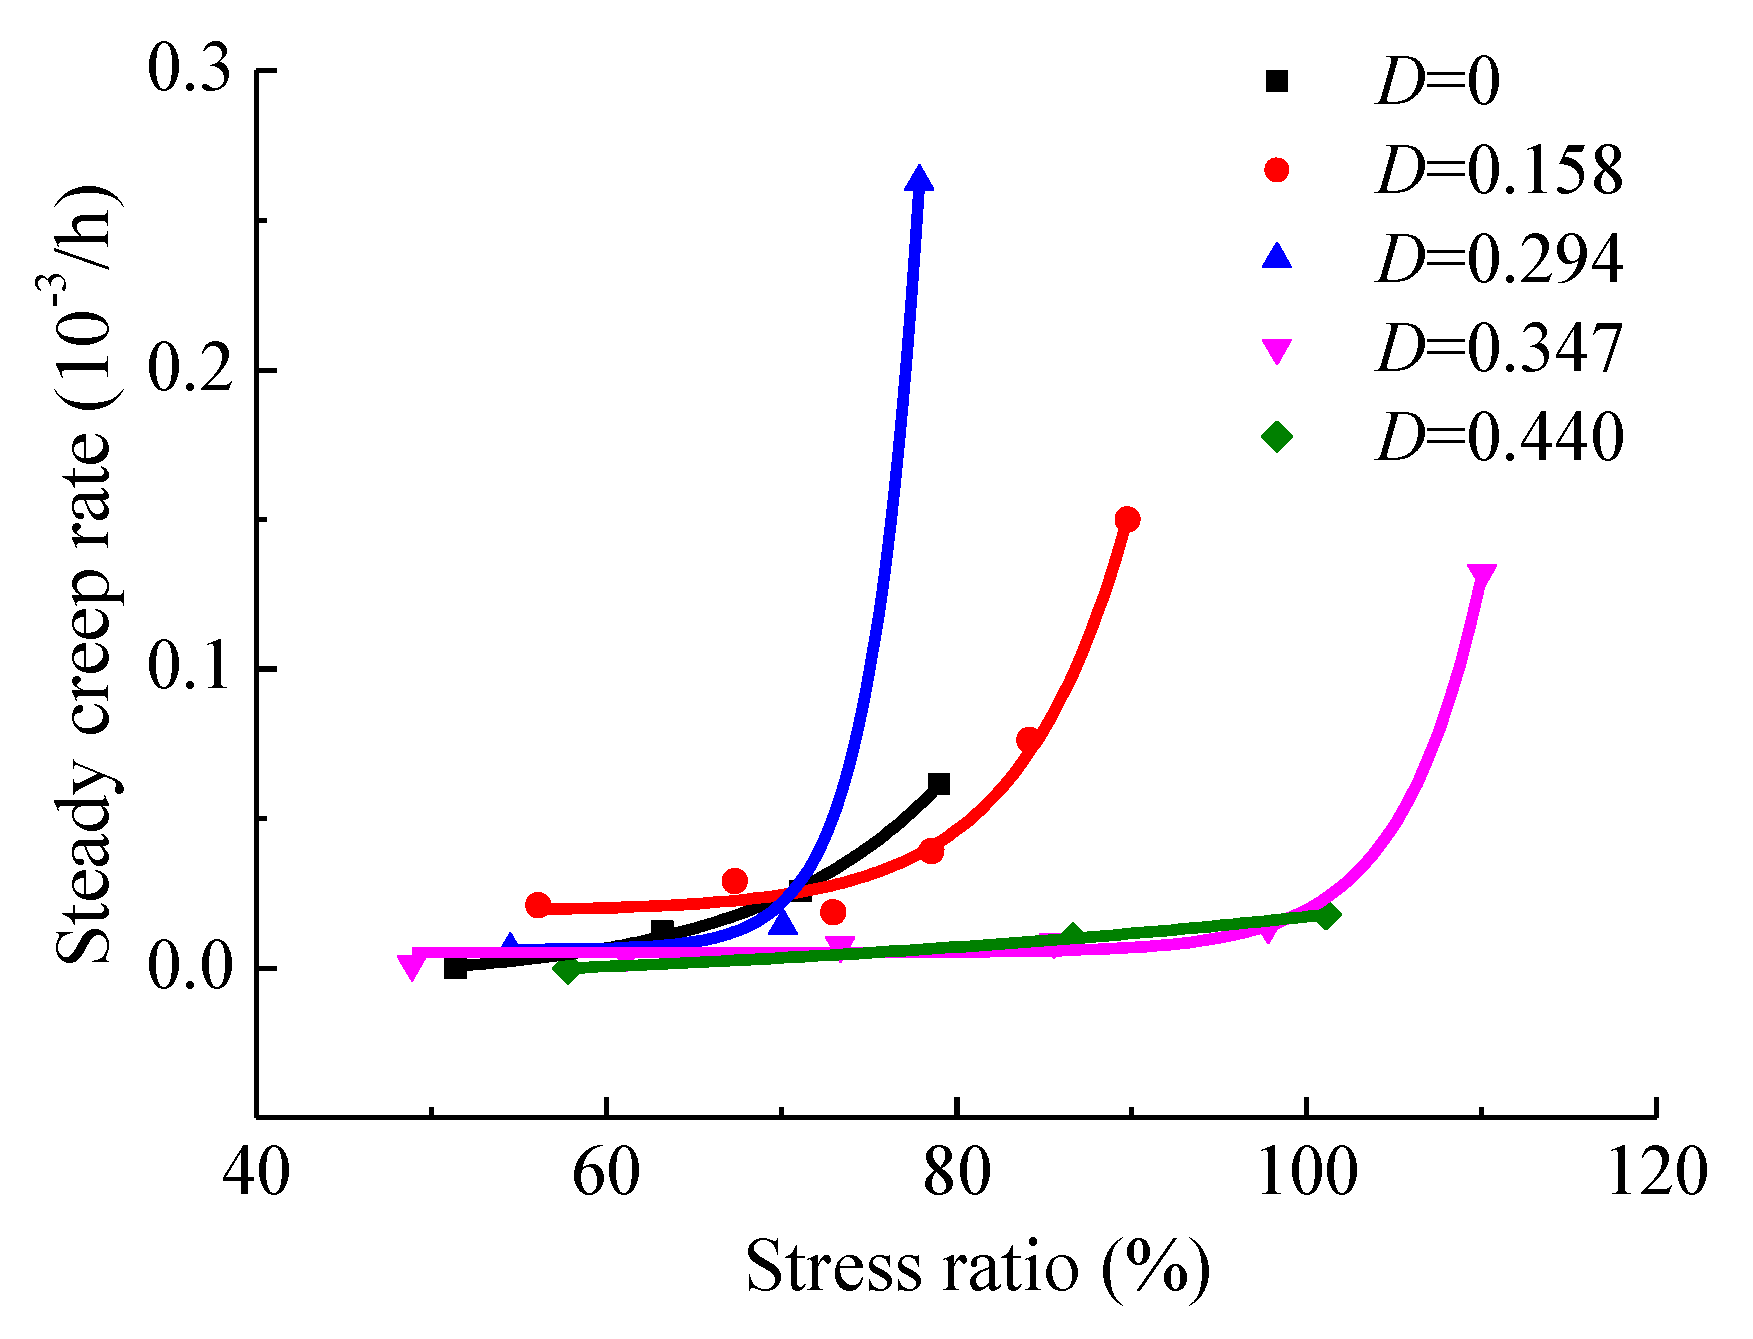
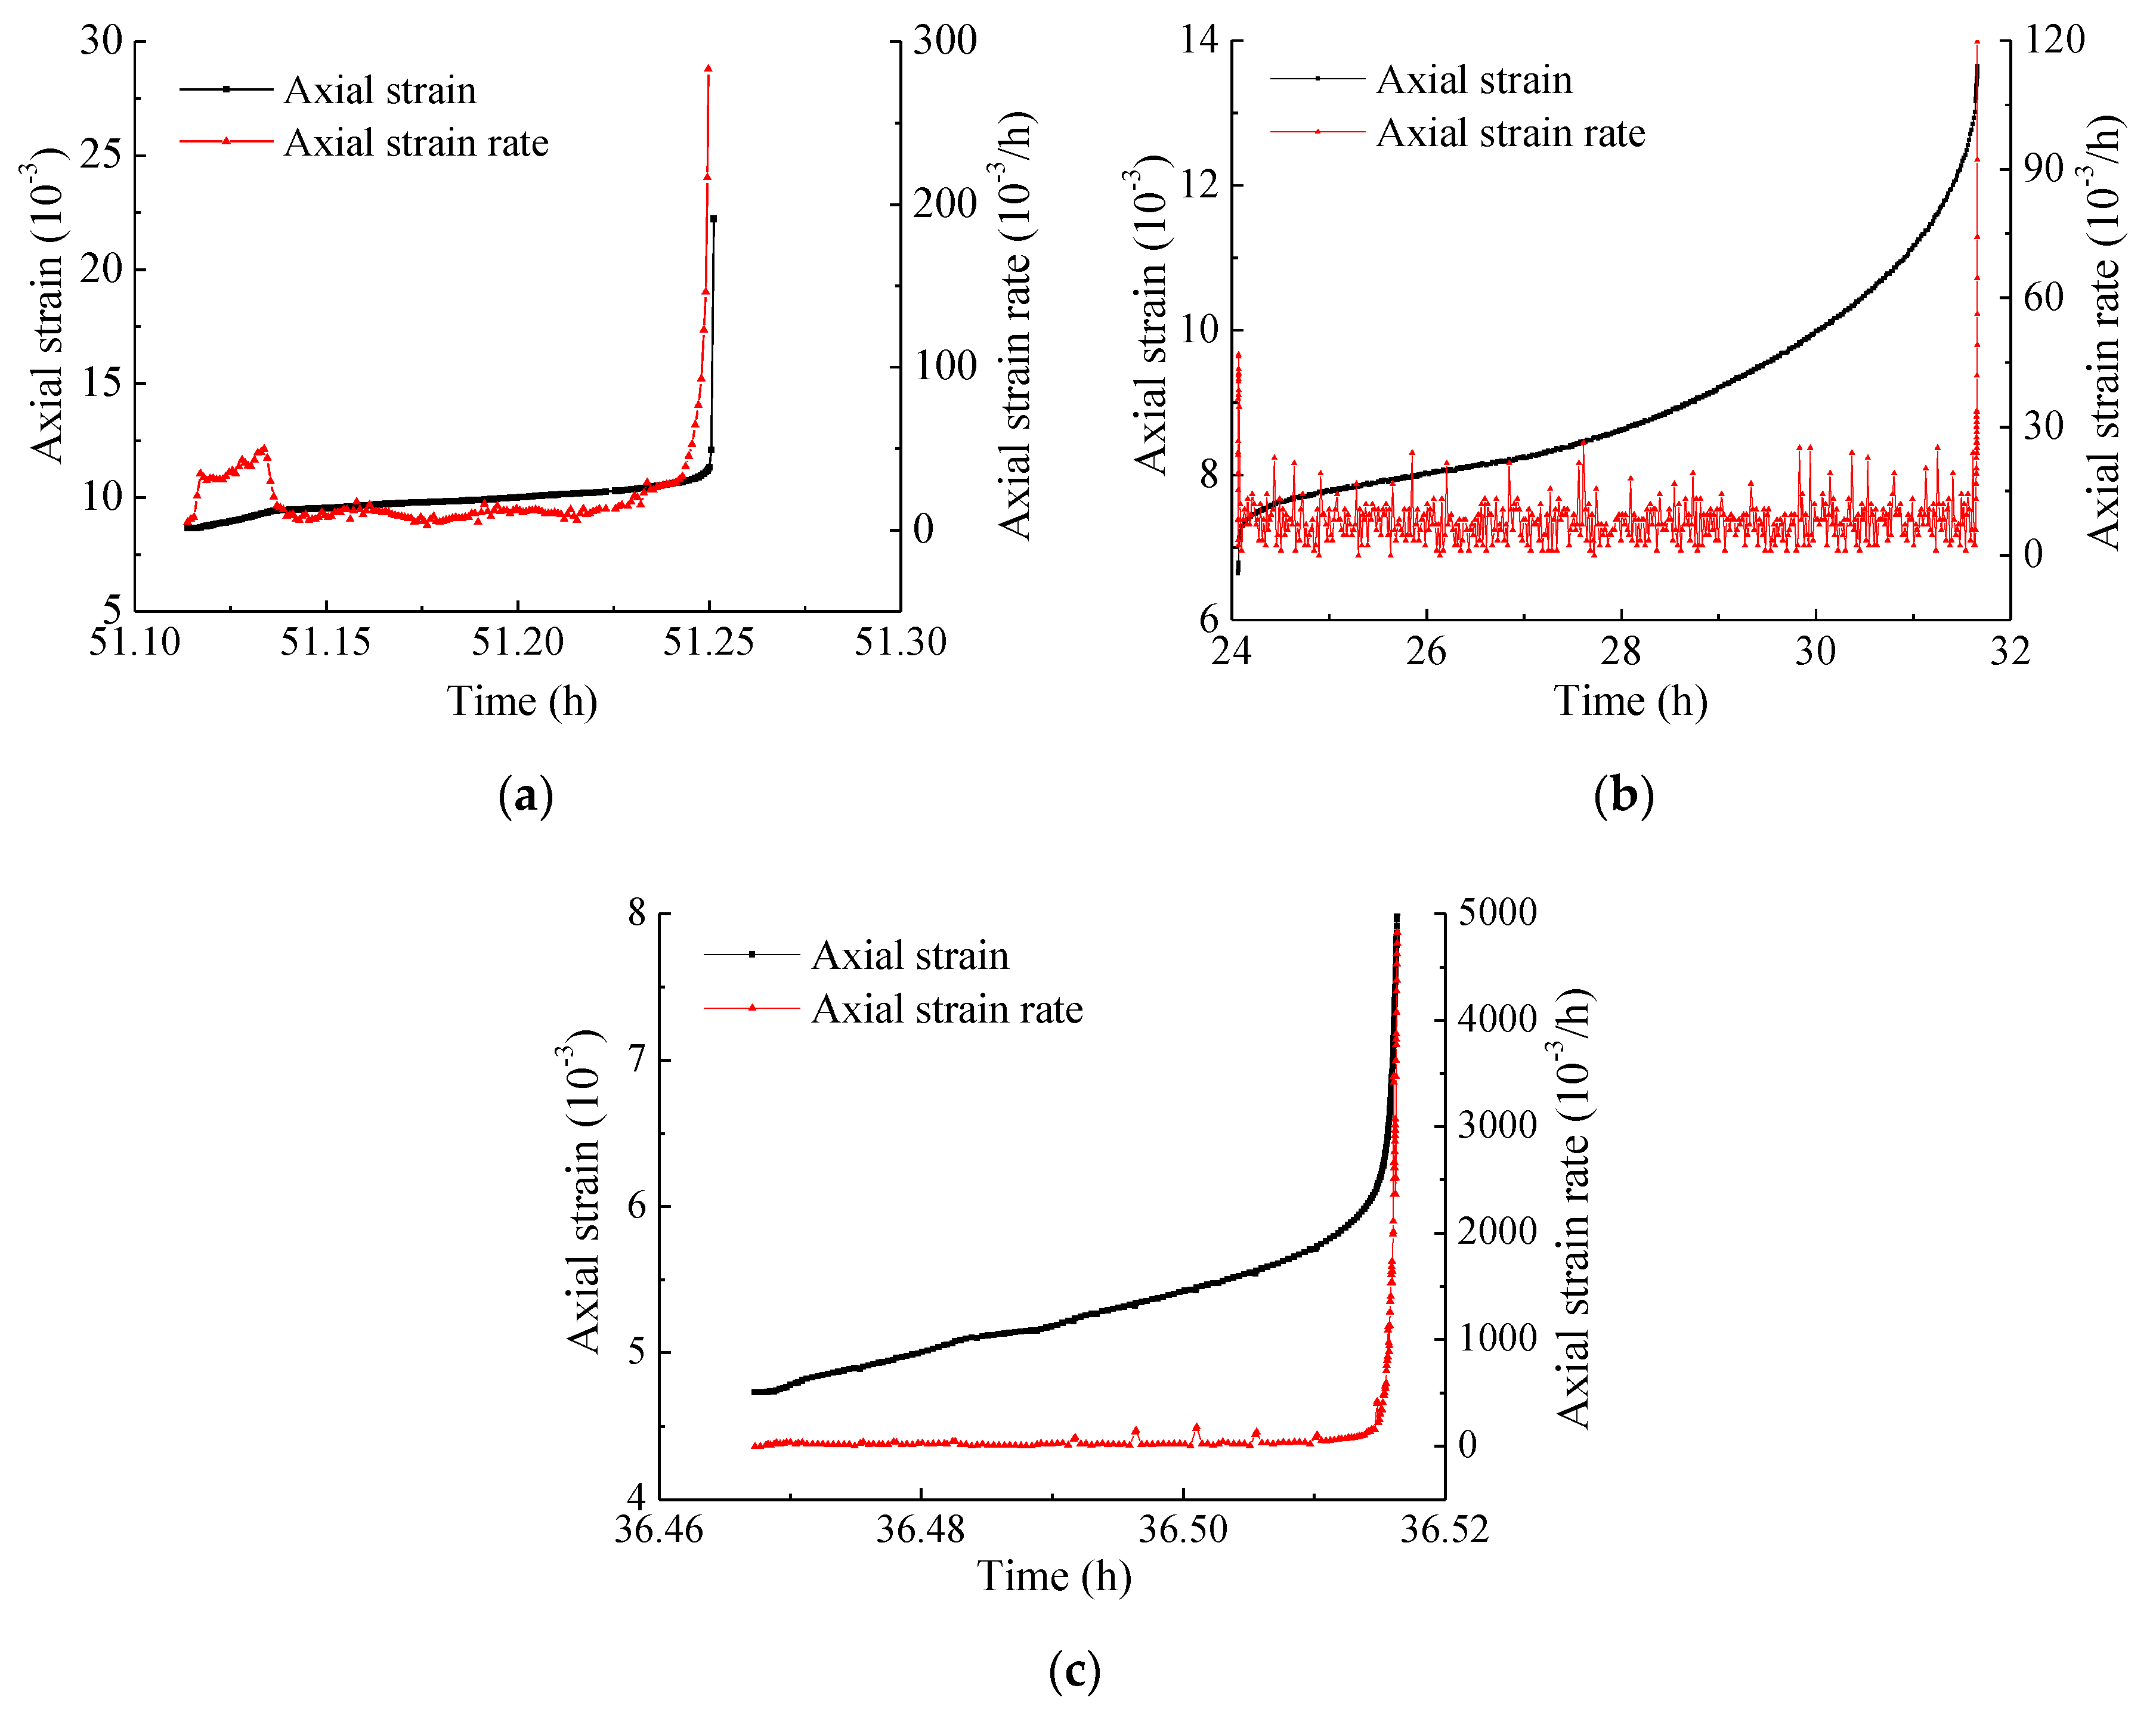
The creep deformation of fractured specimens with different degrees of damage experienced primary, steady-rate and attenuated creep stage. Steady creep rate increases with increasing differential stress, but decreases with increasing confining pressure and damage. At the final stress level, the creep deformation of specimens is mainly accelerated creep or steady creep followed by accelerated creep, resulting in the creep failure.
(4)
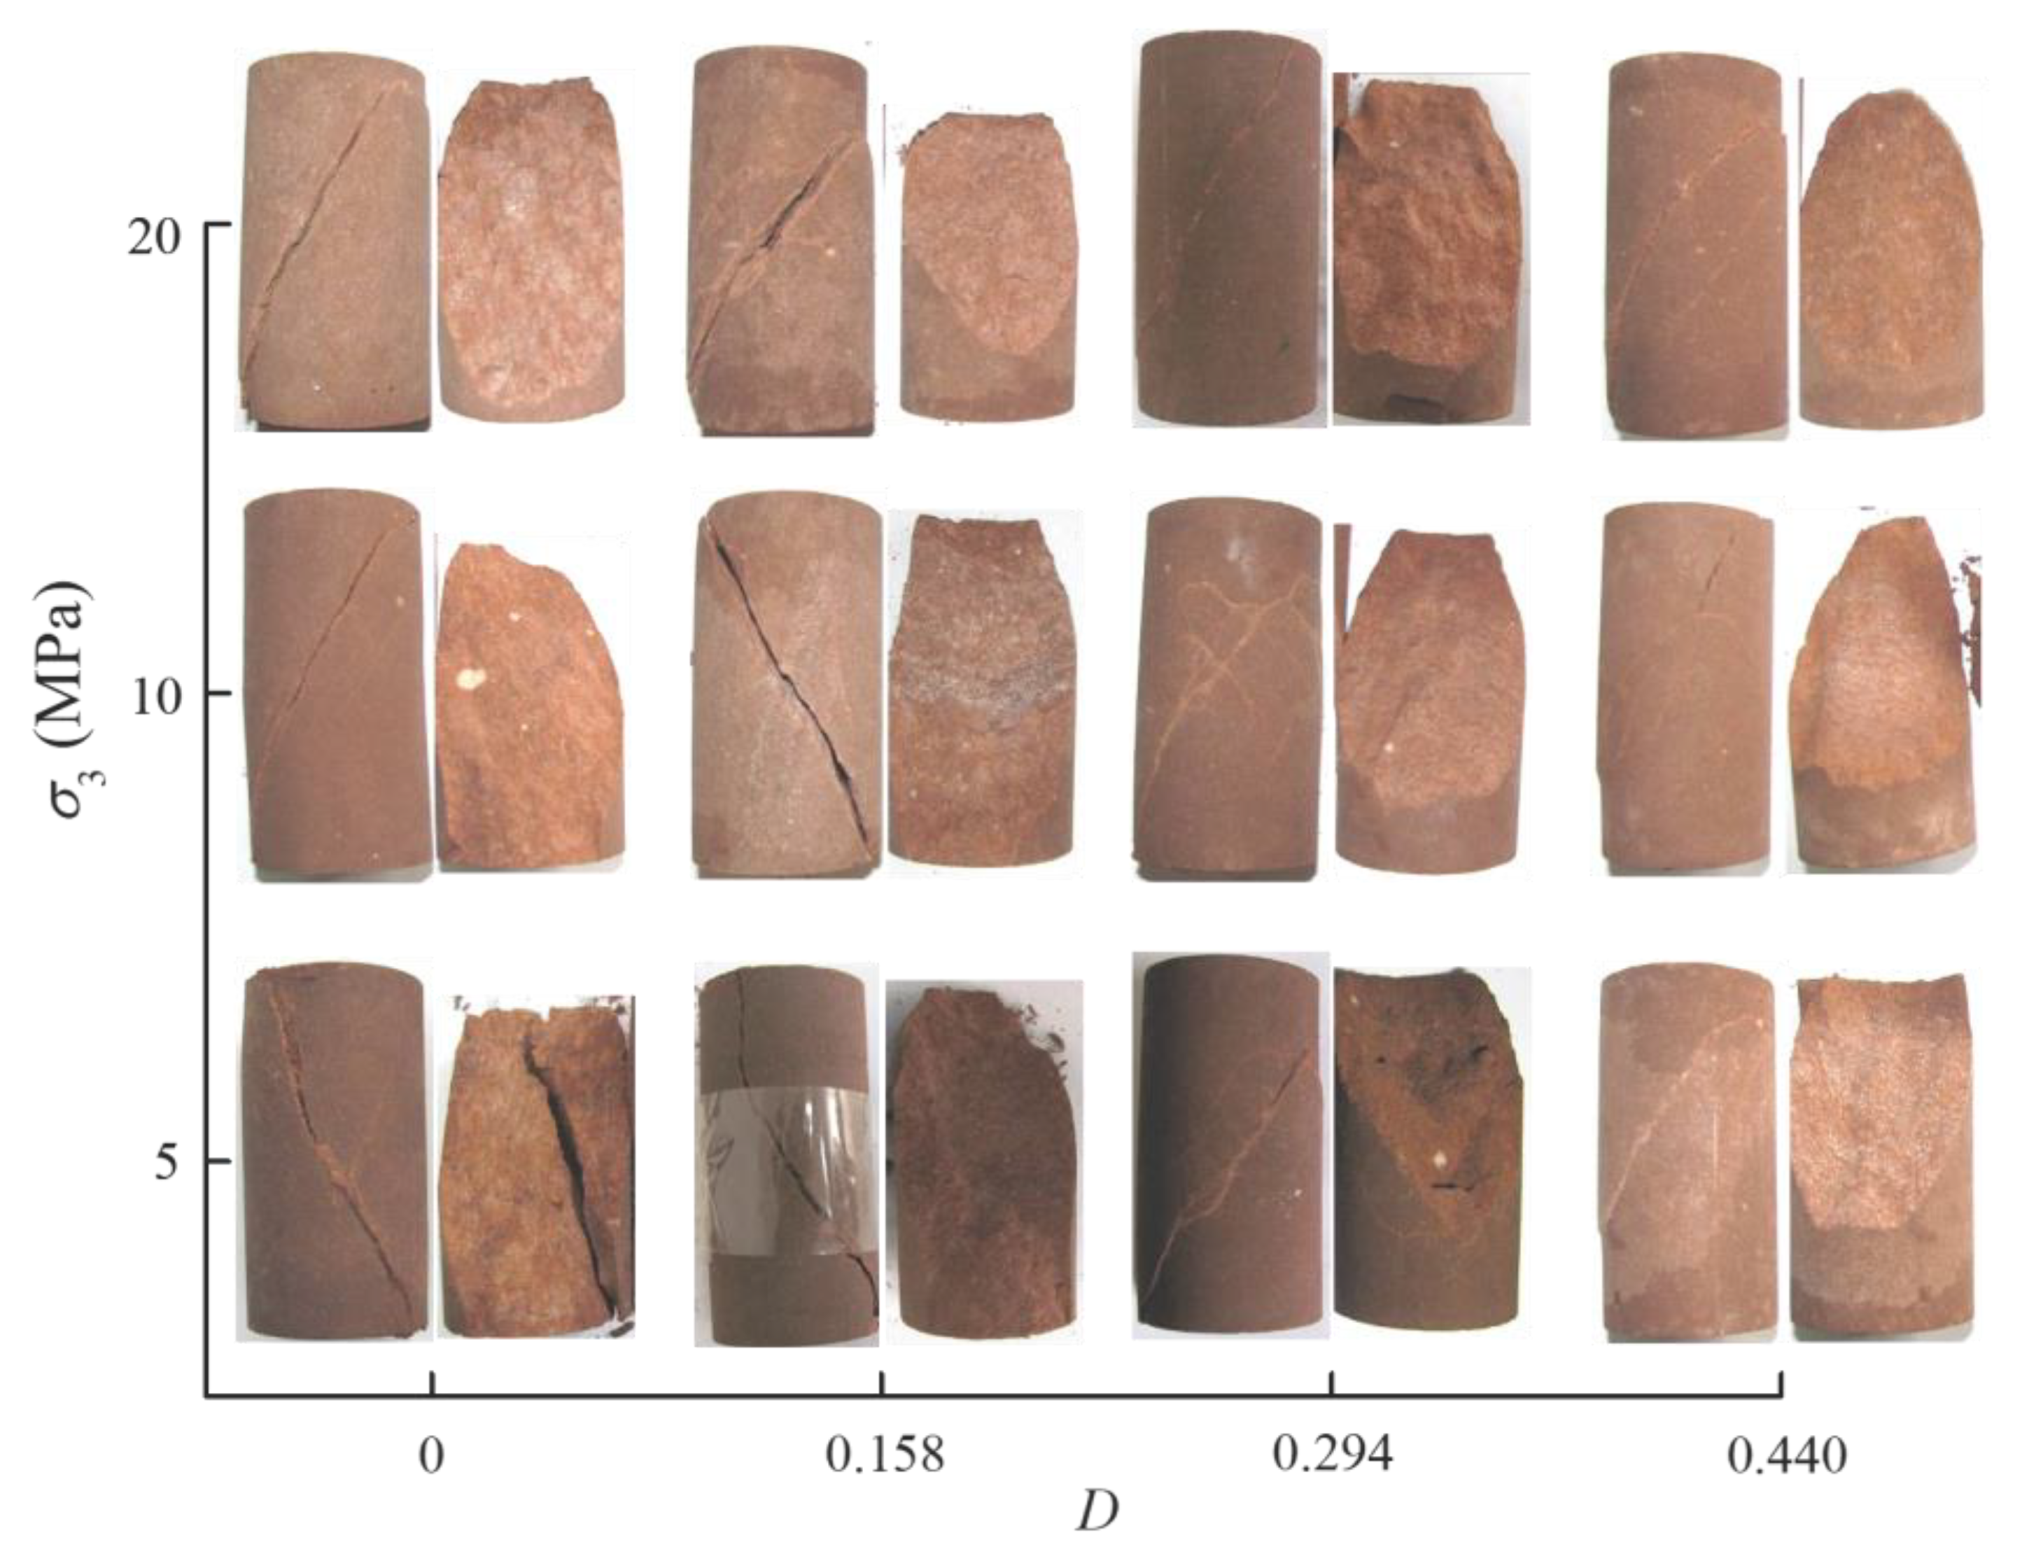
The long-term and creep failure strength of fractured specimens increases linearly with increasing confining pressure, but decrease linearly with the damage. The creep failure modes of intact and fractured specimens depend on the damage and are mainly shear failure modes, which change from typical shear failure modes to multiple shear failure modes with increasing damage.
Based on this research, the strength degradation model and creep constitutive model of fractured surrounding rock can be established in further study, which can be applied to accurately describe the post-peak mechanical properties and determine the bearing capacity and stress state of fractured surrounding rock, theoretical and numerical simulation analysis for failure mechanisms and support design of deep roadway.

Author Contributions

Conceptualization and methodology, Y.Z. and L.H.; investigation, Y.Z., Y.J., W.Z. and L.M.; formal analysis, writing-original draft preparation, Y.Z.; writing-review and editing, Y.Z and L.H. All authors have read and agreed to the published version of the manuscript.

Funding

This research was funded by the National Natural Science Foundation of China (Grant No. 51574223), the Natural Science Foundation of Jiangsu Province (Grant No. BK20160208), the University Nature Science Research Projects of Jiangsu Province (Grant No.17KJB440003), the Science and Technology Foundation of Guizhou Province (Grant No.[2018]1061), the Youth Science and Technology Talents Development Project of Guizhou Province (Grant No. KY[2017]219), the Jiangsu University Overseas Research Program and Qing Lan Project.

Acknowledgments

We thank LetPub (www.letpub.com) for its linguistic assistance during the preparation of this manuscript.

Conflicts of Interest

The authors declare no conflict of interest.

Nomenclature

DDamage variable (0 ≤ D ≤ 1)
KCorrection factor
EElastic modulus
E50Secant modulus
cEquivalent cohesion
R2Adj. R-Square
SDifferential stress
σ1Axial stress
σ3Confining pressure
σrResidual strength
σpPeak strength
σLong-term strength
σfCreep failure strength
ε1Axial strain
ε3Radial strain
εStrain
εvVolumetric strain
εvdMaximum compressive volumetric strain
εvrVolumetric strain of the starting points of the residual stage
ε1dAxial strain of the corresponding point for the maximum compressive volumetric strain
ε1pAxial strain at the peak point
ε3pRadial strain at the peak point
εvpVolumetric strain at the peak point
εoInstantaneous strain
εcCreep strain
φInternal friction angle

References

  1. Li, X.B.; Gong, F.Q.; Tao, M.; Dong, L.J.; Du, K.; Ma, C.D.; Zhou, Z.L.; Yin, T.B. Failure mechanism and coupled static-dynamic loading theory in deep hard rock mining: A review. J. Rock Mech. Geotech. Eng. 2017, 9, 767–782. [Google Scholar] [CrossRef]
  2. Xie, H.P.; Gao, M.Z.; Zhang, R.; Peng, G.Y.; Wang, W.Y.; Li, A.Q. Study on the mechanical properties and mechanical response of coal mining at 1000 m or deeper. Rock Mech. Rock. Eng. 2018, 52, 1475–1490. [Google Scholar] [CrossRef]
  3. Frantziskonis, G.; Desai, C.S. Constitutive model with strain softening. Int. J. Solids Struct. 1987, 23, 733–750. [Google Scholar] [CrossRef]
  4. Jing, L. A review of techniques, advances and outstanding issues in numerical modelling for rock mechanics and rock engineering. Int. J. Rock Mech. Min. Sci. 2003, 40, 283–353. [Google Scholar] [CrossRef]
  5. Malan, D.F. Simulation of the time-dependent behavior of excavations in hard rock. Rock Mech. Rock. Eng. 2002, 35, 225–254. [Google Scholar] [CrossRef]
  6. Bieniawski, Z.T. Mechanism of brittle fracture of rock: Parts I, II and III. Int. J. Rock Mech. Min. Sci. 1967, 4, 395–430. [Google Scholar] [CrossRef]
  7. Zhang, L.M.; Wang, Z.Q.; Li, H.F.; Sun, H. Theoretical and experimental study on siltstone brittle stress drop in post-failure region. J. Exp. Mech. 2008, 23, 234–240. [Google Scholar]
  8. Yang, S.Q.; Jing, H.W.; Cheng, L. Influences of pore pressure on short-term and creep mechanical behavior of red sandstone. Eng. Geol. 2014, 179, 10–23. [Google Scholar] [CrossRef]
  9. Han, L.J.; Yang, M.J. Re-fracture process and mechanical characteristics of cracked rock samples. Int. J. Rock Mech. Min. Sci. 2009, 46, 738–747. [Google Scholar] [CrossRef]
  10. Zhang, H.J.; Li, C.C. Effects of confining stress on the post-peak behaviour and fracture angle of fauske marble and iddeford granite. Rock Mech. Rock Eng. 2018, 52, 1377–1385. [Google Scholar] [CrossRef] [Green Version]
  11. Tiwari, R.P.; Rao, K.S. Post failure behaviour of a rock mass under the influence of triaxial and true triaxial confinement. Eng. Geol. 2006, 84, 112–129. [Google Scholar] [CrossRef]
  12. Yang, S.Q.; Jiang, Y.Z.; Xu, W.Y.; Chen, X.Q. Experimental investigation on strength and failure behavior of pre-cracked marble under conventional triaxial compression. Int. J. Solids Struct. 2008, 45, 4796–4819. [Google Scholar] [CrossRef] [Green Version]
  13. Yang, S.Q.; Huang, Y.H.; Ranjith, P.G. Failure mechanical and acoustic behavior of brine saturated sandstone containing two pre-existing flaws under different confining pressures. Eng. Fract. Mech. 2018, 193, 108–121. [Google Scholar] [CrossRef]
  14. Niu, S.J.; Jing, H.W.; Yang, X.X.; Yang, S.Q. Experimental study of strength degradation law of surrounding rock in fractured zone of deep roadway. Chin. J. Rock Mech. Eng. 2012, 31, 1587–1596. [Google Scholar]
  15. Fabre, G.; Pellet, F. Creep and time-dependent damage in argillaceous rocks. Int. J. Rock Mech. Min. Sci. 2016, 43, 950–960. [Google Scholar] [CrossRef]
  16. Ma, Z.G.; Gu, R.X.; Huang, Z.M.; Peng, G.; Zhang, L.; Ma, D. Experimental study on creep behavior of saturated disaggregated sandstone. Int. J. Rock Mech. Min. Sci. 2014, 66, 76–83. [Google Scholar] [CrossRef]
  17. Wang, Z.; Shen, M.R.; Gu, L.L.; Zhang, F. Creep behavior and long-term strength characteristics of greenschist under different confining pressures. Geotech. Test. J. 2018, 41, 55–71. [Google Scholar] [CrossRef]
  18. Zhao, J.; Feng, X.T.; Zhang, X.W.; Yang, C.X.; Zhou, Y.Y. Time-dependent behaviour and modeling of Jinping marble under true triaxial compression. Int. J. Rock Mech. Min. Sci. 2018, 110, 218–230. [Google Scholar] [CrossRef]
  19. Bieniawski, Z.T. Time-dependent behaviour of fractured rock. Rock Mech. 1970, 2, 123–137. [Google Scholar] [CrossRef]
  20. Guo, C.Y.; Xian, X.F.; Jiang, Y.D.; Tang, H.M.; Yao, W.J. Experimental research on creep of fractured sandstone. Chin. J. Rock Mech. Eng. 2009, 29, 990–995. [Google Scholar]
  21. Hamza, O.; Stace, R. Creep properties of intact and fractured muddy siltstone. Int. J. Rock Mech. Min. Sci. 2018, 106, 109–116. [Google Scholar] [CrossRef] [Green Version]
  22. Niu, S.J.; Dang, Y.H.; Feng, W.L.; Yang, D.F. Uniaxial experimental study of creep properties of sandstone in damage and fracture states. Rock Soil Mech. 2016, 37, 1249–1258. [Google Scholar]
  23. Yang, S.Q.; Jing, H.W.; Wang, S.Y. Experimental investigation on the strength, deformability, failure behavior and acoustic emission locations of red sandstone under triaxial compression. Rock Mech. Rock Eng. 2018, 45, 583–606. [Google Scholar] [CrossRef]
  24. Yang, S.Q.; Liu, X.R.; Jing, H.W. Experimental investigation on fracture coalescence behavior of red sandstone containing two unparallel fissures under uniaxial compression. Int. J. Rock Mech. Min. Sci. 2013, 63, 82–92. [Google Scholar] [CrossRef]
  25. Duda, M.; Renner, J. The weakening effect of water on the brittle failure strength of sandstone. Geophys. J. Int. 2013, 192, 1091–1108. [Google Scholar] [CrossRef] [Green Version]
  26. Yang, D.F.; Zhang, D.Y.; Niu, S.J.; Dang, Y.H.; Feng, W.L.; Ge, S.S. Experiment and study on mechanical property of sandstone post-peak under the cyclic loading and unloading. Geotech. Geol. Eng. 2018, 36, 1609–1620. [Google Scholar] [CrossRef]
  27. Liu, J.F.; Wang, L.; Pei, J.L.; Zheng, L.; Bian, Y. Experimental study on creep deformation and long-term strength of unloading-fractured marble. Eur. J. Environ. Civ. Eng. 2015, 19, s97–s107. [Google Scholar]
  28. Zong, Y.J.; Han, L.J.; Wei, J.J.; Wen, S.Y. Mechanical and damage evolution properties of sandstone under triaxial compression. Int. J. Min. Sci. Technol. 2016, 26, 601–607. [Google Scholar] [CrossRef]
  29. Zong, Y.J.; Han, L.J.; Meng, Q.B.; Wang, Y.C. Strength properties and evolution laws of cracked sandstone samples in re-loading tests. Int. J. Min. Sci. Technol. 2019. [Google Scholar] [CrossRef]
  30. Fairhurst, C.E.; Hudson, J.A. Draft ISRM suggested method for the complete stress-strain curve for the intact rock in uniaxial compression. Int. J. Rock Mech. Min. Sci. 1999, 36, 279–289. [Google Scholar]
  31. Zhang, Y.; Shao, J.F.; Xu, W.Y.; Jia, Y. Time-dependent behavior of cataclastic rocks in a multi-loading triaxial creep test. Rock Mech. Rock Eng. 2016, 49, 3793–3803. [Google Scholar] [CrossRef]
  32. Yang, S.Q.; Jiang, J.Z. Triaxial mechanical creep behavior of sandstone. Min. Sci. Technol. 2010, 20, 339–349. [Google Scholar] [CrossRef]
  33. Vaneghi, R.G.; Ferdosi, B.; Okoth, A.D.; Kuek, B. Strength degradation of sandstone and granodiorite under uniaxial cyclic loading. J. Rock Mech. Geotech. Eng. 2018, 10, 117–126. [Google Scholar] [CrossRef]
  34. Niu, S.J.; Ge, S.S.; Yang, D.F.; Dang, Y.H.; Yu, J.; Zhang, S. Mechanical properties and energy mechanism of saturated sandstones. J. Cent. South Univ. Technol. 2018, 25, 1447–1463. [Google Scholar] [CrossRef]
  35. Alonso, E.; Alejano, L.R.; Varas, F.; Fdez-Manin, G.; Carranza-Torres, C. Ground response curves for rock masses exhibiting strain-softening behavior. Int. J. Numer. Anal. Methods Geomech. 2003, 27, 1153–1185. [Google Scholar] [CrossRef]
  36. Pourhosseini, O.; Shabanimashcool, M. Development of an elasto-plastic constitutive model for intact rocks. Int. J. Rock Mech. Min. Sci. 2014, 66, 1–12. [Google Scholar] [CrossRef]
  37. Xu, P.; Yang, S.Q. Permeability evolution of sandstone under short-term and long-term triaxial compression. Int. J. Rock Mech. Min. Sci. 2016, 85, 152–164. [Google Scholar] [CrossRef]
  38. Shen, M.R.; Chen, H.J. Testing study of long-term strength characteristics of red sandstone. Rock Soil Mech. 2011, 32, 3301–3305. [Google Scholar]
  39. Zhang, Q.Y.; Yang, W.D.; Chen, F.; Li, W.G.; Wang, J.H. Long-term strength and microscopic failure mechanism of hard brittle rocks. Chin. J. Geotech. Eng. 2011, 33, 1910–1918. [Google Scholar]
Figure 1. X-ray diffraction analysis of red sandstone.
Energies 13 00598 g001
Figure 2. TAW-2000 servo-controlled rock mechanics system. (a) TAW-2000; (b) Specimen and extensometers.
Energies 13 00598 g002
Figure 3. Desired unloading points on the complete stress-strain curve of the fractured specimens.
Energies 13 00598 g003
Figure 4. Stress-strain curves during the preparation of fractured specimens.
Energies 13 00598 g004
Figure 5. Stress-strain curves of fractured specimens with different degrees of damage. (a) σ3 = 5 MPa; (b) σ3 = 10 MPa; (c) σ3 = 20 MPa.
Energies 13 00598 g005
Figure 6. Effect of confining pressure and damage on the peak strength of fractured specimens. (a) Effect of confining pressure on the peak strength; (b) Effect of damage on the peak strength.
Energies 13 00598 g006
Figure 7. Effect of damage on the equivalent cohesion of fractured specimens.
Energies 13 00598 g007
Figure 8. Failure modes of fractured specimens with different degrees of damage.
Energies 13 00598 g008
Figure 9. Effect of damage on the elastic modulus of fractured specimens.
Energies 13 00598 g009
Figure 10. Typical triaxial creep test curves of intact specimens. (a) σ3 = 5 MPa; (b) σ3 = 10 MPa; (c) σ3 = 20 MPa.
Energies 13 00598 g010
Figure 11. Typical triaxial creep test curves of fractured specimens (D = 0.158). (a) σ3 = 5 MPa; (b) σ3 = 10 MPa; (c) σ3 = 20 MPa.
Energies 13 00598 g011aEnergies 13 00598 g011b
Figure 12. Typical triaxial creep test curves of fractured specimens (D = 0.294). (a) σ3 = 5 MPa; (b) σ3 = 10 MPa; (c) σ3 = 20 MPa.
Energies 13 00598 g012
Figure 13. Typical triaxial creep test curves of fractured specimens (D = 0.347) at σ3 = 5 MPa.
Energies 13 00598 g013
Figure 14. Typical triaxial creep test curves of fractured specimens (D = 0.440). (a) σ3 = 5 MPa; (b) σ3 = 10 MPa; (c) σ3 = 20 MPa.
Energies 13 00598 g014
Figure 15. Effect of stress ratio on instantaneous axial strain of fractured specimens at σ3 = 5 MPa.
Energies 13 00598 g015
Figure 16. Effect of stress ratio (S/σp) on steady creep rate of fractured specimens at σ3 = 5 MPa.
Energies 13 00598 g016
Figure 17. Accelerated creep rate of fractured specimens with different degrees of damage at σ3 = 5 MPa. (a) D = 0; (b) D = 0.294; (c) D = 0.440.
Energies 13 00598 g017
Figure 18. Stress-strain isochronal curves of the specimens at D = 0 and σ3 = 10 MPa.
Energies 13 00598 g018
Figure 19. Effect of confining pressure on long-term strength and creep failure strength of fractured specimens with different degrees of damage. (a) Long-term strength (σ); (b) Creep failure strength (σf).
Energies 13 00598 g019
Figure 20. Effect of damage on long-term strength and creep failure strength of fractured specimens with different degrees of damage. (a) Long-term strength (σ); (b) Creep failure strength (σf).
Energies 13 00598 g020
Figure 21. Creep failure modes of fractured specimens with different degrees of damage.
Energies 13 00598 g021
Table 1. Mechanical parameters of the specimens at the unloading points.
SpecimenDesign Unloading PointsActual Unloading PointsStrain at Unloading Points (10−3)Damage at Unloading Points
Stress
(MPa)
Location on CurveStress
(MPa)
Percentage of Strength (%)AxialRadialVolumetricActual Damage Average Damage
T-4177.24Peak point177.51100.1515.25−20.53−25.810.158 0.158
T-5177.1999.9714.54−20.12−25.700.157
T-6177.27100.0214.36−20.08−25.800.158
R-4176.9599.8414.25 −19.88 −25.50 0.156
R-5177.84100.3414.99 −20.53 −26.08 0.160
R-6178.11100.4914.59−20.17−25.750.158
T-7159.5290% post-peak159.4389.8917.71−33.12−48.530.297 0.294
T-8162.8089.9318.22−32.23−46.240.283
T-9159.2589.3118.19−33.67−49.150.301
R-7158.7889.6417.32 −32.41 −47.50 0.291
R-8160.8090.3617.49−32.67−47.850.293
R-9159.7090.2218.44−33.43−48.420.296
T-10141.7980% post-peak142.2180.1719.62−37.13−54.640.334 0.347
T-11142.0580.0319.5−38.90−58.300.357
T-12141.8480.0218.96−38.17−57.380.351
R-10141.6379.9418.71−37.62−56.530.346
R-11142.0080.2219.09−38.02−56.940.348
T-13100.20Starting point of residual stage101.4656.0421.16−46.54−71.920.440 0.440
T-14101.3357.2422.80−46.86−70.920.434
T-15100.9256.5421.69−46.41−71.130.435
R-13102.1957.4021.01 −46.76 −72.51 0.443
R-14102.4057.9024.06 −48.58 −73.10 0.447
R-15100.6256.7723.76 −48.01 −72.26 0.442
Table 2. Mechanical parameters of fractured specimens with different degrees of damage.
SpecimenDσ3 (MPa)σp (MPa)σr (MPa)E (GPa)E50 (GPa)ε1p (10−3)ε3p (10−3)εvp (10−3)
T-105126.5458.1414.7314.7610.56−19.86−29.17
T-210137.6959.7314.8114.9711.31−12.63−13.91
T-320171.5376.1516.2817.1513.63−15.41−17.19
T-40.158589.1044.8210.1610.319.92−27.15−44.39
T-510106.4345.4411.4811.3210.00−20.18−30.37
T-620140.6373.4513.2513.1313.20−24.53−35.86
T-70.294564.2044.957.697.7710.77−33.01−55.24
T-81088.5151.439.879.7710.89−25.64−40.39
T-920112.0676.3711.7911.3812.54−25.29−38.04
T-100.347540.9022.016.156.1610.84−21.33−31.82
T-111070.9441.788.978.838.61−18.15−27.68
T-122093.7168.8611.0310.8812.11−20.00−38.79
T-130.440534.6236.436.396.465.63−7.51−9.39
T-141051.3763.137.927.877.14−10.16−13.19
T-152063.9775.8911.1310.795.69−6.76−12.94
Table 3. Strength parameters of fractured specimens.
Dc (MPa)φ (°)
031.3130.52
0.15719.1733.93
0.29414.8430.97
0.3477.9933.12
0.44010.4717.06
Table 4. Pre-confirmed stress levels of fractured specimens in triaxial creep tests.
SpecimenDσ3 (MPa)σp (MPa)S1 (MPa)S2 (MPa)S3 (MPa)S4 (MPa)S5 (MPa)S6 (MPa)
R-105126.54658090100110/
R-210137.69100115125///
R-320171.53115125135140145150
R-40.158589.10506065707580
R-510106.43708595105110115
R-620140.63100110120125//
R-70.294564.20354550///
R-81088.51607075808590
R-920112.06708090100105/
R-100.347540.90202530354045
R-130.440534.6220303540//
R-141051.37253035404550
R-152063.97354045505560
Notes: S is the differential stress, i.e., S = σ1-σ3; triaxial creep test R-15 was performed for 11 stress levels resulting from strain hardening behavior, and S7, S8, S9, S10, and S11 were 65, 70, 75, 80, and 85 MPa, respectively.
Table 5. Triaxial creep strain (unit: 10−3) of fractured specimens.
SpecimenDσ3
(MPa)
S1S2S3S4S5S6
εoεcεoεcεoεcεoεcεoεcεoεc
R-1054.5910.0520.8200.3560.5500.4930.5511.2380.70648.740//
R-2105.8620.2740.8150.7380.53349.880//////
R-3207.1810.1310.4580.3510.5450.6200.1780.5050.1800.6800.21322.228
R-40.15855.2690.5020.5830.3230.3310.5900.2980.6650.2750.8960.30032.346
R-5105.7960.1320.6570.4080.4450.2430.4810.2360.2830.3820.3008.357
R-6207.1410.1700.5530.3840.5141.0030.2027.620////
R-70.29455.4090.3270.4280.4760.3816.757//////
R-8105.9390.2650.8110.3440.2910.3460.3130.3820.3070.6450.29612.148
R-9206.3870.0870.6550.3220.6560.3910.6400.6320.5818.687//
R-100.34752.6060.2450.4830.2160.4160.2840.4420.3410.3950.4560.42214.879
R-130.44052.5240.0270.4170.9040.3950.4640.5022.824////
R-14103.7180.2960.3890.3320.3920.3410.4090.4710.3180.6510.41813.983
R-15202.8420.1290.2420.1870.2600.1840.2700.2240.2620.2250.2870.475
S7S8S9S10S11/
0.2322.5380.2885.0950.2584.2630.2624.3270.2756.575

