Article

Sulfur Conversion of Mixed Coal and Gangue during Combustion in a CFB Boiler

School of Energy, Power and Mechanical Engineering, North China Electric Power University, Beijing 02206, China
*
Author to whom correspondence should be addressed.
Energies 2020, 13(3), 553; https://doi.org/10.3390/en13030553
Submission received: 18 December 2019 / Revised: 8 January 2020 / Accepted: 22 January 2020 / Published: 23 January 2020

Abstract

:
The construction of a power plant using a 660 MWe supercritical circulating fluidized bed (CFB) boiler with co-combustion of coal and gangue has been proposed in China. Therefore, this study simulated the distribution law and transformation mechanism of sulfur-containing phases using three low-calorific samples of gangue and coal mixtures under different conditions, based on the thermodynamic simulation software HSC Chemistry. The results showed that sulfur low in calorific value coal is mainly converted into gas phase SO2, solid phase alkali metal sulfate (Na2SO4 and K2SO4), and alkaline earth metal sulfate (CaSO4 and MgSO4) in an oxidizing atmosphere. Under a reductive atmosphere, sulfur in coal is mainly converted into gaseous H2S, COS (Carbon oxysulfide), and solid FeSx. With an increase in the O/C ratio, the distribution curve of sulfur-containing substances contracted to lower temperatures. It was established that the sulfur fixation capacity of coal ash depends on the relative amounts of basic oxides and sulfur present in it. Relevant conclusions were also verified and compared to those of the laboratory small-fluidized bed test bench and the 3 MWth CFB combustion test bench.

1. Introduction

Approximately 30 million tons of coal gangue are produced annually in the Pingshuo area of Shanxi, China. Thus, two 660 MWe supercritical circulating fluidized bed (CFB) boilers have been proposed to burn the mixture of coal and gangue [1].
Middling is coal that has an ash content between clean coal and gangue after coal washing. Its volatile content is about 10–15% and its ash content is about 30–40% [2]. Coal gangue is a carbonaceous rock produced by coal during the washing process. It is characterized by a large amount of SiO2 and Al2O3, and metal oxides such as Fe2O3, CaO, and MgO. The sulfur content of coal gangue is within 1–3%, which is classified as medium-high sulfur coal. Its output accounts for about 10–20% of the raw coal output [3]. Generally, gangue with a calorific value higher than 1200 kcal is used to generate electricity by blending it with a certain proportion of medium-calorific value fuel (coal slime or middling) [4]. The main feature of CFB boilers is the multiple cycles of fuel, repeated low-temperature combustion, and long combustion time, which is very suitable for burning low-calorie coal with a high sulfur content [1].
However, with the country’s stricter requirements for SO2 emissions, most CFB units cannot meet the SO2 control requirements specified in the standard [5,6]. The existence of sulfur in coal has a great influence on the precipitation characteristics of sulfur when coal is burned in a fluidized bed. Thus, it is very important to study the transformation rules of sulfur in low calorific value coal in circulating fluidized beds (CFB) [7,8,9,10].
A large number of studies have shown that oxygen-enriched combustion can comprehensively treat pollutants such as CO, NOx, and SO2 [11], and the desulfurization efficiency after calcium injection can reach 90% [12]. Researchers have found that the combination of CFB technology and oxygen-enriched combustion can achieve the dual purpose of improving combustion efficiency and good control of pollutants, such as the FW company in the United States [13] and the Canadian Energy Technology Center [14,15,16]. During the combustion and circulation process, the materials in the CFB boiler experiences the alternating state of the local reducing atmosphere in the dense phase zone and the oxidizing atmosphere in the lean phase zone. Anders Lyngfelt [17] studied the decomposition characteristics of CaSO4 under different CO concentrations and the conversion between CaS and CaSO4 in an alternating atmosphere. In addition, under high temperature (above 1570 K) oxidizing atmosphere, the conventional sulfur-fixing product CaSO4 cannot exist stably, due to decomposition. The calcium-based sulfur-fixing reaction begins to form a complex salt–calcium sulfoaluminate (3CaO • 3Al2O3 • CaSO4, referred to as C4A3S).
Relevant research also shows that furnace temperature, residence time, coal particle size, and airflow are among the factors that affect sulphur precipitation during coal combustion [18,19]. Moreover, bed temperature, Ca/S ratio, limestone particle size, circulation ratio, and fluidization rate are among the factors that affect sulfur fixation [20]. By tracing the gas concentration at a combustion temperature of 1570 K, Lyngleft [17] established oxygen consumption, volumetric CaS production, and the reductive decomposition product of CaSO4 as the main factors affecting sulfur fixation efficiency. Desulfurization is defined as the reaction between CaO and SO2 [21,22,23]. Owing to the sulfur self-fixation capacity of the mineral, an increase in oxygen concentration promotes the conversion of sulfur to sulfate instead of gaseous SO2 in coal.
At present, there are few studies on the sulfur conversion characteristics of mixed coal and gangue during co-combustion in a CFB through simulation. Therefore, this study simulated and verified the distribution rule and transformation mechanism of sulfur in experimental coal samples under different conditions, through the thermodynamic simulation software HSC Chemistry, using a small fluidized bed test bench and a 3 MWth CFB combustion test bed. The SOx emission characteristics and sulfur consolidation rule when burning low calorific value coal [24] are also studied. In addition, this study aims to provide references for the design of a CFB boiler for a 660 MWe unit and to aid the selection of a pollutant control scheme.

2. Materials and Methods

2.1. Coal Quality Analysis of Design Coal

The design coal for the supercritical 600 MWe CFB boiler was middling and was combined with two kinds of gangue. Table 1 shows the chemical analysis of the gangue, middling, and the two kinds of mixed coal based on “as received basis”. Sample coal I and II were, respectively, mixed from middling with gangue I and gangue II. The sulfur content of the middling and gangue was within the range of 1–3%, which can be classified as medium and high-sulfur coal. The oxygen content was higher than that of the power coal used in China; hence, it was necessary to consider the experimental influence of the relative amount of C and O in the coal sample.
The two kinds of gangue used had nearly similar ash contents and proportions of alkaline metal oxides, while the difference of the sulfur fraction was significantly larger. Therefore, the relative proportion of alkaline oxides, such as calcium, magnesium, kalium, and sodium , in the ash and sulfur, varied greatly after they were mixed with the middling. In the thermodynamic simulation, we thought that the contact was sufficient, the reaction time was long enough, and the reaction was sufficient. We could choose the reaction and equilibrium phase components that occurred in different situations according to the simulation conditions. Therefore, the molar ratios of the four alkaline oxides in relation to sulfur in coal were as follows:
Calcium - sulfur   mol   ratio = 0.005714 × A ar × CaO S ,
Magnesium - sulfur   mol   ratio = 0.008 × A ar × MgO S ,
Kalium - sulfur   mol   ratio = 0.00681 × A ar × K 2 O S ,
Sodium - sulfur   mol   ratio = 0.010323 × A ar × Na 2 O S ,
where A ar is the ash content of the coal sample, CaO, MgO, K2O, and Na2O are the percentages of the corresponding substances in the ash, respectively, and S is the total sulfur of the coal sample. The alkaline-oxide/S ratio is the sum of the molar ratios of the basic oxides of calcium, magnesium, kalium, and sodium to sulfur. The results of these equations are shown in Table 2.

2.2. Thermodynamic Equilibrium Calculation of Sulfur-Containing Substances

The bed material in the CFB boiler was divided into a dense phase region and a diluted phase region in the lower and upper regions, respectively. The dense phase region was entirely in a reducing atmosphere, while the diluted phase region was in an oxidizing atmosphere. These difference in the atmosphere resulted in different mechanisms of sulfur precipitation and different sulfur-containing substances [25].
Using the HSC Chemistry thermodynamic database, the types of reactants, number of moles, and stable phases that might have occurred during the reaction were given as inputs to obtain the equilibrium phase composition curve under certain temperatures and pressures. This software was mainly based on the Gibbs minimum energy principle and obtained the equilibrium composition of the system response under the premise of meeting the mass conservation. The distributions of sulfur-containing substances with contents greater than 10−5 mol were investigated in the material system after calculation.

2.2.1. Mechanism of Sulfur Evolution during Coal Combustion

Inorganic sulfur [26] in fuel comes from various sulfur compounds in the mineral. Under an oxidizing atmosphere, pyrite sulfur can be directly converted into SO2.
4FeS2 + 11O2 = 2Fe2O3 + 8SO2
Under a reducing atmosphere, FeS2 will undergo decomposition reaction:
2FeS2 = 2FeS + S2
2FeS2 + H2 = FeS + H2S
FeS2 + CO = FeS + COS
Organic sulfur [27] components in coal combustion are more complex with their main forms of thiol R-SH, thioether R-S-R, thiophene-containing aromatic system, thioxanthone, and disulfide RSSR. In an oxidizing atmosphere, they are all oxidized to SO2:
RHS + O2 = RS+HO2
RS + O2 = R + SO2
In a reductive atmosphere of aerobic combustion, organic sulfur is converted to H2S and COS. The elemental sulfur [28] in the coal enters the sulfide flame in the form of sulfur vapor when heated:
SS = S7 + S
S + O2 = SO + O
SS + O = SO + S6 + S
The following reactions occur when SO encounters oxygen:
SO + O2 = SO2 + O
SO + O = SO2

2.2.2. Model Simplification and Simulation of Coal

During simulation, coal was simplified as a combination of organic elements (C, H, O, N, and S) and inorganic minerals [29]. The simulated pressure was set to 0.1 MPa, which was close to the furnace pressure when the CFB boiler was running. The simulated temperature range was selected from 700 to 1600 K, including the CFB operation temperature range of 1100 to 1300 K, and the excess air ratio was 1.2. For convenience during calculation, the initial total amount of sulfur was set to 1 mol, and those of other substances were calculated according to their respective mass percentage in coal, as shown in Table 3. After simulation, the corresponding SO2 release value σ and the rate of solid sulfur η = 1 σ were obtained from the three coal samples under 1270 K. Table 4 shows the calculation results.

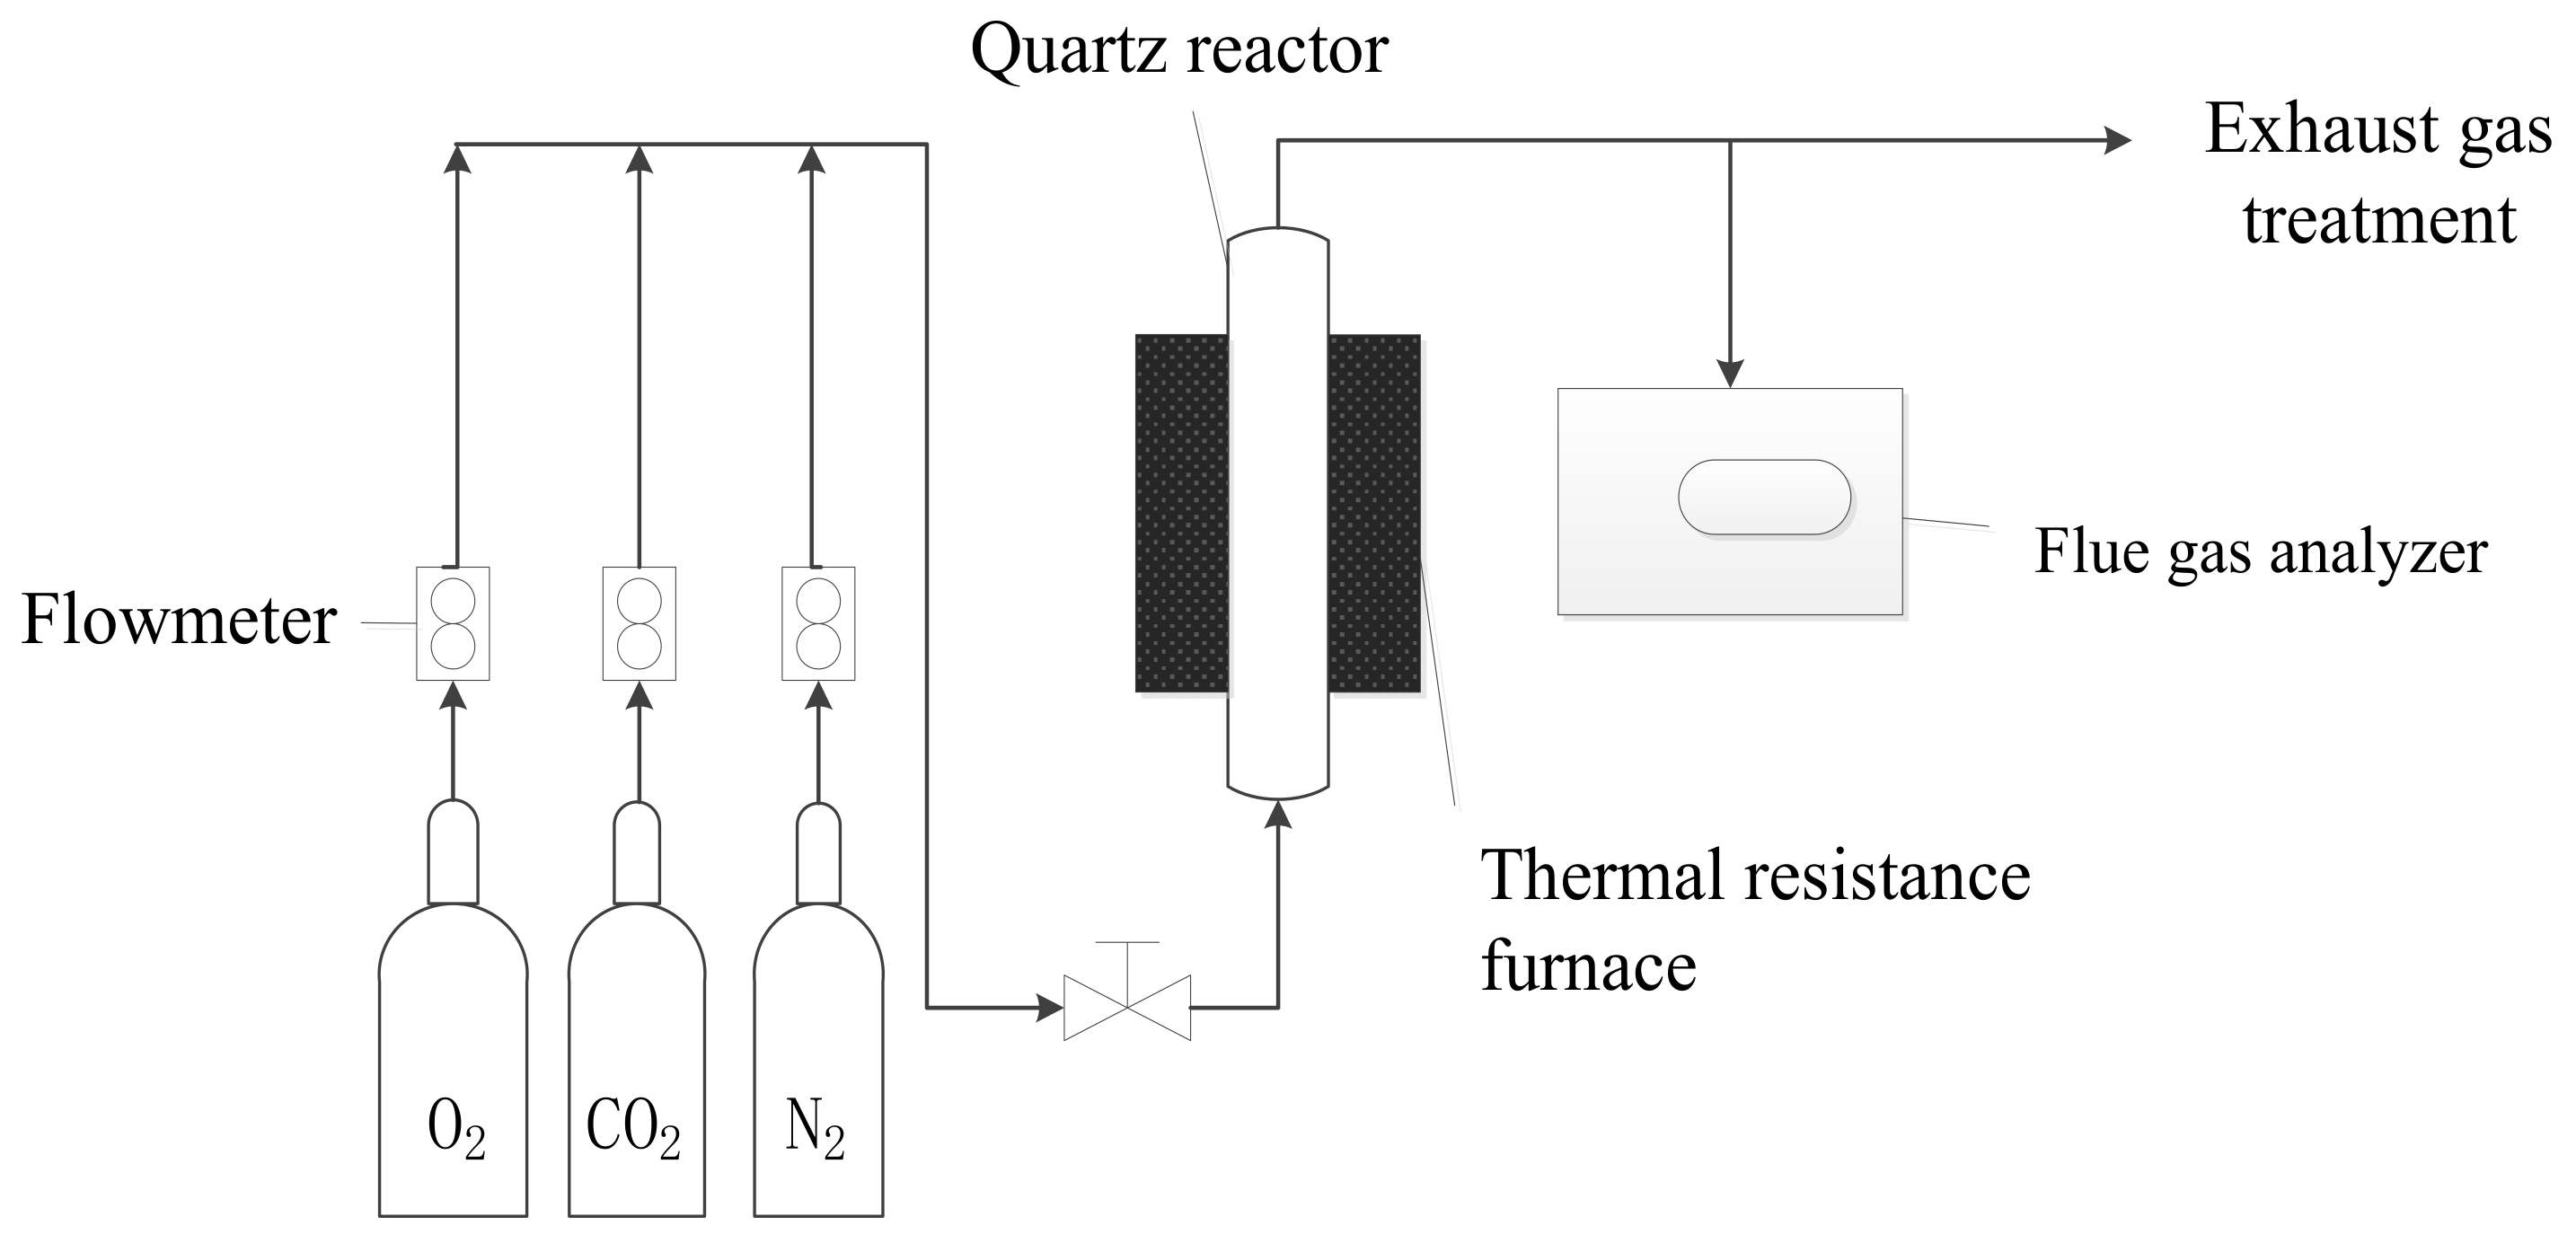
2.3. Experimental Design on SO2 Emission and Fixation Characteristics

A small, fluidized bed test bench was designed in the experiment, as shown in Figure 1. This test bench mainly included a reactor body, heating furnace, and flue gas analyzer (Testo350). To simulate the air composition, the high-purity gas O2 and N2 flow ratio was set to 1:4, with a total flow rate of 1.18 L/min. The reactor was made of quartz glass with a porous medium placed 25 cm from the lower edge of the reactor to simulate the air distribution plate. The furnace reaction temperature was set to 1270 K, with a thermal insulation layer to maintain the reactor temperature.
The bed material contained experimental coal samples (100 mg) and sufficient quartz sand (0.1–2 mm, 1000 kg/m3). The SO2 concentration (ppm) was recorded by the flue gas analyzer with a constant pump flowrate of 1 L/min, recording intervals of 1 s, and recording SO2 concentrations of less than 10 ppm.

2.4. Experimental Study of Sulfur Conversion Process Based on 3 MWth Test Bench

Most domestic and foreign experiments on sulfur precipitation during coal combustion could not effectively simulate the sulfur conversion process in a fluidized bed. Some researchers carried out dynamic sulfur fixation experiments with limitations, due to the short reaction time. Thus, this study performed the experiment on the largest CFB test bench in China, as shown in Figure 2.
This test bench had a 24.6 m high hearth and a 3 MWth rated power equipped with complete milling, air supply, circulating water, air induction, and dust removal system.
With sample coal II as an example, the amount of CaO and porous media in its coal ash resulted in its ability to remove and adsorb the SO2 generated from coal combustion [30,31,32]. A portion of the sulfur in coal existed as highly stable, such as sulfate, which could not be decomposed at the combustion temperature of the CFB. Therefore, its actual emission concentration was lower than that of the total emission concentration calculated using the total sulfur. The calcium–sulfur molar ratio Ks of coal can be defined as:
Ks , self = 0.00571 × A ar CaO S ar
where CaO is the mass percentage of CaO in coal ash. The calcium-sulfur molar ratio (Ca/S) of the limestone added in the test is defined as the molar ratio of the total sulfur content in the limestone and in coal. The desulfurization efficiency after adding limestone is the total desulfurization efficiency of the CFB boiler including its self-desulfurization efficiency which is:
η s = 100 0.005 SO 2 × V gy S ar
where SO2 is the SO2 concentration converted to 6% O2 dry flue gas; V gy is the dry flue gas volume of 1 kg of coal with an excess air coefficient of 1.4 (6% O2).

3. Results & Discussion

3.1. Calculation of Oxidizing Atmosphere

3.1.1. Distribution and Transformation of Sulfur-Containing Phases

Figure 3 shows the distribution of sulfur-containing substances at different temperatures for the three coal samples in an oxidizing atmosphere with an excess air ratio of 1.2. The solid phase is mainly composed of CaSO4, MgSO4, K2SO4, and Na2SO4, and the gas phase has minimal SO2 and SO3. Most of the sulfur in coal is fixed by alkaline metal oxides such as CaSO4 and MgSO4 at low temperatures and is re-released as SO2 when the temperature exceeds 800 K. When the temperature is less than 800 K, a portion of KAl(SO4)2 and SO3 is generated. The reactions are as follows:
2CaSO4→ 2SO2 + O2 + 2CaO
2MgSO4→ 2SO2 + O2 + 2MgO
CaO + SiO2→ CaSiO3
MgO + Al2O3→ MgO·Al2O3
SO3 at low temperatures is more stable than that of SO2. When SO3 starts to increase gradually, the order of its peak content is as follows: Middling, sample coal II, and then sample coal I. This sequence is opposite to that of the peak content of alkaline oxide in Table 2. Therefore, in lower temperatures, SO3 content is mainly restricted by alkaline oxide.

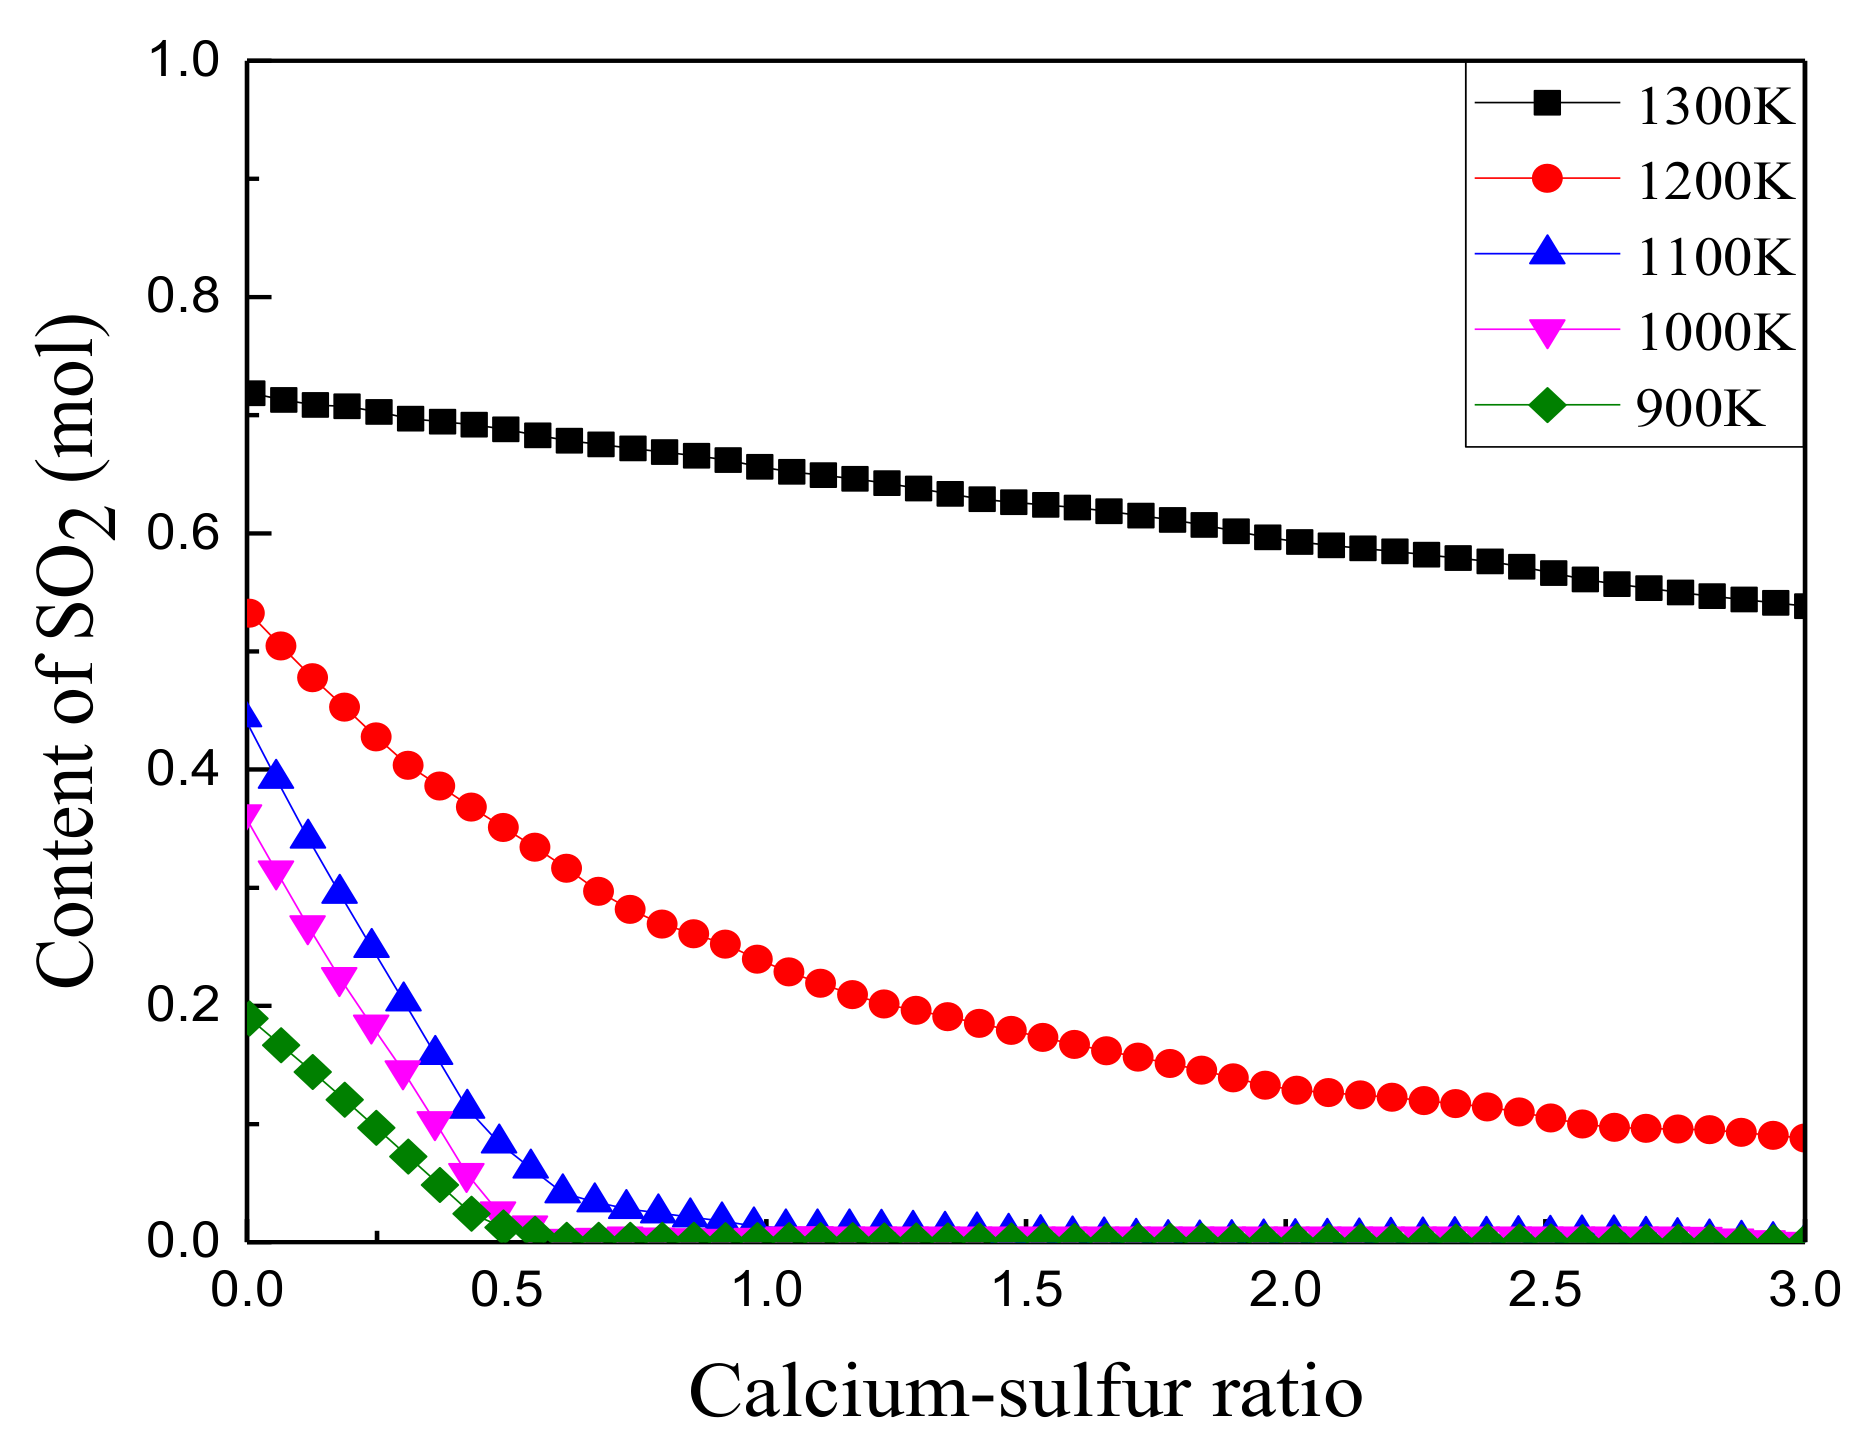
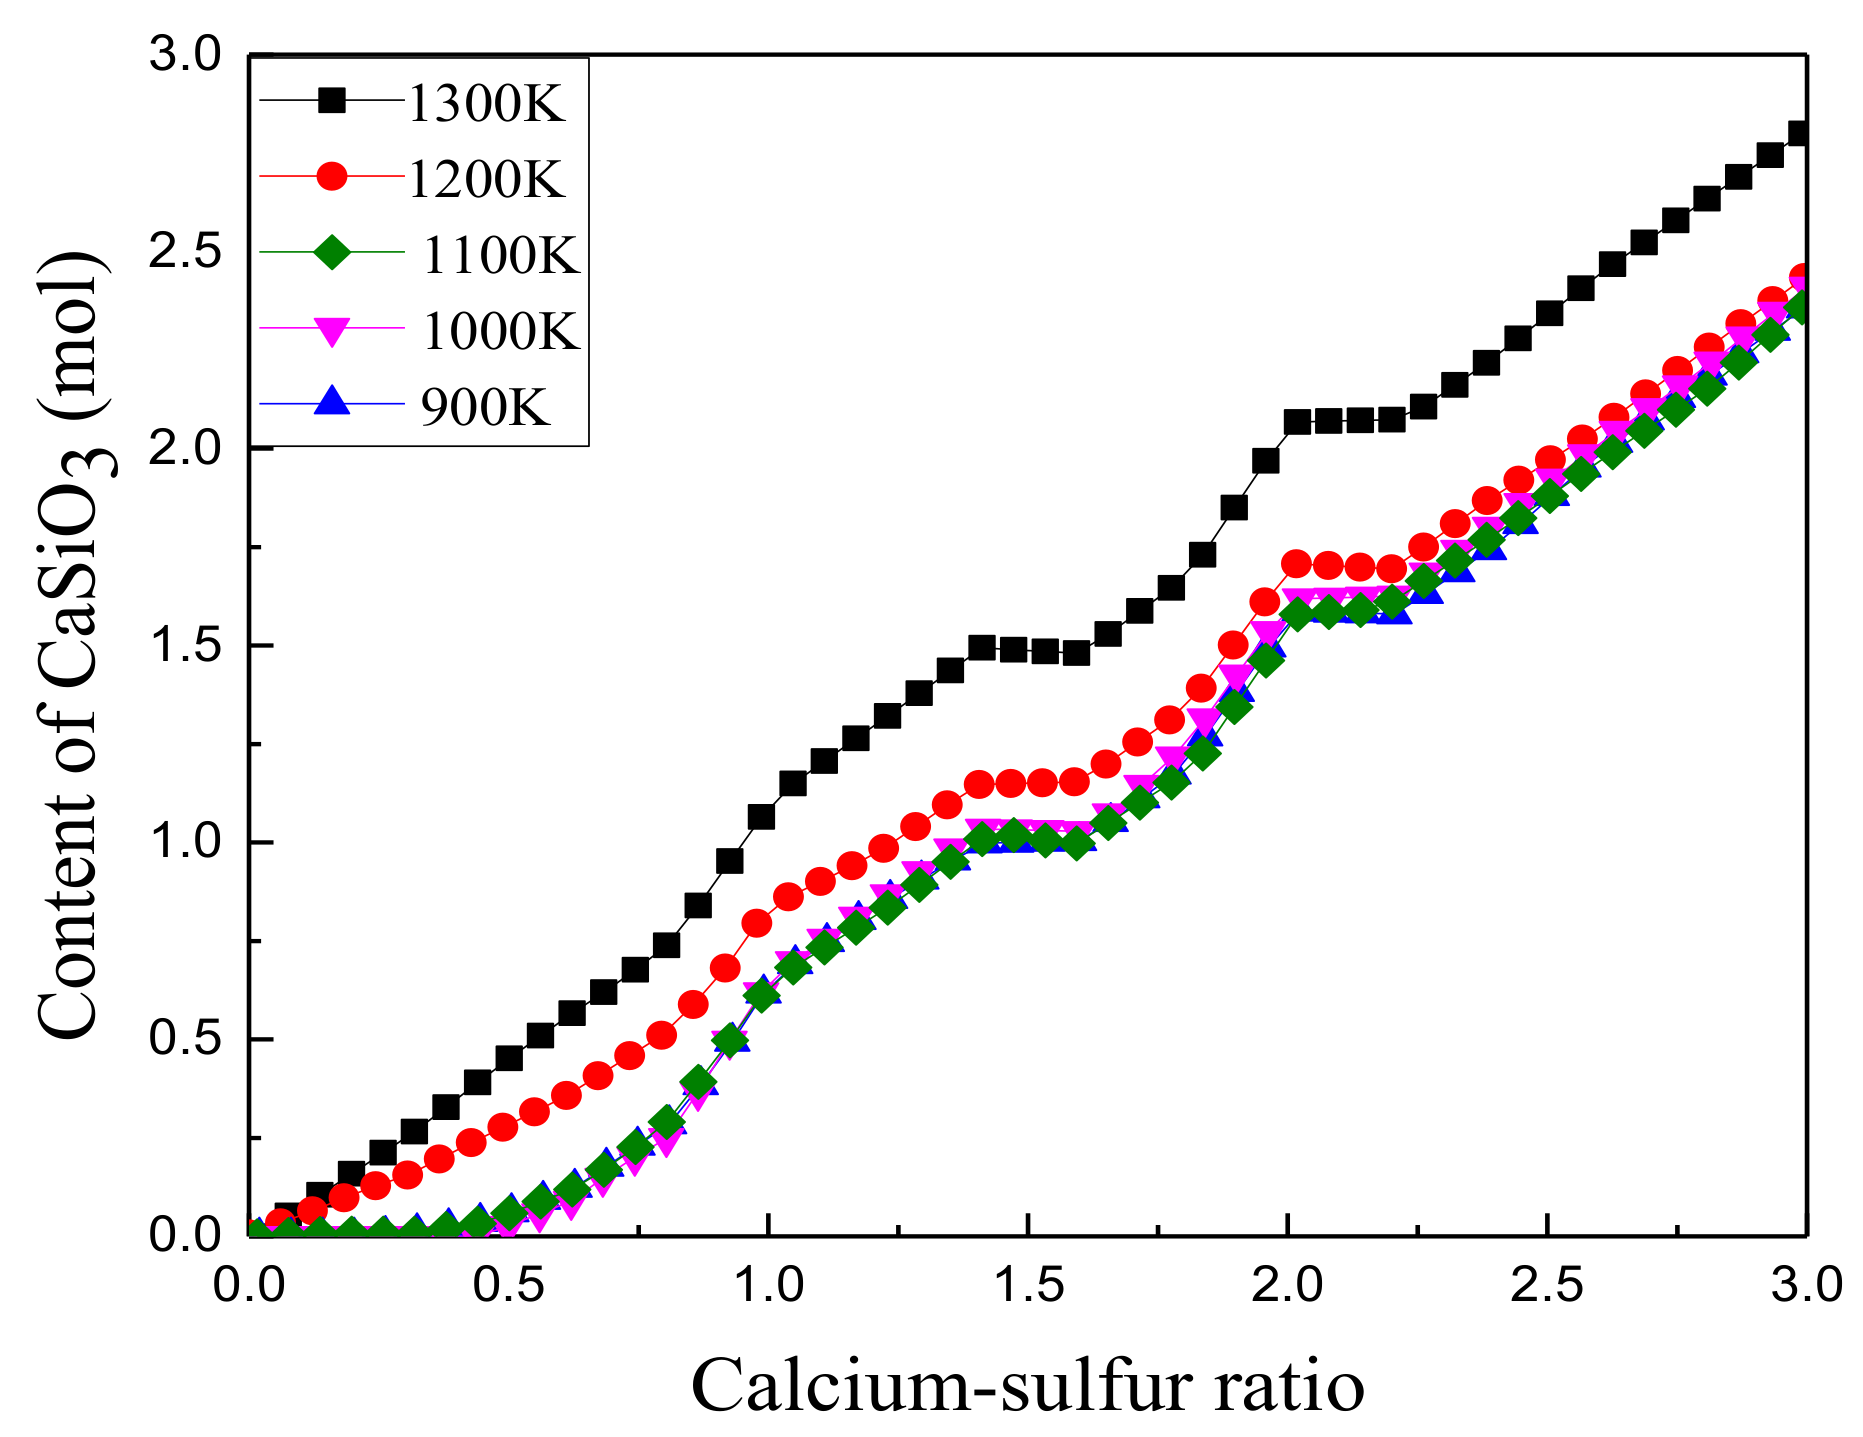
3.1.2. Effect of Calcium to Sulfur Ratio on Sulfur Fixation

During the operation of the CFB boiler, limestone serves as the main desulfurizer [33,34,35]. Improving the desulfurization efficiency can not only save a significant amount of the desulfurization cost, but can also reduce the pressure of the secondary desulfurization in the tail.
For example, with regard to sample coal I, the temperature range of 900 to 1300 K is chosen, and the excess air ratio is 1.2. Figure 4, Figure 5 and Figure 6 show the relationship between the equilibrium yield of SO2, CaSO4, and CaSiO3, and the Ca/S ratio, respectively (the Ca/S ratio here excludes the CaO in the coal sample itself). Increasing the Ca/S ratio to values less than 0.6 resulted in a rapid decrease of the SO2 content, rapid increase of CaSO4, and a relatively slow increase of CaSiO3. These indicate that the calcium-based sulfur fixation reaction mainly occurred as a reversible reaction:
SO2 + CaO ⇋ CaSO3
2CaSO3 + O2 ⇋ 2CaSO4
As CaCO3 increases, the reaction equilibrium increases causing more immobilization of SO2.
The CaO/S ratio in sample coal I is 0.449, as shown in Table 4. When the Ca/S ratio is 0.6, the total Ca and S are approximately equal to the stoichiometric ratio. The majority of the SO2 is fixed to sulfate by the sulfur fixation of alkaline oxide. Excess CaCO3 decomposed into CaO, which reacted with SiO2 in the solid phase to form a more stable CaSiO3. The reaction of calcium-based sulfur fixation is exothermic. As the temperature increases, the reaction moves to the reverse reaction direction, which leads to the decomposition of CaSO4. Hence, the effect the Ca/S ratio in sulfur fixation becomes less evident as the temperature is increased.

3.2. Calculation of Reducing Atmosphere

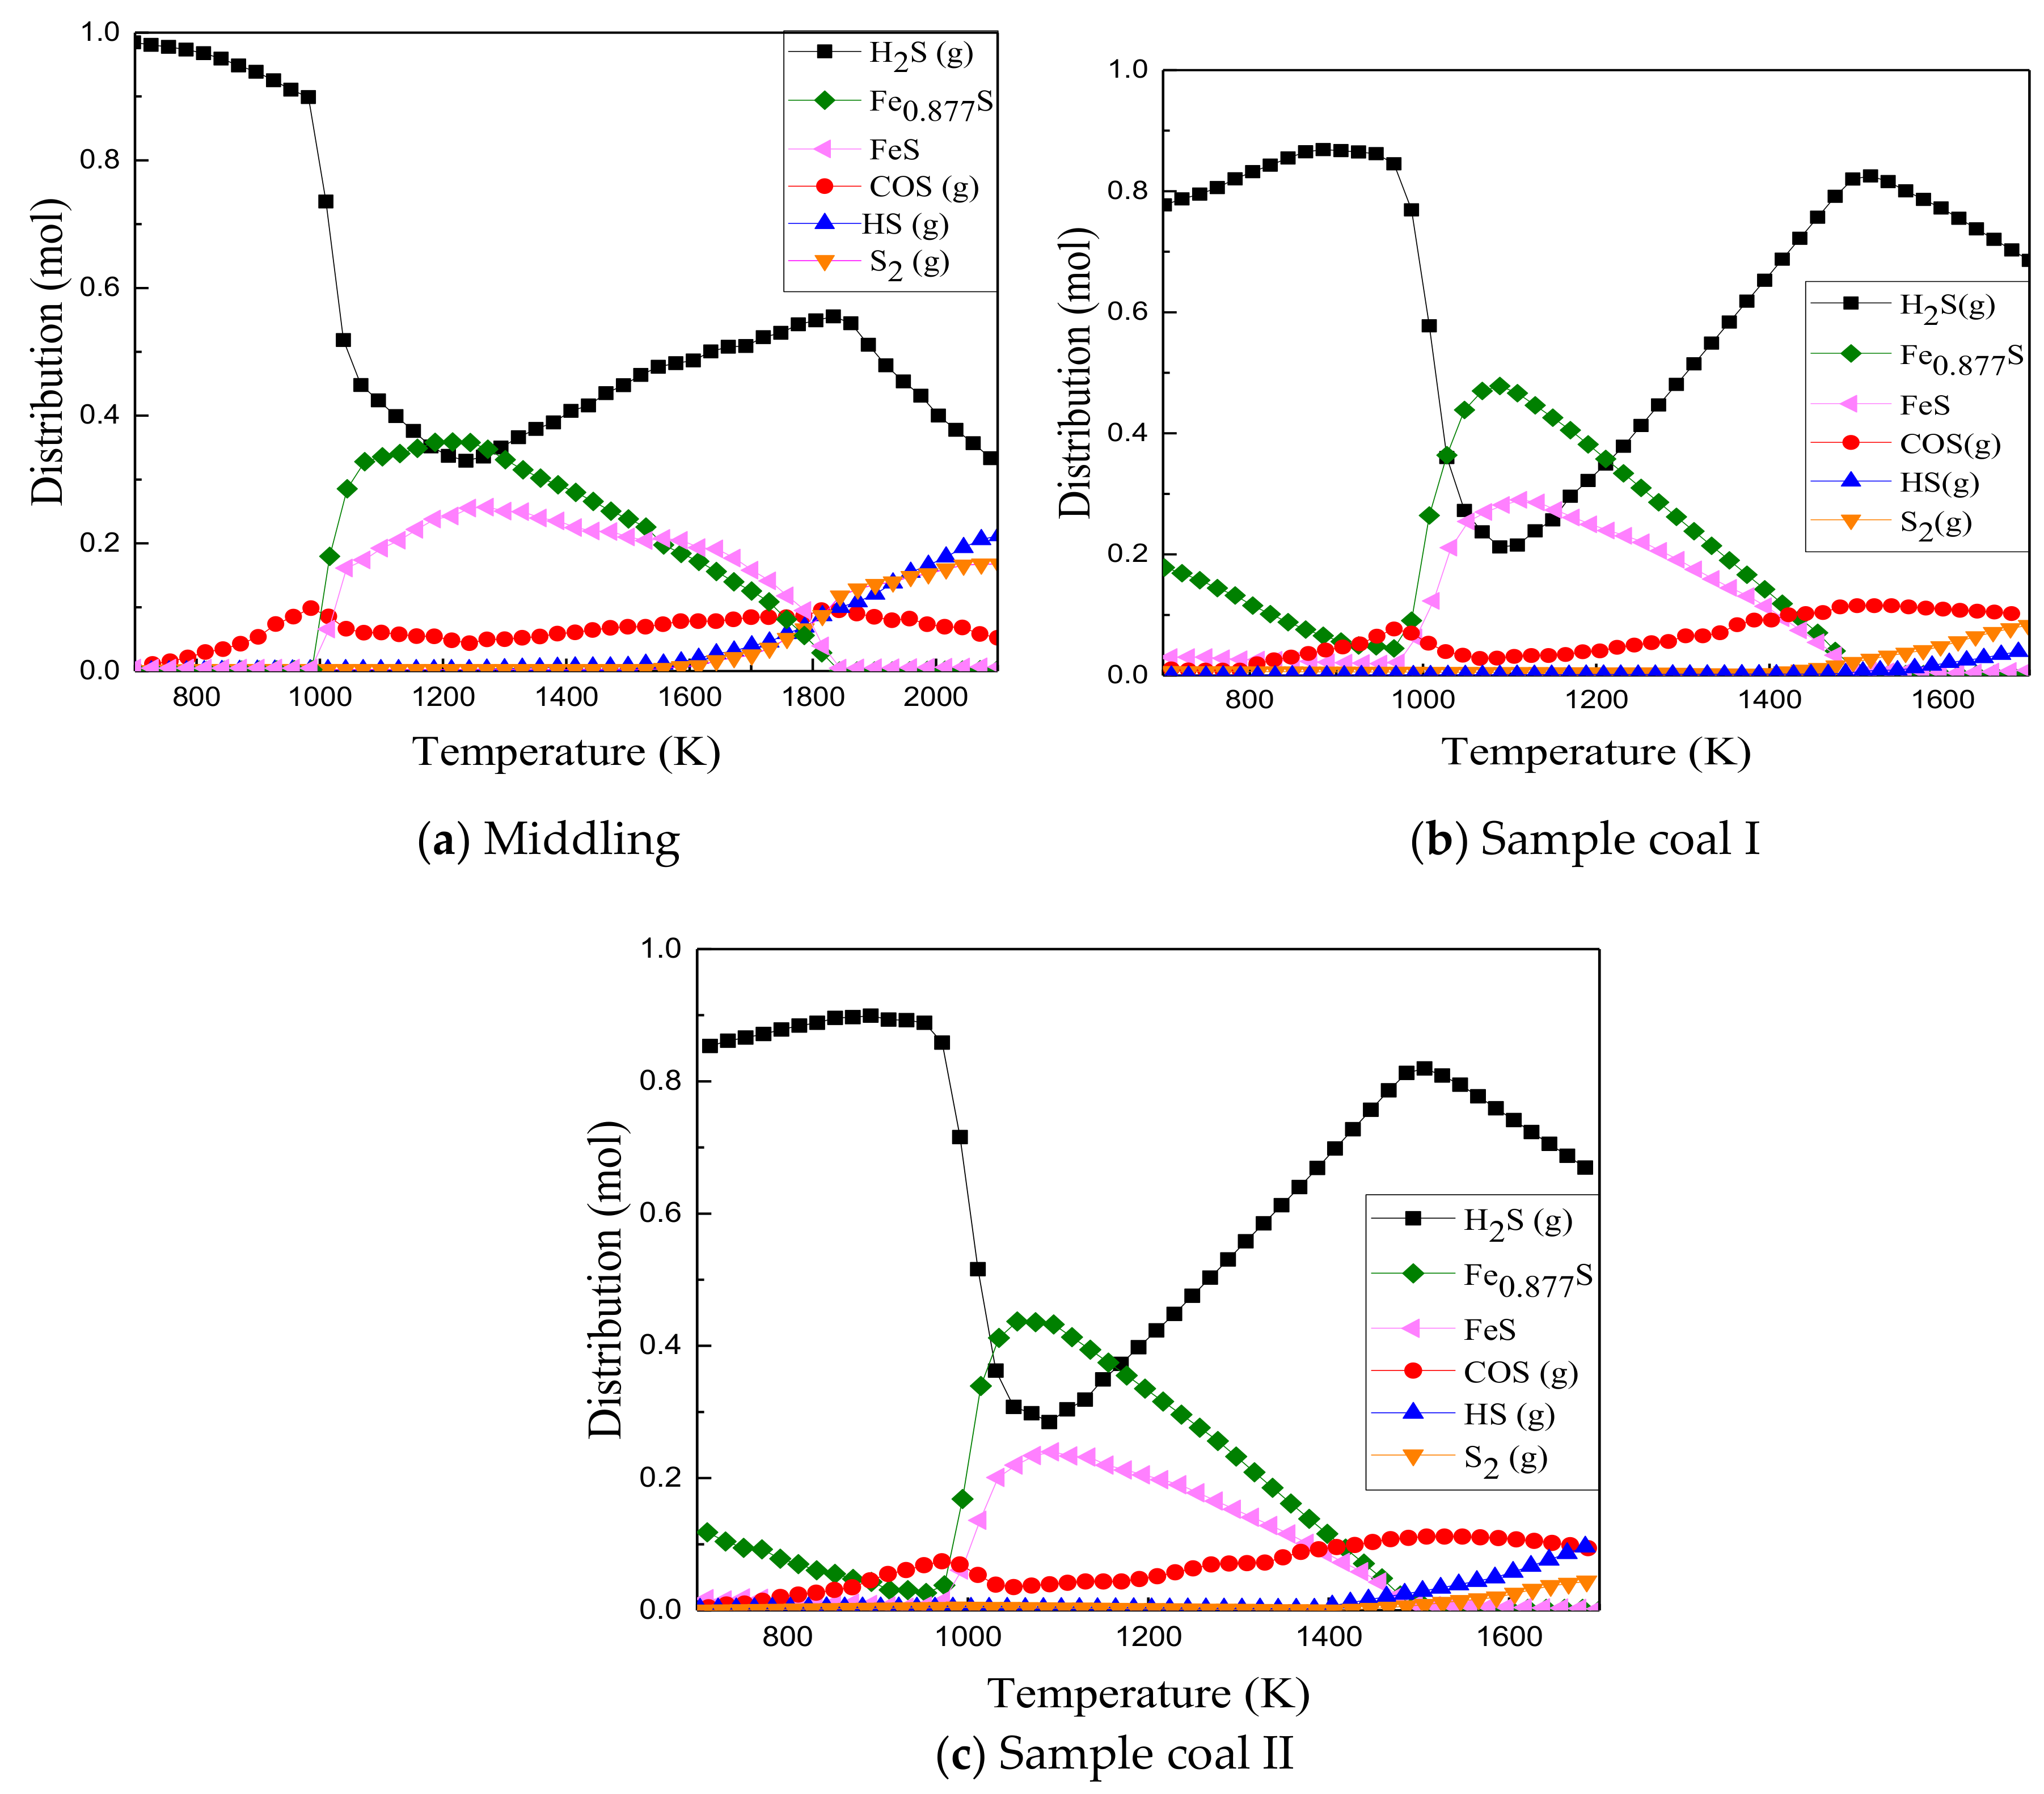
3.2.1. Distribution of Sulfur-Containing Phases

Figure 7a–c show the distribution of sulfur-containing substances of the three coal samples in a strong reducing atmosphere with an excess air coefficient of 0.4.
In the range of 800 K to 1000 K, most gaseous sulfur exists in the form of H2S, with a small part existing in the form of COS. However, the composition of the solid phase sulfur-containing compound is scarce. When the temperature exceeds 1000 K, iron sulfides, Fe0.877S and FeS, are the main solid phase sulfur compounds.
The distribution curve of H2S with respect to temperature is characterized by double peaks and a single valley. When the temperature is less than 950 K, the precipitation rate of H2S is almost 80% or more. After the temperature exceeds 950 K, the equilibrium content of H2S sharply drops, thereby rapidly reaching the valley value. The higher Fe2O3 contents in the coal sample resulted in smaller valley values.
For COS gas, the equilibrium content curve exhibited a bimodal characteristic with the peak temperature substantially consisting of the H2S gas. Under a strong reducing atmosphere of more than 1400 K, H2S decomposed to produce a large amount of H2. The reaction occurred as follows:
2H2S ⇋ 2HS + H2
2H2S ⇋ S2 + 2H2
In the temperature range of 800 K to 1000 K, the gas phase sulfur compounds of the middling and sample coals are mainly H2S, with small amounts of COS. No solid phase sulfur compounds are evident in the middling. In contrast, the coal blend samples show a small amount of solid phase sulfur compounds, mainly composed of Fe0.877S and FeS, which gradually decreases with increasing temperature.

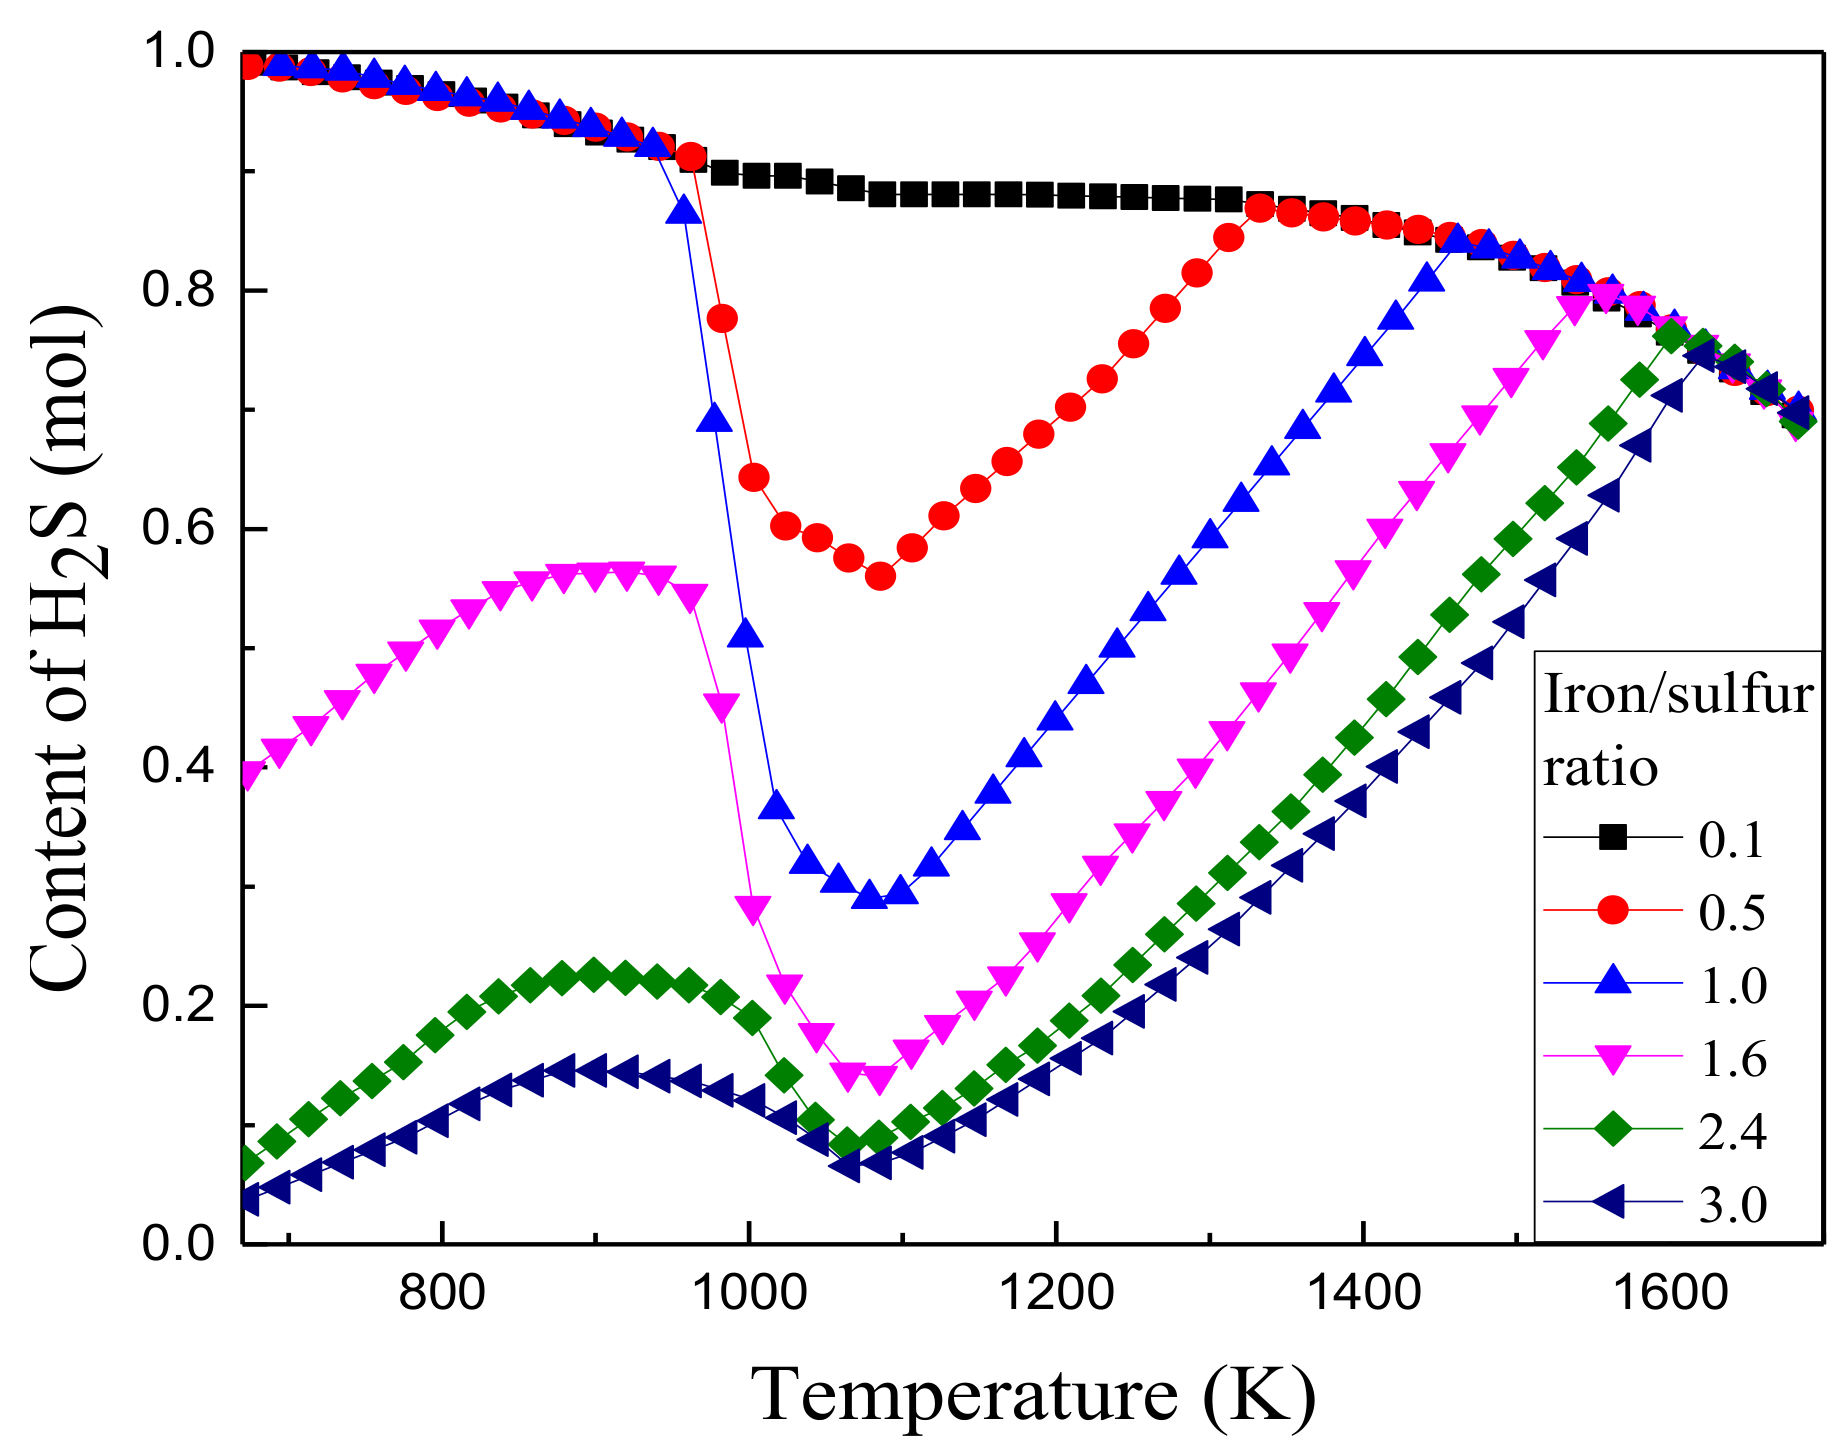
3.2.2. Effect of Iron Oxides

Under an oxidizing atmosphere, iron oxide does not participate in the reaction. Under a reducing atmosphere, the sulfur content of the solid phase is mainly iron sulfide. The Fe2O3 content of coal ash directly influences the release of H2S.
Using sample coal I as an example, the H2S equilibrium contents under different iron/sulfur ratios are simulated, as shown in Figure 8. When the iron/sulfur ratio is 0.1, Fe does not affect the sulfur-fixing. As the iron/sulfur ratio increases, the relationship between H2S and temperature shows the characteristics of double peaks and single valleys. In the low temperature section, the peak is visible at approximately 900 K. Following this, the H2S rate decreases as the iron-sulfur ratio increases. The valley is visible around 1100 K. In the high temperature section, the “peak” moves toward higher temperatures as the iron/sulfur ratio increases. This is attributed to the increased content of iron sulfide as the iron/sulfur ratio increases, where FeSx is converted into H2S in the endothermic reaction:
FeSx + H2O→H2S + FeO + Fe2O3

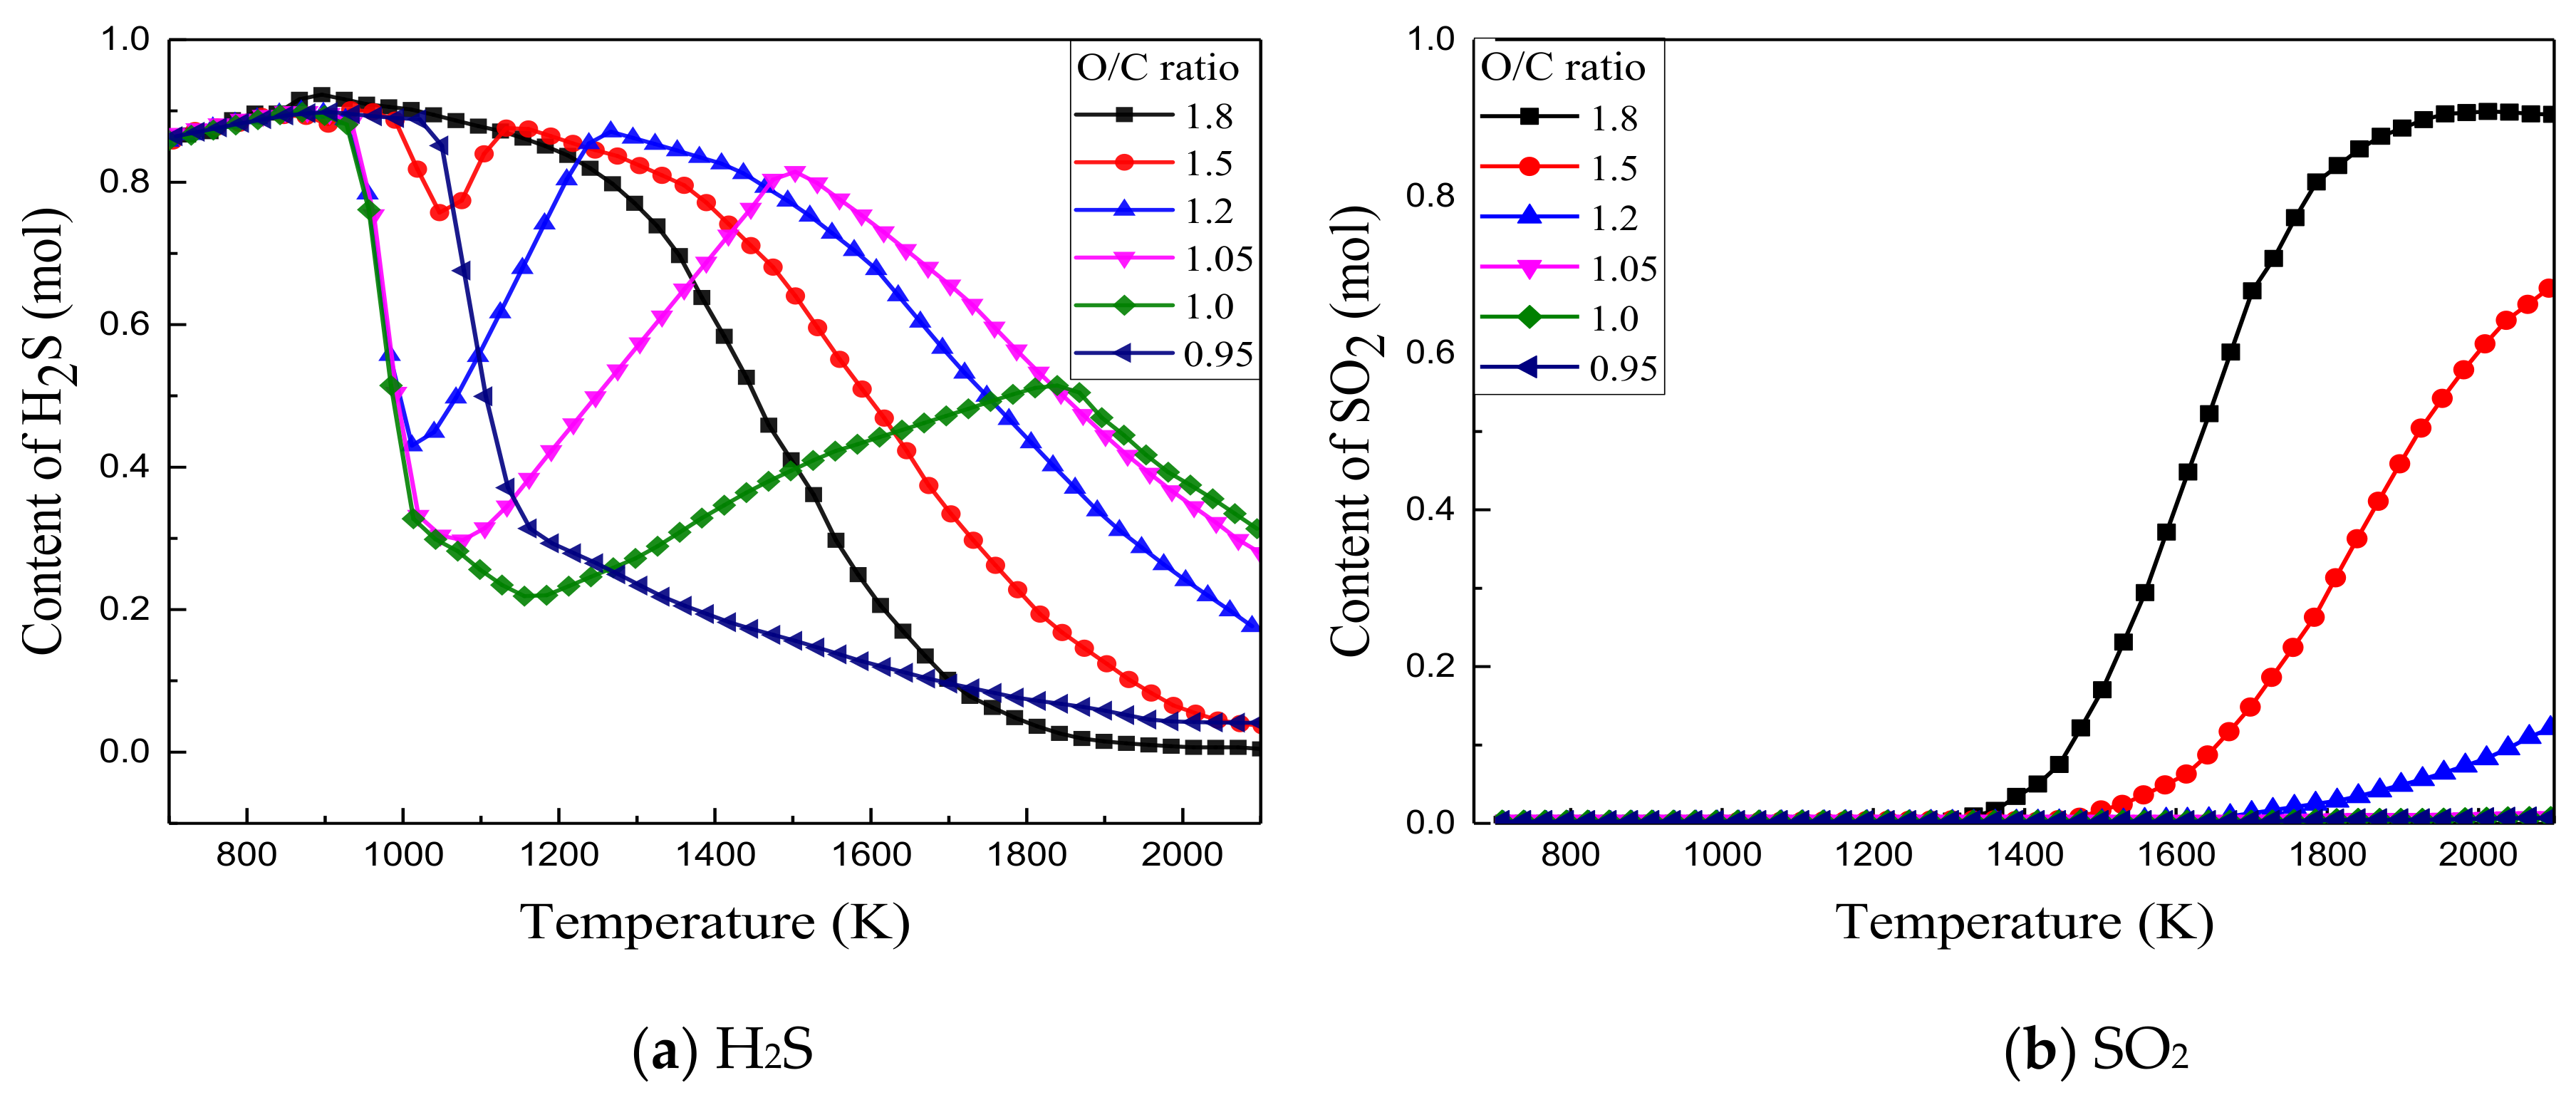
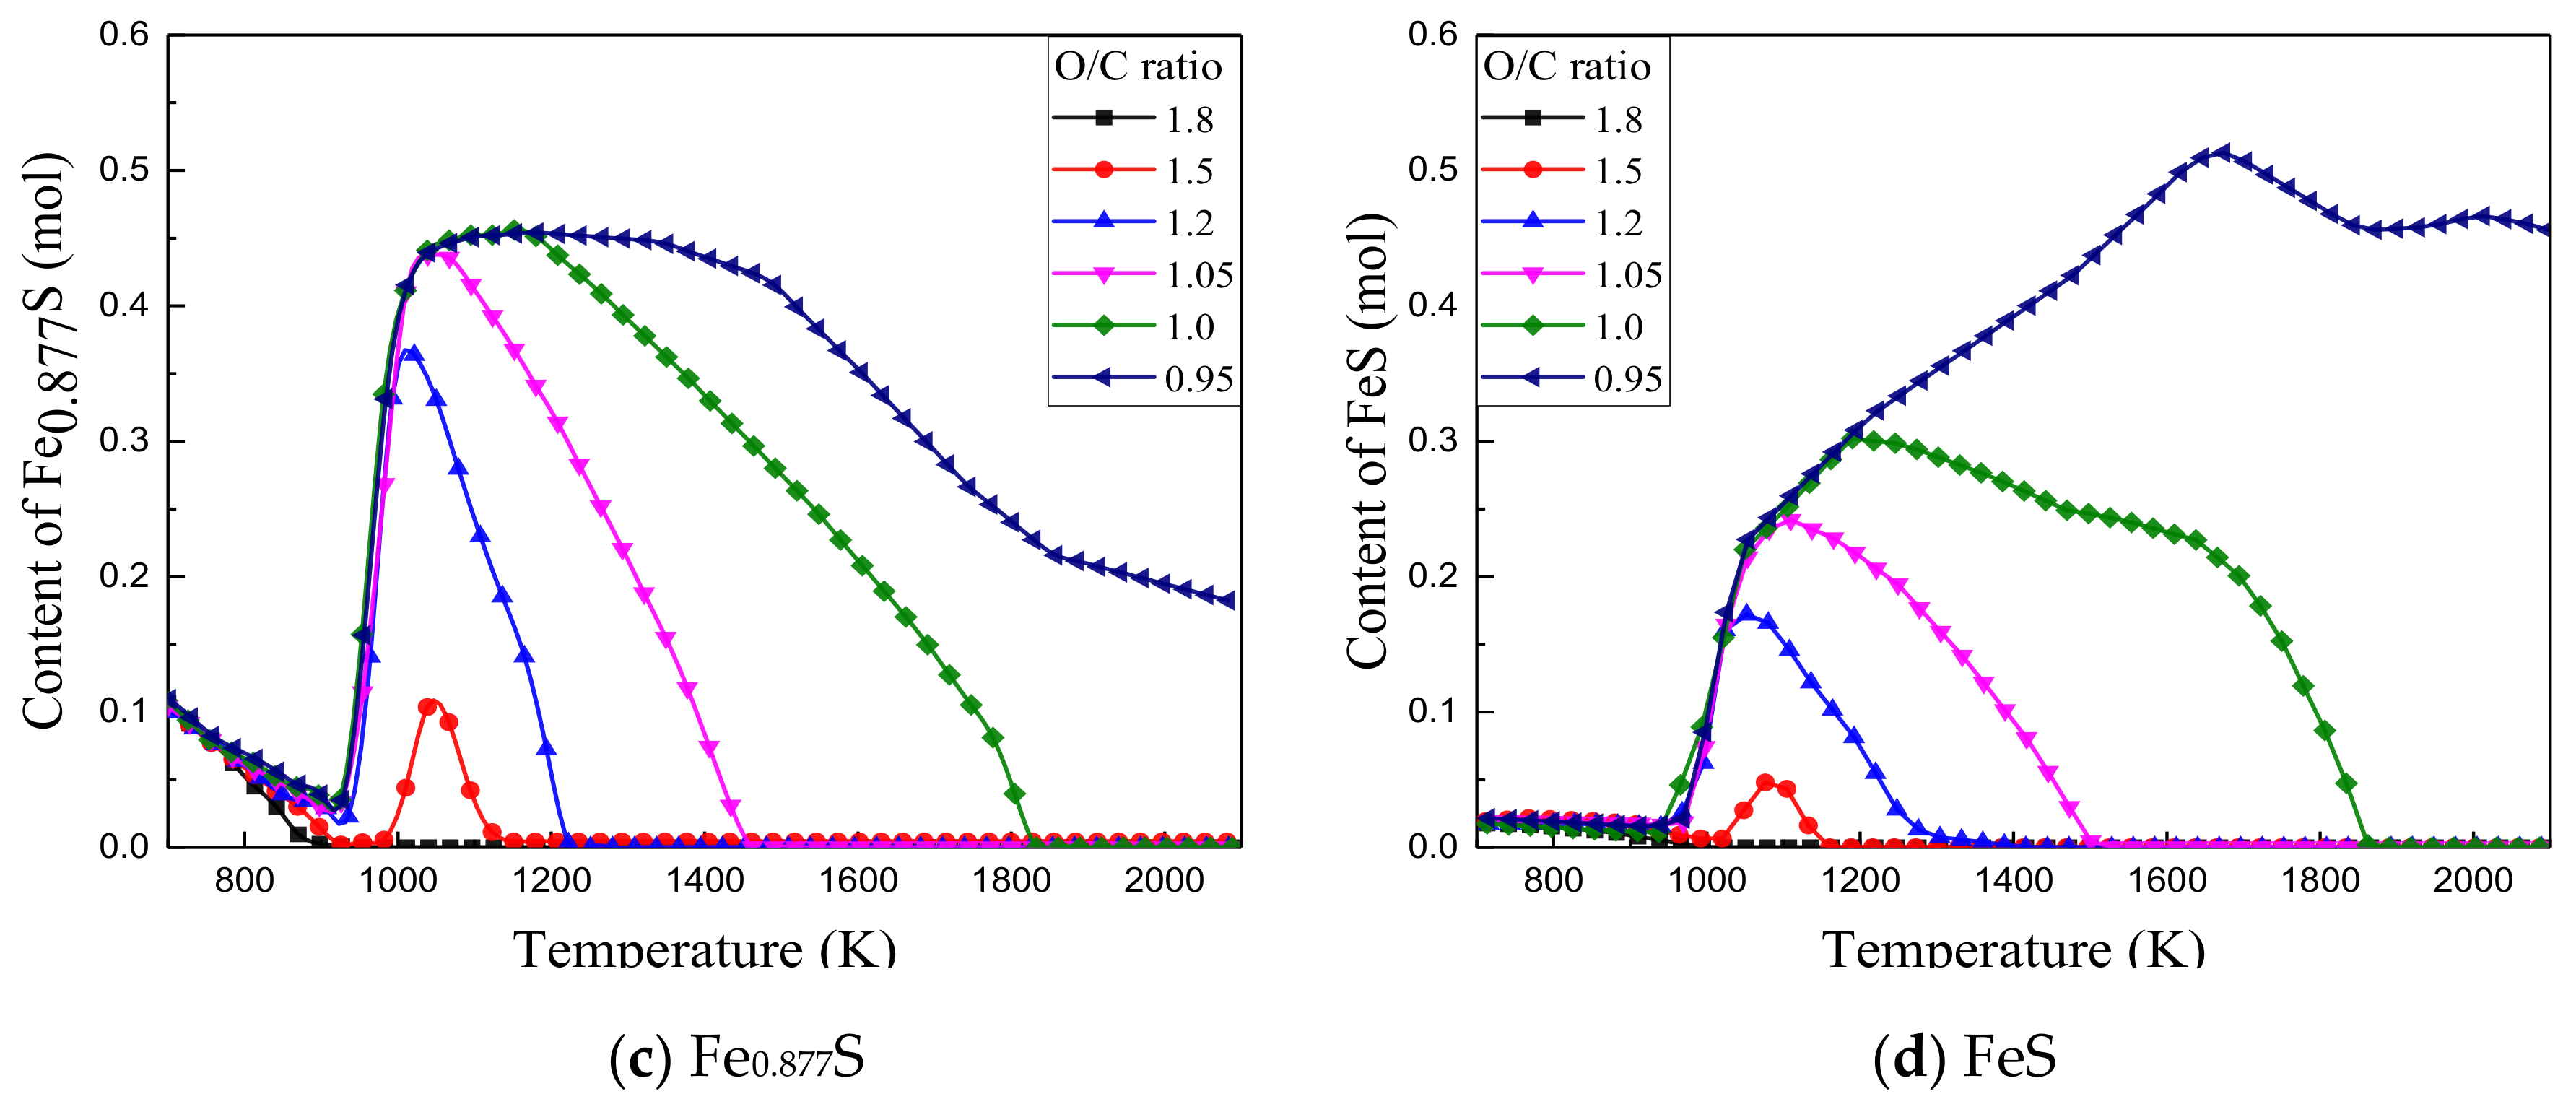
3.2.3. Effect of O/C

As shown in Figure 7, the H2S release curve reached the peaks at different temperatures in the high-temperature section. Combined with Table 4, C, H, and O, which are affected by the reduction ability of the atmosphere [36,37,38], are very different between the middling and two-coal samples. By changing the initial input of these elements, thermodynamic simulation can eliminate the influence of H. The ratio of the total O moles in coal and the O moles in air (O2) to the C moles in coal is defined as the O/C ratio. When the excess air ratio is 0.4, the O/C ratio of the three coal samples is calculated, as shown in Table 5.
The O/C ratio of the middling is significantly smaller than that of the two mixed coals. The self-contained O atom in the middling is increased by 6 mol to achieve an O/C ratio nearly similar to that of the coal samples. The input of the remaining substances is unchanged. A thermodynamic simulation is performed to obtain a sulfur-containing phase distribution map, as shown in Figure 9. In comparison to Figure 7b,c, the peak of the high-temperature section of the corrected curve is consistent with that of the H2S release curve of the sample coals. This proves the aforementioned conjecture in regards to the effect of reducing the atmosphere intensity to achieve the peak of the H2S release curve. Hence, the O/C ratio is a more accurate characterization of the effect of the reducing atmosphere.
Using sample coal II as an example, Figure 10 shows the distribution of sulfur and solid phase sulfur at different O/C ratios. As the O/C ratio increases, the effect of the reducing atmosphere is weakened and the distribution curves of the sulfur-containing substance moves toward the lower temperatures.
From Figure 10a,c,d, when the O/C ratio is less than 1, the peak of the H2S curve in the high-temperature section did not exist and the iron sulfides could not decay to zero. At the O/C ratios from 1 to 1.5, the valley of the H2S curve increased and the peak of the iron sulfide curve decreased and became less noticeable. When the O/C ratio is 1.8, the valleys and peaks of both H2S and FeSx curves disappeared and FeSx generated a minimal amount at temperatures less than 900 K. This is due to the weak reducibility of the atmosphere, which resulted in more O atoms in the system. The binding capacity of the O atom to the Fe element is greater than that of the S atom. In particular, Fe forms iron oxide or a copolymer with other oxides. From Figure 10b, as the reducing atmosphere is weakened, SO2 is generated at high temperatures with its content increasing as the O/C ratio increases.

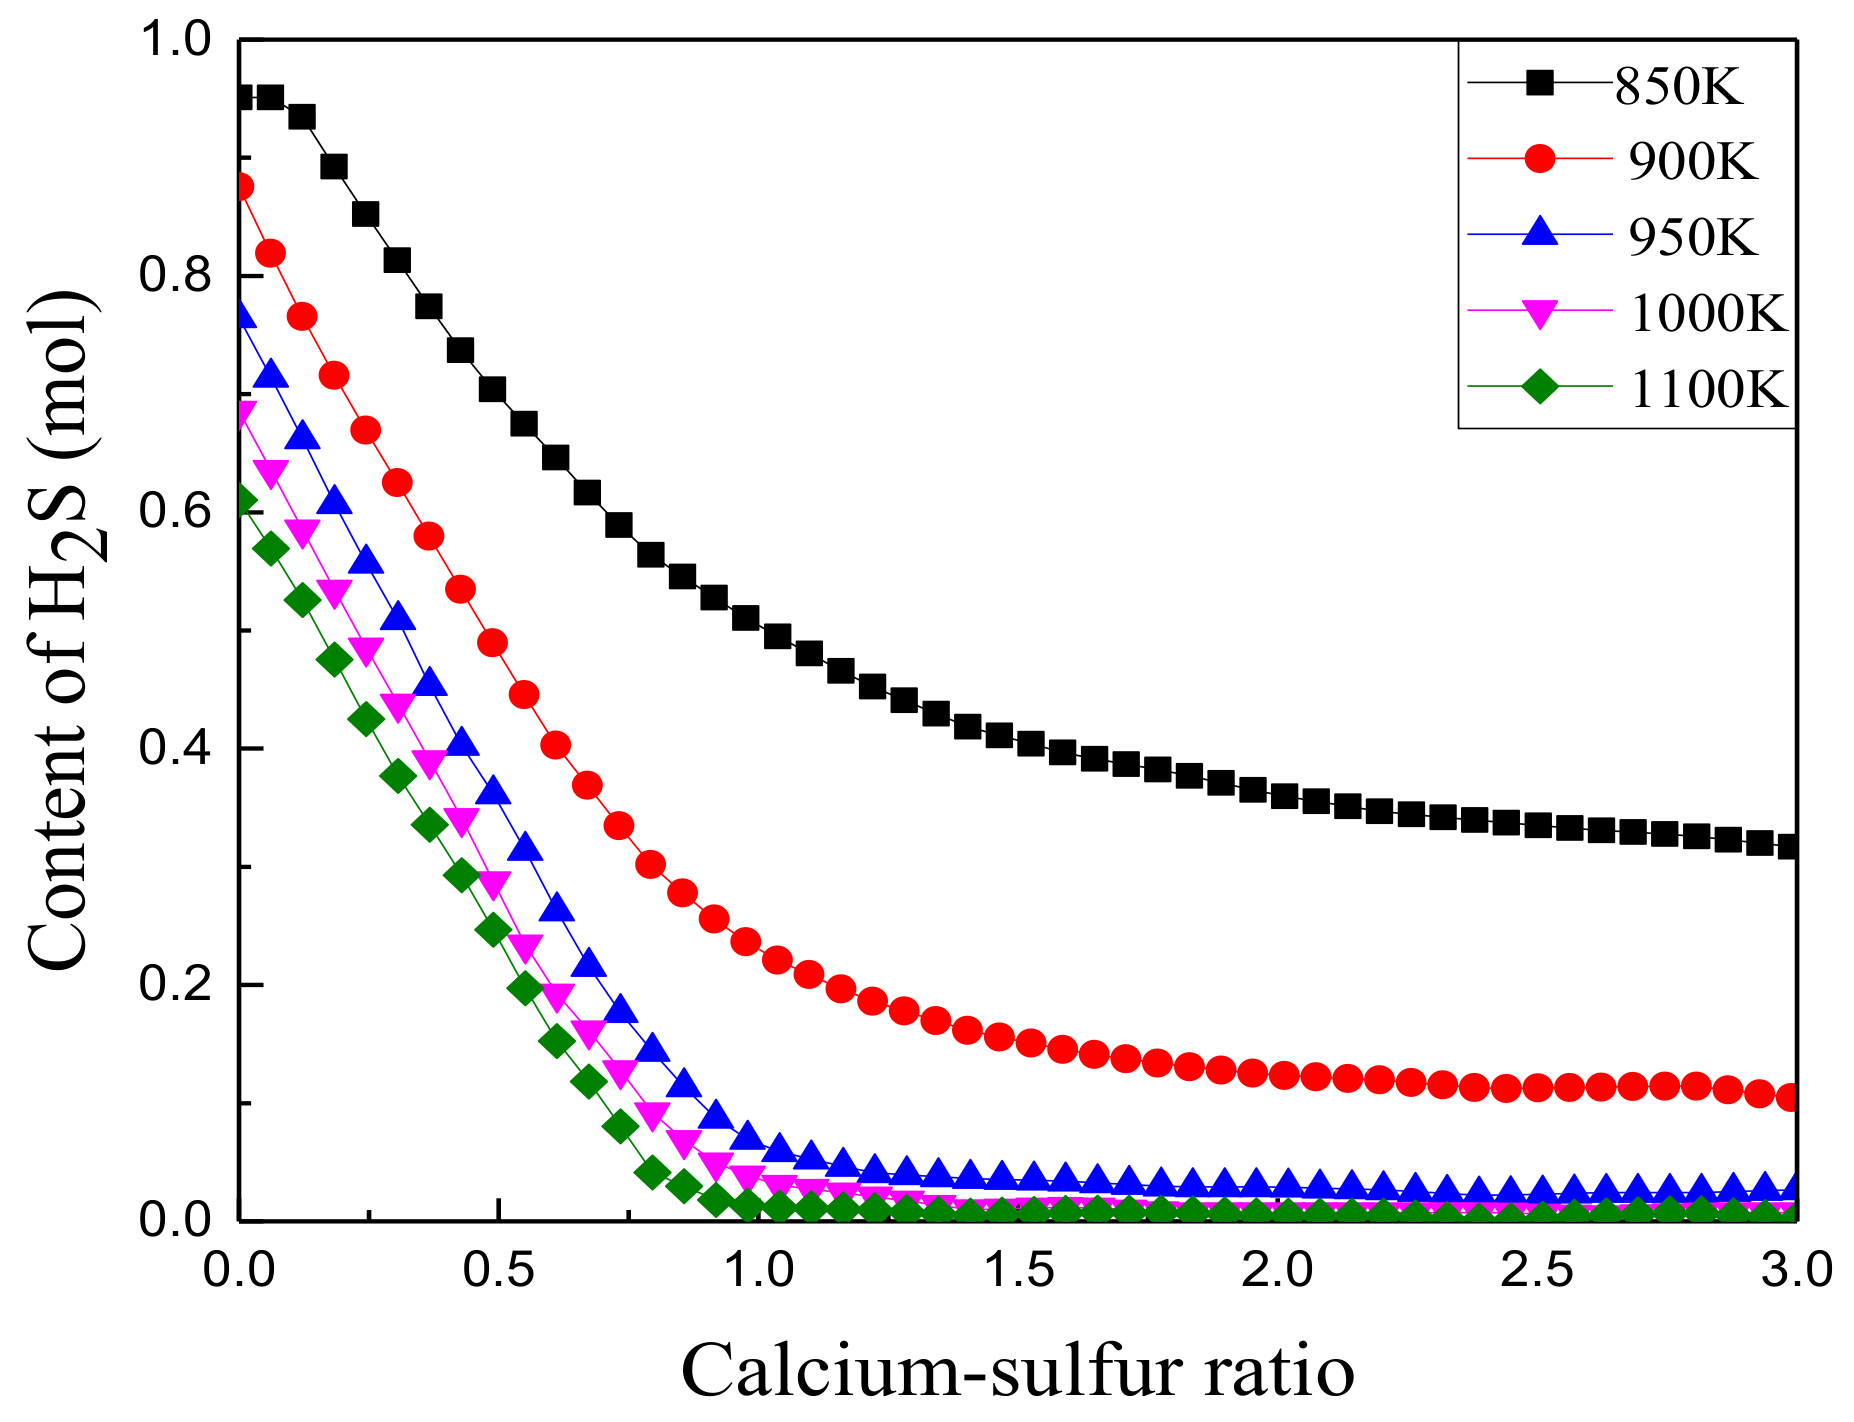
3.2.4. Effect of Calcium/Sulfur Ratio on Sulfur Fixation

Under a reducing atmosphere, a relatively high content of CaO in coal produces CaS as the intermediate product, which is conducive to S fixation. Low calorific value coal has high ash and aluminum silicon oxide content. CaO in coal ash mainly forms copolymer CaO•xSiO2•yAl2O3 with SiO2 and Al2O3. The presence of Fe2O3 leaves H2S at a lower level [39,40]. To separately investigate the effect of CaCO3 addition on the release of H2S, Fe2O3, Al2O3, and SiO2 are set to 0 mol. Fe2O3 does not inhibit the formation of CaS. To study the relationship between CaS and the calcium to sulfur ratio, only Al2O3 and SiO2 are set to 0 mol.
Using sample coal I as an example, the excess air ratio is set to 0.4. Figure 11 and Figure 12 show the curves of H2S and CaS with the change of the calcium sulfur ratio, respectively, at different temperatures. With the increase of the calcium/sulfur ratio, H2S rapidly decreased. When the calcium/sulfur ratio reached 1 to 1.2, H2S is almost fixated.
Figure 12 demonstrate the large amount of CaS formed in a strong reducing atmosphere without the presence of large amounts of Al2O3 and SiO2. At around 800 K, nearly no CaS is formed; however, as the temperature increased, CaS gradually increases, thereby producing a almost consistent curve at 1000 K or more. As the calcium/sulfur ratio increased, the increase of the CaS content became gradual. In combination with Figure 13, as the calcium/sulfur ratio increased, the combination of S, Fe, and Ca formed CaS through the endothermic reaction:
FeSx + CaCO3→CaS + FeO + CO2
The temperature rise also promotes this reaction. Therefore, at an equal calcium/sulfur ratio, the equilibrium content of CaS increases as the temperature increases.

3.3. Analysis of Experimental Results

The test data is plotted as a SO2 concentration (c)-time (t) curve in Figure 14. The area enclosed by the curve and the horizontal axis approximates the total amount of SO2 released during the experiment calculated as:
m = q v * c i * 10 6 * 1 V m * M
where m is the mass of SO2 released (mg); q v is the he total flow of gas (19.67 mL/s = 1.18 L/min);   c i is the SO2 concentration at time i (ppm), corresponding to the area of the column at time i in Figure 13; V m is the molar volume at the ambient temperature (298 K) (24.45 L/mol); and M is the molar mass of SO2, (64 g/mol).
Three kinds of 100 mg coal samples were made to completely undergo a reaction at 1000 °C to obtain a SO2 release curve. Each coal sample was subjected to three experiments and the results were averaged to obtain the total amount of SO2 released from the coal sample. The total SO2 emissions and sulfur fixation rate were calculated from the 100 mg test material, and the total sulfur content St was determined, as shown in Table 6.
Comparing Table 4 with Table 6, a consistent sulfur fixation law, i.e., sample coal I > sample coal II > middling, is observed, as shown in Figure 15. According to Table 2, the alkaline oxide/sulfur ratio is in the order of sample coal I > sample coal II > middling. The relative amount of alkaline oxide and sulfur in coal ash determines its sulfur fixation ability. However, a certain deviation between the simulation and the experimental results is observed, due to experimental limitations where the cycle process cannot be completed as the SO2 generated from the combustion of coal sample incompletely reacts with sufficient coal ash. A considerable amount of SO2 was not fixed as it entered and escaped the pipeline at the end of the reactor.

3.4. Literature Verification of Simulation Results

According to a test report of coal combustion characteristics of a circulating fluidized bed boiler for a 2 × 660MWe unit in a Shanxi low-calorific coal power generation project, the middling and gangue used in the report and the mixed coal burned from the design experimental bench are from the same origin, the blending ratio is similar, and the combustion temperature is close, so the results are comparable. Test coal I and II were, respectively, blended with middling and gangue at a ratio of 77:23 and 6:4. In this report, the researchers tested the self-desulfurization performance of coal samples and the results are shown in Table 7.
Comparing Table 4 and Table 6, when considering mixed coal, the simulation and experimental results are also consistent with the literature results, that is, the sulfur fixation rate: Coal I > coal II. This is consistent with the order of the sulfur-fixing law: The relative amount of alkaline oxides and sulfur in the coal ash determines the sulfur-fixing capacity of the coal ash.
While the simulation results cannot accurately calculate the specific content of the sulfur-containing phase, it can characterize the relative amount of each sulfur-containing phase and the change trend under different conditions.

3.5. Experimental Analysis Based on 3 MWth Test Bench

The test coal was tested under various operating conditions and parameters. The combustion efficiency without limestone desulfurization was 92.99% to 94.80%, as shown in Table 8. When the test coal is not cast with limestone at an oxygen content of 3–6%, the SO2 emission increased with the increase of the bed temperature and the self-desulfurization efficiency gradually decreased, as shown in Figure 16. This is attributed to the bed temperature rise, which resulted in the decomposition of the sulfate accumulated in the bed material (including large amount of circulating ash) in the furnace, thereby increasing the mass concentration of SO2 emissions in a short period. However, the limited desulfurization components in coal leads to an increase in the mass concentration of SO2 emissions.
Therefore, there is an optimal desulfurization reaction temperature for limestone desulfurization in CFB boilers. The continuous increase of bed temperature accelerated the thermal decomposition rate of sulfate and CaSO4 produced during the desulfurization reaction, increased the proportion of generated SO2, and reduced the desulfurization efficiency in the furnace.
Table 9 shows the desulfurization conditions under the limestone test conditions, which are consistent with those of the calculation results of thermal equilibrium. With the increase of the Ca/S molar ratio, the desulfurization efficiency gradually increased, resulting in a better sulfur fixation effect. However, due to the addition of limestone, the total amount of ash and slag increased, resulting in the incomplete combustion loss of solids and low combustion efficiency.
Under a load of 2.58 MWth, the calcium/sulfur molar ratio is 3.7, the bed temperature is 900 °C, the primary air ratio is approximately 40%, and the secondary air ratio is unchanged. Figure 17 shows the influence of the oxygen volume fraction at the furnace outlet on the SO2 emission mass concentration. The changes in SO2 emission mass concentration with the increase of oxygen volume fraction is not very evident.

4. Conclusions

Through thermodynamic equilibrium simulation of an oxidizing atmosphere, S in mixed coal samples of middling and gangue is mainly converted to SO2 and alkali metal sulfate. When the temperature is less than 1000 K in a reducing atmosphere, the middling is mainly composed of gas-phase H2S and small amounts of COS. A small amount of solid sulfur compounds appeared in the mixed coal with gangue, with the main components being Fe0.877S and FeS.
During the combustion of mixed coal samples using simulation, O/C ratio established more accurate characterization of atmospheric reducibility than the excess air coefficient. As the O/C ratio increased, the distribution curves of the sulfur-containing substances shift to lower temperatures. At an O/C ratio of 1.8, the valley of the H2S curve disappeared with nearly zero iron sulfide content.
The small-scale experimental bench showed simulation results consistent with the sulfur-fixing, i.e., sample coal I > sample coal II > middling. This analysis showed that the sulfur-fixing capacity of coal ash depends on its relative amount of alkaline oxide and sulfur.
The 3 MWth test bench test showed high self-desulfurization efficiency of up to 31.6% of the sample coals at a temperature range of 1130 to 1173 K. The mass concentration of SO2 emission was obtained as approximately 800–1000 mg/Nm3.

Author Contributions

Conceptualization, formal analysis, methodology, validation, writing—original draft preparation, L.Z.; Conceptualization, methodology, software, writing—review and editing, Y.D.; Supervision and review, Z.K. and B.S.; Data curation, review, Y.Z. All authors have read and agreed to the published version of the manuscript.

Funding

This research received no external funding.

Conflicts of Interest

The authors declare no conflict of interest.

References

  1. Ren, A.P. The Planning of Low Calorific Value Coal Source in Shanxi Province and Its Influence on Shanxi Power Grid. Shanxi Electr. Power 2015, 47, 47–49. [Google Scholar]
  2. Wang, X.L. Research on comprehensive power generation utilization of energy-saving technology application for low calorific value coal based upon the low calorific value coal power generation project in Yonglong mining area. China Coal 2019, 45, 82–86. [Google Scholar]
  3. Li, C.; Zhao, L.; Ren, Q. Status analysis and development discussion of coal gangue comprehensive utilization. Environ. Dev. 2015, 27, 72–74. [Google Scholar]
  4. Liang, Y.S. Study on Present Situation and Progress of Coal Gangue Resource Utilization. Energy Energy Conserv. 2019, 72, 72–73. [Google Scholar]
  5. Tan, Q.Y.; Peng, F.; Peng, H.W.; Tang, X.S. Optimization Design of Two-Stage Desulfurization System for CFB Boilers. Electr. Power Constr. 2014, 35, 89–94. [Google Scholar]
  6. Jin, D.P.; Wang, M.Y.; Song, W.X. Research on Deep Desulfurization Process of CFB Boiler Tail Humidification and Activation. Power Syst. Eng. 2014, 30, 41–43. [Google Scholar]
  7. Weng, A.X.; Zhou, H.; Wang, Z.H.; Chi, Z.H.; Jiang, X.; Cen, K.F. Experimental Study on Formation of SO2 of Blending Coal Combustion in High Temperature. Boil. Technol. 2003, 34, 1–4. [Google Scholar]
  8. Yu, J.L.; Lucas, J.; Wall, T.; Liu, G.; Sheng, C.D. Modeling the development of char structure during the rapid heating of pulverized coal. Combust. Flame 2004, 136, 519–532. [Google Scholar] [CrossRef]
  9. Engin, B.; Atakul, H.; Unlu, A.; Olgun, Z. CFB combustion of low-grade lignites: Operating stability and emissions. J. Energy Inst. 2019, 92, 542–553. [Google Scholar] [CrossRef]
  10. Li, J.Y.; Wang, J.M. Comprehensive utilization and environmental risks of coal gangue: A review. J. Clean. Prod. 2019, 239, 117946. [Google Scholar] [CrossRef]
  11. Yrjas, P.; Iisa, K.; Hupa, M. Comparison of SO2 capture capacities of limestones and dolomites under pressure. Fuel 1995, 74, 359–400. [Google Scholar] [CrossRef]
  12. Dong, X.W.; Wang, H.; Liu, H.; Qin, J.R. Study on SO2 emission under various atmospheres during coal combustion. Acta Sci. Circumstantiae 2003, 23, 322–326. [Google Scholar]
  13. Shi, Y.; Zhong, W.Q.; Shao, Y.J.; Liu, X.J. Energy efficiency analysis of pressurized oxy-coal combustion system utilizing circulating fluidized bed. Appl. Therm. Eng. 2019, 150, 1104–1115. [Google Scholar] [CrossRef]
  14. Li, S.Y.; Li, W.; Xu, M.X.; Wang, X.; Li, H.Y.; Lu, Q.G. The experimental study on nitrogen oxides and SO2 emission for oxy-fuel circulation fluidized bed combustion with high oxygen concentration. Fuel 2015, 146, 81–87. [Google Scholar] [CrossRef]
  15. Jia, L.; Tan, Y.; McCalden, D.; Wu, Y.; He, I.; Symonds, R.; Anthony, E.J. Commissioning of a 0.8 MWth CFBC for oxy-fuel combustion. Int. J. Greenh. Gas Control 2012, 7, 59–69. [Google Scholar] [CrossRef]
  16. Jia, L.; Tan, Y.; Anthony, E.J. Emissions of SO2 and NOx during Oxy-Fuel CFB Combustion Tests in a Mini-Circulating Fluidized Bed Combustion Reactor. Energy Fuels 2010, 24, 910–915. [Google Scholar] [CrossRef]
  17. Lyngfelt, A.; Leckner, B. Sulphur capture in fluidized bed boilers: The effect of reductive decomposition of CaSO4. Chem. Eng. Sci. 1989, 40, 1131–1141. [Google Scholar] [CrossRef]
  18. Belin, E. Babcock & Wilcox CFB boilers—Design and experience. Fuel Energy Abstr. 2002, 43, 272. [Google Scholar]
  19. Liu, D.B.; Li, W.; Li, S.Y.; Song, W.H.; Liu, D.F.; Kong, R.J. Transformation characteristics of sodium, chlorine and sulfur of Zhundong coal during O2/CO2 combustion in circulating fluidized bed. Energy 2019, 185, 254–261. [Google Scholar] [CrossRef]
  20. Chen, G.B.; Chatelier, S.; Lin, H.T.; Wu, F.H.; Lin, T.H. A Study of Sewage Sludge Co-Combustion with Australian Black Coal and Shiitake Substrate. Energies 2018, 11, 3436. [Google Scholar] [CrossRef] [Green Version]
  21. Wang, H.; Zhang, L.Z.; Qin, J.R.; Zheng, C.G. Experimental study on the desulfurization of calcium-based sorbent in CO2 enriched environment. J. Eng. Thermophys. 2001, 22, 374–377. [Google Scholar]
  22. Wang, H.; Zhang, L.Z.; Lu, X.H.; Zhen, C.G. Microstructure changes of calcium-based sorbent during desulfurization in O2/CO2 mixture. J. Eng. Thermophys. 2001, 22, 127–129. [Google Scholar]
  23. Wang, H.; Qiu, J.R.; Zheng, C.G. SO2 formation characteristics of coal in O2/CO2 mixture. J. Huazhong Univ. Sci. Technol. 2002, 30, 100–102. [Google Scholar]
  24. Zhang, Z.L.; Zeng, Q.D. Numerical simulation and experimental analysis on nitrogen and sulfur oxides emissions during the co-combustion of Longyan anthracite and sawmill sludge. Fuel 2019, 254, 115611. [Google Scholar] [CrossRef]
  25. Yang, N.N.; Guo, H.Q.; Liu, F.R.; Zhang, H.; Hu, Y.F.; Hu, R.S. Effects of atmospheres on sulfur release and its transformation behavior during coal thermolysis. Fuel 2018, 215, 446–453. [Google Scholar] [CrossRef]
  26. Hou, J.L.; Ma, Y.; Li, S.Y.; Shi, J.; He, L.; Li, J. Transformation of sulfur and nitrogen during Shenmu coal pyrolysis. Fuel 2018, 231, 134–144. [Google Scholar] [CrossRef]
  27. Wang, H.Y.; Cheng, C.F.; Chen, C. Characteristics of polycyclic aromatic hydrocarbon release during spontaneous combustion of coal and gangue in the same coal seam. J. Loss Prev. Process Ind. 2018, 55, 392–399. [Google Scholar] [CrossRef]
  28. Liang, X.; Wang, Q.; Luo, Z.; Eddings, E.; Ring, T.; Li, S.; Lin, J.; Xue, S.; Han, L.; Xie, G. Experimental and numerical investigation on sulfur transformation in pressurized oxy-fuel combustion of pulverized coal. Appl. Energy 2019, 253, 113542. [Google Scholar] [CrossRef]
  29. Xu, L.J.; Cheng, L.M.; Ji, J.Q.; Wang, Q.H.; Fang, M.X. A comprehensive CFD combustion model for supercritical CFB boilers. Particuology 2019, 43, 29–37. [Google Scholar] [CrossRef]
  30. Xiao, P.; Sun, X.B.; Xu, Z.Q. Test and study on selfdesulfuration behavior of coal sorts in 1 MWth CFB combustion test stand. Therm. Power Gener. 2004, 42, 30–33. [Google Scholar]
  31. Lu, Q.G.; Yong, Y.M.; Na, Y.J.; Bao, S.L.; Sun, Y.K.; He, J.; Jiao, W.H.; Gao, M. Influence of coal on SO2 and NOx emissions of circulating fluidized bed combustion. Proc. CSEE 2005, 25, 145–149. [Google Scholar]
  32. Zhao, P.B.; Wang, P.L.; Wang, H.T.; Liu, K.F.; Han, Y. Desulfuration efficiency Test and Study on Different Particle Size. Inn. Mong. Electr. Power 2010, 28, 24–26. [Google Scholar]
  33. Adanez, J.; Gayán, P.; Grasa, G.; Diego, L.F.D.; Armesto, L.; Cabanillas, A. Circulating fluidized bed combustion in the turbulent regime: Modelling of carbon combustion efficiency and sulphur retention. Fuel 2001, 80, 1405–1414. [Google Scholar] [CrossRef]
  34. Niu, S.L.; Han, K.H.; Lu, C.M. Release of sulfur dioxide and nitric oxide and characteristic of coal combustion under the effect of calcium based organic compounds. Chem. Eng. J. 2011, 168, 255–261. [Google Scholar] [CrossRef]
  35. Hlincik, T.; Buryan, P. Desulfurization of boiler flue gas by means of activated calcium oxide. Fuel Process. Technol. 2013, 111, 62–67. [Google Scholar] [CrossRef]
  36. Shao, L.M.; Fan, S.S.; Zhang, H.; Yao, Q.S.; He, P.J. SO2 and NOx emissions from sludge combustion in a CO2/O2 atmosphere. Fuel 2013, 109, 178–183. [Google Scholar] [CrossRef]
  37. Ma, L.; Guo, A.L.; Fang, Q.Y.; Wang, T.X.; Zhang, C.; Chen, G. Combustion interactions of blended coals in an O2/CO2 mixture in a drop tube furnace: Experimental investigation and numerical simulation. Appl. Therm. Eng. 2018, 145, 184–200. [Google Scholar] [CrossRef]
  38. Yan, J.; Lu, X.; Wang, Q.; Kang, Y.; Li, J.; Xu, Z.; Lei, X.; Zheng, X.; Fan, X.; Liu, Z. Study on the influence of secondary air on the distributions of flue gas composition at the lower part of a 600 MW supercritical CFB boiler. Fuel Process. Technol. 2019, 196, 106035. [Google Scholar] [CrossRef]
  39. Yang, T.H.; Zhou, J.H.; Li, R.D.; Cen, K.F. Kinetics for formation of CaS as sulphur intermediate retention. Proc. CSEE 2006, 26, 104–108. [Google Scholar]
  40. Duan, Y.Q.; Duan, L.B.; Anthony, E.J.; Zhao, C.S. Nitrogen and sulfur conversion during pressurized pyrolysis under CO2 atmosphere in fluidized bed. Fuel 2017, 189, 98–106. [Google Scholar] [CrossRef] [Green Version]
Figure 1. Schematic diagram of the small fluidized bed experimental bench.
Energies 13 00553 g001
Figure 2. Flowchart of the 3 MWth CFB combustion test bed.
Energies 13 00553 g002
Figure 3. Distribution of sulfur-containing substances at different temperatures in an oxidizing atmosphere with an excess air ratio of 1.2.
Energies 13 00553 g003
Figure 4. Balanced content of sulfur dioxide.
Energies 13 00553 g004
Figure 5. Balanced content of CaSO4.
Energies 13 00553 g005
Figure 6. Balanced content of CaSiO3.
Energies 13 00553 g006
Figure 7. Distribution of sulfur-containing substances in a strong reducing atmosphere with an excess air coefficient of 0.4.
Energies 13 00553 g007
Figure 8. Relationship between H2S content and temperature under different iron/sulfur ratio.
Energies 13 00553 g008
Figure 9. The corrected O/C ratio of the middling.
Energies 13 00553 g009
Figure 10. Distribution of sulfur-containing substances under different O/C ratio.
Energies 13 00553 g010aEnergies 13 00553 g010b
Figure 11. Balanced content of FeS.
Energies 13 00553 g011
Figure 12. Balanced content of CaS.
Energies 13 00553 g012
Figure 13. Balanced content of FeS.
Energies 13 00553 g013
Figure 14. Curve of SO2 release concentration.
Energies 13 00553 g014
Figure 15. Comparison of sulfur fixation results.
Energies 13 00553 g015
Figure 16. Relationship between SO2 emission and self-desulfurization efficiency with bed temperature.
Energies 13 00553 g016
Figure 17. Sulfur dioxide emission in relation with the amount of oxygen.
Energies 13 00553 g017
Table 1. Chemical analysis of gangue and coal samples.
Elemental Analysis (%)
Gangue IGangue IIMiddlingSample Coal ISample Coal II
Car14.329.3846.2233.4631.48
Har2.061.73.242.772.62
Oar11.6710.3816.9314.8314.31
Nar0.540.350.890.750.67
Sar1.652.491.401.51.84
Aar63.570.325.7940.8743.59
Analysis of ash composition (%)
Gangue IGangue IIMiddlingSample coal ISample coal II
SiO249.2550.2848.3548.7149.12
Al2O337.9839.2536.2836.9637.47
Fe2O36.904.594.645.544.62
CaO1.071.271.691.441.52
MgO0.160.120.950.630.62
TiO22.272.311.531.831.84
K2O0.480.250.780.660.57
Na2O0.320.380.420.380.40
Table 2. Alkaline oxide to sulfur ratio.
MiddlingSample Coal ISample Coal II
Ca/S0.1780.2240.206
Mg/S0.1400.1380.117
K/S0.0980.1230.092
Na/S0.0800.1070.099
Alkaline-oxide/S0.4960.5920.515
Table 3. Input conditions for thermodynamic simulation.
Component (mol)MiddlingSample Coal ISample Coal II
C176.08118.9791.46
H74.0659.0545.73
O24.1919.7915.59
N2.912.291.69
S111
SiO29.5014.1612.44
Al2O34.196.325.58
Fe2O30.340.600.44
CaO0.360.450.41
MgO0.280.280.23
TiO20.230.400.35
K2O0.100.120.09
Na2O0.080.110.10
Table 4. Sulfur fixation rate of simulation results.
MiddlingSample Coal ISample Coal II
Total sulfur (mol)111
SO2 released (mol)0.690.610.64
Sulfur fixation rate (%)313936
Table 5. O/C ratio of coal samples.
UnitMiddlingSample Coal ISample Coal IICorrected Value of Middling
Original Cmol176.08118.9791.46176.08
Original Omol24.1919.7915.5930.19
Oxygen in airmol76.1652.1440.1776.16
O/C ratio11.0021.0431.0491.037
Table 6. Experimental sulfur fixation rate.
UnitMiddlingSample Coal ISample Coal II
Actual releasemg2.182.732.61
Total sulfur%1.401.841.5
Total S releasemg2.803.683.46
Sulfur fixation rate%22.125.824.6
Table 7. Report test sulfur fixation rate.
UnitSample Coal ISample Coal II
Total sulfur%1.851.72
Test temperature rangeK1180–12101110–1200
Sulfur fixation rate%3520.4–31.6
Table 8. Combustion data of desulfurization conditions without limestone.
Serial NumberItemUnitWorking Condition 1Working Condition 2Working Condition 3Working Condition 4
1Thermal powerMW2.272.842.991.01
2Amount of limestonekg/h0000
3Calcium-sulfur molar ratio-0000
4Bed temperatureK1140117411971058
5Excess air factor (α)-1.351.221.22.01
6Bottom ash share (αlz)%71.871.871.871.8
7Bottom ash carbon content (Clz)%1.944.223.261.39
8Fly ash share (αfh)%28.228.228.228.2
9Carbon content of fly ash (Cfh)%10.368.277.319.93
10Combustion efficiency (ηr)%94.3292.9994.3494.8
11Desulfurization efficiency (ηs)%31.626.420.338
Table 9. Desulfurization efficiency under test conditions with limestone.
ItemUnit567891011
Thermal powerMW2.582.582.582.582.582.582.58
Amount of limestonekg/h177.5177.5177.5177.5177.5256.9174.3
Ca/S-3.73.73.73.73.75.363.64
Bed temperatureK1166115911191172117611581152
Excess air factor (α)-1.221.211.221.221.241.21.21
Bottom ash share (αlz)%71717171717171
Bottom ash carbon content (Clz)%3.44.062.734.333.074.882.6
Fly ash share (αfh)%29292929292929
Carbon content of fly ash (Cfh)%5.687.147.546.094.745.329.93
Combustion efficiency (ηr)%9391.3992.991.6393.9490.4691.83
Desulfurization efficiency (ηs)%94.394.1988.5588.2488.8896.5188.34

