Article

The Influence of Porous Structure on the Electrochemical Properties of LiFe0.5Mn0.5PO4 Cathode Material Prepared by Mechanochemically Assisted Solid-State Synthesis

by
Daniil A. Bograchev
1,
Yury M. Volfkovich
1,*,
Valentin E. Sosenkin
1,
Olga A. Podgornova
2 and
Nina V. Kosova
2,*
1
A.N. Frumkin Institute of Physical Chemistry and Electrochemistry of the Russian Academy of Sciences, 31-4 Leninsky prospect, 119071 Moscow, Russia
2
Institute of Solid State Chemistry and Mechanochemistry, Siberian Branch of the Russian Academy of Sciences, 18 Kutateladze, 630128 Novosibirsk, Russia
*
Authors to whom correspondence should be addressed.
Energies 2020, 13(3), 542; https://doi.org/10.3390/en13030542
Submission received: 26 November 2019 / Revised: 16 January 2020 / Accepted: 19 January 2020 / Published: 22 January 2020
(This article belongs to the Special Issue Advanced Nanomaterials for Li- and Na-Ion Batteries)

Abstract

:
Carbon-free LiFe0.5Mn0.5PO4 and carbon-coated LiFe0.5Mn0.5PO4/C cathode materials were prepared by the mechanochemically assisted solid-state synthesis. The influence of the carbon coating on the porous structure, morphology, conductivity, and electrochemical characteristics of the cathode materials was analyzed using scanning electron microscopy (SEM), standard contact porosimetry (MSCP), electrochemical impedance spectroscopy (EIS), galvanostatic cycling, and galvanostatic intermittent titration technique (GITT). It has been shown that the specific surface area of LiFe0.5Mn0.5PO4/C is twice as high as that of LiFe0.5Mn0.5PO4 despite the very low content of carbon (3%). This was explained by a non-additive contribution of carbon and the active cathode material to the total specific surface area of the composite due to an introduction of carbon in the pores of the cathode material. Among the two key characteristics of a porous structure—specific surface area and volumetric porosity—specific surface area has the greatest impact on electrochemistry of LiFe0.5Mn0.5PO4/C. Mathematical modeling of the discharge profiles of LiFe0.5Mn0.5PO4/C was carried out and compared with the experiment. The cathode heating at high currents was evidenced. The temperatures and coefficients of solid-state diffusion were estimated at different currents. The calculated diffusion coefficient corresponds to the experimental one obtained by GITT at room temperature.

1. Introduction

Currently, special attention is paid to the improvement of the capacity and power characteristics of lithium-ion batteries. In addition to widely used approaches, such as preparation of nanosized materials, electron-conducting carbon coating, and doping, a new approach is being developed associated with the synthesis of electrode materials with a given porous structure [1,2,3,4,5,6]. It has been shown that porosity can have a significant impact on the specific capacity of electrode materials and their cyclability, especially at high rates, due to better access of the electrolyte to the electrode surface and facilitating charge transfer across the electrode/electrolyte interface. The void spaces separating particles of active material can help to suppress their growth during cycling. Porous electrode materials can incorporate a secondary conductive phase to improve conductivity and high-rate capability of active phases with low intrinsic conductivity.
Porous materials are classified by the dimension of the pores: microporous (<2 nm), mesoporous (2–50 nm), and macroporous (>50 nm). Among different types of porous materials, the materials consisting of micron ensembles of nanoscale particles are distinguished. It is believed that they can improve electrochemical characteristics, as they combine the advantages of both nano- and micron-sized materials and provide high-rate intercalation/deintercalation of lithium ions. Important parameters that determine the electrochemical properties of porous electrode materials are pore size distribution, uniformity of distribution, pore architecture, wall thickness, specific surface area, etc. The porosity is determined by the synthesis method. However, the synthesis of a cathode material with a porous structure does not always guarantee the improvement of its electrochemical properties. In each case, the pore size should be optimized.
In the present work, the effect of the porosity was studied using LiFe05Mn0.5PO4 as one of the promising cathode materials for high-energy density lithium-ion batteries [7]. Instead of traditional methods of preparation of porous materials, the mechanochemically assisted solid-state synthesis was used; the impact of the porous structure of carbon-free LiFe0.5Mn0.5PO4 and carbon-coated LiFe0.5Mn0.5PO4/C on their electrochemical properties was investigated experimentally and by modeling. It was assumed that the as-prepared materials with nanostructured secondary particles can be considered as porous ones, which could show improved electrochemical behavior.
The first models of porous electrodes were developed in the 1960s to 1970s of the 20th century by V. Levich [8] and J. Newman [9]. These models describe only mass transfer in a porous medium using the macrokinetic approximation but did not consider the intercalation of ions. The first electrode intercalation model was described in [10]; it was used to simulate the intercalation of alkaline cations with respect to the limiting current. The first comprehensive model of the lithium-ion battery, which includes electrodes and a separator using the Butler-Volmer kinetic equations, mass transport in electrolyte and intercalation and diffusion in the solid media, was developed in the first half of the 1990s by Newman’s group [11].
Later models based on the Newman’s group model were used in optimization simulations (see, e.g., [12,13,14]), and in the analysis of the working characteristics, impedance data, and transition processes in batteries (see, e.g., [15,16,17]). The models, considering only one intercalation electrode, were also widely used, for example, for modeling intercalation in a carbon material [18] or in an active cathode material [19].
In this study, a quasi-two-dimensional mathematical model [17] was used to elucidate the effect of the porous structure on the electrochemical performance of the LiFe0.5Mn0.5PO4 materials. The method of the finite elements solving numerically the equations of the model of lithium-ion battery takes into account intercalation and extraction of lithium ions in the active mass of negative and positive electrodes, the dependence of equilibrium electrode potentials on the concentration of the intercalated lithium, the ion transfer in pores of the electrode and separator, the kinetics of the electrode reactions, and the electric double layer charging. By fitting the model to the experimental data, the kinetic parameters of the electrochemical reaction and the solid-phase diffusion coefficients were estimated.

2. Materials and Methods

The carbon-free LiFe0.5Mn0.5PO4 (hereinafter, LFMP) and the carbon-coated LiFe0.5Mn0.5PO4/C (LFMP/C) samples were prepared by the solid-state synthesis in three-component reagent mixtures of LiH2PO4, Fe2O3 (α-modification), and MnO2 using carbothermal reduction. Carbon black “P 277” (from the Institute of Problems of Hydrocarbons Processing SB RAS, Omsk, Russia) was added as a reducing agent (in the amount required to reduce Fe3+ and Mn4+ in Fe2O3 and MnO2 to Fe2+ and Mn2+) and as a covering agent (additional 3 wt%) to prepare carbon-coated material. The mechanical activation (MA) of the stoichiometric reagent mixtures was performed using a high-energy AGO-2 planetary mill in an Ar atmosphere at ≈1000 rpm for 5 min. The activated mixtures were subsequently annealed at 700 °C for 2 h under an Ar flow.
The as-prepared samples were characterized by X-ray powder diffraction (XRD), scanning electron microscopy (SEM), transmission electron microscopy (TEM), standard contact porosimetry (MSCP), electrochemical impedance spectroscopy (EIS), galvanostatic cycling, and galvanostatic intermittent titration technique (GITT). XRD was performed using a Bruker D8 Advance diffractometer, Cu irradiation (λ = 1.54181 Å). The XRD patterns were collected over the range of 10–70° with a step of 0.02° s−1 and uptake time of 0.3–0.5 s. Structural refinement of the XRD data was carried out by the Rietveld method using the GSAS software package. Particle size and morphology were investigated by SEM using a Hitachi TM-1000 scanning electron microscope. TEM measurements were performed using a JEM-2200FS transmission electron microscope with an acceleration of 200 kV and magnification of 0.1 nm.
The porosity of the electrode materials was studied using MSCP [20,21]. MSCP allows measuring pore distribution curves over their radii in the widest possible range: from ≈1 nm to 100 µm. First, the sample and the standard were dried under vacuum at 170 °C and weighed separately. Then, the sample was placed between two standards, vacuumized, impregnated with octane and partially dried in vacuum. The set was disassembled periodically; its components were weighed. The state of the capillary equilibrium was controlled for each point of the pore size distribution curve. The measurements were continued until the sample weight remained constant. The specific surface area was estimated from the porosimetric data according to the following equation:
S 1 = 2 r = 1 r max 1 r 2 d V d ln r d r = 2 r = 1 r max d V r ,
where V is the volume of the pores (porosity), r is the radius of the pores.
For the electrochemical testing, the composite cathodes were fabricated by mixing 75 wt% of the active material (excluding the carbon coating) with 20 wt% of carbon black (including the carbon coating) and 5 wt% of the PVDF/NMP binder. The mixed slurry was then pasted on the aluminum foil to obtain the working electrodes. The loading density of the prepared samples was 2–3 mg·cm−2, and an electrode diameter of 10 mm was used throughout. The working electrodes were vacuum-dried at 90 °C before cell assembly. The Swagelok-type cells were assembled in an argon-filled glove box with Li as an anode, 1M LiPF6 (Sigma Aldrich, 99.99%) solution with ethylene carbonate and dimethylcarbonate (Alfa Aesar, 99%) 1:1 by weight as an electrolyte, and a glass fiber filter (Whatman, Grade GF/C) as a separator. Cycling was performed using a galvanostatic mode at C/10–10C charge/discharge rates within the voltage range of 2.0–4.5 V vs. Li/Li+ at room temperature. The GITT measurements were carried out at a C/10 rate (I0 = 16.8 mA·g−1) by applying a galvanostatic step of 20 min and a relaxation time of 40 min. The conductivity of the prepared samples was measured in pellets with Ag electrodes using a RLC meter E7-25 (Belarus) within the 25 Hz–1 MHz range at room temperature.

3. Mathematic Modeling

In this work, we used a quasi-two-dimensional model [11], built in the framework of macrokinetic approximation, modeling the distribution of electric potential (in the solid phase and in the electrolyte) and the distribution of lithium concentration along the electrode thickness. The model geometry consists of an active electrode and a separator (see Figure 1). It considers the diffusion of the electrolyte in only one dimension of particles forming a porous cathode (x), and the solid-state diffusion of lithium ions in the cathode particles in another “perpendicular” dimension (r). The model assumes that at each point of the electrode, there are particles at which intercalation of lithium ions can occur. The pores of the electrode and the separator are filled with electrolyte. The model takes into account the averaged effective parameters, such as the Li diffusion and the electrical conductivity of the electrolyte, the specific surface area of the electrode, the kinetics of the intercalation reaction, the solid-state diffusion of Li, the electronic conductivity of the cathode, the volumetric porosity, and Archie’s coefficient.
The model includes a system of the following Equations (2)–(21). First, it is assumed that all the particles of the cathode are spherically symmetrical; the equation of the solid-state diffusion of Li in such particles can be presented as follows:
c s t = 1 r 2 r ( r 2 D s c s r ) ,
where c s is the concentration of lithium ions in the solid phase, and D s is the coefficient of the solid-state diffusion. Equation (2) is the Fick law of diffusion applicable for each particle of a porous electrode located over the entire thickness of the electrode x. Boundary conditions for Equation (2) can be written as:
0 = D s c s r r = 0 , i int F = D s c s r r = r 0 ,
where r 0 is the average particle radius, F is the Faraday constant, and i int is the intercalation current density, determined by the Butler-Volmer kinetic equation:
i int = i 0 ( exp ( α η F R T ) exp ( ( 1 α ) η F R T ) ) ,
η = Φ s Φ e U r e f , L i ( c s ) ,
where η is an overvoltage, which is the difference between the electrical potentials of the solid phase ( Φ s ) and the electrolyte ( Φ e ) minus the thermodynamic equilibrium potential, U r e f , L i ( c s ) depending on the surface concentration of the intercalated lithium; the smallest current used to measure this potential, i 0 = k c c 1 α ( c lim c s ) 1 α c s α is the exchange current depending on the concentration of the electrolyte and the concentration of lithium ions in the solid phase, α is a transfer coefficient.
Charge transfer in the solid phase of the electrode is described by Ohm’s law:
i s = σ e f f Φ s x ,
where σ e f f is effective electrode conductivity.
Charge transfer in the electrolyte is described based on migration and diffusion:
i e = σ e f f , e Φ e x k e f f , e ln c L i x ,
where σ e f f , e = σ e f f , e ( c ) [22] and k e f f , e = R T σ e f f , e F ( 1 t + ) are the effective conductivities in the pores of porous medium, calculated using Archie’s law, t + is a cationic transference number.
N L i = D e f f c L i x ,
where D e f f = D ε α i is the effective diffusion coefficient in the pores of a porous medium, calculated using Archie’s law.
The equations linking the laws of conservation of charge and matter can be written as follows:
div ( i e ) = div ( i s ) = S i int ,
ε c L i t = div ( N L i ) + ( 1 t + ) S i int F ,
where ε is porosity of a porous medium, S is a specific surface density. Considering the one-dimensionality of the system, the Equations (8) and (9) can be rewritten as follows:
x ( σ e f f , e Φ e x ) + x ( k e f f , e ln c L i x ) = S i int ,
S i int + x ( σ e f f Φ s x ) = 0 ,
ε c L i t = x ( D e f f c L i x ) + ( 1 t + ) S i int F .
The system of Equations (11)–(13) should be supplemented by the boundary conditions. For the right border of the electrode (see model in Figure 1), the boundary conditions can be written as:
σ e f f Φ s x x = L s e p + L e l e = I a p p ,
σ e f f , e Φ e x x = L s e p + L e l e = 0 ,
where I a p p is the overall current density applied to the system. Equation (14) defines the applied current of the electrode; Equation (15) means that there is no current in the electrolyte on the left boundary of the electrode. At the separator/electrode boundary, the continuity conditions are satisfied for the concentration and the flux of lithium ions, the electric potential, and the electric current in the electrolyte.
For the electric potential of the solid phase, the condition is the following:
σ e f f , e Φ s x x = L s e p + L e l e = 0 .
The Equation (16) means that there is no electric current at the left boundary of the electrode. To the left of the separator, the electrolyte potential is set to zero:
Φ e x = 0 = 0 .
It is assumed that the entire current is determined only by the flux of lithium ions:
D e f f c L i x x = L s e p + L e l e = I a p p F .
The initial conditions for the lithium concentrations in the electrolyte and in the particles of the electrode can be written as:
c s t = 0 = c int ,
c L i t = 0 = c 0 .
The cell voltage is calculated as the difference in electrical potentials in the solid phase taken at the extreme points of the model:
V = Φ s x = L s e p + L e l e c t r o d Φ s x = 0 .

4. Results

4.1. Structure, Morphology, and Porosity of the LiFe0.5Mn0.5PO4 (LFMP) Samples

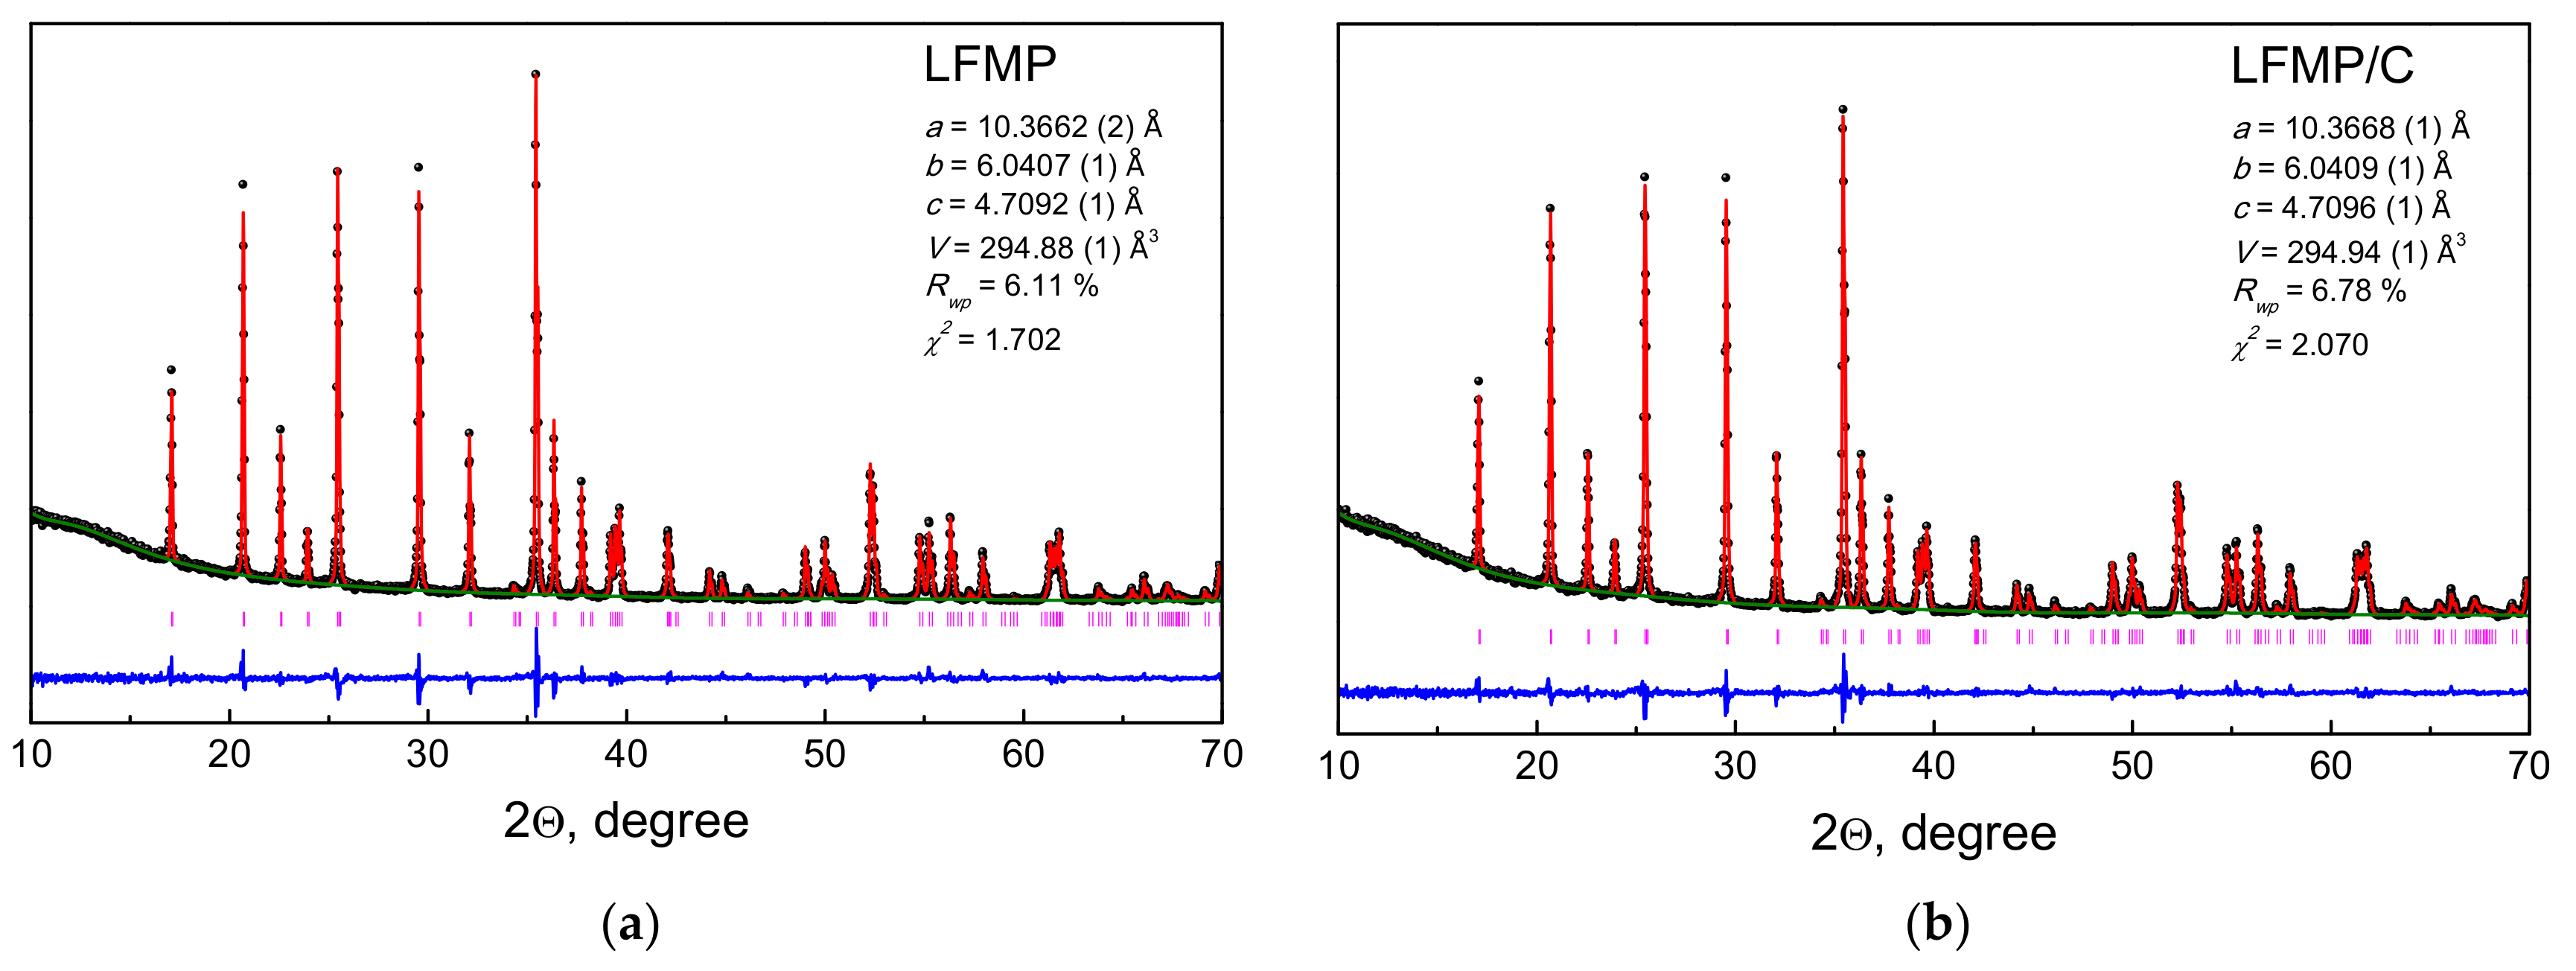
The Rietveld refined XRD patterns of the LFMP and LFMP/C samples and their lattice parameters are shown in Figure 2. It is seen that the samples are crystalline pure-phase olivine-type materials. All peaks can be successfully indexed based on the orthorhombic structure with the Pnma space group inherent to the LiFe1-xMnxPO4 solid solutions. It is seen that the lattice parameters are similar to the previous data described elsewhere [23].
The results of the microstructural analysis of the as-prepared samples are shown in Figure 3 indicating the pronounced morphological differences. According to the SEM study, the samples consist of the submicron primary particles agglomerated in the micron-sized secondary particles. The particles of the LFMP sample acquire a rod-like morphology, while they are noticeably smaller and have an irregular shape for the carbon composite LFMP/C indicating that the carbon additive acts as a surfactant during MA and inhibits the sintering of particles upon the subsequent heat treatment. It is evident that these two samples differ by the pore size as well. The evolution of the CO2 gas during the milling and heating processes and nano-structuration lead to the formation of the special porous network structures. The formation of meso- and macropores in the LFMP/C sample are clearly seen in the TEM image (Figure 3c).
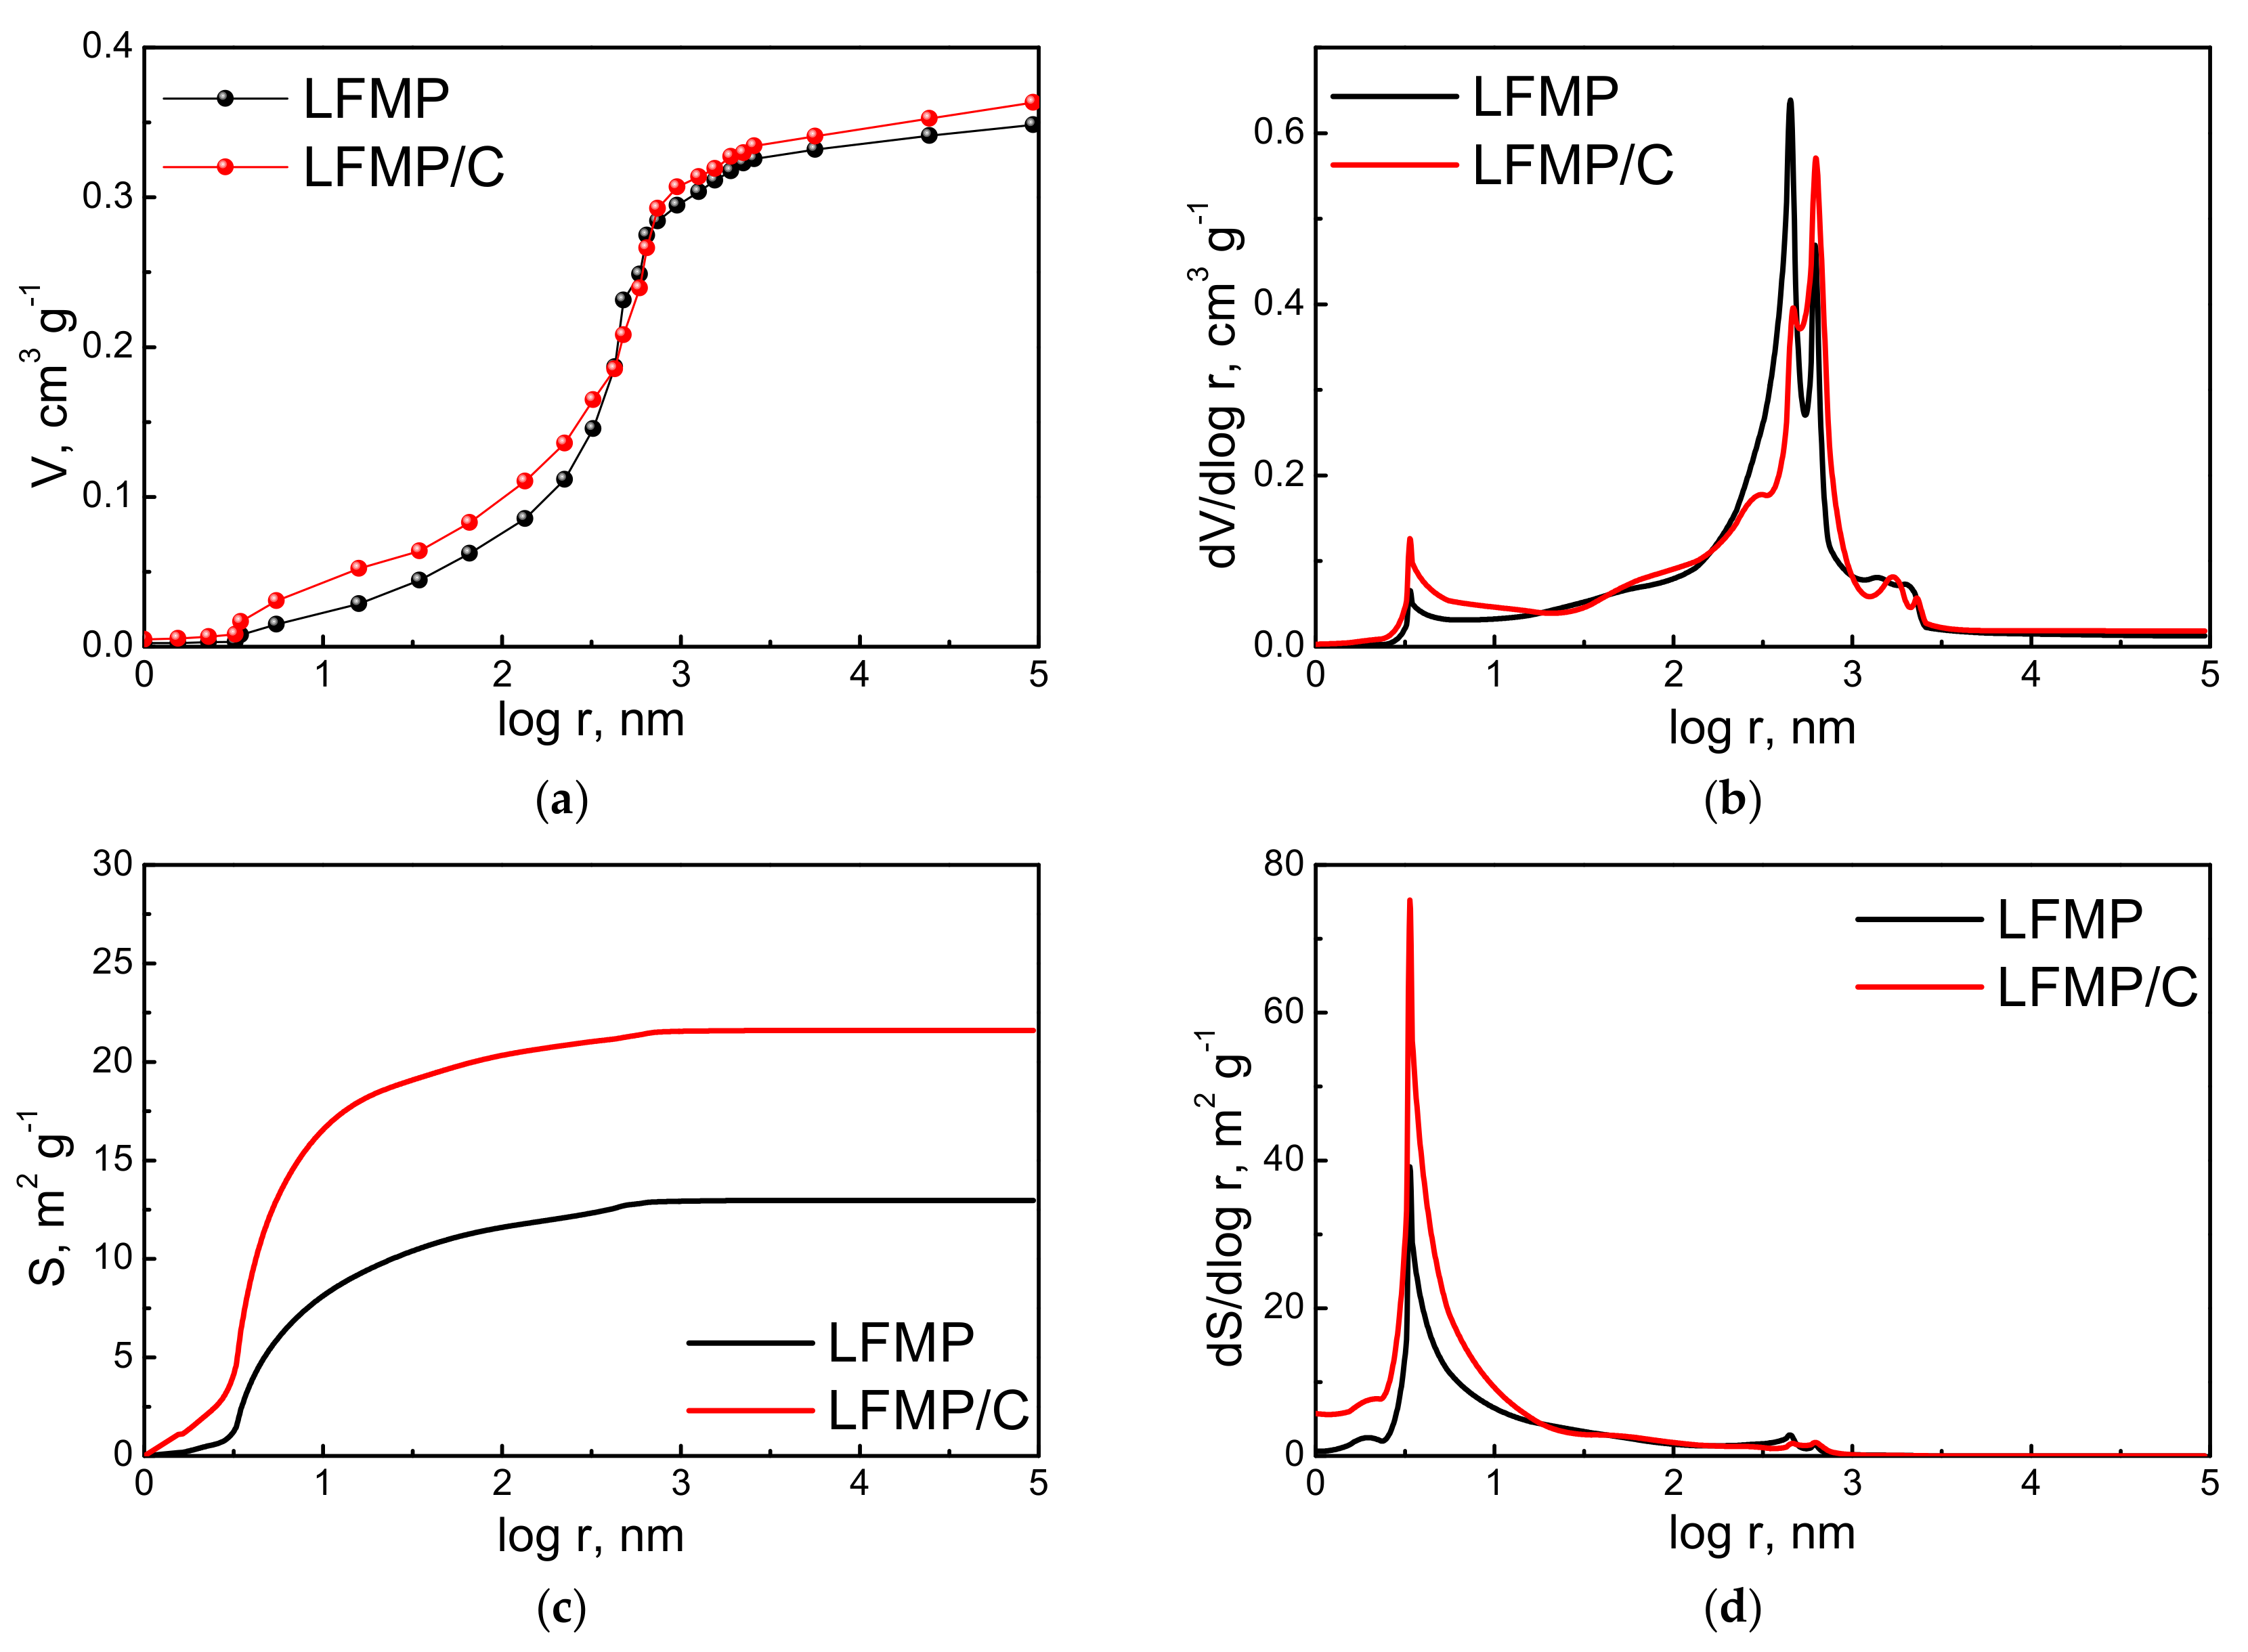
The porous structure of the as-prepared samples was studied in detail by MSCP. Table 1 presents the porosimetric data and the values of the experimental (St) and calculated (St,cal.) total specific surface area and those of mesopores (Sme). It is seen that the meso- and macropore surface of LFMP/C noticeably exceeds that of LFMP. The value of St,cal. for the LFMP/C composite was calculated assuming the additive contribution of the specific surface values of LFMP (97%) and carbon black SC (3%). Thus, St,cal. = 0.97SLFMP + 0.03SC. According to our previous data [24], the value of SC is equal to 833 m2·g−1. The value of St,cal. for the carbon-coated LFMP/C exceeds the corresponding experimental value (Table 1). This suggests that there is no additive contribution of carbon black and the active cathode component to the total specific surface area, most probably, due to the partial introduction of carbon black into the pores of the LFMP particles (Figure 3c). It also means that there is very good contact between the particles of LFMP and carbon black.
Both samples contain three maxima on the dV/dlogr plots: (1) logr < 1, (2) 2.6 < logr < 2.8, and (3) logr > 2.8 (Figure 4). Carbon black contributes to the first maximum as it has a very high specific surface area of 833 m2·g−1 [24]. In the mesopore and macropore regions, the LFMP/C sample has a pronounced regular bidisperse structure characterized by two sharp peaks on the dV/dlogr curve and one sharp peak on the dS/dlogr curve. This regular porous structure indicates that the diameter of all particles of LFMP/C is almost the same. According to Figure 4c, the surface distribution vs. pore radius for LFMP/C significantly exceeds that for LFMP.

4.2. Electrochemical Properties

The electrochemical properties of the LFMP samples were investigated in a galvanostatic mode within the 2.0–4.5 V range at the C/10–10C charge/discharge rates. The results are shown in Figure 5a,b. The samples exhibit the charge-discharge profiles consisting of two plateaus at 3.4 and 4.0 V vs. Li/Li+, typical for the LFMP solid solutions and corresponding to the Fe2+/Fe3+ and Mn2+/Mn3+ redox couples, respectively. At high rates, the electrochemical activity of the Mn2+/Mn3+ couple significantly decreases, and its plateau gradually disappears. Figure 5c,d shows charge-discharge specific capacity of the LFMP samples vs. cycling number and cycling rate. It is clearly seen that the carbon-coated sample shows higher capacity and better high-rate capability. The higher specific capacity and material utilization are associated with the presence of larger mesopores, both in LFMP and carbon, which act as a transport system for the electrolyte and increase the accessibility to smaller pores. The improved high-rate performance of LFMP/C can be ascribed to the higher specific surface area and reduced transfer resistance of the Li ions in the coated material with dual porosity. The network of 3 nm mesopores and relatively larger 450–630 nm pores (3D interconnected porous structure) facilitate the electrolyte diffusion to the surface of the active cathode material and provides favorable channels for the Li ions to penetrate into the bulk. Comparing the values of specific surface area and volumetric porosity of LFMP and LFMP/C (Table 1)—the two key characteristics of a porous structure—it can be concluded that specific surface area has the greatest impact on electrochemistry of these materials.
The improved electrochemical performance of the carbon composite LFMP/C is also associated with improved conductivity due to the formation of the conductive carbon matrix. Indeed, according to EIS, its electrical conductivity is superior: 4.72·10−4 S·cm−1 vs. 1.45·10−4 S·cm−1 for LFMP.
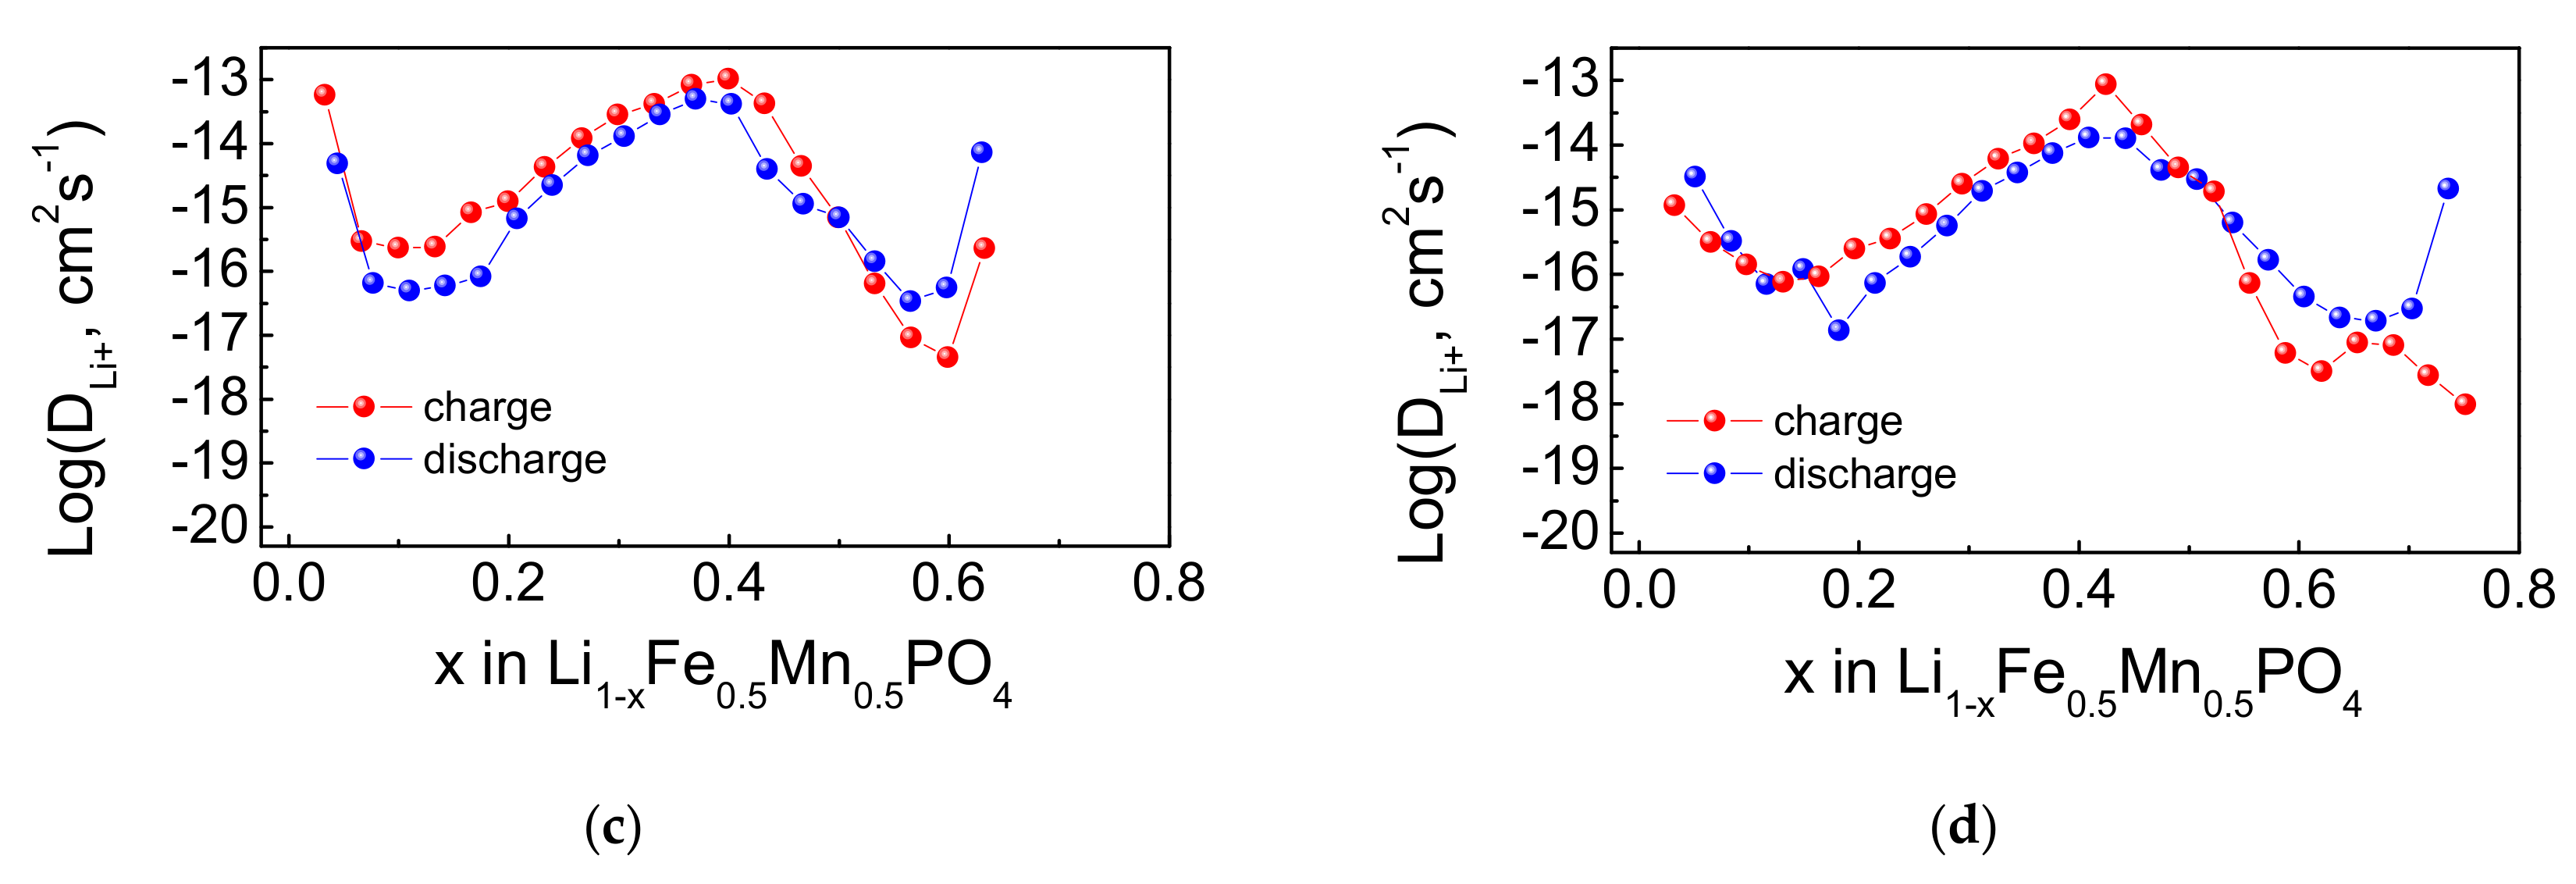
Figure 6 shows the GITT and OCV curves (Figure 6a,b), and the calculated Li+ diffusion coefficient DLi+ (Figure 6c,d) as a function of the cell voltage during charge and discharge of LFMP and LFMP/C at room temperature. It is clearly seen that the relaxation spikes on the GITT curves are very short in the middle part and become longer at the end of the charge/discharge processes. Accordingly, the values of diffusion coefficient DLi+ are almost identical for both samples and have the maxima of 10−13–10−14 cm2·s−1 at the bend of two plateaus.

4.3. Calculation Results

The system of the Equations (2) and (16)–(18) with the boundary conditions (3), (14)–(18) and the initial Equations (19) and (20) were solved using the finite elements of the COMSOL Multiphysics software package. The equations of the system were presented by PDE general forms and the diffusion module. The parameters were taken from the experiment and found by fitting with the experimental data (Table 1, Table 2 and Table 3).
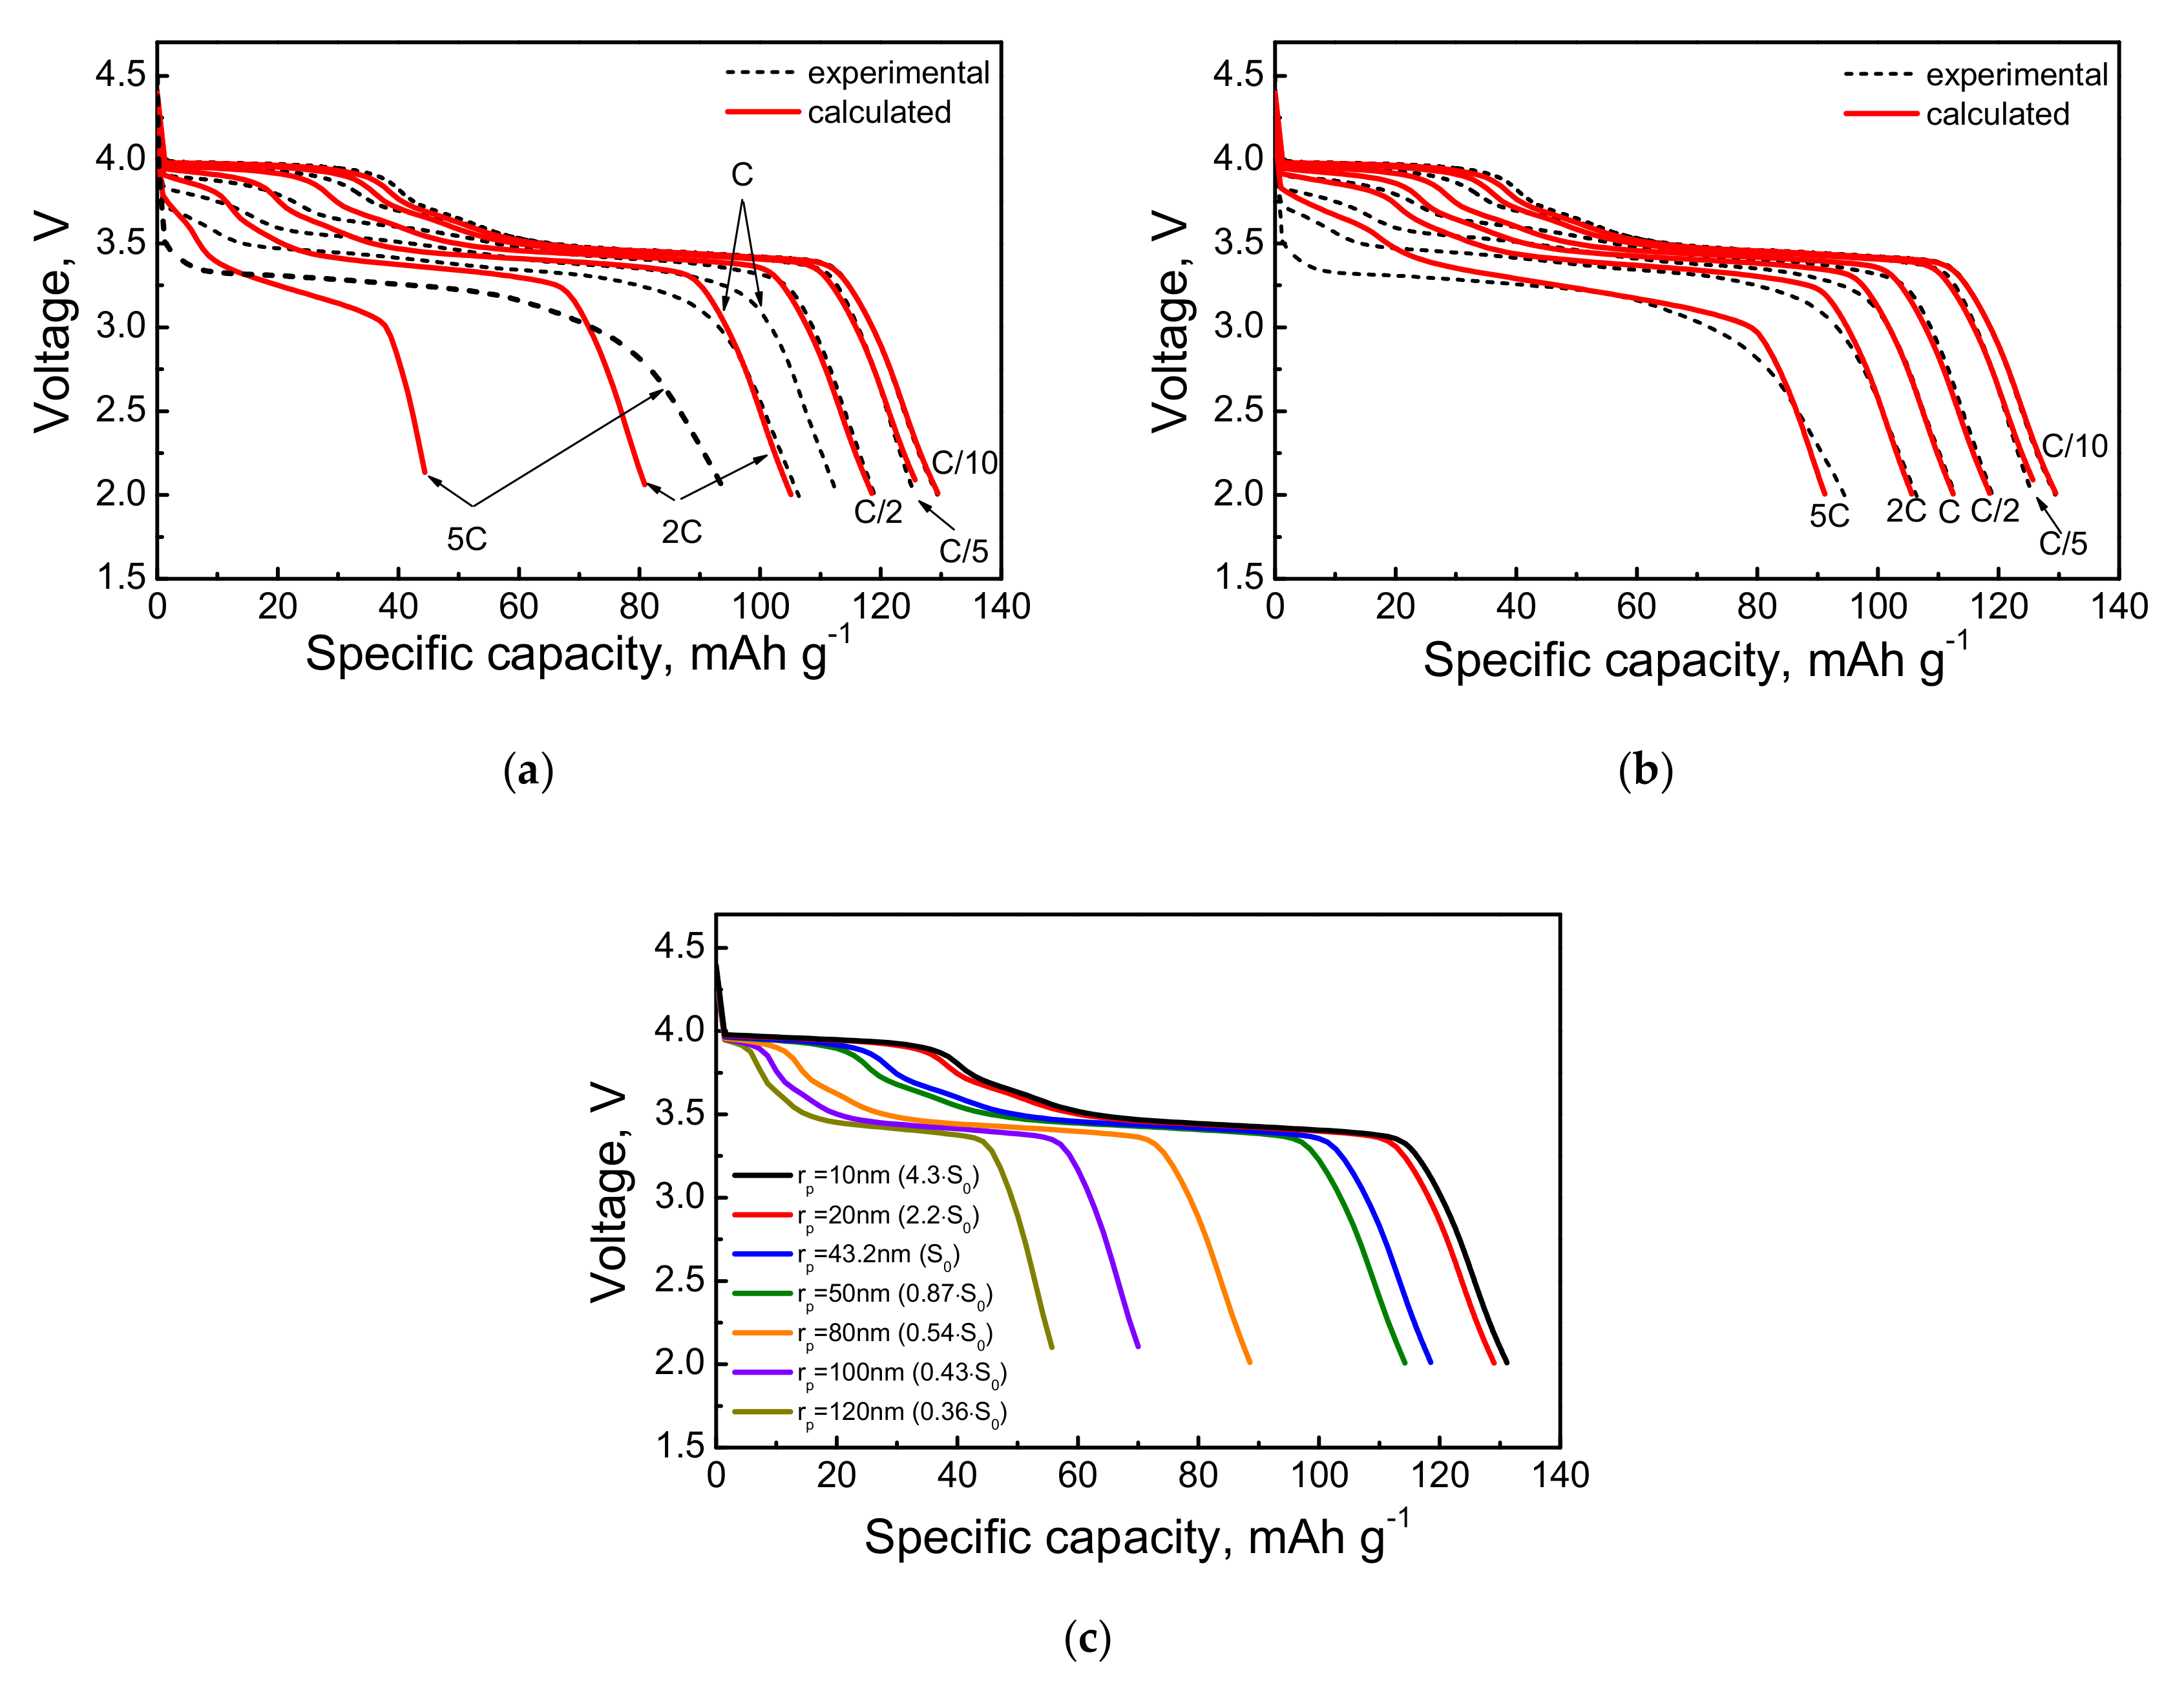
As it can be seen in Figure 7a, the data calculated by the model are in good agreement with the experimental discharge curves at relatively low currents of 0.1C, 0.2C, 0.5C, however, at higher currents, 1C, 2C, and 5C, the calculated capacities are much lower than the experimental ones. This can be explained by heating the sample under high current regimes, which is described in a number of papers (see, e.g., [26,27,28,29]). Figure 7b shows the calculated discharge curves compared with the experimental ones considering the temperature dependence of the diffusion coefficient (see Table 3) based on the literature data [30]. Thus, when the sample heating and changing in the diffusion coefficient at high currents are taken into account, the calculated curves are consistent with the experimental data. Taking into consideration the porous structure of the active cathode mass, the as-developed model gives the value of the diffusion coefficient at room temperature close to that obtained by the GITT method. Figure 7c shows the discharge curves calculated by this model for cathodes with different specific surface areas and corresponding particle radii at a current of 0.5C (when heating is absent), where S0 of the active cathode material is equal to 32 m2·cm−3 (Table 1). As follows from the figure, with increasing specific surface area (and the corresponding decrease in the radius of particles) the capacity increases, which is caused by reducing the pathways of lithium solid-state diffusion.
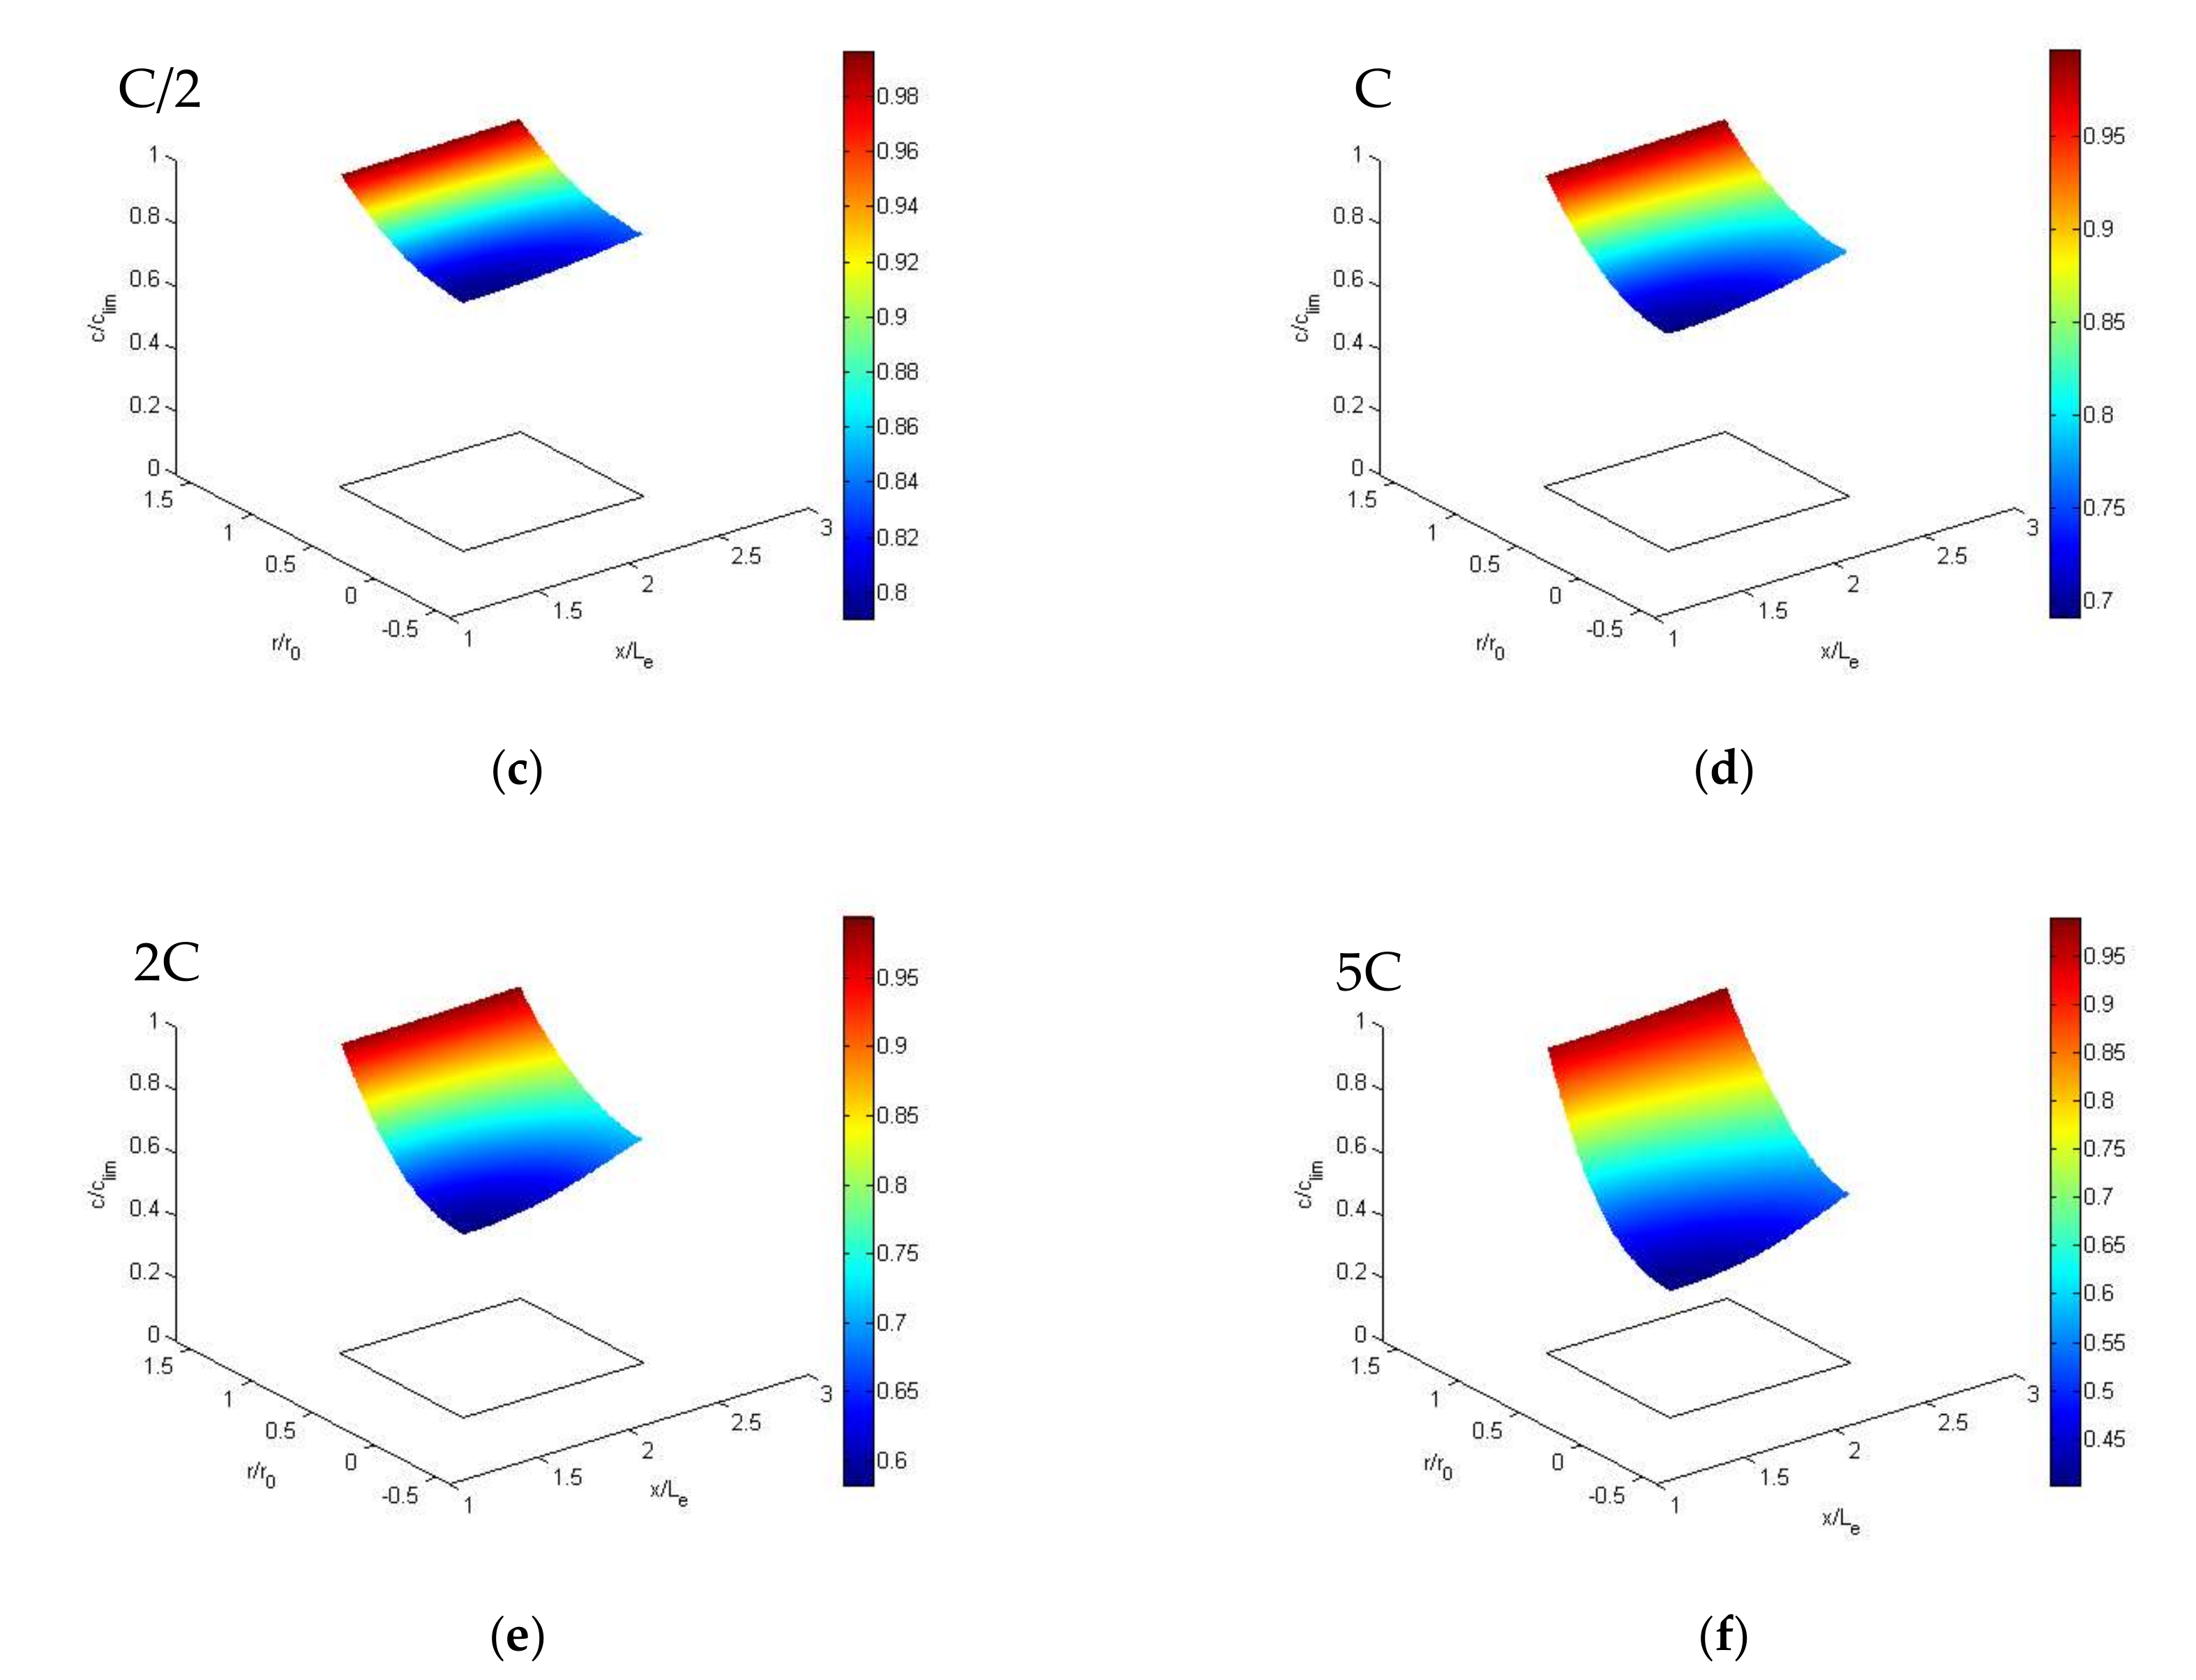
Figure 8a–e shows the profiles of dimensionless lithium concentration over the cathode thickness and the particle radius for different discharge currents. Obviously, as the current increases, the uneven distribution of lithium increases with both the cathode thickness and the particle radius.

5. Conclusions

Phase-pure carbon-free LiFe0.5Mn0.5PO4 and carbon-coated LiFe0.5Mn0.5PO4/C cathode materials with the different porous structures were prepared by the mechanochemically assisted solid-state method. It was shown that the porous structure influences their electrochemical properties. Among the two key characteristics of a porous structure—specific surface area and volumetric porosity—specific surface area has the greatest impact on electrochemistry of LiFe0.5Mn0.5PO4/C: an increase in S unambiguously leads to an increase in capacity with other characteristics being constant. Mathematical modeling of the discharge processes at different currents from 0.1C to 5C was carried out, taking into account the intercalation of lithium ions into the solid phase, the kinetics of the electrode reaction, the diffusion kinetics in the electrolyte in the pores of the electrode and the separator, and the charge transfer in the electrolyte and in the solid phase. It was assumed that the cause of the discrepancy between the calculated and experimental discharge curves at high currents stems from the heating of the samples. The calculated values of the solid-state diffusion coefficients increase at high currents as well; they are close to those obtained by GITT at room temperature. The profiles of the dimensionless concentration of lithium over the cathode thickness and the particle radius for different discharge rates are simulated for different discharge currents.

Author Contributions

Conceptualization, N.V.K. and Y.M.V.; investigation, D.A.B., Y.M.V., O.A.P., V.E.S.; writing—original draft preparation, N.V.K., Y.M.V., D.A.B.; writing—review and editing, N.V.K. All authors have read and agreed to the published version of the manuscript.

Funding

The work was partially supported by the Russian Foundation for Basic Research (grant no. 19-03-00746).

Acknowledgments

The authors are thankful to A. Ishchenko for recording the TEM images and A. Ukhina for registration of the XRD patterns.

Conflicts of Interest

The authors declare no conflict of interest.

References

  1. Liu, P.S.; Chen, G.F. General introduction to porous materials. In Porous Materials. Processing and Applications, 1st ed.; Butterworth-Heinemann: Oxford, UK, 2014. [Google Scholar] [CrossRef]
  2. Pei, Z.; Li, Z.; Zheng, X. Porous materials for lithium-ion batteries. J. Nanosci. Nanotechnol. 2016, 16, 9028–9049. [Google Scholar] [CrossRef]
  3. Vu, A.; Qian, Y.; Stein, A. Porous electrode materials for lithium-ion batteries-how to prepare them and what makes them special. Adv. Energy Mater. 2012, 2, 1056–1085. [Google Scholar] [CrossRef]
  4. Song, J.; Kim, J.; Kang, T.; Kim, D. Design of a porous cathode for ultrahigh performance of a Li ion battery: An overlooked pore distribution. Sci. Rep. 2017, 7, 42521. [Google Scholar] [CrossRef] [PubMed] [Green Version]
  5. Chen, Y.-H.; Wang, C.-W.; Zhang, X.; Sastry, A.M. Porous cathode optimization for lithium cells: Ionic and electronic conductivity, capacity, and selection of materials. J. Power Sources 2010, 195, 2851–2862. [Google Scholar] [CrossRef]
  6. Volfkovich, Y.M.; Filippov, A.N.; Bagotsky, V.S. Structural Properties of Porous Materials and Powders Used in Different Fields of Science and Technology; Springer: London, UK, 2014. [Google Scholar]
  7. Deng, Y.; Yang, C.; Zou, K.; Zhao, X.; Chen, G. Recent advances of Mn-rich LiFe1−yMnyPO4 (0.5 <y <1.0) cathode materials for high energy density lithium ion batteries. Adv. Energy Mater. 2017, 7, 1601958. [Google Scholar] [CrossRef]
  8. Chizmadzhev, Y.; Markin, V.; Tarasevich, M.; Chirkov, Y. Macrokinetics of Processes in Porous Media; Nauka: Moscow, Russia, 1971. [Google Scholar]
  9. Newman, J.; Tiedemann, W. Porous electrode theory with battery applications. AIChE J. 1975, 21, 25–41. [Google Scholar] [CrossRef] [Green Version]
  10. Atlung, S.; West, K.; Jacobsen, T. Dynamic aspects of solid solution cathodes for electrochemical power sources. J. Electrochem. Soc. 1979, 126, 1311–1321. [Google Scholar] [CrossRef] [Green Version]
  11. Polymer, L.; Cell, I.; Doyle, M.; Fuller, T.F.; Newman, J.; Soc, J.E. Modeling of galvanostatic charge and discharge of the lithium/polymer/insertion cell. J. Electrochem. Soc. 1993, 140, 1526–1533. [Google Scholar] [CrossRef]
  12. Chadha, T.S.; Suthar, B.; Rife, D.; Subramanian, V.R.; Biswas, P. Model based analysis of one-dimensional oriented lithium-ion battery electrodes. J. Electrochem. Soc. 2017, 164, E3114–E3121. [Google Scholar] [CrossRef] [Green Version]
  13. Fuller, T.F.; Doyle, M.; Newman, J. Simulation and optimization of the dual lithium ion insertion cell. J. Electrochem. Soc. 1994, 141, 1–10. [Google Scholar] [CrossRef] [Green Version]
  14. Xue, N.; Du, W.; Gupta, A.; Shyy, W.; Sastry, A.M.; Martins, J.R.R.A. Optimization of a single lithium-ion battery cell with a gradient-based algorithm. J. Electrochem. Soc. 2013, 160, A1071–A1078. [Google Scholar] [CrossRef] [Green Version]
  15. Bernardi, D.M.; Go, J.-Y. Analysis of pulse and relaxation behavior in lithium-ion batteries. J. Power Sources 2011, 196, 412–427. [Google Scholar] [CrossRef]
  16. Kumaresan, K.; Mikhaylik, Y.; White, R.E. A mathematical model for a lithium–sulfur cell. J. Electrochem. Soc. 2008, 155, A576–A582. [Google Scholar] [CrossRef]
  17. Bograchev, D.A.; Volfkovich, Y.M.; Dubasova, V.S.; Nikolenko, A.F.; Ponomareva, T.A.; Sosenkin, V.E. Development and experimental verification of a mathematical model of lithium ion battery. Russ. J. Electrochem. 2013, 49, 115–123. [Google Scholar] [CrossRef]
  18. Verbrugge, M.W.; Koch, B.J. Modeling lithium intercalation of single-fiber carbon microelectrodes. J. Electrochem. Soc. 1996, 143, 600–608. [Google Scholar] [CrossRef]
  19. Verbrugge, M.W.; Koch, B.J. Electrochemistry of intercalation materials. Charge-transfer reaction and intercalate diffusion in porous electrodes. J. Electrochem. Soc. 1999, 146, 833–839. [Google Scholar] [CrossRef]
  20. Volfkovich, Y.M.; Bagotzky, V.S. The method of standard porosimetry. 2. Investigation of the formation of porous structures. J. Power Sources 1994, 48, 339–348. [Google Scholar] [CrossRef]
  21. Volfkovich, Y.M.; Sakars, A.V.; Volinsky, A.A. Application of the standard porosimetry method for nanomaterials. Int. J. Nanotechnol. 2005, 2, 292–302. [Google Scholar] [CrossRef]
  22. Valøen, L.O.; Reimers, J.N. Transport properties of LiPF6-based Li-Ion battery electrolytes. J. Electrochem. Soc. 2005, 152, 882–891. [Google Scholar] [CrossRef]
  23. Kosova, N.V.; Devyatkina, E.T.; Slobodyuk, A.B.; Petrov, S.A. Submicron LiFe1-yMnyPO4 solid solutions prepared by mechanochemically assisted carbothermal reduction: The structure and properties. Electrochim. Acta 2012, 59, 404–411. [Google Scholar] [CrossRef]
  24. Kosova, N.V.; Kulova, T.L.; Nikolskaya, N.F.; Podgornova, O.A.; Rychagov, A.Y.; Sosenkin, V.E.; Volfkovich, Y.M. Effect of porous structure of LiCoPO4 on its performance in hybrid supercapacitor. J. Solid State Electrochem. 2019, 23, 1981–1990. [Google Scholar] [CrossRef]
  25. Krachkovskiy, S.A.; Bazak, J.D.; Fraser, S.; Halalay, I.C.; Goward, G.R. Determination of mass transfer parameters and ionic association of LiPF6: Organic carbonates solutions. J. Electrochem. Soc. 2017, 164, A912–A916. [Google Scholar] [CrossRef]
  26. Fang, W.; Kwon, O.J.; Wang, C. Electrochemical–thermal modeling of automotive Li-ion batteries and experimental validation using a three-electrode cell. Int. J. Energy Res. 2010, 34, 107–115. [Google Scholar] [CrossRef]
  27. Cai, L.; White, R.E. Mathematical modeling of a lithium ion battery with thermal effects in COMSOL Inc. Multiphysics (MP) software. J. Power Sources 2011, 196, 5985–5989. [Google Scholar] [CrossRef]
  28. Prada, E.; Di Domenico, D.; Creff, Y.; Bernard, J.; Sauvant-Moynot, V.; Huet, F. Simplified electrochemical and thermal model of LiFePO4-graphite Li-ion batteries for fast charge applications. J. Electrochem. Soc. 2012, 159, A1508–A1519. [Google Scholar] [CrossRef] [Green Version]
  29. Troxler, Y.; Wu, B.; Marinescu, M.; Yufit, V.; Patel, Y.; Marquis, A.J.; Brandon, N.P.; Offer, G.J. The effect of thermal gradients on the performance of lithium-ion batteries. J. Power Sources 2014, 247, 1018–1025. [Google Scholar] [CrossRef]
  30. West, W.C.; Soler, J.; Smart, M.C.; Ratnakumar, B.V.; Firdosy, S.; Ravi, V. Electrochemical behavior of layered solid solution Li2MnO3−LiMO2 (M = Ni, Mn, Co) Li-ion cathodes with and without alumina coatings. J. Electrochem. Soc. 2011, 158, A883–A889. [Google Scholar] [CrossRef]
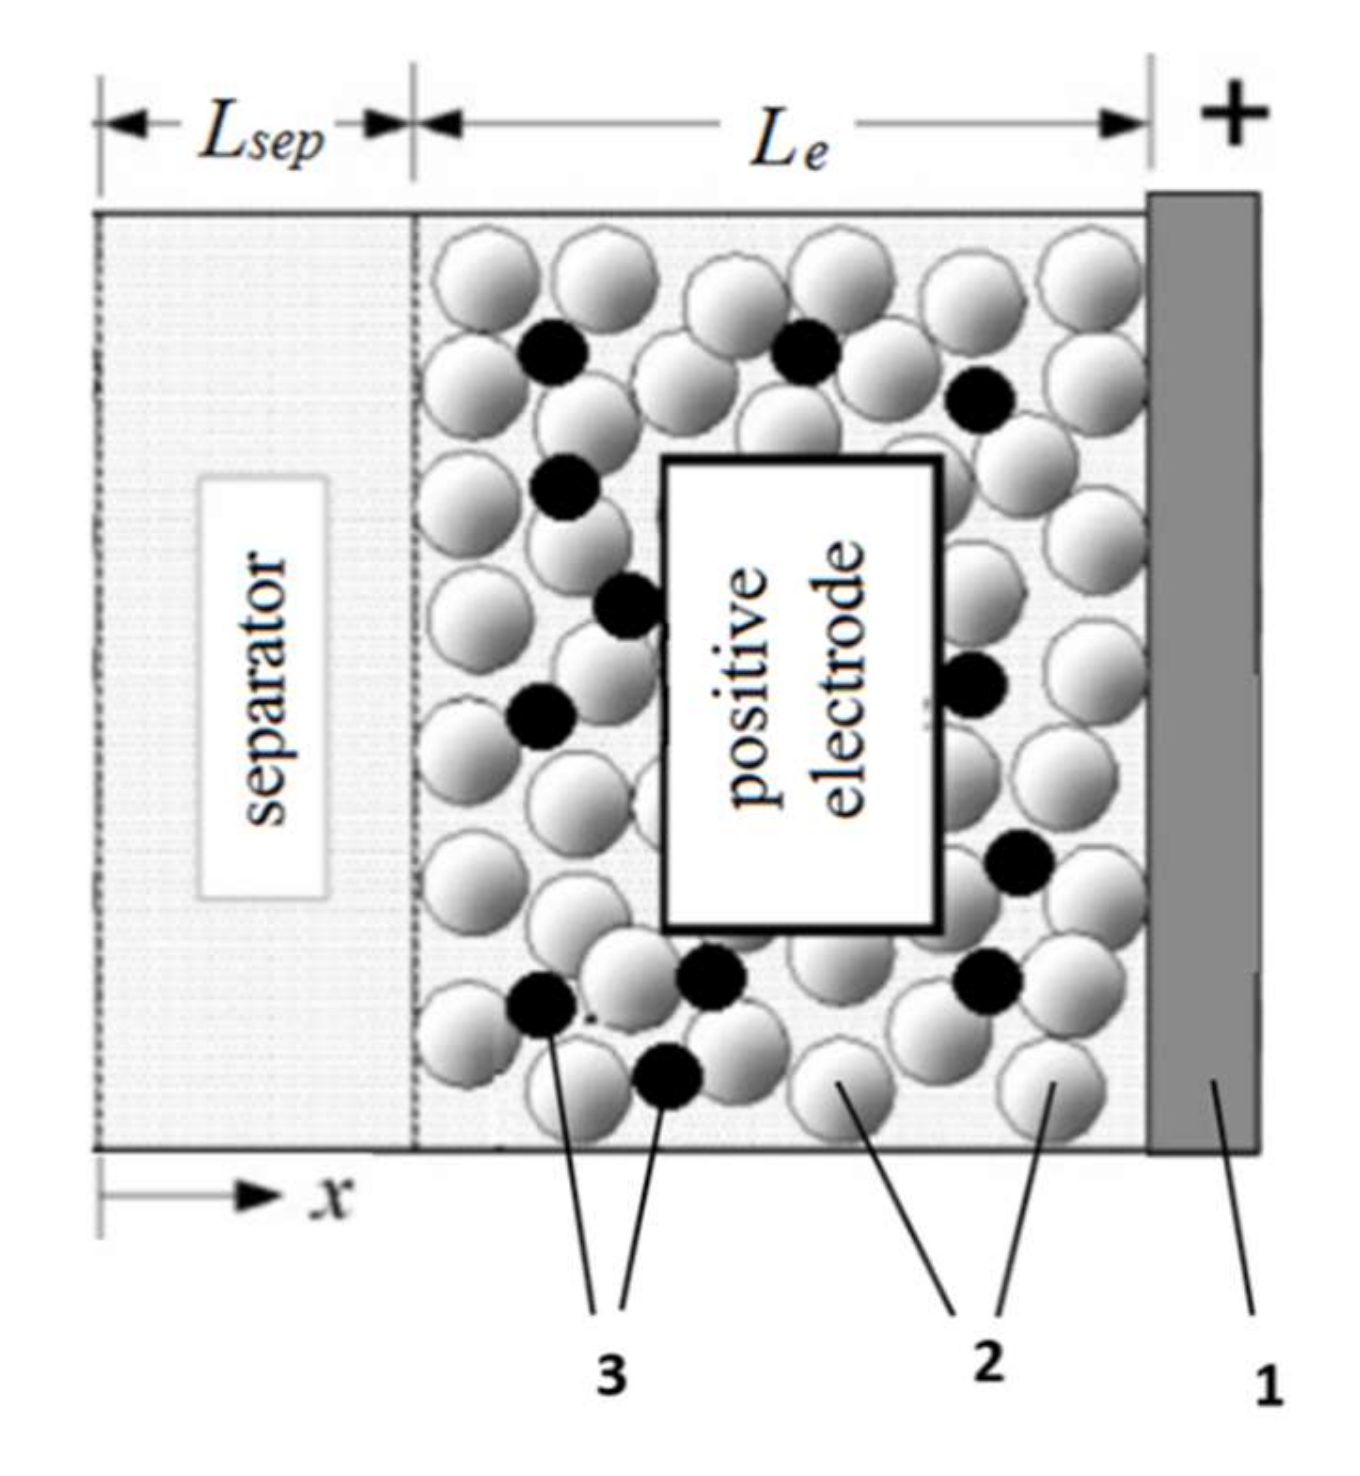
Figure 1. The model scheme, 1—a current collector, 2—particles of the active cathode material, 3—particles of added carbon black.
Energies 13 00542 g001
Figure 2. Rietveld refined X-ray powder diffraction (XRD) patterns of carbon-free LiFe0.5Mn0.5PO4 (LFMP) (a) and carbon-coated LiFe0.5Mn0.5PO4/C (LFMP/C) (b).
Energies 13 00542 g002
Figure 3. Scanning electron microscopy (SEM) (a,b) and transmission electron microscopy (TEM) (c) images of LFMP (a) and LFMP/C (b,c).
Energies 13 00542 g003
Figure 4. Integral (a) and differential (b) pore volume distribution and surface distribution (c,d) vs. pore radius for LFMP and LFMP/C.
Energies 13 00542 g004
Figure 5. Discharge profiles of LFMP (a) and LFMP/C (b) vs. cycling rate in the 2.0–4.5 V range; charge/discharge capacity vs. cycle number (c) and cycling rate (d).
Energies 13 00542 g005
Figure 6. GITT and OCV curves (a,b) and diffusion coefficient DLi+ as a function of xLi (c,d) for LFMP (a,c) and LFMP/C (b,d).
Energies 13 00542 g006aEnergies 13 00542 g006b
Figure 7. Comparison of calculated and experimental curves of LFMP/C with a constant coefficient of solid-state diffusion (a) and taking into account the temperature dependence of the diffusion coefficient (b); calculated discharge curves at 0.5C current for different values of the specific surface area and associated values of particle radii, where S0 is the value of 32 m2·cm−3 measured for the active cathode material (c).
Energies 13 00542 g007
Figure 8. The profiles of the dimensionless concentration of lithium over the cathode thickness (Le) and the particle radius (r0) for different discharge rates: 0.1C (a), 0.2C (b), 0.5C (c), 1C (d), 2C (e), 5C (f).
Energies 13 00542 g008aEnergies 13 00542 g008b
Table 1. Porosimetric data of the LFMP samples.
ParameterLFMPLFMP/C
Average logarithmic pore radius, nm2.42.3
Porosity per weight, cm3·g−10.350.36
Porosity per volume, cm3·cm−30.540.54
Meso- and macro-pore surface per weight (Sme), m2·g−112.9721.60
Meso- and macro-pore surface per volume, m2·cm−320.0331.97
Total pore surface per weight (St), m2·g−117.9731.29
Calculated total specific surface area (St,cal.), m2·g−1 42.42
Table 2. Transport parameters of the model.
ParameterValue Source
Archie’s exponent coefficient of cathode1.5fitting
Archie’s exponent coefficient of separator1.5fitting
Conductivity of cathode, S·m−10.001fitting
Cationic transport number0.32[25]
Electrolyte diffusion coefficient, m2·s−13.5 × 10⁻¹⁰[25]
Reaction rate coefficient6 × 10−8fitting
Transfer coefficient0.5assumed
Initial solid-state concentration, mol·m−3 2.14 × 10⁴fitting
Solid-state diffusion coefficient, m2·s−11.8 × 10⁻¹⁹ (see Table 3)fitting
Table 3. Solid-state diffusion coefficient at different cycling rates.
Cycling Rate0.1C0.2C0.5C1C2C5C
Diffusion coefficient, m2·s−11.8 × 10−191.8 × 10−191.8 × 10−192.5 × 10−193.8 × 10−196.2 × 10⁻¹⁹
Acceleration factor of the diffusion1.01.01.01.42.13.4
Return temperature 1000/T3.383.383.383.323.293.24
Temperature estimated from the slope of the curve (acceleration factor of the diffusion), °C [11]232323283136