Abstract
This paper presents results based on direct experimental measurements of tangential (Et) and normal (En) E-field components along the stress grading system (SGS) of a real stator bar (Roebel type) for different AC 60 Hz applied voltages. These measurements were made with a new electro-optic system allowing for the study of both spatial distributions of two E-field components along the bar and their temporal evolution at critical points. The results obtained allowed us to calculate the correlation between the distribution of En and Et along the SGS. In particular, it was demonstrated that the En distribution presents a characteristic minimum, which can be used to identify the zone of partial discharge inception. Moreover, it was possible to observe an enlargement of the Et component distribution followed by a saturation in magnitude with the applied voltage increase. Moreover, the results have demonstrated that the waveform of the En component is mostly affected by the SG material used, producing a greater distortion in its waveform than those obtained for the Et component. The more significant distortion was obtained at the end of the outer corona protection (OCP) material, corresponding to the first maximum of the En component and characterized by the appearance of a third harmonic of large amplitude.
1. Introduction
Stress grading coatings (SGCs), also called end corona protection (ECP), are critical components of stator bars used in large high-voltage (HV) hydro-generators operating at 6 kV or above [1,2,3,4,5,6]. Typically, SGCs are applied on the outer corona protection (OCP) coating to the end-arms of the stator bars near the end of the slot portion of the generator core. As the OCP coating ends a few centimeters outside the slot, the SGC is used to reduce the electric field below the dielectric breakdown value of air in order to avoid partial discharges (PDs) or the corona effect [1,2,6]. To achieve that, SGCs show a non-linear characteristic as a function of the electric field (E-field). Figure 1 presents an illustration of a typical stress grading system used on large HV hydro-generators. As it can be shown, the insulation system is composed of the main insulation used to electrically insulate the copper conductor carrying the current by applying HV on this last one. The OCP material is applied on the main insulation along the section of the stator bar positioned inside the slot of the stator core. The OCP made of linear semi-conductive material is used in the slot to bring the main insulation surface to the same potential as the stator core surface which is generally grounded [1]. Finally, the SGC made of non-linear semi-conductive material overlaps the OCP at the end of the stator slop and a section of the main insulation outside the stator core [1].
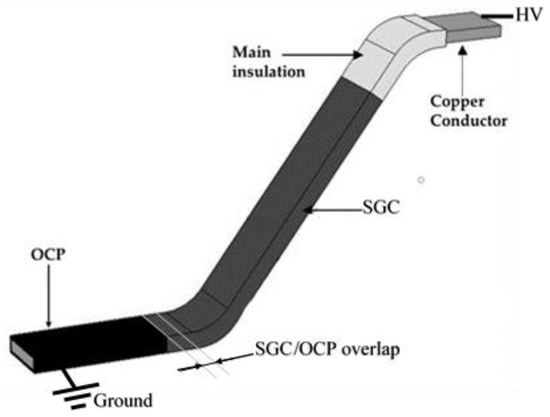
Figure 1.
Illustration of the insulation system of a typical stator bar used in large high-voltage (HV) hydro-generators.
From on-site and laboratory investigation, several operational problems on HV generators have been reported [4,5,6]. Some of these problems were attributed to corona effect degradation at the end of the generator stator slot at the junction of the SGC and OCP coatings, which both constitute the stress grading system of the stator bar. These PD-induced degradations can be attributed to inadequate design of the stress grading system and poor initial performance of the coatings [4,5].
In this context, adequate choice of the SGC coatings become a determinant factor to ensure the reliability and longevity of the stress grading system. However, to assess the efficiency of the application of these coatings, verification measurement of new stator bars have to be done prior their installation. This requires designing measurement methods to evaluate precisely the E-field grading functionality of the SGCs. For that purpose, the proposed methods must be able to measure the E-field distribution at the surface of the SGC installed on real stator bar in order to determine the E-field strength profile induced by the non-linear electrical conductivity of the coating. The determination of the E-field distribution remains important in the design and optimization of the stress grading system as it permits to identify precisely the position and maximum strength of the E-field responsible of PD appearance.
Several laboratory experimental methods have been developed to assess the efficiency of SGCs on new real stator bars. One of these methods is using an ultraviolet (UV) camera to detect corona effect occurrence as a function of the applied voltage [4,5,6]. This simple method permits to determine the corona inception voltage (CIV) and the position of the PDs along the bar. This method is well adapted for on-site inspection or as a complementary method for laboratory investigation involving potential and E-field surface measurements. For several years, potential surface measurement has been the most used method to assess the efficiency of SGCs [7,8,9]. The knowledge of the surface potential distribution permits to determine, by inverse calculation, the distribution of the tangential component of the E-field. These potential measurements were first performed using electrostatic voltmeter or HV contact probe [7,8]. These techniques remain restrictive on several aspects since they are source of certain inaccuracies due the interference of the probes (metallic parts and electrical impedance) with the tested object, thus giving erroneous and misleading results [7].
In order to provide less intrusive and more accurate potential measurements, the use of electro-optic (EO) sensors based on the Pockels effect was recently proposed and investigated [9]. The main advantages of the proposed EO sensor lies in the absence of metallic components, high input impedance, and large frequency bandwidth, which permits to accurately measure the surface potential with minimum distortion [9]. However, this EO method only allows to determine the tangential E-field component (Et) by inverse calculation. This can be a source of error in the case of fast spatial variation of the surface potential. However, another prototype of EO sensor has been proposed which permits to measure only the tangential component of the E-field at the surface of the SGCs, in a direct manner [10]. Finally, the recent development of a new noninvasive E-field sensor based on microelectro-mechanical system (MEMS) with remarkable spatial resolution could be an accurate solution for E-field component scanning at the surface of a stress grading systems [11,12].
As it can be observed, the majority of experimental investigations on SGCs have been only focused on the tangential E-field component. This can be attributed to the lack of methods permitting to measure both the Et and En and then obtain the E-field resultant. Such information can be of great interest to characterize the efficiency of the SGCs and reduce the E-field strength below the dielectric rigidity of the surrounding medium. In addition, this information is helpful to validate the different numerical simulations dedicated to SGC modelling where generally only Et is verified due to the restrictions of the experimental measurement methods [1,9,10].
This paper presents a new direct method to measure Et and En along the SGCs present on a real stator bar of a HV hydro-generator. The proposed method is based on the use of a compact size EO E-field system [13,14], which provides unidirectional E-field measurement. The small size (millimeter sized transversally) of the EO probe allows En and Et measurements close to the surface of the stator bar. Thanks to the metrological capabilities of this EO E-field system, the distribution of Et and En have been determined as a function of applied voltage. The results obtained permitted to highlight the correlation between the two E-field components as function of the position along the stress grading system and particularly in the region of OCP and SGC overlapping. Moreover, the EO E-field system has permitted to study the influence of the OCP and SGC coatings on the temporal waveform shape of the E-field components by performing a harmonic analysis as a function of the position along the bar.
2. Materials and Methods
2.1. Model of the Stator Bar
All the measurements done in this paper were performed on a Roebel type stator bar of which a geometry example is given in Figure 2. For this research, a 13.8 kV (phase-to-phase) stator bar with a cross-section of 13 × 53 mm was used. Its stress grading system is made of a carbon black OCP and a SGC made with silicone carbide tape with a thickness of 0.6 mm and 0.7 mm respectively. Its main insulation is made of epoxy-mica with a thickness of 3 mm. The bar was cured in a hot press to give it its final dimension.
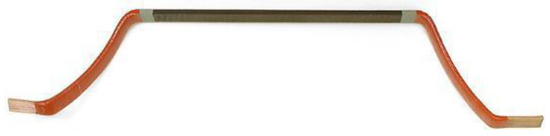
Figure 2.
Illustration of the stator bar (Roebel type) used in large hydro-generators.
The OCP relative permittivity and electrical conductivity are 100 and 1 S/m, respectively. For the OCP, its relative permittivity is 15 and its electrical conductivity σECP (S/m), measured directly on the stator bar based on ASTM standards [15,16], can be expressed as a function of the E-field E (V/m) as follow:
2.2. Electro-Optic E-Field System
The EO E-field system, presented in Figure 3, was initially developed by the IMEP-LHAC laboratory and commercialized by Kapteos [13,14]. The EO system operates on the Pockels effect and consists of two main parts: an EO probe (Figure 3a) and an optoelectronic convertor (Figure 3b). The last component, which mainly manages the operation of the probe and accessories, sends a polarized light wave through an EO crystal located at the end of the EO probe via optic fiber. Under applied E-field, the dephasing induced by the EO crystal is modified in proportion to the field strength. The dephasing of the optical signal transmitted by the EO probe is then converted into an electrical signal that can be analyzed with an instrument like an oscilloscope, a spectrum analyzer or any other signal processing instrument. The output voltage (in V) of the optoelectronic convertor provides the full instantaneous temporal information of the measured E-field component (in V/m). For that, the output voltage is multiplied by the antenna factor (in m−1) provided in real-time by the optoelectronic convertor. The manufacturer calibrates each EO probe in order to obtain the most accurate antenna factor.
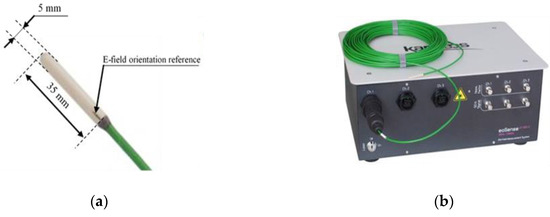
Figure 3.
Illustration of the electro-optic (EO) E-field system: (a) the EO probe and (b) optoelectronic convertor.
The main advantages of this new measurement system are the compact size of the EO transducer (5 mm in length) positioned at the end of the EO probe (5 mm × 35 mm), leading to a spatial resolution of 1 mm. Moreover, owing to its fully dielectric composition based on ultra-low loss tangent materials, the EO probe presents a minimal interference with the E field to be measured. The EO probe has a selectivity of 50 dB, which means that the probe can measure a given E-field component while rejecting the orthogonal ones with a rejection ratio of more than 99.7%. The selection of the E-field component to be measured is obtained by the E-field orientation reference (black mark on Figure 3a), which corresponds to the sensitive direction of the probe. This reference must be oriented perpendicularly to the E-field component to be measured, which permits us to properly select between the tangential and normal E-field components at the surface of the stress grading system.
2.3. Experimental Setup
Figure 4 presents the experimental set up build and installed at IREQ (Institut de Recherche d’Hydro-Québec) laboratory. In order to perform a fast and repetitive mapping of the E-field components on the surface of stress grading system of the stator bar, a specific automated support for the EO probe was built up. The probe is mounted on an insulating rod that moves over the surface of the test sample through an automated tri-axial robotic arm. This setup permits to precisely position the probe on the stator bar surface along the referenced measuring points, as shown in Figure 4. Moreover, the tri-axial robotic arm has another degree of freedom which allows the EO probe to be rotated on its symmetry axis, making possible to correctly position the E-field orientation of the EO probe (Figure 3a) for accurate selection of the E-field components to be measured. Because of this, it is also possible to determine the correct orientation of the EO probe in the curved section of the stator bar. Indeed, as illustrated by Figure 5, the measurement of En and Et were performed at the middle of the stator bar (central line in Figure 5) extended from the OCP to the bar bend. All the measuring points on each line are distant of 1 cm. For all measurements, the bottom of the EO probe was positioned at 2 mm from the surface of the stress grading system.
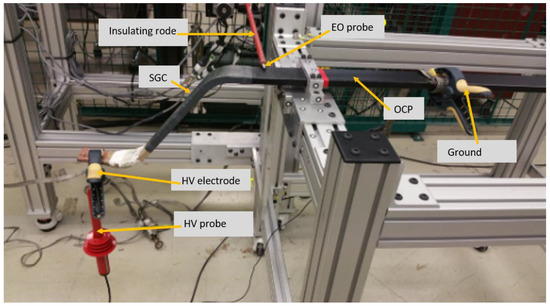
Figure 4.
Experimental setup built and installed at the IREQ (Institut de Recherche d’Hydro-Québec) laboratory for the E-field mapping.
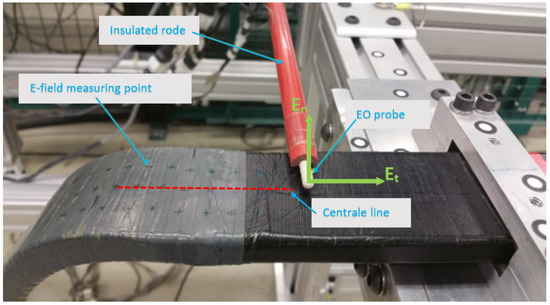
Figure 5.
Closed view of the EO probe at the surface of the stress grading system with the referenced measuring points and E-field component orientation.
3. Experimental Results
3.1. EO E-Field System Calibration
In order to determine the relationship between the output voltage provided by the EO system and the measured E-field by the EO probe, an experimental calibration was performed. For this purpose, two plane-to-plane circular electrode configuration of 32 cm and 12 cm diameter, respectively, and separated by a distance of 100 mm, was used. The EO probe was positioned at the middle of the inter-electrode distance. The 60 Hz voltage applied to the electrodes, measured through a HV probe, was raised from 2 kV to 18 kV by incremental steps of 2 kV. The results obtained are shown in Figure 6. Data fitting exhibits a very good linearity between the applied E-field (kV/m) and the EO system output voltage (mV) with a responsivity of 0.2583 (mV/(kV m−1)).
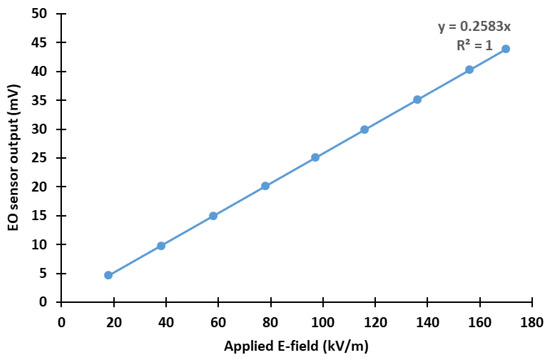
Figure 6.
Results of the calibration of the EO E-field system obtained at 60 Hz using a two plane-to-plane circular electrode configuration.
3.2. Distributrions of the Tangential E-Field Component
Figure 7 presents the Et distributions obtained for an applied voltage of 8 kVrms ((13.8/√3) kVrms) and 16 kVrms, respectively, along the central line illustrated in Figure 5. Figure 8 presents the corresponding normalized Et distributions obtained by dividing, for each applied voltage, the E-field strength at each measuring point by the strength obtained at the maximum of the distribution.
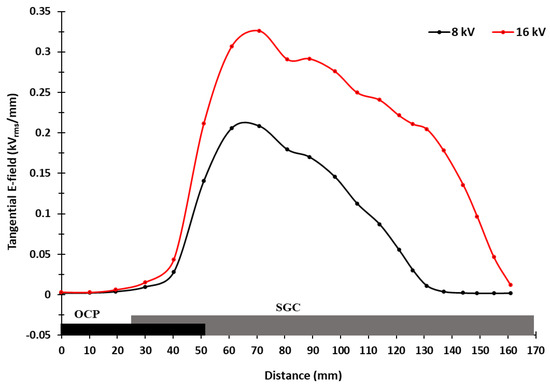
Figure 7.
Distributions of the Et obtained at the surface of the stress grading system for an applied voltage of 8 kVrms and 16 kVrms.
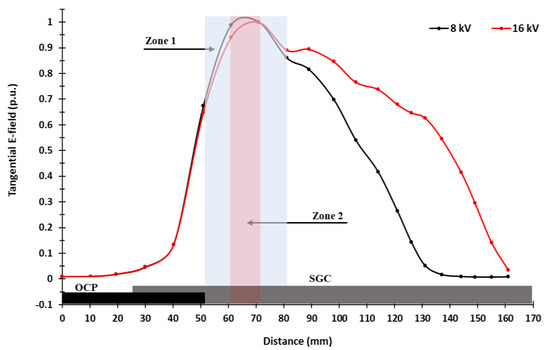
Figure 8.
Comparison of the normalized Et distributions (in p.u.) obtained at the surface of the stress grading system for an applied voltage of 8 kVrms and 16 kVrms.
The results of the Et distributions with strength expressed in p.u. and presented in Figure 8 are very interesting on several aspects. First, the results clearly demonstrate that the maximum strength of Et is not reached at the end of the OCP coating. The maximum strength is obtained in a 1 cm zone width (zone 2 on Figure 8 and Figure 9) located at about 1.5 cm from the OCP end. It can be noticed that this zone of maximum strength is independent of the applied voltage. However, the maximum strength of Et shows an increase of about 57% when the applied voltage goes from 8 kVrms to 16 kVrms. Moreover, from the results of Figure 8, it can be observed that the increase in applied voltage leads to an expansion of the Et distribution. As illustrated in Figure 8 and Figure 9, the distribution at 16 kVrms starts to expand at the end of Zone 1, which corresponds to the beginning of the stator bar bend. In order to quantify this enlargement, it was decided to compute the width of the distributions at 50% of the maximum value. For 8 kVrms, a width of 60.0 mm was obtained against 92.0 mm for 16 kVrms, which represents an increase of 53%.
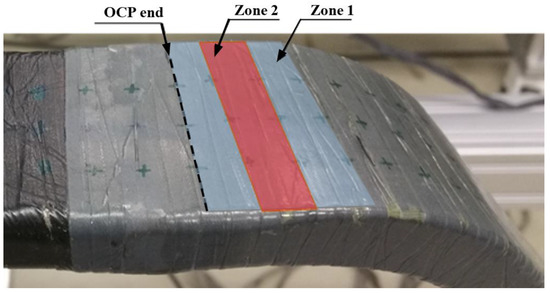
Figure 9.
Close view of the stress grading system with the identification of the outer corona protection (OCP) end and the possible corona appearance zone.
3.3. Distributrions of the Normal E-Field Component
As mentioned previously, the EO measurement system used in this paper provides the possibility to measure directly the normal E-field component distribution. For that, the EO probe is rotated by 90° compared to its position used to measure the tangential component. The different En distributions were measured along the same references lines used for the tangential component (see Figure 4) for the same applied voltages.
Figure 10 and Figure 11 show the results of the absolute value of En distributions obtained at 8 kVrms and 16 kVrms and expressed in kVrms/mm and in p.u., respectively. In Figure 10, it is possible to visualize for the first time the experimental distribution of En at the surface of a stress grading system. As it can be observed, this distribution’s behavior is significantly different from those obtained for Et. As observed with Et in Figure 7, the magnitude of the normal component increases with the applied voltage, increasing to a first maximum at the end of the OCP, as shown in Figure 10. At this particular point, En increases by around 46% as the applied voltage goes from 8 kVrms to 16 kVrms. Notice that this increase is of the same magnitude that observed for Et.
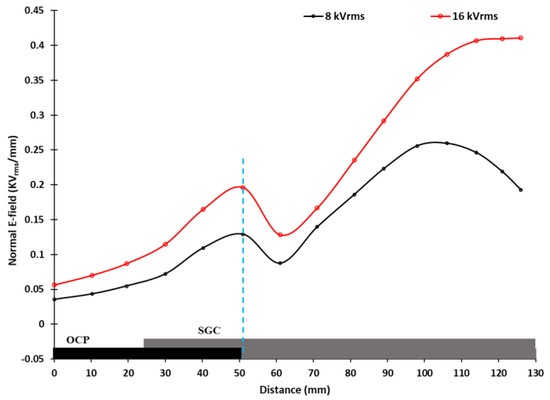
Figure 10.
Distributions of the absolute value of En obtained at the surface of the stress grading system for applied voltages of 8 kVrms and 16 kVrms.
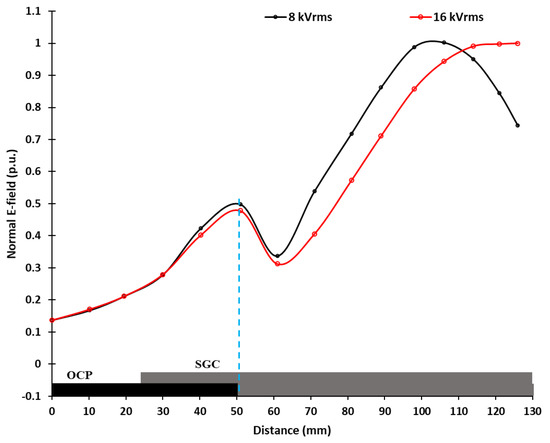
Figure 11.
Comparison of the normalized absolute value of En (in p.u.) obtained at the central line on the surface of the stress grading system for applied voltages of 8 kVrms and 16 kVrms.
The influence of applied voltage on En can also be observed in Figure 11 where the En strength is expressed in p.u. As it can be seen, the distribution of the normalized En remains the same until it reaches 61 mm. At this point, the normalized En at 16 kVrms becomes lower by an average of 16% than those obtained at 8 kVrms until position 110 mm where its strength begins to be higher. This behavior can be compared to the average 40% increase of the normalized Et obtained from 81 mm, as observed in Figure 8.
From the results presented in Figure 12, the particular correlation between the two E-field components at the surface of the stress grading system can be studied in more details. For that, the magnitude of the two components was normalized (in p.u.) using the maximum strength obtained for the corresponding normal component and this, for each applied voltage value. Along the OCP, En is higher than Et, as expected at the surface of a conductive layer. It can be observed that the definition of Zone 1 width, identified in Figure 7 and Figure 8, can be obtained in Figure 11 at 8 kVrms as it is clearly delimited by the two points where the normal component magnitude equals the tangential one. This zone, with a width of around 30 mm, is principally characterized by a tangential component magnitude greater than the normal one. In the same way, it can be observed that inside Zone 2, previously identified in Figure 7 and Figure 8, En reaches a minimum in magnitude whereas for the same point, Et is at a maximum. Finally, for distances greater than 81 mm, which corresponds to the beginning of the stator bar bend, Et decreases rapidly and En increases until reaching its maximum strength.
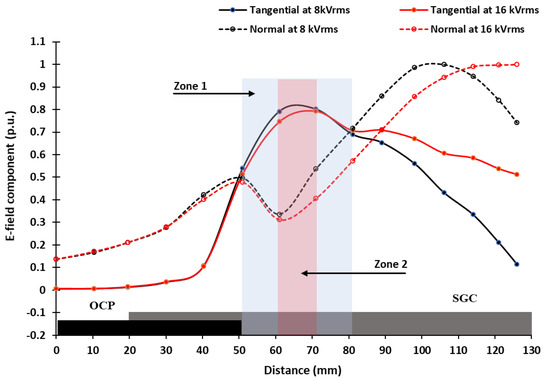
Figure 12.
Comparison of the normalized En (absolute value) and normalized Et (in p.u.) obtained at the central line on the surface of the stress grading system for applied voltages of 8 kVrms and 16 kVrms.
3.4. Distribution of the Tangential and Normal E-Field Components at 35 kVrms
Figure 13 shows the distributions of En and Et obtained for an applied voltage of 35 kVrms compared to those at 16 kVrms. It is interesting to note that Et is not significantly affected by the applied voltage increase from 16 to 35 kVrms in comparison to En until the Zone 2 (see Figure 12). When the Zone 2 is reached, Et is more affected by the applied voltage increase than En. These results can be compared to those of Figure 7 and Figure 10 where an increase of about 50% was observed for the E-field component magnitude when the voltage was increased from 8 to 16 kVrms.
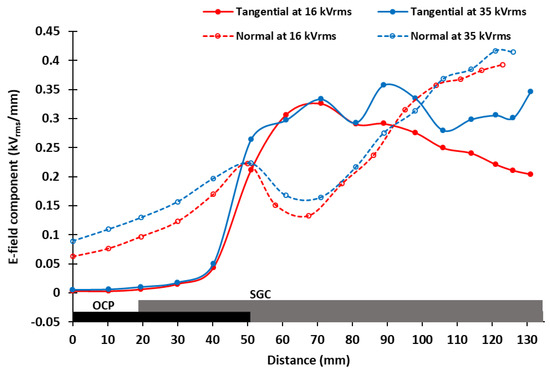
Figure 13.
Comparison of En and Et obtained at the central line on the surface of the stress grading system for an applied voltage of 35 kVrms.
3.5. Waveforms of the Tangential and Normal E-Field Components
The EO system used in this paper can also record the snapshot of two E-field components at each measuring point and for each applied voltage. For that purpose, the waveform of each component was recorded at some specific points on the OCP SGC overlapping (41 mm), at the OCP end (51 mm), at the position of minimum strength of the normal component (61 mm in Zone 1), and at the end of Zone 2 (81 mm). The waveforms were recorded for applied voltages of 8 and 16 kVrms.
Figure 14 and Figure 15 show the snapshots obtained for Et and its corresponding Fast Fourier Transform (FFT). From these figures, it can be seen that the tangential instantaneous E-field along the bar presents (Figure 14b–d) a slight distortion characterized by the appearance of the third harmonic (Figure 15b–d) with a magnitude between 10% to 15% of the fundamental harmonic. The distortion in the harmonic content comes principally from the physical response of the silicon carbide material and not form the HV test set itself. Indeed, if this would be the case, the distortion would be observed in every location, at the different voltage and for the two components of the E-field. Deeper investigation are in progress to complete the understanding of the material response of the grading coating. The large distortion obtained at 41 mm (Figure 14a) is principally due to the low magnitude of Et at the surface of the OCP. As no averaging was used in the waveform recording, the signal-to-noise ratio becomes significant which causes several harmonics to appear (Figure 15a). As the EO E-field system presents a sensitivity of 500 mV/m as specified by the manufacturer, the oscillations in the snapshot of Figure 14a can be attributed to the noise of the HV source and experimental setup.
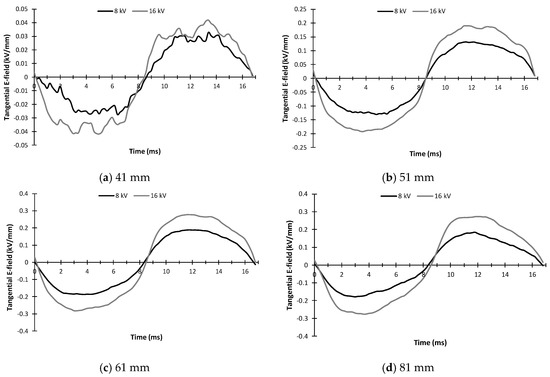
Figure 14.
Comparison of the tangential E-field snapshot for applied voltages of 8 kVrms and 16 kVrms obtained at different measuring points along the stress grading system for (a) 41 mm, (b) 51 mm, (c) 61 mm, and (d) 81mm.
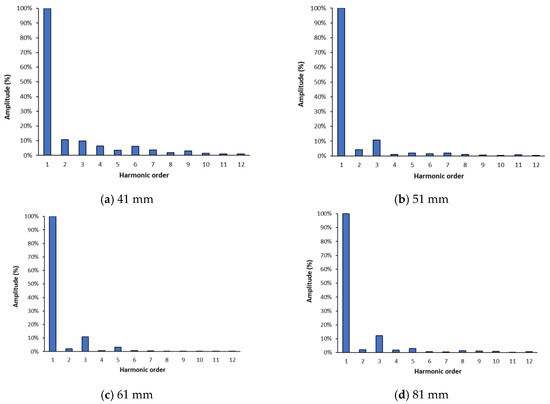
Figure 15.
Harmonic analysis of the tangential E-field waveforms for an applied voltage of 8 kVrms obtained along the stress grading system at (a) 41 mm, (b) 51 mm, (c) 61 mm, and (d) 81 mm.
However, the situation is quite different for En, as illustrated in Figure 16 and Figure 17. Along the OCP, the instantaneous normal E-field remains rather sinusoidal for measurement points below 51 mm (Figure 16a,b) as the harmonics are lower than 5% (Figure 17a,b). This indicates that En is governed principally by the conductivity of the OCP. From the OCP/SG junction at 51 mm, however, there is a large deformation in the instantaneous En form, as shown in Figure 16c,d. Indeed, the waveform of En changes from a quasi-sinusoidal shape (51 mm) to triangular (81 mm) one. The distortion of the waveform of En seems more significant at the measurement point located at 61 mm (Figure 16c), as it corresponds to the minimum of En and the maximum of Et, as shown in Figure 12. As expected, at 61 mm, the normal component presents a third harmonic amplitude of around 31% of its fundamental (Figure 17c), which decreases to 15.5% at 81 mm (Figure 17d).
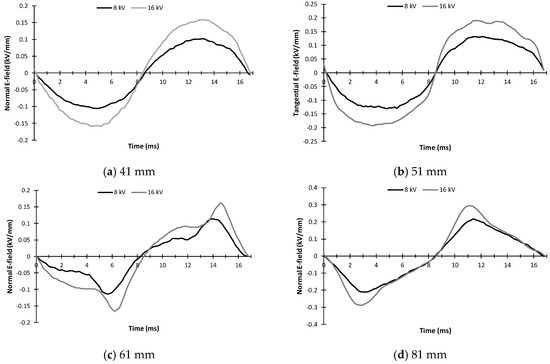
Figure 16.
Comparison of the normal E-field snapshot for an applied voltage of 8 kVrms obtained along the stress grading system at (a) 41 mm, (b) 51 mm, (c) 61 mm, and (d) 81 mm.
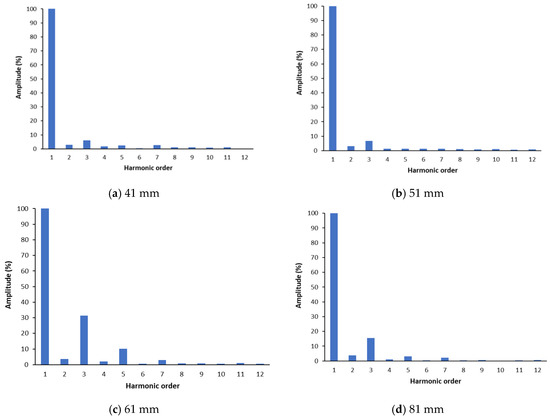
Figure 17.
Harmonic analysis of the normal E-field waveforms for an applied voltage of 8 kVrms obtained along the stress grading system at (a) 41 mm, (b) 51 mm, (c) 61 mm, and (d) 81 mm.
4. Discussion
4.1. Tangential E-Field Component
In order to validate the experimental results presented in this paper, our findings were compared to those obtained by Staubach et al. [1] who used an EO technology and a real stator bar geometry similar to the present study. However, the EO system used by Staubach et al. only permitted us to measure the tangential component at the surface of the grading system, measurements which were performed at 2 mm on the surface of the stress grading system with an applied voltage of 11.55 kV, 20 kV, and 30 kV [1]. The tangential component distributions obtained by the authors presented a maximum between 0.3 kV/mm and 0.45 kV/mm for an applied voltage of 11.55 kV and 30 kV, respectively [1]. For each applied voltage, the maximum was situated at around 25 mm from the end of the OCP. These results can be compared to the results in Figure 7 with a maximum between 0.2 and 0.32 kVrms/mm for 8 kVrms and 16 kVrms, respectively situated at around 15 mm from the end of the OCP. Moreover, Staubach et al. also found that the tangential component distribution expanded with the increase of the applied voltage. This enlargement, determined by calculating the width of the distributions at 50% of the maximum value, can be estimated to 37 mm at 11.55 kV to 65 mm at 30 kV, an increase of 80.5%. The results of the present study with those of Staubach et al. are in close agreement as for Et distributions which are similar in terms of maximum values and spatial distribution. The differences between the two studies can be attributed to the different conductivity of the material tape used for the SG and its application along the stator bar.
Interesting results were also obtained regarding the temporal evolution of the tangential component at different characteristic points along the bar. The experimental measurements obtained with the EO system permits to highlight for the first time the fact that the tangential component is slightly affected by the non-linearity of the SG conductivity which is characterized by the appearance of a third harmonic of low magnitude.
4.2. Normal E-Field Component
This paper presents, for the first time, the experimental measurement of the normal E-field component along a stress grading system of a stator bar. As mentioned previously, the distribution of the normal E-field component has been neglected in previous studies mainly due to the lack of measuring methods capable of performing such measurement.
From the results of En presented in Figure 10, Figure 11 and Figure 12, some interesting findings can be extracted from the distributions obtained. Firstly, the En distribution present a first maximum, which corresponds exactly to the end of the OCP. Such information can be used during inspection procedure to control the manufacturing process and the quality of the stator bars before their installation. In the same way, the fact that the minimum of the distribution corresponds to the maximum of Et can be used to evaluate the zone where the partial discharge has a significant probability of occurrence.
Moreover, the experimental results presented in this paper permits, for the first time, to study the temporal evolution of En at different characteristic points along the stator bar. The results clearly showed the particular behavior of En, which presents a strong distortion at the surface of the SG material and particularly at the junction OCP/SG where Et is maximum. From these results, it is possible to confirm the influence of the semi-conductivity of the SG, mainly on En as compared to Et. This result is very interesting in the sense that it can also be used to identify the position of the maximum tangential E-field magnitude, which corresponds to the beginning of the possible zone where the partial discharges can develop. Another interesting aspect is that the third harmonic amplitude of the instantaneous normal electric field can be linked to the non-linearity property of the SG material. The authors have verified this assumption by simulations and the results obtained will be presented in a future paper. In this way, the study of the third harmonic of the normal component could be a potential tool to verify the degradation of the SG electrical properties caused by local discharges, temperature, and aging. This assumption should be verified in future work.
4.3. Dependency of the Tangential and Normal E-Field Components on the Applied Voltage
Using the results from Figure 8, Figure 10, and Figure 13, it is possible to study the dependency of the two E-field components on the applied voltage at the surface of the SG material. The results are summarized in Table 1 listing the magnitude of En at 51 mm (first maximum) and at 61 mm for Et (first maximum) as a function of the applied voltage. As can be observed, from 8kVrms to 16 kVrms (increase by a factor 2), Et increases by a factor 1.57, and En by a factor of 1.46. When the voltage increases from 16 kVrms to 35 kVrms, En increases by a factor 1.16 whereas Et does not change and seems saturated.

Table 1.
Magnitude of the first maximum of the E-field component as a function of applied voltage.
This saturation in the tangential E-field component, which seems less important for En, can be mainly explained by the behavior of the SG material, as discussed in [3,4,5,6,7,8]. From these papers, it was established that the grading behaviour of the SG material, at fixed service frequency (here 60 Hz) is governed by the permittivity (εω) of the SG material at low E-field magnitude and by the conductivity (σ(E)) for high E-field magnitude. In other word, at low E-field, the SG acts as capacitive and resistive grading for higher E-field magnitude [3,4,5,6,7,8]. For higher E-field values, the resistive grading of the SG material results on a more uniform distribution of the surface potential on the SG surface, leading to a more uniform distribution of the tangential component. This can explain, in the first step, the observed expansion of the tangential component distribution along the SG (Figure 7 and Figure 13) as applied voltage is increased.
In the second step, the theory of the space charge limited field (SCLF) explains the particular behavior of the SG grading obtained for an applied voltage of 35 kVrms and the resulting saturation of the tangential component. As explained in [3], a dielectric material with non-linear E-field dependent conductivity presents a limiting E-field Elim when σ(Elim) = εω [3]. When the Elim value inside the SG material is reached, the dielectric relaxation time constant becomes comparable with the time constant of the applied voltage, leading to the formation of space charges inside the material, which becomes the limiting factor of E-field magnitude inside the SG as well as outside, as demonstrated in Figure 13.
5. Conclusions
Thanks to the use of a new EO system, it was possible to directly measure the distributions of En and Et at the surface of the stress-grading system (SGS) of a real stator bar for the first time, as used in large hydro generators. These measurements, performed for different AC applied voltages, also permitted us to study the temporal evolution of the two E-field components at different critical points along the SGS.
The obtained results highlight the correlation between En and Et and clearly identify the zone of possible partial discharge for which En present a minimum and Et a maximum. This indicates that the partial discharge appearance can be mainly attributed to Et. The use of it means that the two component distributions could be used as a quality control tool of stator bars before their installation.
Moreover, the temporal study of the E-field components shows that En is more affected by the SG material with a greater distortion in its waveform than those obtained for Et. A most significant distortion was obtained at the end of the OCP material, corresponding to the first maximum of En, and was characterized by the appearance of a third harmonic of large amplitude. This result is important as the study of the En third harmonic could easily be used to evaluate the degradation of the SG material over time. Future researches should be undertaken to verify this assumption.
Finally, the results also uncover the particular behavior of the SG material as applied voltage is increased. In this case, the SGS becomes resistively graded which leads to an enlargement of Et distribution. For higher applied voltage, the effect of the space charge limited field (SCLF) in the SG material causes a limitation of the amplitude increase of Et, limitation which is less significant for En.
Author Contributions
The results presented in this paper were obtained in the framework of a Ph.D thesis by G.K., who was supervised by C.V., and C.H., the co-supervisor. The experimental measurement performed at Institut de Recherche d’Hydro-Québec (IREQ) facilities were supervised by S.B. and C.H. All authors contributed to the writing of this paper as well as the analysis of the results. All authors have read and agreed to the published version of the manuscript.
Funding
This research received no external funding.
Acknowledgments
The authors would like to thanks IREQ for the realization of experimental measurements as well as Kapteos for their technical support concerning E-field measurements.
Conflicts of Interest
The authors declare no conflict of interest.
References
- Staubach, C.; Hildinger, T.; Staubach, A. Comprehensive Electrical and Thermal Analysis of the Stress Grading System of Large Hydro Generator. IEEE Electr. Insul. Mag. 2018, 34, 37–49. [Google Scholar] [CrossRef]
- Christen, T.; Donzel, L.; Greuter, F. Nonlinear Resistive Electric Field Grading Part 1: Theory and Simulation. IEEE Electr. Insul. Mag. 2010, 26, 47–59. [Google Scholar] [CrossRef]
- Qi, X.; Zheng, Z.; Boggs, S. Engineering with nonlinear dielectrics. IEEE Electr. Insul. Mag. 2004, 20, 27–34. [Google Scholar] [CrossRef]
- Tremblay, R.; Hudon, C. Improved Requirements for Stress-Grading Systems at Hydro-Québec. In Proceedings of the Iris Rotating Machine Conference (IRMC), San Antonio, TX, USA, 4–7 June 2007. [Google Scholar]
- Hudon, C.; Bélec, M. Partial discharge signal interpretation for generator diagnostics. IEEE Trans. Dielect. Ins. 2005, 12, 297–319. [Google Scholar] [CrossRef]
- Stone, G.C.; Boulter, E.A.; Culbert, I.; Dhirani, H. Electrical Insulation for Rotating Machines: Design, Evaluation, Aging, Testing and Repair; Wiley-IEEE Press: Hoboken, NJ, USA, 2014. [Google Scholar]
- Kempen, S.; Pohlmann, F.; Pinkert, K. Comparison of low-interaction methods of measurement for determining the distribution of surface potential on end corona protection configurations. In Proceedings of the Insucon Conference, Birmingham, UK, 25–28 May 2009. [Google Scholar]
- Shafiri, E. Analysis of Electrical and Thermal Stresses in the Stress Relief System of Inverter Fed Medium Voltage Induction Motors. Ph.D. Thesis, University of Waterloo, Waterloo, ON, Canada, 2010. [Google Scholar]
- Kumada, A.; Nakamura, T.; Hidaka, K.; Tsuboi, Y.; Yoshimitsu, T. Potential distribution on the stress grading system of high-voltage rotating machines—Part I: Measuring system. IEEE Trans. Dielectr. Electr. Insul. 2015, 22, 3163–3169. [Google Scholar] [CrossRef]
- Staubach, C.; Merte, R. Direct Electrical Field Strength Distribution Determination on Electrical Apparatus by Means of an Electro-Optical Miniature Field Sensor. In Proceedings of the 19th International Symposium on High Voltage Engineering, Pilsen, Czech Republic, 23–28 August 2015. [Google Scholar]
- Kainz, A.; Keplinger, F.; Hortschitz, W.; Kahr, M.; Steiner, H.; Stifter, M.; Hunt, J.R.; Resta-Lopez, J.; Rodin, V.; Welsch, C.P.; et al. Noninvasive 3D Field Mapping of Complex Static Electric Fields. Phys. Rev. Lett. 2019, 122, 244801. [Google Scholar] [CrossRef] [PubMed]
- Kainz, A.; Steiner, H.; Schalko, J.; Jachimowicz, A.; Kohl, F.; Stifter, M.; Beigelbeck, R.; Keplinger, F.; Hortschitz, W. Distorsion-free measurement of electric field strength with a MEMS sensor. Nat. Electron. 2018, 1, 68–73. [Google Scholar] [CrossRef] [PubMed]
- Gaborit, G.; Jarrige, P.; Lecoche, F.; Dahdah, J.; Duraz, E.; Volat, C.; Duvillaret, L. Single Shot and Vectorial Characterization of Intense Electric Field in Various Environments with Pigtailed Electrooptic Probe. IEEE Trans. Plasma Sci. 2014, 42, 1265–1273. [Google Scholar] [CrossRef]
- Volat, C.; Duvillaret, L.; Lecoche, F.; Dahdah, J.; Gaborit, G. Contactless optical sensors for in situ AC and DC electric field measurement and diagnostics. In Proceedings of the Electrical Insulation Conference (EIC), Ottawa, ON, Canada, 2–5 June 2013. [Google Scholar]
- ASTM D257-14. Standard Test Methods for DC Resistance or Conductance of Insulating Materials; ASTM International: West Conshohocken, PA, USA, 2014; p. 18. [Google Scholar]
- ASTM D4496-13. Standard Test Methods for DC Resistance or Conductance of Moderately Conductive Materials; ASTM International: West Conshohocken, PA, USA, 2013; p. 14. [Google Scholar]


© 2020 by the authors. Licensee MDPI, Basel, Switzerland. This article is an open access article distributed under the terms and conditions of the Creative Commons Attribution (CC BY) license (http://creativecommons.org/licenses/by/4.0/).