Abstract
This paper presents a comprehensive overview of the potential and feasibility of using solar thermal cooling systems in the Kingdom of Saudi Arabia (KSA). The performance of a desiccant cooling system has been determined based on climatic data of 32 cities spread all over the territory of the country. The investigation has been carried out keeping in view the high energy consumption for cooling applications in the country. The analysis has been done using the overall performance of the system, sensible energy ratio, and cooling and regeneration loads. The main objective of this study is to encourage the implementation of solar thermal cooling systems in the country for the development of sustainable buildings. The economic analysis shows that thermal cooling technology can reduce the cost of cooling units, remarkably. Furthermore, the utilization of the proposed system will decrease the dependence on primary energy resources. The saving factor of the proposed system with 1 ton capacity in comparison to the conventional vapor compression unit is found to be 34.6%. The present study also recommends that the government subsidies and incentives can further improve the development and utilization of solar air conditioning technology in developing countries.
1. Introduction
Rapidly increasing consumption of fossil fuels is a proven reason for adverse local and global climatic changes. The increased consumption of primary energy has caused various environmental problems [1]. The petroleum fuel consumption is expected to reduce slightly but coal, natural gas, renewables, and nuclear-based energy generation will continue to grow even beyond 2040. These adverse climatic changes resulting in global warming have further increased the dependence of human comfort on refrigeration, air conditioning, and other modern technologies that require energy to operate. The power demand for these technologies is relatively more dominant in hot and humid countries such as Saudi Arabia, UAE, Qatar, Bahrain, Oman, Kuwait, etc.
The air conditioning industry is under tremendous pressure to follow the economic and regulatory conditions and environmental standards. The conventional vapor-compression air conditioning and refrigeration systems are the big consumers of electrical energy, especially in summer seasons. About 10%–20% of the globally generated electricity is used for cooling which is about 45% of the total energy consumed in residential and commercial buildings [2]. Furthermore, the non-natural refrigerants and working fluids such as chlorofluorocarbon (CFC) and hydrochlorofluorocarbon (HCFC) which are used in these conventional cooling systems significantly contribute to the depletion of the ozone layer. During the last few decades, the research efforts are being concentrated on developing alternative, clean, environmentally friendly, and efficient technologies for power generation to address ever-growing power demands [3]. Recently, different options have been developed and utilized for the sustainable development of cooling technology such as the advancement of cooling cycles and the use of new materials [4,5,6,7].
Thermally driven cooling cycles have the potential to address the problems related to conventional air conditioning systems. The utilization of renewable energy and low-grade waste heat (e.g., industrial waste heat and engine exhausts) is attractive and an efficient option in thermally driven cooling systems. Solar energy appears to be the most attractive and promising alternative to primary energy resources compared to other renewable energy sources. In recent years, many efforts have been made to utilize solar power efficiently and economically in the industrial and residential sectors.
Keeping the above aspects in mind, the solar-assisted thermal air conditioning technology which is the main focus of this research work has the potential of overcoming the above-mentioned drawbacks of conventional air conditioning systems. In this paper, the need and importance of alternative cooling technology are discussed for sustainable energy solutions. The detailed motivation and analysis for Saudi Arabia have been discussed in the forthcoming sections.
This paper has been divided into different sections for a better understanding of the reader. The issue of fast depletion of primary energy resources and global statistics has been discussed in the Introduction Section 1. Section 2 describes the alternative cooling technologies followed by technical details about the system and different performance indicators in Section 3. The results obtained for 32 different sites are described in Section 4. Section 5 provides an overview of the economic feasibility of the cooling unit under different weather conditions. The research and development needs of solar thermal cooling are discussed in Section 6. Finally, a summary of the findings is presented in Section 7 for quick understating.
The Case of Saudi Arabia
The alternative cooling technologies are of great interest globally due to the increased cooling load demands and higher power consumption by conventional cooling systems. Air conditioning is the dominant energy-consuming sector in many countries as stated in the IEA report [8]. The specific case of Saudi Arabia is not an exception, where the cooling demand is a major component in the electricity consumption leading to technical, as well as economical stress on the utility and the Ministry of Energy. The primary energy demand in KSA is increasing at a rapid rate [9]. The annual energy consumption was around 1100 TWh in 2004 which reached 1300 TWh in 2008 (an increase of 18.2% in four years) and is expected to touch 2000 TWh by 2020 and 2600 TWh by 2040. The current shares of natural gas and oil used for power generation are 37% and 63%, respectively. The energy mix is projected to be the same until 2030 but the government policies for the production and use of natural gas may change this share in the future [9]. The increased use of primary energy is also causing a rapid increase in greenhouse gas emissions. That is why Saudi Arabia is also among the top ten countries in terms of GHG emissions. The annual growth of GHG emissions in Saudi Arabia is depicted in Figure 1 and shows an increasing trend right from 1970 to 2015 and beyond. The energy sector is also the largest contributor to greenhouse gas (GHG) emissions (~89%) in the country as illustrated in Figure 2 [10].
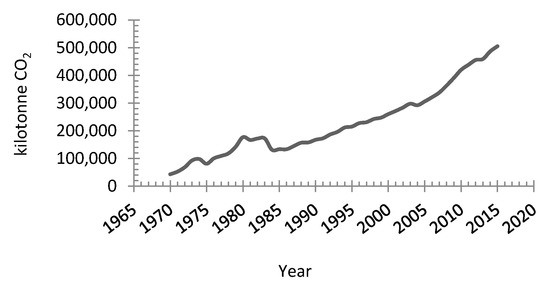
Figure 1.
Carbon dioxide emission for Saudi Arabia: The year 1970–2016 [2].
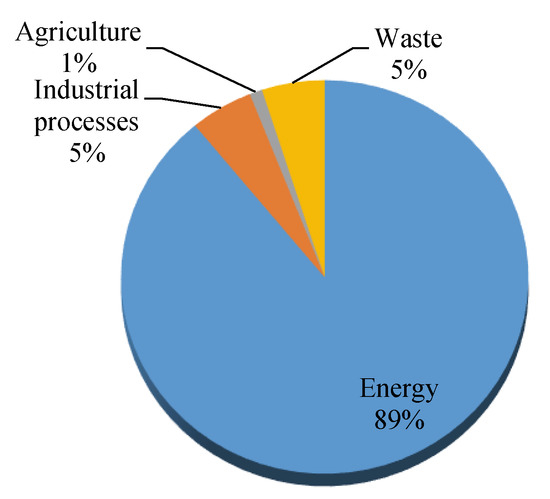
Figure 2.
Emissions of greenhouse gases in Saudi Arabia by sector [2,10].
The Kingdom of Saudi Arabia (KSA) is producing large volumes of oil but most of it is being consumed in the country for power production. To meet the rising demands of electricity the kingdom plans to increase the electricity generating capacity to 120 GW by 2032 [11,12]. In 2013, the country was generating about 292.2 billion kWh of electricity [13]. The energy demand is increasing at a high pace due to the population growth, materialistic living standards, industrialization, high demand for cooling due to hot and humid conditions, and subsidized electricity rates. The electricity demand in the country has increased at an average rate of about 8.2% in the last decade [14]. The kingdom has different expansion plans for energy production from renewable sources [15]. The institution responsible for renewable energy in the country (King Abdullah City for Atomic and Renewable Energy K.A. CARE) set a target of generating 24 GW by 2020 and 54 GW by 2032 from renewable energy [16,17]. The overall proposed energy mix of the country is shown in Figure 3. Furthermore, the country has planned an expansion of about 25–41 GW concentrated solar power (CSP) and 16 GW of PV capacity until 2040 to meet increasing energy demands through nonhydrocarbon sources [18,19]. Furthermore, a great deal of research work has been carried out for renewable and energy-efficient technologies at leading institutions of the country.
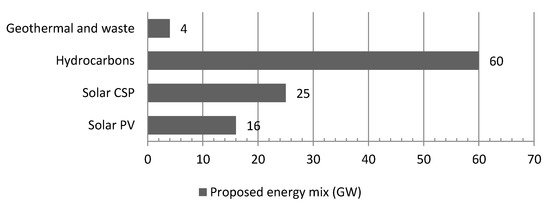
Figure 3.
Proposed energy mix of Saudi Arabia until 2032.
The hot climatic conditions of the country for a major part of the year make it rich with solar radiation. This abundance source of solar energy makes it logical to propose alternative cooling technologies that can utilize this huge potential [20]. Keeping all the above-mentioned aspects in mind, a comprehensive and comparative feasibility study has been carried out to assess the potential of solar cooling technologies in KSA. Different performance characteristics such as coefficient of performance, cooling load, regeneration load, and sensible energy ratio have been considered. Additionally, the importance and future research and development needs have also been discussed in this paper. The increasing cost and rising demand for electricity are expected to drive the market in the Kingdom towards sustainable development and utilization of alternative cooling systems. This market demand for alternative systems will arise from major cities such as Dhahran, Jeddah, Riyadh, and Mecca. The implementation of innovative technologies for higher performance of the desiccant cooling systems will help increase the market potential. Furthermore, the government initiatives to implement sustainable energy technologies for cooling needs will help in boosting the deployment of such technologies.
2. Alternate Cooling Technology
In addressing the issues of the air conditioning industry, solar thermal cooling technology is the key solution to reduce the dependence on primary energy and to address the environmental degradation issues. The Mediterranean countries can save about 40%–50% of their primary energy by the implementation of solar-driven air conditioning systems [21,22]. The development of these alternative cooling technologies has become the main focus because the peaks of the cooling load requirements coincide most of the time with the availability of maximum solar radiation. The life quality of the people living in remote areas and have no access to grid-connected electricity can be improved significantly by the use of solar cooling systems.
The heat energy from the sun can either be used directly to power a thermal cooling system using solar thermal collectors or it can be converted to electricity using solar photovoltaic (PV) panels. A state-of-the-art solar thermal collector can operate with an efficiency of about 80% whereas the efficiency of PV systems is up to 35% and the rest is waste in the form of heat energy [23]. Moreover, the efficiency improvement of the PV module was only 10%–15% during the last decade which is far below the efficiency of thermal collectors and additionally the PV modules have a fairly high initial cost too [24].
Due to the direct and efficient use of solar energy, solar thermal-driven air conditioning systems such as absorption, adsorption, and desiccant are getting more attention. A typical solar thermal cooling system consists of solar collectors, a thermally driven cooling machine, and some other accessories such as storage tank, pump, etc. The basic concept of a solar thermal air conditioning system is shown in Figure 4.
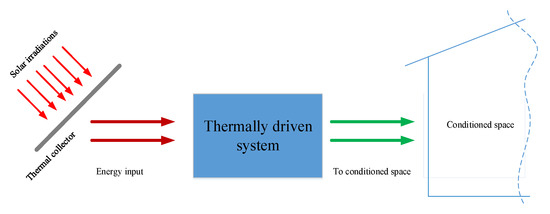
Figure 4.
Basic concept of solar thermal air conditioning system.
Today, the solar thermal cooling technology has become more mature and reliable and different solar cooling systems are commercially available for building and space cooling. These thermal cooling units are essentially based on three technologies: Absorption, adsorption, and desiccant cooling. Recently, few systems have been developed to provide both cooling and water heating [25,26,27,28,29].
3. Research Methodology
Desiccant cooling technology removes moisture from the air by a process known as sorption (adsorption or absorption). Different desiccant materials are used for this process. Due to vapor pressure difference, the adsorption material adsorbs water vapor from the air for continuous operation. In this process the moisture is removed from the air in the desiccant wheel using thermal energy. The physical properties of the desiccant wheel, psychrometric chart, and developed mathematical model for the solid desiccant cooling system has been used to check the feasibility of the system for different sites in Saudi Arabia. In addition, it is assumed that the effectiveness of evaporative coolers and heat recovery wheel is 85%–90%. Different cities of Saudi Arabia have been selected to study the performance of the proposed solar cooling system. The purpose of this investigation is to study the feasibility of the solar thermal cooling system for the country. Theoretical results are obtained under the climatic conditions of 32 sites. The coefficient of performance (COP), sensible energy ratio, cooling load, and regeneration load have been taken as performance evaluation parameters in the current study.
3.1. System Description
The desiccant cooling system operating under the ventilation cycle is shown in Figure 5. The desiccant wheel adsorbs the moisture from process air (stage 1–2) which is then passed through a heat recovery wheel (stage 2–3) for the exchange of heat between the hot and dry process air and cold regeneration air. A desiccant wheel is a mass and heat exchange device having low rotational speed. The desiccant material is embedded into the wheel using a matrix of supporting material forming a number of flow channels. The wheel is divided into two sections, i.e., process and regeneration. On the process side, the moisture is adsorbed from the air passing through the desiccant surface. In the regeneration section, adsorbed moisture is removed using a high-temperature regeneration air stream. The flow rate of process and regeneration air is very important at this stage for heat recovery and system overall efficiency. After the heat recovery, the processed air is cooled to the desired temperature (stage 3–4) using an evaporative cooler. The desiccant wheel is regenerated using heated air. The heat energy is provided using solar thermal collectors in the real system. A specific regeneration temperature is assumed for the regeneration of desiccant material.
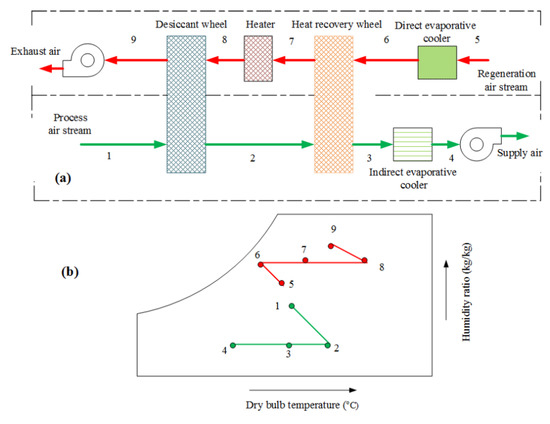
Figure 5.
(a) Systematic of cooling system (b) psychometric processes.
3.2. Mathematical Modeling of System Components
In this section, the mathematical modeling of individual components associated with the desiccant cooling system has been carried out. The desiccant wheel considered for the present system is of rotary shape with silica gel embedded into sinusoidal flow channels. The cut out of a flow channel for modeling purposes is shown in Figure 6, whereas a schematic representation of the energy and mass balance for a control volume inside the channel is presented in Figure 7.
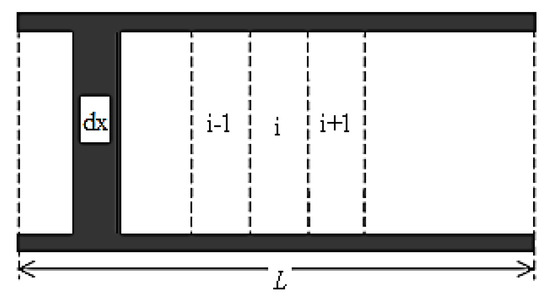
Figure 6.
Pattern of flow in a slot.
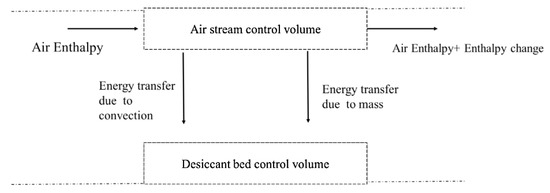
Figure 7.
Schematic representation of energy balance for a control volume.
The water vapors are adsorbed by the desiccant material from hot and humid process air as it passes through the process side of the desiccant wheel. This mass transfer is due to the higher partial pressure of process air as compared to the surface of desiccant.
where,
On the process side, energy is transferred between the air and desiccant surface by convective heat and mass transfer.
where,
The conservation of mass expression for the desiccant surface depicts the manner in which the desiccant adsorbs and desorbs moisture while in contact with the air stream.
The conservation of energy equation for the desiccant surface relates to the effects of convective terms on the desiccant surface temperature. This equation considers the amount and type of media upon which the desiccant solution is mounted.
The effective specific heat considering all materials contributing to the composition of desiccant bed is given as:
The saturated humidity ratio of the air can be written in terms of water vapor pressure:
Pvi is the water vapor saturation pressure which is found as [30]:
Fully developed flow is considered in order to determine local heat and mass transfer coefficients. The Nusselt number for a fully developed flow which depends on the geometry of the channel is given by [31]:
The local Nusselt number and heat transfer coefficient are found as [31]:
Similarly, the local mass transfer coefficient can be found as:
where, the mass diffusion coefficient is given as [30]:
The above governing equations for the desiccant wheel are subject to the following initial and boundary conditions:
Depending upon the climatic conditions, the process air temperature and humidity ratio at state point 2 can be determined using the above equations and wheel dimensions and thermodynamic properties listed in Table 1. In order to determine air conditions at other state points, the relations for the effectiveness of the heat recovery wheel and evaporative coolers are used.

Table 1.
Desiccant wheel dimensions and thermodynamic properties.
Moreover, from the energy and mass balances:
The developed model equations are used to determine the air conditions at each state point of the system in order to determine system performance.
4. Performance Parameters
The system coefficient of performance (COP) is given as the ratio of cooling load and regeneration heat required:
The cooling load and regeneration heat are given as:
The sensible energy ratio (SER) is also used when evaluating the desiccant dehumidifier. The SER quantifies the required additional sensible load to be handled by some additional cooling mechanism at the downstream such as evaporative cooling or a vapor compression cycle. The SER is given by:
For better dehumidification performance of the desiccant wheel, the value of SER should be lower. The higher value of SER means more cooling load on the device because of the higher temperature of process air at the exit of the desiccant wheel. The lower value of SER is indicative of the better performance of the desiccant dehumidifier and requires a lower sensible cooling load.
5. Model Verification
The model was verified by comparing the results obtained from the present model with that of reference [20] for the effect of regeneration temperature on the COP of the system. The analysis was carried out under the same operating condition as used in reference [20] and using climatic data for Dhahran. The regeneration temperature varied from 90 to 180 °C to observe its effect on system performance. The comparative results are shown in Figure 8. It is observed that the COP value obtained using the present model is in good agreement with that of reference [20] for the climatic conditions of Dhahran. The COP is underpredicted by ~5% when a lower regeneration temperature (90 °C) is used for activation of the desiccant wheel whereas COP is overpredicted by ~10% when a regeneration temperature is kept in the higher range (180 °C). It is further observed that, as the regeneration temperature increased, the COP of the system decreased. The decrease in the system COP due to an increase in the regeneration temperature is due to the increase in required regeneration heat. Although the higher value of regeneration temperature will make the moisture removal process faster, at the same time this higher value of temperature will dry-up the desiccant wheel before the completion of the regeneration period. Hence, some added energy will be wasted and will not be utilized during moisture removal. Thus, the increase in regeneration temperature will increase the required regeneration heat, which, in turn, will decrease the COP of the system.
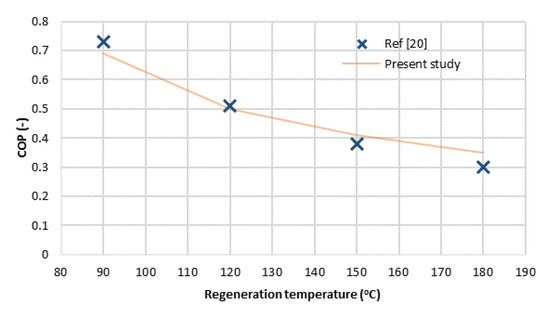
Figure 8.
Model verification.
6. Results and Discussion
The desiccant wheel operation and structural parameters vary with the area of application and climatic conditions. For a better understanding of these dependencies, a mathematical model is developed to investigate the performance of the system at 32 different sites. The performance of the solid desiccant wheel with dimensions shown in Table 1 has been observed under different operating parameters. The performance of the desiccant based thermal cooling system is analyzed under operating conditions summarized in Table 2. The desiccant wheel considered for the present analysis is composed of silica gel which has a regeneration temperature of 120–200 °C [27]. A regeneration air inlet temperature of 200 °C was taken as the activation temperature of desiccant material for the present analysis. The flow rate of regeneration air (0.54 kg/s) was considered as one-third of process air (1.62 kg/s) which is typically used for desiccant cooling systems [27]. The unknown conditions of the air at each point of the cycle are determined using model equations and the psychometric chart. The built-in function of engineering equation solver (EES) is used to obtain the thermodynamic properties of moist and dry air. The complete description of the system is provided in the earlier sections. The monthly average values of temperature, relative humidity, and solar radiations for all sites along with geographical coordinates for all sites are presented in Table 3 [32,33,34,35].
Table 2.
Operating parameters.
Table 3.
Location and climatic data for all sites under study.
The effects of ambient conditions on the overall performance of the system (COP), sensible energy ratio, cooling load, and regeneration load have been observed and the results are illustrated in Figure 9, Figure 10, Figure 11 and Figure 12, respectively. Figure 9 shows the variation of COP with respect to the required input energy. The system performance is largely affected by climatic conditions such as temperature and humidity ratio. It can be observed from Figure 9 that the highest COP of 0.8 is observed for Al Ahsa site in the month of July but the overall system operates with a more stable COP for Al Qunfudhah, Osfan, Hada Al Sham, Jeddah, and Thuwal at a process airflow rate of 1.62 kg/s (3000CFM) and the mass flow rate ratio of 0.33. The annual average performance data showed the highest and the lowest performances of 0.50 and 0.23 for Jeddah and Tabuk, respectively. Furthermore, better performance of the proposed cooling systems was observed from July to October for most of the sites which further makes the system suitable during the high cooling demand season.
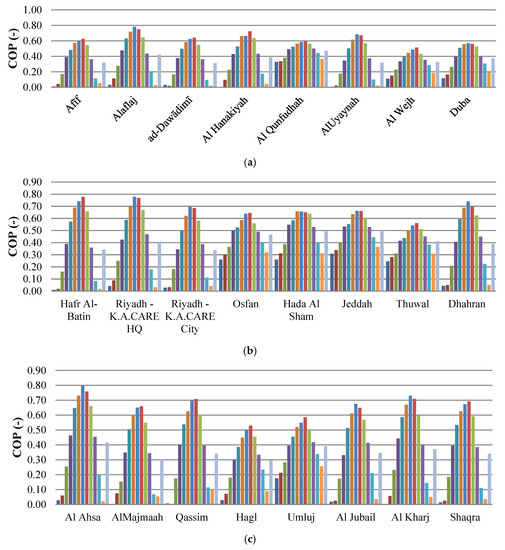
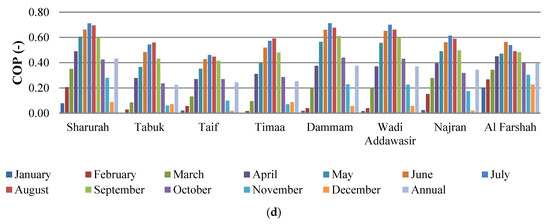
Figure 9.
Monthly variations of coefficient of performance for (a) Afīf, Alaflaj, ad-Dawādimī, Al Hanakiyah, Al Qunfudhah, AlUyaynah, and Al Wejh, Duba; (b) Hafr Al-Batin, Riyadh—K.A. CARE HQ, Riyadh—K.A. CARE City, Osfan, Hada Al Sham, Jeddah, Thuwal, and Dhahran; (c) Al Ahsa, AlMajmaah, Qassim, Hagl, Umluj, Al Jubail, Al Kharj, Shaqra; (d) Sharurah, Tabuk, Taif, Timaa, Dammam, Wadi Addawasir, Najran, and Al Farshah.
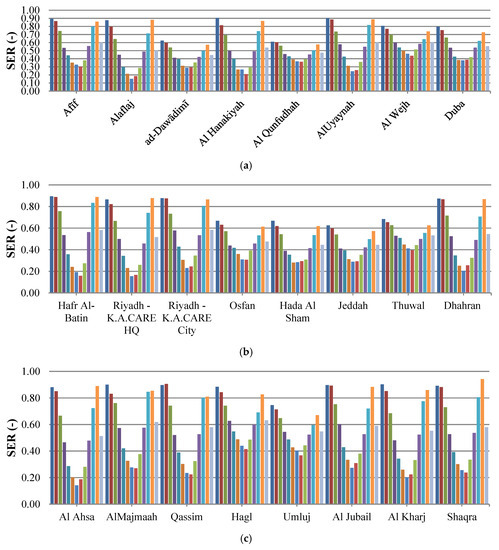
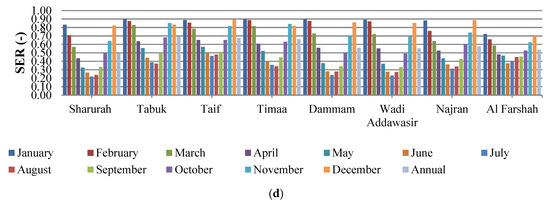
Figure 10.
Monthly variations of sensible energy ratio for (a) Afīf, Alaflaj, ad-Dawādimī, Al Hanakiyah, Al Qunfudhah, AlUyaynah, and Al Wejh, Duba; (b) Hafr Al-Batin, Riyadh—K.A. CARE HQ, Riyadh—K.A. CARE City, Osfan, Hada Al Sham, Jeddah, Thuwal, and Dhahran; (c) Al Ahsa, AlMajmaah, Qassim, Hagl, Umluj, Al Jubail, Al Kharj, Shaqra; (d) Sharurah, Tabuk, Taif, Timaa, Dammam, Wadi Addawasir, Najran, and Al Farshah.
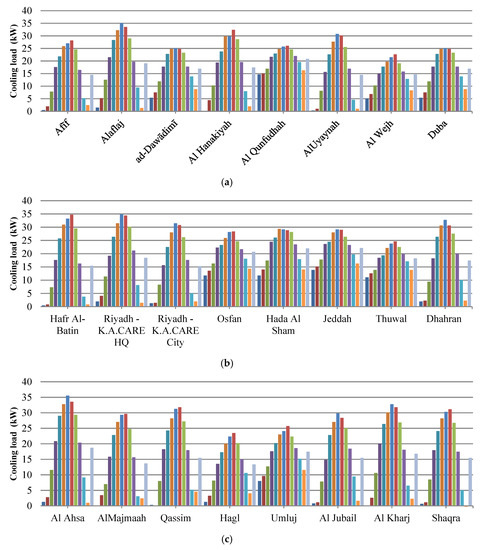
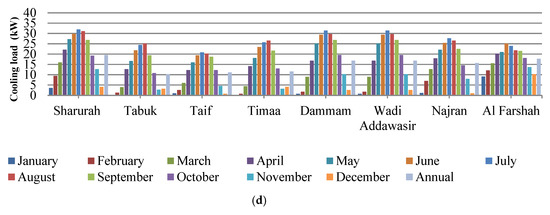
Figure 11.
Monthly variations of cooling load for (a) Afīf, Alaflaj, ad-Dawādimī, Al Hanakiyah, Al Qunfudhah, AlUyaynah, and Al Wejh, Duba; (b) Hafr Al-Batin, Riyadh—K.A. CARE HQ, Riyadh—K.A. CARE City, Osfan, Hada Al Sham, Jeddah, Thuwal, and Dhahran; (c) Al Ahsa, AlMajmaah, Qassim, Hagl, Umluj, Al Jubail, Al Kharj, Shaqra; (d) Sharurah, Tabuk, Taif, Timaa, Dammam, Wadi Addawasir, Najran, and Al Farshah.
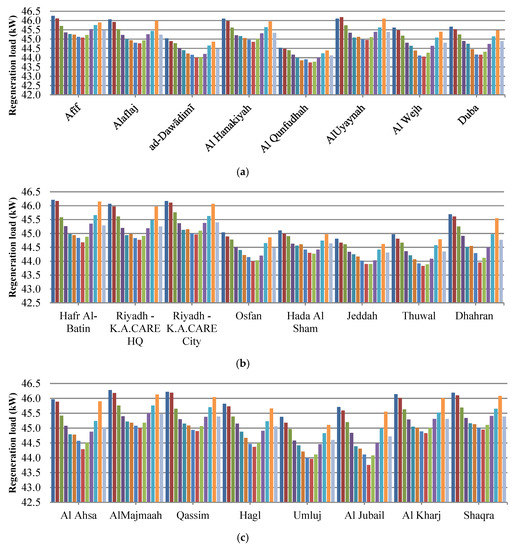
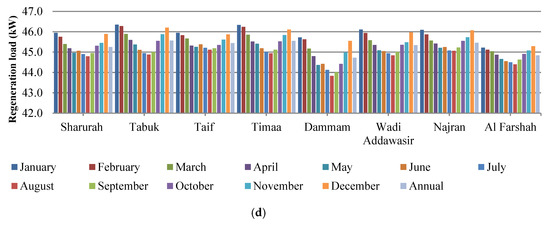
Figure 12.
Monthly variations of regeneration load for (a) Afīf, Alaflaj, ad-Dawādimī, Al Hanakiyah, Al Qunfudhah, AlUyaynah, and Al Wejh, Duba; (b) Hafr Al-Batin, Riyadh—K.A. CARE HQ, Riyadh—K.A. CARE City, Osfan, Hada Al Sham, Jeddah, Thuwal, and Dhahran; (c) Al Ahsa, AlMajmaah, Qassim, Hagl, Umluj, Al Jubail, Al Kharj, Shaqra; (d) Sharurah, Tabuk, Taif, Timaa, Dammam, Wadi Addawasir, Najran, and Al Farshah.
The sensible energy ratio (SER) is another important performance parameter that defines the additional cooling required to provide thermal comfort conditions. The variation of SER for all the sites is illustrated in Figure 10. As the humidity ratio of the air at the inlet of the desiccant wheel increases, a greater amount of water vapor is adsorbed by the desiccant wheel which increases the released heat of adsorption. This increase in adsorption heat causes an increase in the temperature at the exit of the desiccant wheel. At constant inlet air and regeneration temperature, the increase in temperature at the exit of the desiccant wheel causes a decrease in SER. Thus, with the increase in the inlet humidity ratio, SER increases. The increase in the temperature at the inlet of the desiccant wheel slightly reduces the water removal from the process air. This decreases the heat of adoration and the temperature at the exit of the desiccant wheel also lowers. In general, higher values of SER are observed in the wintertime and lower from May to September at almost all the sites investigated in the present work. With respect to site comparison, the highest value of SER of 0.94 was obtained in the month of December for Al Shaqra and the lowest of 0.14 in July for Al Ahsa. The annual average performance was highest for Tabuk with a SER value of 0.69 and the lowest of 0.44 for Hada Al Sham.
For the overall performance evaluation of the proposed solar cooling system, the cooling load and the required input heat are two important parameters. The cooling capacity of any system provides its ability to control the indoor temperature and humidity during high demand conditions. Whereas, the required input heat of the system quantifies the energy required to operate the system. The input heat is termed as the regeneration load for the desiccant cooling system. The behavior of the system’s cooling capacity for all 32 sites is depicted in Figure 11. The highest cooling load of 35 kW was served by the system in the month of July at Alaflaj, Riyadh K.A. CARE HQ, and Al Ahsa. A relatively better annual average cooling load of 20 kW or more was served by the proposed system at Osfan, Hada Al Sham, Jeddah, and Al Qunfudhah, as shown in Figure 11. The minimum load of 10 kW or less was met by the system at Tabuk. The variation of required input heat at 32 sites for continuous operation of the system is shown in Figure 12. There are small variations in the required regeneration load as it is mostly defined by regeneration temperature and flow of regeneration air which is kept constant in this case. Here, the role of solar radiation come into the picture which means that the sites with higher solar insolation can achieve the required regeneration load using thermal collector more efficiently compared to the others with lesser intensity. The high average temperature and solar irradiance in summer make the system a feasible option because it coincides with the higher cooling demands. Although the system COP is lower compared to the conventional system the solar is a free source of energy and is abundant at selected sites and should be used, as illustrated in Table 3.
7. Economic Feasibility
In this section, the total investment cost of a desiccant cooling system has been investigated for the application of a high latent load. The essence of economic analysis is to evaluate the cost of the air conditioning system and maintain the expenditure incurred during the construction and operation of the unit. Different methods are used for the economic feasibility of a system. In the present study, the total life cycle cost analysis is employed to evaluate the economics of proposed cooling technology. The concept is based on the life cycle of the system, which is comprised of its initial investment, operating cost, salvage value of the equipment, and the payback period. Less value of initial investments does not mean that the system is more attractive and may end up into a costly solution because of the high running cost over the life cycle. That is why the concept of life cycle cost analysis is used which evaluates the long-term feasibility of the system over the entire life cycle. The total life cycle cost () of the system is given as [36]:
The present worth factor when the interest and the discount rates are not equal is calculated as follows:
The life cycle saving is estimated as:
where, , , represent the life cycle, initial, and running costs, respectively. is the salvage value of the equipment, Ø is the present worth factor, N is the life cycle time, d is the discount rate, and i is the interest rate. Payback period (PBP) is the length of time required to recover the first cost of an investment from the net cash flow produced by that investment. The payback period is estimated as follows:
Based on the market survey of air conditioners in the Kingdom of Saudi Arabia, the average cost of 1 ton unit air conditioner is about US$ 670. The initial cost for the desiccant cooling system includes the cost for dehumidifier, fans, pumps, evaporative coolers, and solar heating system and is represented mathematically as follows:
where, Ideh, Ipump, Ifan, IEC, and ISC are the initial investment costs of the dehumidifier, pump, fans, evaporative coolers, and solar collectors, respectively. The evaporative coolers have higher efficiency, smaller size, less investment cost, and lower consumption of energy as compared to air exchangers [37]. The investment cost for the fans includes the cost of electric motor and other associated accessories. The cost of desiccant dehumidifier was obtained from the manufacturer whereas the costs of the pump, fans, and evaporative coolers were estimated from respective performance curves [38,39,40,41]. Based on all these values, the total investment cost of 1 ton capacity desiccant cooling system was found to be US$ 820. The energy cost included the energy required for the heating system and the fans.
The operating cost of an air conditioning system is basically the cost of the energy consumed during its operation. Based on the information provided for the conventional air conditioner, the energy consumption of a 1 ton air conditioning unit is about 2.6 kWh. Assuming the system operation time of 20 h a day for eight months, the annual energy consumed by the conventional system becomes 12,480 kWh. The average energy consumed by the proposed system is found to be about 1.7 kWh which becomes 8160 kWh during the similar operating conditions. The savings factor is the percentage of energy that could be saved with the installation of the proposed system and is found to be 34.6%. The annual savings that the proposed system will result can be calculated based on the rate of the electricity. For the present analysis, the rate of electricity in the Kingdom of Saudi Arabia is taken as 0.04 US$/kWh. The annual operating cost of the conventional unit is 500 US$ and the proposed unit US$ 327. Thus, the proposed unit can provide annual savings of US$ 173 for 1 ton capacity cooling system. This saving is expected to be much more for larger capacity units as mentioned by Munters, a leading manufacturer of desiccant cooling technology.
The calculated payback period for the proposed system with an interest of 8% is found to be 6 years. The interest rate during this period and the salvage value of the equipment are taken into consideration. The salvage value of the pumps, desiccant tanks, and the fans were taken as 20% of the initial costs. Considering a reasonable payback period and substantial annual energy savings, the extra cost is acceptable. The payback period can be further reduced through different discounts and incentives in terms of initial and operating costs provided by the government. It is very timely to provide these facilities for sustainable development and long-term alternative for cooling technology in the country.
8. Challenges and Research and Development Needs
Solar energy is free and available everywhere and hence reduces the burden of oil imports. The thermal energy can provide a large share of the heat energy required in the world. However, until now the progress of solar thermal energy is not much encouraging due to some technical and cost factors. The cost comparison should be made over the lifetime of a solar thermal system assuming growing fossil fuel prices with time. More research and development work needs to be carried out in order to implement alternative cooling technologies and to make them user friendly. The summary of important aspects of future research and development are:
- New and stable sorption materials should be developed which require lower regeneration heat. Their performance should be optimized to use for this technology.
- The multistage desiccant cooling cycle should be developed for better overall performance.
- New generation heat exchangers coated with sorption materials should be developed.
- New user-friendly simulation and designing tools should be developed to optimize the performance of these systems under different climatic conditions.
- Efficient heat recovery units should be developed for better performance of the system.
- Small and medium-sized cooling kits operated by solar energy should be developed for the promotion of technology.
- The parasitic energy consumption should be reduced by using newly developed components with high efficiency and suitable for these systems.
- Thermal cooling systems should be integrated into smart cooling grids.
- The installer and engineers should be provided with appropriate training for this technology.
- The solar collector should be used according to the climatic conditions with proper adjustments and high efficiency.
- The government should implement policies to provide support to investors in order to implement this alternative cooling solution.
9. Concluding Remarks
Middle East countries, especially KSA, have a large potential for renewable sources of energy. The contribution of renewable energy towards the country’s energy mix of KSA is negligible and fossil fuels are only used for the production of electricity. The oil and gas industry accounts for 45% of gross domestic product (GDP) and approximately 90% of export earnings. About a 30% increase in energy per capita has been observed since 2000. It is projected that the national primary energy consumption will be doubled in 2030. This increased consumption of fossil fuels for domestic energy generation will result in a reduction of the oil and gas export which is a major revenue-generating sector of the country.
Solar thermal cooling is not a new concept; nevertheless, it is gaining relevance in recent years because of its potential to provide efficient cooling at low costs without CO2 emissions. The theoretical analysis of the solar thermal cooling system for climatic conditions of 32 sites in the country showed that the desiccant cooling system can effectively be utilized using freely available solar energy. The high cooling demand together with the vast supply of solar resources in KSA and in the Middle East suggests that solar energy is a highly practical approach for cooling applications.
Keeping all these aspects in mind, the government should realize the need for energy efficiency and deployment of renewable energy technologies as a key priority to diversify the national energy mix and the economy. Efforts are underway to diversify the energy mix of the country through the development of renewable energy technologies such as solar thermal, solar PV, wind, geothermal, and waste to energy.
Author Contributions
M.M.R. conceived the idea, developed the model and performed the analysis, and wrote the initial draft of the paper with the help of S.R., L.M.A., and M.M.A. helped in writing the paper. All authors have read and agreed to the published version of the manuscript.
Funding
This research was funded by King Fahd University of Petroleum & Minerals (KFUPM), Dhahran-31261, Saudi Arabia.
Acknowledgments
The authors would like to acknowledge the support provided by King Fahd University of Petroleum & Minerals (KFUPM), Dhahran-31261, Saudi Arabia for completing this reported work.
Conflicts of Interest
The authors declare no conflict of interest.
Nomenclature
| N | number of cells in each slot (-) |
| ma | process air mass flow rate (kg /m2 s) |
| mr | regeneration air mass flow rate (kg /m2 s) |
| VH | humid air specific volume (m3/kg) |
| L | wheel thickness (m) |
| K | mass transfer coefficient per unit area (kg/m2 s) |
| U | face velocity (m/s) |
| Ds | diameter of one slot (m) |
| Dh | hydraulic diameter (m) |
| t | time (s) |
| Ah | channel internal surface area (m2) |
| Ac | channel cross sectional area (m2) |
| Cpa | dry air specific heat (kJ/kg K) |
| Cpv | water vapor specific heat (kJ/kg K) |
| Cpw | liquid water specific heat (kJ/kg K) |
| Cpf | wall material specific heat (kJ/kg K) |
| Cpd | desiccant specific heat (kJ/kg K) |
| Ta | air temperature of air (K) |
| Ts | desiccant solution temperature (K) |
| Tr | regeneration temperature (K) |
| To | ambient temperature (K) |
| h | heat transfer coefficient (kW/m2 K) |
| Q | latent heat of vaporization (kJ/kg) |
| K | thermal conductivity (W/m2 K) |
| Pe | perimeter (m) |
| Sh | Sherwood number |
| Pr | Prandtl number |
| Re | Reynolds number |
| Nu | Nusselt number |
| Gz | Graetz number |
| Sh | Sherwood number |
| Le | Lewis number |
| Dm | mass diffusion coefficient |
| P | pressure (kpa) |
| f | friction factor |
| Ko | velocity head loss at the entry and exit of the desiccant wheel |
| Treg | regeneration air temperature (K) |
| Tamb | ambient air temperature (K) |
| hfg | latent heat of vaporization (kJ/kg) |
| Qr | regeneration heat (kW/m2) |
| W | desiccant moisture content |
Abbreviation
| COP | coefficient of performance |
| DCOP | dehumidification coefficient of performance |
Greek Letters
| ρv | water vapor density (kg/m3) |
| ρa | density of air (kg/m3) |
| ρf | wall material density (kg/m3) |
| ρd | desiccant density (kg/m3) |
| ωa | air absolute humidity (kg/kg of dry air) |
| ωs | absolute humidity of air at desiccant bed (kg/kg of dry air) |
| α | aspect ratio |
References
- Jaber, O.; Badran, O.; Abu-Shikhah, N. Sustainable energy and environmental impact: Role of renewables as clean and secure source of energy for the 21st century in Jordan. Clean Technol. Environ. Policy 2004, 6, 174–186. [Google Scholar] [CrossRef]
- Rafique, M.; Rehman, S.; Alam, M.; Alhems, L. Feasibility of a 100 MW Installed Capacity Wind Farm for Different Climatic Conditions. Energies 2018, 11, 2147. [Google Scholar] [CrossRef]
- Florides, G.A.; Tassou, S.A.; Kalogirou, S.A.; Wrobel, L.C. Review of solar and low energy cooling technologies for buildings. Renew. Sustain. Energy Rev. 2002, 6, 557–572. [Google Scholar] [CrossRef]
- Ilyas, S.U.; Pendyala, R.; Narahari, M.; Susin, L. Stability, rheology and thermal analysis of functionalized alumina-thermal oil-based nanofluids for advanced cooling systems. Energy Convers. Manag. 2017, 142, 215–229. [Google Scholar] [CrossRef]
- Ahmed, S.F.; Amanullah, M.T.; Khan, M.M.; Rasul, M.G.; Hassan, N.M. Parametric study on thermal performance of horizontal earth pipe cooling system in summer. Energy Convers. Manag. 2016, 114, 324–337. [Google Scholar] [CrossRef]
- Imani-Mofrad, P.; Saeed, Z.H.; Shanbedi, M. Experimental investigation of filled bed effect on the thermal performance of a wet cooling tower by using ZnO/water nanofluid. Energy Convers. Manag. 2016, 127, 199–207. [Google Scholar] [CrossRef]
- Borgogno, R.; Mauran, S.; Stitou, D.; Marck, G. Thermal-hydraulic process for cooling, heating and power production with low-grade heat sources in residential sector. Energy Convers. Manag. 2017, 135, 148–159. [Google Scholar] [CrossRef]
- International Energy Agency (IEA). Available online: https://www.iea.org/ (accessed on 5 November 2019).
- Saudi Electricity Company; Annual Report: Riyadh, Saudi Arabia, 2009.
- World Resources Institute (WRI). Climate Analysis Indicators Tool (CAIT). World Resources Institute. Available online: http://cait.wri.org (accessed on 6 December 2018).
- Al-Awaji, S. Deputy Minister of Water and Electricity, ahead of the first Saudi HVAC Conference on 11–13 February at the Al-Faisaliah Hotel, Riyadh. Available online: http://saudigazette.com.sa/article/28266 (accessed on 7 November 2019).
- Energy Information Administration (U.S.). Country Analysis Brief: Saudi Ara-bia. Available online: http://www.eia.gov/countries/analysisbriefs/Saudi_Arabia/saudi_arabia.pdf (accessed on 10 September 2014).
- BP Statistical Review of World Energy. Available online: http://www.bp.com/en/global/corporate/energy-economics/statistical-review-of-world-energy.html (accessed on 8 November 2019).
- Saudi Arabia’s Electricity and Cogeneration Regulatory Authority (ECRA Annual Reports) 2014. Available online: http://www.ecra.gov.sa/documents/Annual%20reports/ecra_ebook2014.pdf (accessed on 8 November 2019).
- KACARE Outlines Saudi Electricity Energy Source Scenario; Middle East Petroleum and Economic Publications: Nicosia, Cyprus, 2013.
- Bhutto, A.W.; Bazmi, A.A.; Zahedi, G.; Jirí, J.K. A review of progress in renewable energy implementation in the Gulf Cooperation Council countries. J. Clean Prod. 2014, 71, 168–180. [Google Scholar] [CrossRef]
- KACARE. Government of Saudi Arabia. Available online: http://www.kacare.gov.sa/en/ (accessed on 7 December 2018).
- REN21. Renewables 2015 Global Status Report. Available online: http://www.ren21.net/wp-content/uploads/2015/07/REN12-GSR2015_Onlinebook_low1.pdf (accessed on 1 December 2018).
- Rafique, M.M.; Gandhidasan, P.; Bahaidarah, H.M. Emerging energy efficient thermally driven HVAC technology: Liquid desiccant enhanced evaporative air conditioning. In Desiccant Heating, Ventilating, and Air-Conditioning Systems; Springer: Singapore, 2017; pp. 229–256. [Google Scholar]
- Rafique, M.M.; Rehman, S.; Lashin, A.; Arifi, N.A. Analysis of a solar cooling system for climatic conditions of five different cities of Saudi Arabia. Energies 2016, 9, 75. [Google Scholar] [CrossRef]
- Abu-Hamdeh, N.H.; Al-Muhtaseb, M.T.A. Optimization of solar adsorption refrigeration system using experimental and statistical techniques. Energy Convers. Manag. 2010, 51, 1610–1615. [Google Scholar] [CrossRef]
- Otanicar, T.; Taylor, R.A.; Phelan, P.E. Prospects for solar cooling—An economic and environmental assessment. Solar Energy 2012, 86, 1287–1299. [Google Scholar] [CrossRef]
- Al-Zubaydi, A.Y.T. Solar Air Conditioning and Refrigeration with Absorption Chillers Technology in Australia—An Overview on Researches and Applications. J. Adv. Sci. Eng. Res. 2011, 1, 23–41. [Google Scholar]
- Streimikiene, D.; Burneikis, J.; Punys, P. Review of renewable energy use in Lithuania. Renew. Sustain. Energy Rev. 2005, 9, 29–49. [Google Scholar] [CrossRef]
- Rafique, M.M.; Gandhidasan, P.; Rehman, S.; Al-Hadhrami, L.M. A review on desiccant based evaporative cooling systems. Renew. Sustain. Energy Rev. 2015, 45, 145–159. [Google Scholar] [CrossRef]
- Chen, C.H.; Hsu, C.Y.; Chen, C.C.; Chiang, Y.C.; Chen, S.L. Silica gel/polymer composite desiccant wheel combined with heat pump for air-conditioning systems. Energy 2016, 94, 87–99. [Google Scholar] [CrossRef]
- Rafique, M.M.; Gandhidasan, P.; Rehman, S.; Alhems, L.M. Performance analysis of a desiccant evaporative cooling system under hot and humid conditions. Environ. Prog. Sustain. Energy 2016, 35, 1476–1484. [Google Scholar] [CrossRef]
- Speerforck, A.; Schmitz, G. Experimental investigation of a ground-coupled desiccant assisted air conditioning system. Appl. Energy 2016, 181, 575–585. [Google Scholar] [CrossRef]
- Rafique, M.M.; Gandhidasan, P.; Bahaidarah, H.; Shakir, M.A. Thermal and exergetic performance evaluation of an absorption type desiccant dehumidifier. Environ. Prog. Sustain. Energy 2018, 37, 1411–1423. [Google Scholar] [CrossRef]
- Ge, T.S.; Ziegler, F.; Wang, R.Z. A mathematical model for predicting the performance of a compound desiccant wheel (A model of compound desiccant wheel). Appl. Therm. Eng. 2010, 30, 1005–1015. [Google Scholar] [CrossRef]
- Antonellis, S.D.; Joppolo, C.M.; Molinaroli, L. Simulation, performance analysis and optimization of desiccant wheels. Energy Build. 2010, 42, 1386–1393. [Google Scholar] [CrossRef]
- Almarshoud, A.F. Performance of solar resources in Saudi Arabia. Renew. Sustain. Energy Rev. 2016, 66, 694–701. [Google Scholar] [CrossRef]
- Rehman, S.; Maher, A.B.; Al-Moallem, S.A. Cost of solar energy generated using PV panels. Renew. Sustain. Energy Rev. 2007, 11, 1843–1857. [Google Scholar] [CrossRef]
- Al-Hadhrami, L.M. Comprehensive review of cooling and heating degree days characteristics over Kingdom of Saudi Arabia. Renew. Sustain. Energy Rev. 2013, 27, 305–314. [Google Scholar] [CrossRef]
- Research Institute, King Fahd University of Petroleum and Minerals, Dhahran 31261, Saudi Arabia. Available online: http://www.kfupm.edu.sa/default.aspx (accessed on 5 November 2019).
- Zhai, H.; Dai, Y.J.; Wu, J.Y.; Wang, R.Z. Energy and exergy analysis on a novel hybrid solar heating, cooling and power generation system for remote areas. Appl. Energy 2009, 86, 1395–1404. [Google Scholar] [CrossRef]
- Rafique, M.M.; Rehman, S.; Alhems, L.M. Exergoeconomy of a desiccant enhanced evaporative cooling system using exergetic incremental function. Desalin. Water Treat. 2017, 1, 10. [Google Scholar] [CrossRef]
- Zalewski, W.; Niezgoda-Żelasko, B.; Litwin, M. Optimization of evaporative fluid coolers. Int. J. Refrig. 2000, 23, 553–565. [Google Scholar] [CrossRef]
- Rafique, M.M.; Rehman, S.; Alhems, L.; Lashin, A. Parametric analysis of a rotary type liquid desiccant air conditioning system. Energies 2016, 9, 305. [Google Scholar] [CrossRef]
- Bom, G.J. Evaporative Air-Conditioning: Applications for Environmentally Friendly Cooling; World Bank technical paper; no. WTP 421. Energy series; World Bank Publications: Washington, DC, USA, 1999; Available online: http://documents.worldbank.org/curated/en/717411468739217789/Evaporative-air-conditioning-applications-for-environmentally-friendly-cooling. (accessed on 10 November 2019).
- Boehm, R.F. Design Analysis of Thermal Systems; John Wiley/Sons: New York, NY, USA, 1987. [Google Scholar]
© 2020 by the authors. Licensee MDPI, Basel, Switzerland. This article is an open access article distributed under the terms and conditions of the Creative Commons Attribution (CC BY) license (http://creativecommons.org/licenses/by/4.0/).