Article

Energy Performance Comparison between Two Liquid Desiccant and Evaporative Cooling-Assisted Air Conditioning Systems

Department of Architectural Engineering, College of Engineering, Hanyang University, Seoul 04763, Korea
*
Author to whom correspondence should be addressed.
Energies 2020, 13(3), 522; https://doi.org/10.3390/en13030522
Submission received: 6 January 2020 / Revised: 17 January 2020 / Accepted: 18 January 2020 / Published: 21 January 2020

Abstract

:
This study investigated the annual energy saving potential and system performance of two different evaporative cooling-based liquid desiccant and evaporative cooling-assisted air conditioning systems. One system used an indirect and direct evaporative cooler with a two-stage package to match the target supply air point. The other was equipped with a single-stage, packaged dew-point evaporative cooler that used a portion of the process air, which had been dehumidified in advance. Systems installed with the two evaporative coolers were compared to determine which one was more energy efficient and which one could provide better thermal comfort for building occupants in a given climate zone, using detailed simulation data. The detailed energy consumption data of these two systems were estimated using an engineering equation solver with each component model. The results showed that the liquid desiccant and dew-point evaporative-cooler-assisted 100% outdoor air system (LDEOAS) resulted in approximately 34% more annual primary energy consumption than that of the liquid desiccant and the indirect and direct evaporative-cooler-assisted 100% outdoor air system (LDIDECOAS). However, the LDEOAS could provide drier and cooler supply air, compared with the LDIDECOAS. In conclusion, LDIDECOAS has a higher energy saving potential than LDEOAS, with an acceptable level of thermal comfort.

1. Introduction

In recent years, liquid desiccant and evaporative cooling-assisted air conditioning systems, such as decoupled heating ventilation and air conditioning (HVAC) systems that are configured to be separately responsible for the latent load and sensible load of a served room, have shown energy-saving potential and has been attracting significant interest [1,2,3,4,5]. The liquid desiccant and indirect and direct evaporative cooling-assisted 100% outdoor air system (LDIDECOAS) proposed by Kim et al. has shown desirable energy-saving and indoor environmental quality enhancement potential, compared to the conventional variable air volume (VAV) systems [1]. The LDIDECOAS is a VAV system that controls the air flow volume based on the variable thermal load in the served room, to maintain a constant supply air (SA) dry-bulb temperature (DBT). The liquid desiccant (LD) system dehumidifies the SA to account for the latent load of the served room, and the evaporative cooler is responsible for the sensible load to maintain the target temperature of the served room. However, the regenerator of the LD system requires an amount of heat for desiccant regeneration. The heat pump (HP) has a benefit that it can provide solution heating and cooling at the same time through the condenser and evaporator parts, which allows a more compact system size. Moreover, existing studies show that HPs have been widely researched in terms of their high efficiency [6,7,8,9].
Recent work has shown that two different novel methods are generally used for evaporative cooling. One is the indirect–direct evaporative cooler (IDEC), which has two stages that can match the target SA conditions but increases the moisture of the air that has already been dehumidified. The other is the dew-point evaporative cooler (DP-IEC), which has a simpler package but causes more dehumidification energy consumption because the secondary channel (wet channel) uses at least 30% of the dehumidified process air [2]. Existing research shows that the IDEC has a better cooling performance and effectiveness as compared to mechanical vapor compression systems [10]. Kim et al. proposed the LDIDECOAS, which uses an IDEC downstream of the LD system, and can save 51% of the primary energy consumption compared to the VAV system during the cooling season [1]. Additionally, the single-stage dew-point evaporative cooler has increasingly been attracting interest. Zhao et al. used a dew-point evaporative cooling system to study building air conditioning; the results show that the dew-point system was suitable for most regions in the UK and was compatible with using water in the secondary channel [11]. A portion of the product air was suggested to be sent to the secondary channel (wet channel) for evaporation [12]. Lee et al. reported that for the cooling performance, the mass flow rate of the product air sent to the secondary channel should be at least 30% of the supply air [2]. Kozubal contended that using an LD system upstream of the evaporative cooler to first dehumidify the process air could enhance the cooling performance and combine the benefits of LD and evaporative cooling technologies into a novel cooling core [13]. In addition, Zhao et al. reported that a dew-point evaporative cooler showed better cooling performance in a dry climate compared to a humid climate [11]. Ham et al. reported a system with a dew-point evaporative cooler installed after the LD system and a membrane enthalpy exchanger (MEE) upstream of the LD system, called LDEOS, could save 12% of the primary energy consumption, compared to VAV systems [14]. Kim et al. compared the cooling capacity, thermal coefficient of performance (COP), primary COP, and the heating energy consumption for desiccant solution regeneration between the IDEC and the DP-IEC when both are installed in an LD and evaporative cooling-assisted air conditioning system [4]. The results showed that the DP-IEC might provide a higher cooling capacity compared with the IDEC, but the heating demand increased. Moreover, adding an MEE can improve the performance. According to a review of previous research, many studies have reported the possibility and the enhanced cooling performance of a dew-point evaporative cooler appliance in an HVAC system [2,5,14,15,16,17]. However, no study has compared the annual primary energy and SA performance obtained by the overall systems between the two different evaporative cooling-based LD and evaporative cooling-assisted air conditioning systems.
Consequently, no research has compared the two systems using different methods of evaporative cooling without the recirculation of the indoor air, like a VAV system, and instead using 100% fresh outdoor air. Here, the LDIDECOAS and LDEOAS were compared. In this study, we introduced the differences in the system compositions, operation modes, and target dehumidification values between these two systems, and the energy consumption and system performance were estimated via detail simulation data by an Engineering Equation Solver (EES), for each component model [18].

2. System Overview

2.1. LDIDECOAS

2.1.1. System Configuration

The LDIDECOAS uses 100% outdoor fresh air, and is a VAV system that adjusts the mass flow rate of the SA based on the required cooling load of the served room to maintain the thermal environment [19]. As shown in Figure 1, the LDIDECOAS consists of an LD system, an indirect evaporative cooler (IEC), a direct evaporative cooler (DEC), and a heating coil (HC) on the process air side. The operation of the system can be divided into two main parts—the dehumidification part and the evaporative cooling part. The LD system is a dehumidifier that consists of an absorber, a regenerator, a sensible heat exchanger and a heat pump (provide heating and cooling requirement of desiccant solution), as marked in the blue area in Figure 1. The LD system removes the excess moisture in the OA passing through the absorber by spraying a desiccant solution on the absorber [20,21]. The low-concentration desiccant solution from the absorber enters the regenerator and is regenerated into a high-concentration solution. The regeneration of an LD system requires a large amount of heat and is, therefore, usually provided by the use of a renewable heat source such as a solar heat or a district heating waste [22,23]. Moreover, in recent years, existing studies showed that the heat pump has been widely researched in terms of their high efficiency [8,24], as the heat pump has a benefit that could simultaneously provide heating and cooling by the condenser and evaporator parts. Thus, the LD system used in both systems is a heat pump-integrated liquid desiccant (HPLD) system, as shown in the upper part of the blue area in Figure 1. As seen in the green area in Figure 1, the evaporative part in the LDIDECOAS consists of an IEC and a DEC. Specifically, the dehumidification part is placed upstream of the evaporative cooling part to enhance the cooling capacity. The evaporative cooling technology minimizes cooling energy by using the latent heat of evaporation of water to cool the air supplied to the room [25]. Thus, this evaporative liquid desiccant system is known as a thermally driven cooling system [21,26]. During the cooling season, the process air first passes the LD system to achieve the design humidity ratio (HR), is then sensibly cooled by the IEC, and finally is adiabatically cooled by the DEC to meet the SA target temperature, as shown in Figure 2. Moreover, the lower wet-bulb temperature (WBT) of the outdoor air (OA) and return air (RA) is chosen to be sent to the secondary channel of the IEC. During the heating season, the IEC is employed to sensibly heat the process air as a sensible heat exchanger (SHE), by recycling the sensible heat from the RA. When the DBT of the process air that passed through the IEC does not achieve the neutral target temperature (i.e., 20 °C), the HC is employed to sensibly heat the process air to meet the SA target temperature. Moreover, as a parallel sensible heating system, a ceiling radiation heating panel is adopted. When the SA is insufficient to meet the sensible heat load of the served room, the parallel sensible heating system is enabled to maintain the thermal environment of the served room.

2.1.2. Annual Operational Strategies

According to the OA condition, the operation of the LDIDECOAS is divided into four modes on a psychometric chart based on previous research. As shown in Figure 3, the psychometric chart is divided into Regions A, B, C, and D by lines 1, 2, and 3. Lines 1 and 2 represent the design HR value line of the LD system and the enthalpy line at the SA set point to operate the LD system, respectively. Line 3 stands for the target DBT line of the SA.
When both the HR and the enthalpy value of the OA are higher than lines 1 and 2, respectively, the OA condition is in Region A. The hot and humid OA needs to be initially dehumidified by the LD system, then cooled by the IEC until the process air condition meets line 2, and is then isentropically cooled by the DEC to meet the target SA temperature. When the OA condition is between lines 1 and 2 (Region B), the HR value of the OA condition is dry enough to induce bypassing the LD system, and the LD system is deactivated. The process air is cooled by the IEC and the DEC to satisfy the set point SA values. When the OA conditions are at Region C, it indicates that the enthalpy of the OA is lower than line 2. The LD system and the IEC is not activated, the OA is only adiabatically cooled using the DEC to meet the target SA temperature (i.e., 15 °C, cooling season) and the WBT of the SA may be slightly lower than the target value. When the DBT of the OA is lower than the SA target temperature, the IEC is used as a SHE to reclaim the sensible heat from the RA stream. The HC that is placed downstream of the IEC is enabled when the process air passing through the IEC (SHE) is insufficient to meet the SA set point. The LD and the DEC are not employed.

2.2. LDEOAS

2.2.1. System Configuration

The LDEOAS is also a VAV system and uses 100% outdoor air. The LDEOAS is constructed as shown in Figure 4, and consists of an MEE, an LD system, a DP-IEC, and an HC on the process air side. A MEE is an enthalpy heat exchanger that could pre-condition the OA by recovering the exhaust heat from the EA. The MEE is placed upstream of the LD system to pre-cool and pre-dehumidify the OA before the OA enters the LD system, to reduce the cooling and the dehumidification loads of the LD system. In the LDEOAS, a DP-IEC is used instead of a combination of the IEC and the DEC as an evaporative cooler. The DP-IEC is a special indirect evaporative cooler that uses a portion of the cooled process air, which leaves the dry channel (primary channel) as the inlet air of the wet channel (secondary channel), and the temperature of process air is decreased below the wet-bulb temperature of the inlet air of the wet channel [12,15]. It is recommended that the mass flow rate used for the secondary channel in the DP-IEC should be at least 30% of the SA, based on results from the literature [2]. Thus, in this study, the mass flow rate of the secondary channel air is assumed to be 30% of the SA stream. During the cooling season, the process air is heat-exchanged with the RA at the MEE and it passes over with a lower temperature and HR. After dehumidification by the LD system, the drier air is sensibly cooled by the DP-IEC and supplied to the served room, as shown in Figure 5. During the heating season, the process air is only heated and humidified by the MEE, as reclaimed from the RA stream. Similar to the LDIDECOAS, if the SA stream is insufficient to maintain the thermal environment of the served room, a ceiling radiation heating panel is adopted as a parallel sensible heating system.

2.2.2. Annual Operational Strategies

The operation of the LDEOAS is divided into four modes according to the OA conditions on the psychometric chart shown in Figure 6. The psychometric chart is divided by lines A, B, and C into Regions 1, 2, 3, and 4. Line A is the HR line of the RA (which is equal to the set value of the room HR). Line B is the target HR line for the operation of the LD system. Line C is the DBT line of the SA set temperature.
If the HR of the OA condition is higher than the RA (Region 1), the entering OA is initially thermally heat-exchanged with the RA. If the HR of the process air passing through the MEE is higher than line 2, the LD system is enabled to dehumidify the process air. Otherwise, the LD system is bypassed. The dry air is sent to the served room after being cooled by the DP-IEC. If the HR value of the OA is between lines A and B (Region 2), the OA conditions are at Region B. The use of the MEE does not reduce the HR of the OA, and is not employed. The entering OA is initially dehumidified by the LD system and sensibly cooled by the DP-IEC. If the OA HR is lower than line B (Region 3), the entering OA is dry enough to be sent straight to the DP-IEC to reach the set SA temperature. The MEE and the LD system are bypassed. If the DBT of the OA is lower than line C (Region 4), the OA is initially thermally exchanged with the RA on the MEE. If the temperature of the passed stream does not satisfy the set point (i.e., 20 °C, heating season), the HC is activated to heat the process air until the target value is achieved. Meanwhile, moisture is added to the process air owing to the latent heat exchanged at the MEE. Thus, the processed air can be humidified to a certain extent during the heating season.

2.3. Heat Pump-Driven Liquid Desiccant Unit

The LD system consists of an absorber, a regenerator, and a SHE. The solution dehumidifies the process air after it is cooled by the cooling coil (CC) in the absorber and becomes a weak-concentration solution. In the regenerator, the weak solution is heated by the HC and thus is regenerated to the strong solution by the OA. Between these stages, the weak solution passes over the absorber and sensible heat is exchanged with the strong solution that passes through the regenerator at the SHE. Existing research shows that large amounts of heat are required for the solution cooling and regeneration in the LD system. It generally uses a low-quality heat source or waste heat of district heating to supply this part of the heat in the regenerator, and is cooled by the water-side free cooling on the absorber, according to previous research [23,27,28].
The LD system used in this study has an integrated HP as the heat source, according to the feasibility demonstrated by existing research [6,7,8,9]. The HP has both a condenser and an evaporator, which can simultaneously satisfy the heating and cooling demand of the LD solution. Thus, the CC and the HC of the solution in the LD system are connected to the evaporator side and the condenser side of the HP, respectively, which simplify the operation and the package. Furthermore, the heat pump-integrated liquid desiccant system (HPLD) shows an energy saving potential, compared to the use of a low-quality heat source (e.g., solar energy) and a water-side cooling tower [6,22,28,29]. Moreover, the LD system used a 40% lithium chloride (LiCl) solution as a working desiccant solution. The HP used R-134A as the refrigerant.

3. Energy Simulation

This study assesses the differences in the performance and the energy consumption between two evaporative cooling-based LD and evaporative cooling-assisted air conditioning systems via a series of detailed energy simulations.

3.1. Building Model

An office building with a typical floor area of 300 m2 located in Seoul, Republic of Korea was assumed to be the model building. The weather data and the hourly thermal loads for the model building were estimated by the TRNSYS 18 software package. Fifteen occupants were assumed, each of whom had a computer and performed light work. The schedules of the occupants and HVAC system were applied, based on the ASHRAE Standard 90.1 [30]. The served room conditions were designed to be maintained at a DBT of 24 °C with 55% RH during the cooling season, and a DBT of 20 °C, during the heating season [31]. The internal heat gains from the sensible and the latent heat of people, electronics, and lighting were assumed through existing data from TRNSYS 18. The U-values of each component of the building model and the window-to-wall ratio were designed on the basis of the guidelines for the energy-saving design of buildings in the Republic of Korea [32]. The detailed physical information of the model building is summarized in Table 1.

3.2. System Models

3.2.1. Liquid Desiccant System Model

The DBT and the HR of the process air leaving the LD system were calculated by Equations (1) and (2). The DBT ( D B T L D , o u t ) of the leaving air can be estimated by the known incoming air temperature ( D B T L D , i n ), inlet desiccant solution temperature ( D B T s o l , i n ), and the effectiveness of the temperature change between the incoming air and the inlet desiccant solution ( ε L D , T ). The HR of the leaving air can be determined by the dehumidification effectiveness of the LD system ( ε L D , ω ), the HR of the incoming air ( ω L D , i n ), and the equilibrium HR ( ω e q , i n ), as shown in Equation (2).
ε L D , T = D B T L D , i n D B T L D , o u t D B T L D , i n D B T s o l , i n
ε L D , ω = ω L D , i n ω L D , o u t ω L D , i n ω e q , i n
The dehumidification effectiveness of the LD system uses the model proposed by Chuang and Luo [33], as shown in Equation (3). It was assumed that the temperature and humidity change ratios ( ε L D , T ,   ε L D , ω ) were consistent [23,28]. The effectiveness values of the absorber and regenerator were assumed to be same. The mass flow rates of the liquid ( m ˙ s o l , i n ) and gas ( m ˙ L D , i n ) were assumed to be 1 in both systems. The inlet desiccant solutions of the absorber and the regenerator were set to 20 and 55 °C, respectively.
ε L D = ( 1 0.024 ( m ˙ a , i n m ˙ s o l , i n ) 0.6 e x p ( 1.057 D B T O A T s o l , i n ) ( a Z ) 0.185 π 0.638 ) ( 1 0.192 e x p ( 0.615 D B T O A T s o l , i n ) π 21.498 )
The equilibrium HR could be determined by Equation (4). The saturated vapor pressure of the desiccant solution ( p s ) obtained using the equation suggested by Fumo and Goswami was adapted, as shown in Equation (5) [34]. The coefficients of the vapor pressure equation are shown in Table 2.
ω e q , i n = 0.622 p s 101.325 p s
P s = ( a 0 + a 1 T s o l , i n + a 2 T s o l , i n 2 ) + ( b 0 + b 1 T s o l , i n + b 2 T s o l , i n 2 ) C s o l , i n + ( c 0 + c 1 T s o l , i n + c 2 T s o l , i n 2 ) C s o l , i n 2
The heat demand for solution cooling ( Q c o o l i n g ) and heating ( Q h e a t i n g ) could be estimated using the values of the mass flow rate of the desiccant solution ( m ˙ s o l ), the specific heat capacity ( C p s o l ), and the solution temperature difference between the inlet and outlet side of the HC and the CC in the LD system, as shown in Equations (6) and (7).
Q c o o l i n g = m ˙ s o l C p s o l ( T C C , i n T C C , o u t )
Q h e a t i n g = m ˙ s o l C p s o l ( T H C , o u t T H C , i n )

3.2.2. Membrane Enthalpy Exchanger Model

In this study, an MEE was added upstream of the LD system in the LDEOAS to use the EA to pre-condition the OA. Owing to the difference between the inlet mass flow rate of the OA side and the RA side, the sensible and latent heat exchanger effectiveness ( ε s e n ,   ε l a t ) of the MEE were defined by Equations (8) and (9) [35].
ε M E E , s e n = m ˙ O A     C p     ( D B T O A D B T M E E , o u t ) m ˙ E A     C p     ( D B T O A D B T E A )
ε M E E , l a t = m ˙ O A     h f g     ( ω O A ω M E E , o u t ) m ˙ E A     h f g     ( ω O A ω E A )

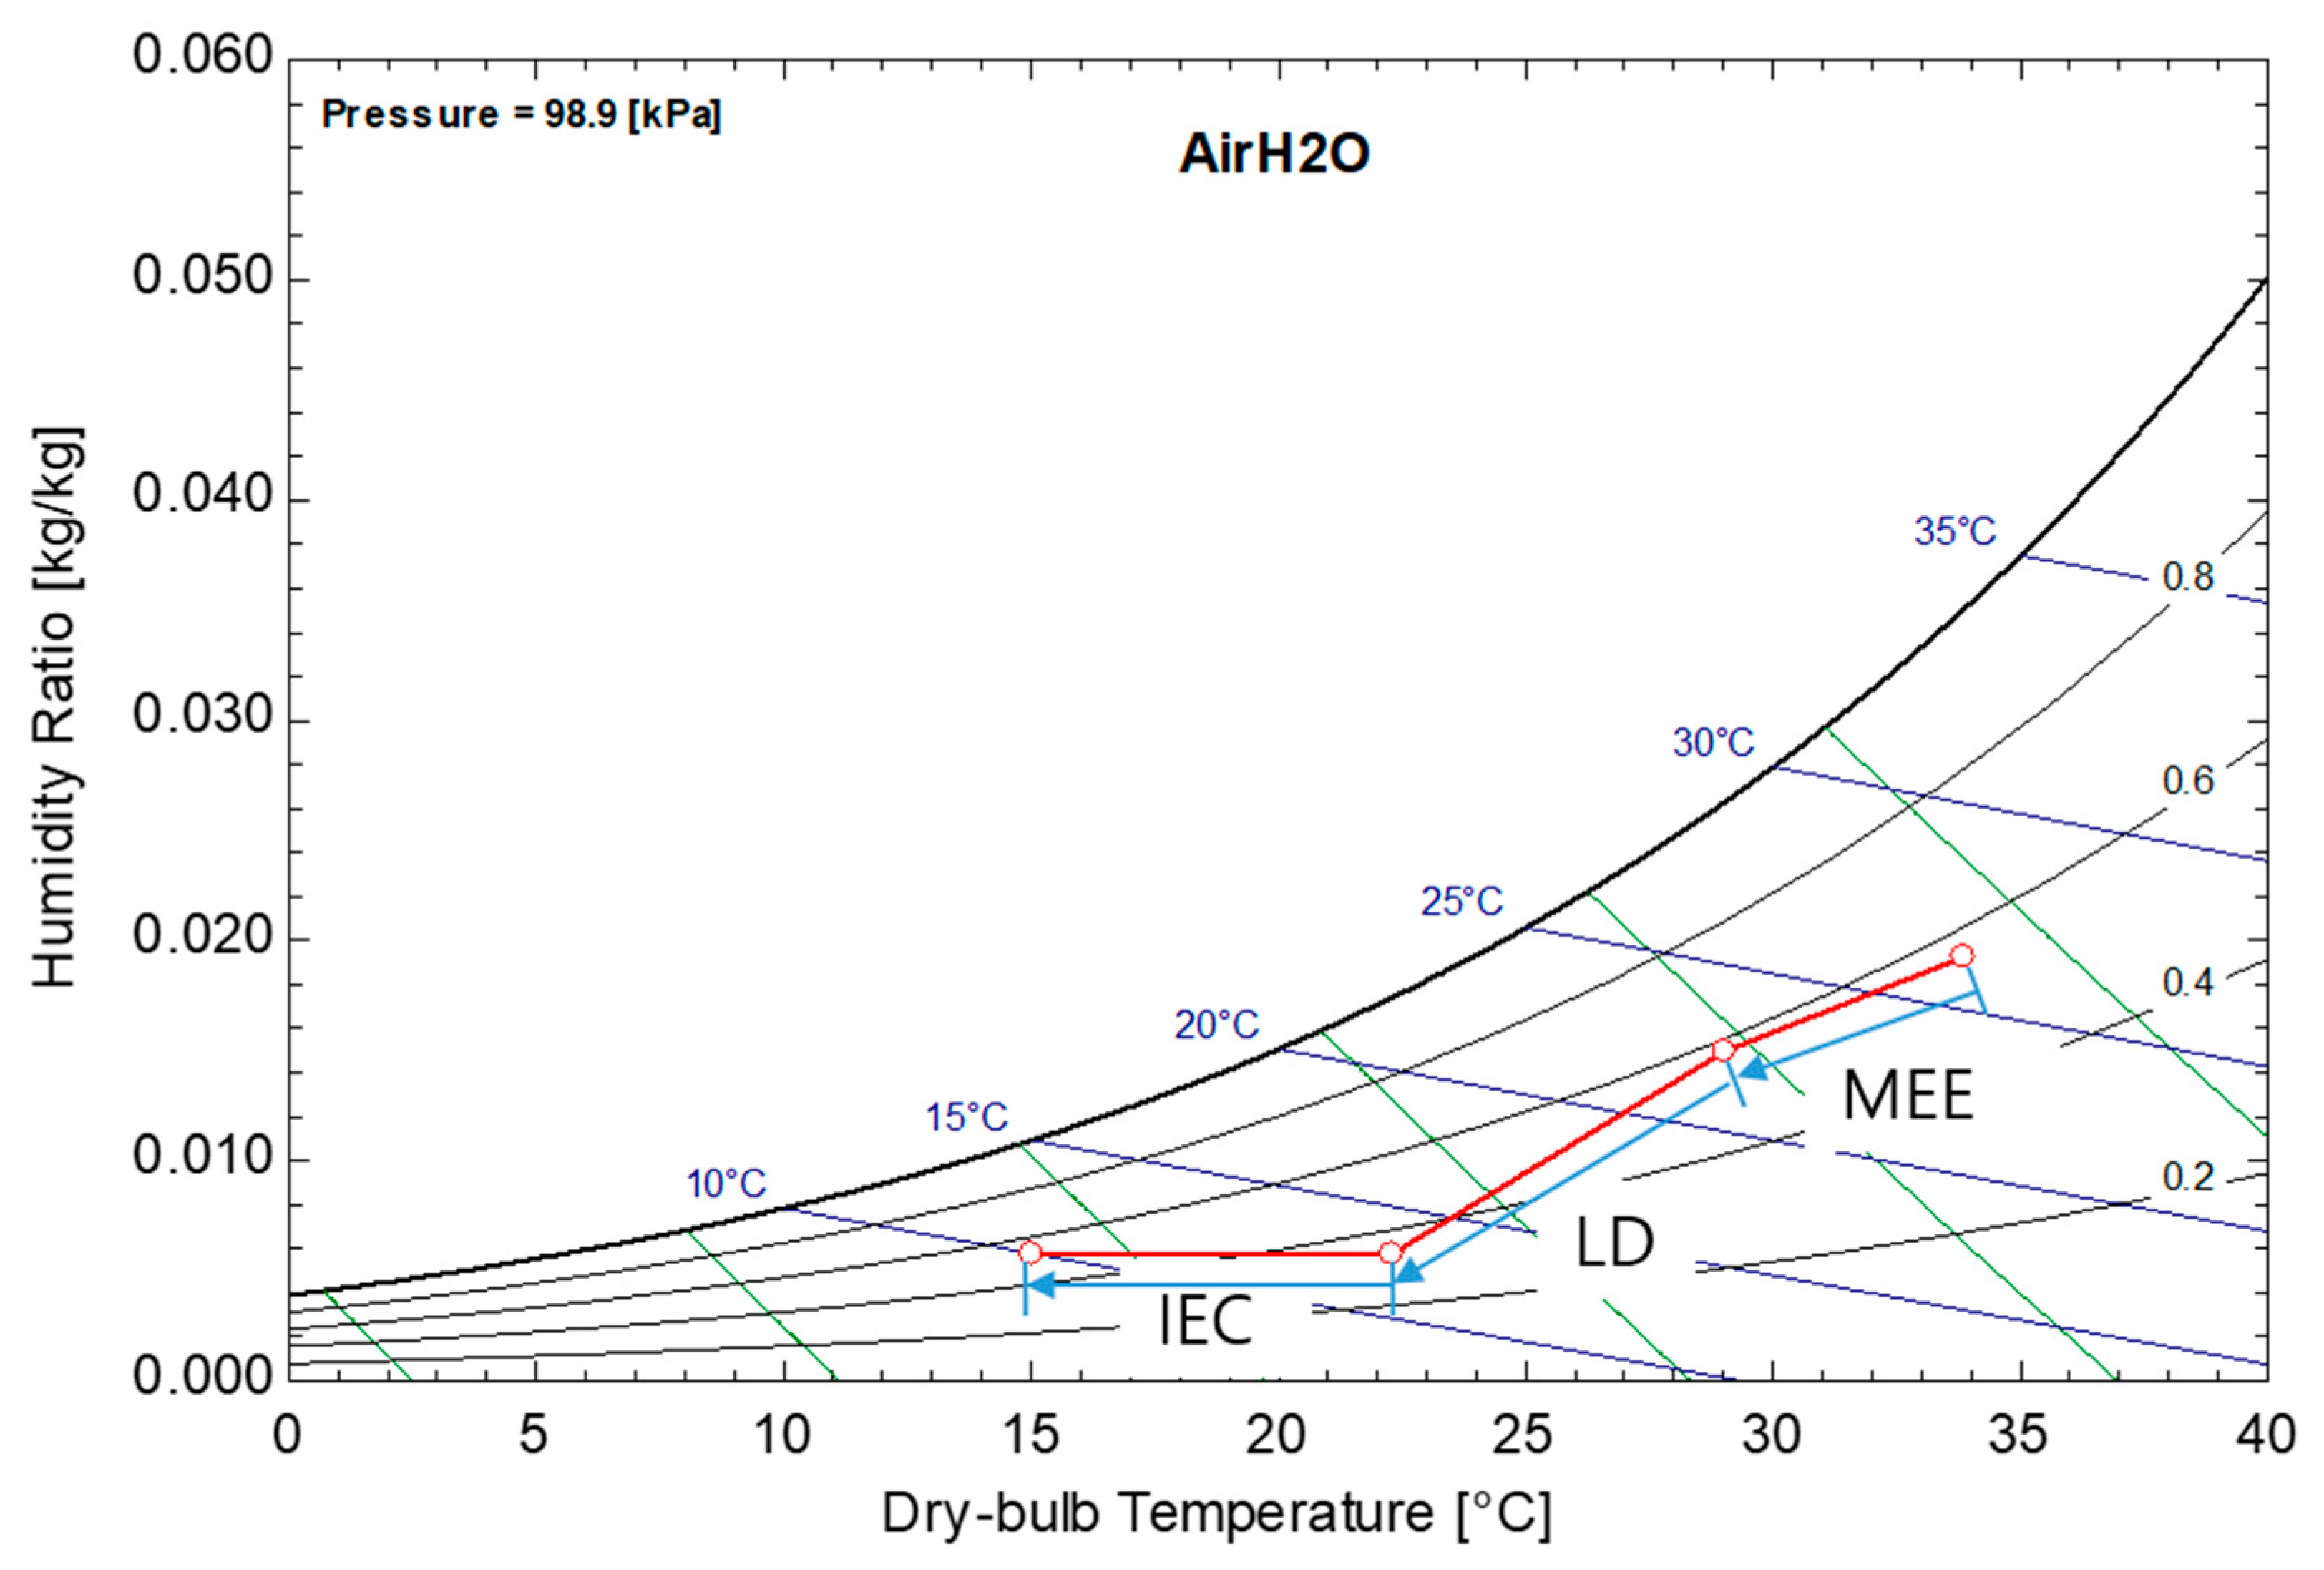
3.2.3. Evaporative Cooler Models (DP-IEC Model and the IEC and DEC Unit Models)

The effectiveness values of the IEC in the LDIDECOAS ( ε I E C ) was assumed to 70% [36,37], and in the LDEOAS ( ε D P I E C ) it was assumed to 100%, according to existing research [38]. The DBT of the process air leaving the IEC ( D B T I E C , p r i , o u t ) depends on the WBT of the secondary channel air ( W B T I E C , s e c , i n ), the DBT of the primary channel air ( D B T L D , o u t ), and the effectiveness of the IECs, ( ε D P I E C ,   ε I E C ) as shown in Equation (10).
ε I E C = D B T L D , o u t D B T I E C , p r i , o u t D B T L D , o u t W B T I E C , s e c , i n
In the DP-IEC, because the inlet air of the secondary channel is a portion of the process air leaving the DP-IEC, the inlet temperature of the secondary channel air ( D B T s e c , i n ) is not known. The air temperature of the inlet secondary channel side ( D B T s e c , i n ) is assumed to be the WBT of the inlet primary channel side ( W B T L D , o u t ). In the IEC using the LDIDECOAS, the RA was used as the secondary channel air. Thus, the WBT of the secondary channel air ( W B T I E C , s e c , i n ) was the WBT of the RA ( W B T R A ). Moreover, the process air conditions that passed through the DEC ( D B T D E C , o u t ) could be calculated by Equation (11), with effectiveness being given as 90%. The assumed effectiveness of the IEC and the DEC was based on the manufacture cut-sheets [36,37].
ε D E C = D B T I E C , p r i , o u t D B T D E C , o u t D B T I E C , p r i , o u t W B T R A

3.2.4. Heat Pump Model

This study used a variable-speed compressor-controlled HP in cooling mode. The assumed HP was used as a solution–solution (water to water) HP [6,39]. The cooling capacity of the HP could be calculated using Equation (12), proposed by Energy Plus [35]. This model consists of a load side (i.e., evaporator), a source side (i.e., condenser), and an input power side (i.e., compressor). The load side capacity ( Q l o a d , c ) was the cooling capacity and the source side capacity ( Q s o u r c e , c ) was the heating capacity of the HP. As shown in Equation (12), the cooling capacity could be represented as four operation parameters—the volumetric flow rates of the load side flow ( V ˙ l o a d ) and source side flow ( V ˙ s o u r c e ), and the inlet temperatures of the load side fluid ( T l o a d , i n ) and source side fluid ( T s o u r c e , i n ). The coefficients and the reference values in Equation (12) are shown in Table 3 [40].
Q l o a d , c Q l o a d , c , r e f = A 1 + A 2 · [ T l o a d , i n T r e f ] + A 3 · [ T s o u r c e , i n T r e f ] + A 4 · [ V ˙ l o a d V ˙ l o a d , r e f ] + A 5 · [ V ˙ s o u r c e V ˙ s o u r c e , r e f ]
As a cooling mode, variable-speed, compressor-controlled HP, the cooling capacity was modulated to match the solution cooling demand. Thus, the heating capacity and power were adjusted. Madani et al. supposed using a part-load ratio as a function to modulate the compressor frequency ( F r e q P L R C ) and power ( P o w e r P L R C ), as shown in Equations (13)–(15) [24]. Equation (16) represents the inverter-controlled heating capacity of the HP.
P L R c = Q c o o l i n g Q l o a d , c
F r e q P L R c = 1.28329127 e x p 2 + 4.55418482 e x p 1 P L R c + 5.40172160 e x p 1 P L R c 2
P o w e r P L R c = 4.74753792 F r e q P L R c e x p 2 + 6.20369156 F r e q P L R c P L R c e x p 1 + 3.35400111 e x p 1 F r e q P L R c 2
Q s o u r c e , P L R c = Q c o o l i n g + P o w e r P L R c

3.3. Target Air Conditions

In this study, all systems were operated according to a seasonal operation schedule. During the summer, the indoor air temperature was set to achieve a 15 °C DBT and 55% RH. During the winter, it was assumed to send air with a DBT of 20 °C to the served room. During the intermediate season, the target SA conditions depended on the sensible load demand of the served room.
The indoor air mass flow rate was estimated by Equation (17), which was modulated with the sensible load demand ( Q s e n ) of the served room. When the calculated mass flow rate ( m ˙ S A ) was lower than the minimum ventilation set value, according to the ASHRAE Standard 62.1 [41], the minimum ventilation value would replace the calculated value as the operative mass flow rate of the indoor air ( m ˙ S A ).
Q s e n = m ˙ S A c p ( D B T R A D B T S A )
On the basis of the known latent load demand ( Q l a t ) and the SA mass flow rate ( m ˙ S A ), the target HR of the SA ( ω S A ) could be estimated by Equation (18). In the LDEOAS, the LD system was operated to dehumidify the process air to achieve the value of ( ω S A ) calculated by using Equation (18). In the LDIDECOAS, the LD system dehumidified the process air to a target value ( ω t a r g e t ) so that it could reach the set value, after passing the DEC. As the moisture was increased after passing the DEC, the target value ( ω t a r g e t ) might have been smaller than the calculated value ( ω S A ).
Q l a t = h f g m ˙ S A ( ω R A ω S A )

3.4. Performance Index

It is common practice to use the cooling or heating capacity and the primary COP to evaluate the energy performance of the thermal system [26]. As can be seen in Equations (19) and (20), the cooling or heating capacity can be calculated from the mass flow rate of the supply air and the enthalpy difference between OA and SA. Based on the power consumption of each component and the cooling or heating capacity, the primary COP during cooling or heating season could be obtained by Equation (21). The local value of energy conversion factors for each source was used according to the regulations of the Korea Energy Agency: 1.1 and 2.75 for natural gas and electricity, respectively [42].
Q ˙ c = m ˙ S A ( h O A h S A )
Q ˙ h = m ˙ S A ( h S A h O A )
C O P = C o o l i n g   o r   h e a t i n g   c a p a c i t y T o t a l   p r i m a r y   e n e r g y   c o n s u m p t i o n

4. Simulation Results and Analysis

Through a commercial EES, the demand load, as well as the annual, seasonal, and monthly energy consumption of each system were simulated. The heat and power consumption of each component was converted to primary energy consumption, according to the Korean Energy Agency. The local energy conversion factors were 2.75 and 1.1 for power and fuel, respectively. The performance of each system was analyzed via the detailed primary energy consumption data.

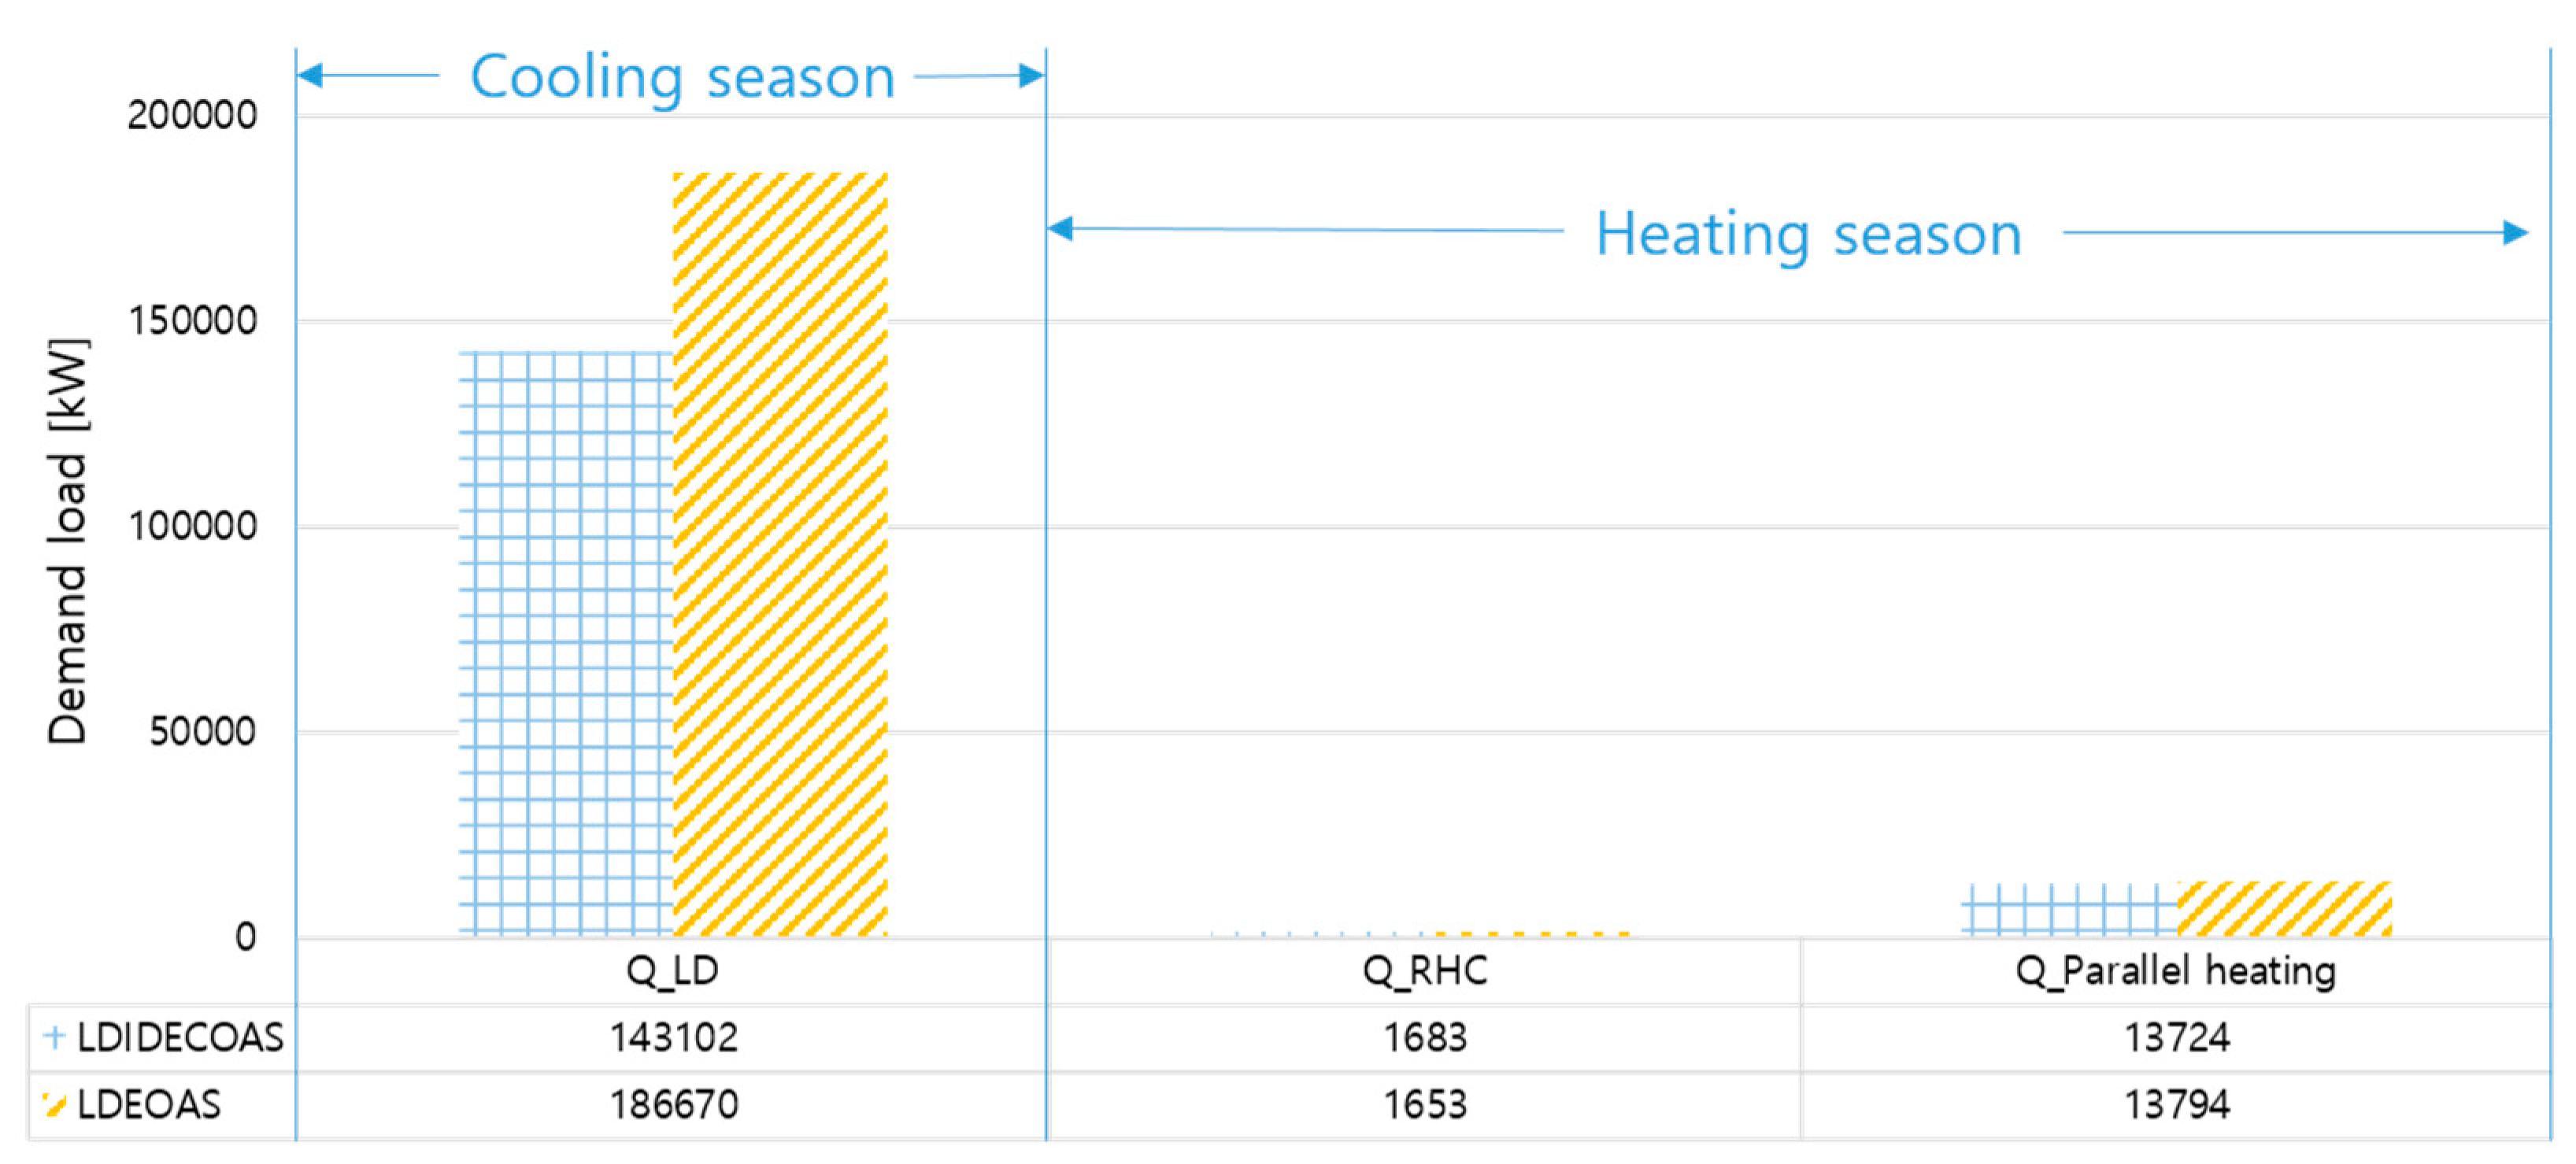
4.1. Comparison and Analysis of the Demand Load

The annual thermal load demand of each component in the LDEOAS and the LDIDECOAS is shown in Figure 7. The thermal load was composed of three parts—the LD side demand in the cooling season (Q_LD), reheating (Q_RHC), and parallel heating (Q_Parallel heating) during the heating season. As shown in Figure 7, the sensible load demand of the two systems during the heating season were almost the same. The LD systems used in the LDEOAS demanded more annual thermal load than that used in the LDIDECOAS. As a result, the thermal load demand of the LDEOAS was 27%, as compared to the LDIDECOAS.
The main factors affecting the demand load of the LD system between the two systems are the running time of the LD system and the heating requirements of the desiccant solution.
One of the primary factors affecting the LD operation time is the use of an MEE with the LDEOAS. The air passing through the MEE might reach the target HR, such that the LD system is not employed and the process air bypasses the LD system. The annual running time of the LD system is extracted from the simulation; shown in Table 4 and Figure 8 to demonstrate that using an MEE upstream of the LD system can decrease the load demand with the LDEOAS. The line in Figure 8 is the target HR of the LD system with the LDEOAS, and the points in Figure 8 are the air conditions after passing the MEE. Figure 8 shows that a portion of the air that passed through the MEE does not require dehumidification by the LD system, which means that the LD system is bypassed. Furthermore, Table 4 shows the operation time for the MEE and the LD system when the MEE is operating. Table 4 also shows that approximately 230 h can be saved by the MEE with the LDEOAS. The second factor is the difference in the target HR value of the LD systems between the two systems. As mentioned before, the LD systems need to dehumidify the process air to reach the set value after passing through the DEC with the LDIDECOAS, because the DEC increases the moisture of the process air. Thus, the target HR of the LDIDECOAS might be lower than the LDEOAS, and the operation time of the LD systems with the LDEOAS might be less than that of the LDEOAS. As a result, the annual operation time of the LD system with the LDEOAS was less than that of the LDIDECOAS, as shown in Table 5. In the table, the first value of the LD under the LDEOAS was the total operating time of the LD system with the LDEOAS, and the LD in brackets was the operation time of the LD system when the MEE was operating. The last “LD” was the operation time of the LD system with the LDIDECOAS.
The primary factors affecting the heating requirements of the desiccant solution are expressed in Equations (6) and (7)—the temperature difference between the inlet and outlet sides of the CC and the HC and the mass flow rate ( m ˙ s o l ). As shown in Table 6, the difference in the average values of the delta temperatures ( Δ T C C , s o l ¯ , Δ T H C , s o l ¯ ) between the LDEOAS and the LDIDECOAS was not significant. The mass flow rate of the desiccant solution with the LDEOAS was approximately 30% higher than that in the LDIDECOAS. The reason for this was that the LDEOAS, using a DP-IEC increased the air supply by 30% as compared to the LDIDECOAS, and the liquid-to-gas ratio of the LD system was set to 1, simultaneously.
Therefore, the operating time of the LD system with the LDEOAS was less than that of the LDIDECOAS; however, the demand load of the LD system was higher, as compared to the LDIDECOAS. Consequently, the primary factor affecting the system demand load was the desiccant solution part (the LD system), and the main factor affecting the demand load of the LD system was the difference in the mass flow rate of the desiccant solution between the LDEOAS and the LDIDECOAS.

4.2. Comparison of Energy Consumption

4.2.1. Comparison of Annual Energy Consumption

Figure 9 shows the comparison of the annual energy consumption of the LDEOAS and the LDIDECOAS. As shown in Figure 9, the primary energy consumption for heating, fans, and pumps shows no significant differences. The energy consumption of the fan produced by the DP-IEC was not noticeable. The difference in energy consumption between the LDEOAS and the LDIDECOAS was reflected in the HP part. As the HP provides the heating demand of the desiccant solution, the demand loads of the two systems were different, as observed in the simulation results provided in Section 4.1. Consequently, the primary energy consumption of the LDEOAS was approximately 34% higher than that of the LDIDECOAS.

4.2.2. Comparison of Seasonal Energy Consumption

The seasonal energy consumption of the two systems is shown in Figure 10. As can be seen, the difference in the primary energy consumption occurred mainly in summer and the intermediate season, and the primary energy consumption was almost the same during winter. Table 7 shows the operation time of the MEE and the LD systems, during summer and the intermediate season. According to the data from Table 7, during summer, using an MEE did not have a noticeable effect on the operation time of the LD system, and the running time of the LD system with the LDEOAS was fewer by 120 h, when compared to the LDIDECOAS during the intermediate season; a significant reduction in the operation time with the LD system was shown, using the MEE. Thus, using an MEE could reduce the operation time of the LD system during the intermediate season, which had comfortable OA conditions that were not too humid or hot. Furthermore, the total operation time of the LD systems was a 100 h difference in both seasons, whereas the difference in primary energy consumption was more significant.
Consequently, using an MEE might reduce the operation time of the LD system with the LDEOAS. However, the total energy consumption was still higher as compared to the LDIDECOAS, when the OA conditions were similar to the intermediate season in Seoul. Moreover, the longer the LD system runs, the more significant is the difference in energy consumption between the LDEOAS and the LDIDECOAS.

4.2.3. Comparison of Monthly Energy Consumption

To explore the difference between the energy consumption of the LDEOAS and the LDIDECOAS in more detail, the monthly energy consumption and the operation time of the two systems were extracted for comparison, as shown in Figure 11 and Table 8. It can be seen in Figure 11 that during months 1, 2, 3, 5, 10, 11, and 12, the primary energy consumption of both systems was almost the same, and at other times, the primary energy consumption of the LDEOAS was higher than that of the LDIDECOAS.
During the heating season (i.e., January, February, March, and December) and November, the LD system was inactivated. Thus, the primary energy consumption of the two systems was not affected by the LD system and was almost the same. In April, the operating time of the LD systems was similar, and short, in both systems. Thus, the energy consumption of the LDEOAS with a higher mass flow rate with the LD system was higher, compared to the LDIDECOAS. In May, September, and October, although the total operating time of the LD system in the LDEOAS was lower than that of the LDIDECOAS when the total running time of the LD system was substantial, the primary energy consumption of the LDEOAS was higher than that of the LDIDECOAS (i.e., in May and September), and when the total operation time was sufficiently short (i.e., October), the consumption of the LDEOAS was slightly lower than the LDIDECOAS. In June, July, and August, there was no significant difference in the total running time of the two LD systems; the difference in the energy consumption was mainly due to the difference in the mass flow rate of the desiccant solution between the two systems, and the longer the total running time, the higher the difference in energy consumption between the two systems.

4.3. Comparison of Supply Air Conditions

According to the results of the simulation, the average DBT and the average HR in summer, winter, and the intermediate season of the LDEOAS and the LDIDECOAS are organized in Table 9.
During summer, the LDEOAS had an MEE upstream of the LD system to pre-dehumidify the entering OA, followed by dehumidification by the LD system. Thus, the process air passing through the DP-IEC was dry enough to enhance the cooling performance of the DP-IEC. The LDIDECOAS used a combination of the IEC and the DEC to match the target temperature of the SA. As a result, as shown in Table 9, the average DBT was 12.9 °C for the LDEOAS and 15 °C for the LDIDECOAS. The average DBT of the SA with the LDEOAS was lower than that of the LDIDECOAS. As both systems use a heat exchanger to pre-heat the outdoor cold air, a reheating coil is downstream of the heat exchanger to heat the SA to a DBT of 20 °C. Therefore, the temperature of the SA for both systems is 20 °C.
In the summer, owing to using an MEE installed in the LDEOS to pre-dehumidify the humid OA, the LDEOAS has two dehumidification steps. Therefore, it can be seen in Table 9, that the average HR of the LDEOAS is 4.4 g/kg lower than that of the LDIDECOAS. In the winter, the LDEOAS used an MEE to recover waste heat from the exhaust air for the total heat exchange, which was mainly when the HR of the EA was higher than the OA, and the entering air could be humidified by the MEE. However, the LDIDECOAS used the IEC as a SHE to sensibly pre-heat the process air without changing the moisture content. As a result, as shown in Table 9, the average HR was 5.4 g/kg for the LDEOAS, which was higher than that of the LDIDECOAS, with a 2.6 g/kg average HR.

4.4. Comparison of COP

Figure 12 shows a monthly comparison relationship of the COPs between the LDEOAS and the LDIDECOAS. During January, February, March, November, and December, the LD system was not employed. Thus, the COP of the LDEOAS with an enthalpy exchanger was higher than that of the LDIDECOAS with only an SHE. In April, June, July, August, and September, the operation time of the LD systems of the two systems were almost the same, owing to the massive load demand in the LDEOAS; the LDIDECOAS showed an excellent COP value as compared to that of the LDEOAS. During May and October, owing to the use of the DP-IEC, the dry and cold SA could be obtained, and with a short operation time of the LD systems, the COPs of the LDEOAS were slightly higher than those of the LDIDECOAS.
In summary, the LDIDECOAS showed a better COP during the annual operation, compared to the LDEOAS, especially in a summer similar to Seoul, and the LDEOAS showed a better COP during the intermediate season without the entry of humid and hot air. Although the LDEOAS could provide drier and colder SA compared to the LDIDECOAS, the great demand for heat load in the summer caused a lower COP than that of the LDIDECOAS.

4.5. Discussion

As previously analyzed, the composition difference between the LDEOAS and the LDIDECOAS was that the LDIDECOAS uses the two-stage indirect and direct evaporative cooler, and the LDEOAS uses a single-stage dew-point evaporative cooler with an MEE upstream of the LD system. Thus, the LDEOAS with a dew-point evaporative cooler has a higher load required, especially in terms of heating demand in the solution regeneration (solution heating), as compared to the LDIDECOAS. Previous research has also showed that the heating energy demand in regeneration for desiccant solution in the LDEOAS was generally higher than that of the LDIDECOAS [4]. However, there has been no comparison of the annual energy consumption of the two systems. This meant that although many studies have indicated that a DP-IEC could give rise to a better COP than a combination of an IEC and a DEC, as the DP-IEC has a higher cooling capacity, etc., the difference in the annual energy consumption between these two systems with the two evaporative cooling methods was still unknown. Here, we found that the LDEOAS results in 34% higher annual energy consumption. Moreover, we found that the performance (cooling capacity and COP) of the DP-IEC was better than that of the combination of the IEC and the DEC, according to the simulation data. The LDEOAS could provide drier and colder SA. Nevertheless, this did not mean that the LDIDECOAS could not provide a comfortable air supply environment. According to previous research [3], the thermal environment conditioned by the LDIDECOAS was generally in compliance with the ASHRAE Standard 55 [43]. Additionally, because the DP-IEC triggers at least 30% more SA, the dehumidification upstream of the DP-IEC results in a significant effect. That is, even though the DP-IEC shows better performance, when equipped with an LD system for dehumidification, the overall energy consumption is not ideal in comparison to the LDIDECOAS, which used an IEC and a DEC. Additionally, this simulation assumed the building was located in Seoul, according to the monthly data analyzed in Section 4.2, Section 4.3 and Section 4.4. We contend that an LDEOAS using DP-IEC might show better energy consumption performance in a dry region than an LDIDECOAS using IEC and the DEC.
In summary, under identical operation conditions, the LDIDECOAS could provide a compliant thermal environment in Seoul, with lower annual energy consumption as compared to the LDEOAS.

5. Conclusions

In this study, it was found that the LDIDECOAS might provide a reduction of approximately 25% in the annual primary energy consumption as compared to the LDEOAS, in Seoul. The significant difference in the annual primary energy consumption of the two system occurred mainly in the LD part during the cooling season and the intermediate season. The main reason for this was that an LDEOAS that used a DP-IEC downstream of the LD system, required at least 30% of the process air that was already dehumidified by the LD system to be sent to the secondary channel. Moreover, the LDEOAS could provide drier SA conditions. Consequently, when the LD was used for dehumidification, the LDIDECOAS with an indirect and direct evaporative cooler was better in terms of energy consumption in a humid and hot climate, whereas in a dry region, the LDEOAS might be more suitable with a DP-IEC. Additionally, the dehumidification method upstream of the evaporative cooler might cause a significant impact on the energy consumption of the overall system.

Author Contributions

S.L. and J.-W.J. performed the simulation and data analysis, and wrote this paper based on the obtained results. All authors have read and agreed to the published version of the manuscript.

Funding

This research was funded by the National Research Foundation of Korea (NRF) grant (No. 2019R1A2C2002514) and the Korean Institute of Energy Technology Evaluation and Planning (KETEP) (No. 20184010201710).

Conflicts of Interest

The authors declare no conflict of interest.

Nomenclature

a Surface area-to-volume ratio of the packing (2/m3)
CSolution concentration (-)
C p Specific heat capacity ( kJ / kg K )
F r e q Compressor frequency
h fg Heat of water vaporization (=2257 kJ/kg)
m ˙ Mass flow rate (kg/s)
P L R c Function of the part-load ratio
p a Water-vapor partial pressure (Pa)
p s Vapor pressure of desiccant solution (kPa)
Q Load ( kW )
T Temperature (°C)
T s o l , in Inlet desiccant solution temperature (°C)
V ˙ Volumetric flow rate (m3/s)
WEffective mechanical power (W/m2)
ZPacking height (m)
Abbreviations
OAOutdoor air
CCCooling coil
COPCoefficient of performance
DBTDry-bulb temperature [°C]
DECDirect evaporative cooler
DP-IECDew-point evaporative cooler
EAExhausted air
EESEngineering equation solver
HCHeating coil
HPHeat pump
HPLDHeat pump-integrated liquid desiccant system
HRHumidity ratio
HVACHeating ventilation and air conditioning
IECIndirect evaporative cooler
LDLiquid desiccant
LDEOASLiquid desiccant and dew-point evaporative-cooler-assisted 100% outdoor air system
LDIDECOASLiquid desiccant and indirect and direct evaporative-cooler-assisted 100% outdoor air system
MEEMembrane enthalpy exchanger
RAReturn air
RHRelative humidity [%]
RHCReheat coil
SASupply air
SHESensible heat exchanger
VAVVariable air volume
WBTWet-bulb temperature [°C]
Greek Symbols
ε Effectiveness [-]
ω Humidity ratio [kg/ kga]
π Function of the vapor-pressure depression of the desiccant solution to the vapor pressure of pure water [ ( p a p s ) / p a ]
Subscripts
a Air
cCooling mode
eqEquilibrium
i n Inlet
latSpace latent
o u t Outlet
priPrimary side
refReference
sSaturated
s o l Desiccant solution
secSecondary side
senSpace sensible

References

  1. Kim, M.H.; Park, J.S.; Jeong, J.W. Energy saving potential of liquid desiccant in evaporative-cooling-assisted 100% outdoor air system. Energy 2013, 59, 726–736. [Google Scholar] [CrossRef]
  2. Lee, J.; Lee, D.Y. Experimental study of a counter flow regenerative evaporative cooler with finned channels. Int. J. Heat Mass Transf. 2013, 65, 173–179. [Google Scholar] [CrossRef]
  3. Cho, H.J.; Jeong, J.W. Evaluation of thermal comfort in an office building served by a liquid desiccant-assisted evaporative cooling air-conditioning system. Energy Build. 2018, 172, 361–370. [Google Scholar] [CrossRef]
  4. Kim, M.H.; Yoon, D.S.; Kim, H.J.; Jeong, J.W. Retrofit of a liquid desiccant and evaporative cooling-assisted 100% outdoor air system for enhancing energy saving potential. Appl. Therm. Eng. 2016, 96, 441–453. [Google Scholar] [CrossRef]
  5. Lin, J.; Huang, S.M.; Wang, R.; Chua, K.J. Thermodynamic analysis of a hybrid membrane liquid desiccant dehumidification and dew point evaporative cooling system. Energy Convers. Manag. 2018, 156, 440–458. [Google Scholar] [CrossRef]
  6. Shin, J.H.; Park, J.Y.; Jo, M.S.; Jeong, J.W. Impact of heat pump-driven liquid desiccant dehumidification on the energy performance of an evaporative cooling-assisted air conditioning system. Energies 2018, 11, 345. [Google Scholar] [CrossRef] [Green Version]
  7. Zhang, T.; Liu, X.; Jiang, Y. Performance optimization of heat pump driven liquid desiccant dehumidification systems. Energy Build. 2012, 52, 132–144. [Google Scholar] [CrossRef]
  8. Liu, J.; Zhang, T.; Liu, X. Model-based investigation of a heat pump driven, internally cooled liquid desiccant dehumidification system. Build. Environ. 2018, 143, 431–442. [Google Scholar] [CrossRef]
  9. Kim, M.H.; Park, J.Y.; Jeong, J.W. Energy saving potential of a thermoelectric heat pump-assisted liquid desiccant system in a dedicated outdoor air system. Energies 2017, 10, 1306. [Google Scholar] [CrossRef] [Green Version]
  10. Heidarinejad, G.; Bozorgmehr, M.; Delfani, S.; Esmaeelian, J. Experimental investigation of two-stage indirect/direct evaporative cooling system in various climatic conditions. Build. Environ. 2009, 44, 2073–2079. [Google Scholar] [CrossRef]
  11. Zhao, X.; Duan, Z.; Zhan, C.; Riffat, S.B. Dynamic performance of a novel dew point air conditioning for the UK buildings. Int. J. Low-Carbon Technol. 2009, 4, 27–35. [Google Scholar] [CrossRef]
  12. Glanville, P.; Kozlov, A.; Maisotsenko, V. Dew point evaporative cooling: Technology review and fundamentals. ASHRAE Trans. 2011, 117, 111–118. [Google Scholar]
  13. Kozubal, E.; Woods, J.; Burch, J.; Boranian, A.; Merrigan, T. Desiccant Enhanced Evaporative Air-Conditioning (DEVap): Evaluation of a New Concept in Ultra Efficient Air Conditioning. Contract 2011, 303, 275–3000. [Google Scholar]
  14. Ham, S.W.; Lee, S.J.; Jeong, J.W. Operating energy savings in a liquid desiccant and dew point evaporative cooling-assisted 100% outdoor air system. Energy Build. 2016, 116, 535–552. [Google Scholar] [CrossRef]
  15. Duan, Z. Investigation of a Novel Dew Point Indirect Evaporative Air Conditioning System for Buildings. Ph.D. Thesis, University of Nottingham, Nottingham, UK, 2011. [Google Scholar]
  16. Lin, J.; Bui, D.T.; Wang, R.; Chua, K.J. On the fundamental heat and mass transfer analysis of the counter-flow dew point evaporative cooler. Appl. Energy 2018, 217, 126–142. [Google Scholar] [CrossRef]
  17. Pakari, A.; Ghani, S. Regression models for performance prediction of counter flow dew point evaporative cooling systems. Energy Convers. Manag. 2019, 185, 562–573. [Google Scholar] [CrossRef]
  18. Klein, S.A. Engineering Equation Solver for Microsoft Windows Operating Systems. Available online: https://fchartsoftware.com/assets/downloads/ees_manual.pdf (accessed on 21 January 2020).
  19. Mitchell, J.W.; Braun, J.E. Principles of Heating, Ventilating, and Air Conditioning; Wiley: Hoboken, NJ, USA, 2012; ISBN 9780470624579. [Google Scholar]
  20. Lowenstein, A. Review of Liquid Desiccant Technology for HVAC Applications. HVAC&R Res. 2008, 14, 819–839. [Google Scholar]
  21. Sahlot, M.; Riffat, S.B. Desiccant cooling systems: A review. Int. J. Low-Carbon Technol. 2016, 11, 489–505. [Google Scholar] [CrossRef] [Green Version]
  22. Alizadeh, S. Performance of a solar liquid desiccant air conditioner—An experimental and theoretical approach. Sol. Energy 2008, 82, 563–572. [Google Scholar] [CrossRef]
  23. Katejanekarn, T.; Kumar, S. Performance of a solar-regenerated liquid desiccant ventilation pre-conditioning system. Energy Build. 2008, 40, 1252–1267. [Google Scholar] [CrossRef]
  24. Madani, H.; Claesson, J.; Ahmadi, N.; Lundqvist, P. Experimental Analysis of a Variable Capacity Heat Pump System Focusing on the Compressor and Inverter Loss Behavio. Available online: http://docs.lib.purdue.edu/iracc (accessed on 21 January 2020).
  25. Cuce, P.M.; Riffat, S. A state of the art review of evaporative cooling systems for building applications. Renew. Sustain. Energy Rev. 2016, 54, 1240–1249. [Google Scholar] [CrossRef]
  26. La, D.; Dai, Y.; Li, Y.; Ge, T.; Wang, R. Study on a novel thermally driven air conditioning system with desiccant dehumidification and regenerative evaporative cooling. Build. Environ. 2010, 45, 2473–2484. [Google Scholar] [CrossRef]
  27. Gommed, K.; Grossman, G. Experimental investigation of a liquid desiccant system for solar cooling and dehumidification. Sol. Energy 2007, 81, 131–138. [Google Scholar] [CrossRef]
  28. Katejanekarn, T.; Chirarattananon, S.; Kumar, S. An experimental study of a solar-regenerated liquid desiccant ventilation pre-conditioning system. Sol. Energy 2009, 83, 920–933. [Google Scholar] [CrossRef]
  29. Bergero, S.; Chiari, A. Performance analysis of a liquid desiccant and membrane contactor hybrid air-conditioning system. Energy Build. 2010, 42, 1976–1986. [Google Scholar] [CrossRef]
  30. ASHRAE. ASHRAE Standard 90.1-2019: Energy Standard for Buildings Except Low-Rise Residential Buildings; American Society of Heating, Refrigerating and Air Conditioning Engineers: Atlanta, GA, USA, 2019; ISSN 1041-2336. [Google Scholar]
  31. ASHRAE. International Weather Files For Energy Calculations 2.0 (IWEC2); American Society of Heating, Refrigerating and Air Conditioning Engineers: Atlanta, GA, USA, 2010; ISBN 9781936504206. [Google Scholar]
  32. MOLIT. Guideline for Energy Saving Design of Buildings; Ministry of Land, Infrastructure and Transport of Korea: Sejong Special Governing City, Korea, 2017; Available online: http://www.law.go.kr.
  33. Chung, T.W.; Luo, C.M. Vapor pressures of the aqueous desiccants. J. Chem. Eng. Data 1999, 44, 1024–1027. [Google Scholar] [CrossRef]
  34. Goswami, D.Y.; Fumo, N. Study of an aqueous lithium chloride desiccant system: Air dehumidification and desiccant regeneration. Sol. Energy 2002, 72, 351–361. [Google Scholar]
  35. DOE, EnergyPlus Engineering Reference: The Reference to EnergyPlus Calculations. U.S. Dep. Energy 2010, 1–847.
  36. Munters, Product Sheet: Celdek. Available online: http://munters.com/globalassets/inriver/resources/celdek-gg.pdf (accessed on 21 January 2020).
  37. Menerga, Products and Solutions: Frecolair. Available online: http://menerga.com/products-solutions/frecolair/ (accessed on 21 January 2020).
  38. Riangvilaikul, B.; Kumar, S. An experimental study of a novel dew point evaporative cooling system. Energy Build. 2010, 42, 637–644. [Google Scholar] [CrossRef]
  39. Jin, H. Parameter Estimation Based Models of Water Source Heat Pumps; Oklahoma State University: Stillwater, OK, USA, 2002; Volume 6. [Google Scholar]
  40. Jin, H.; Spitler, J.D. A parameter estimation based model of water-to-water heat pumps for use in energy calculation programs. ASHRAE Trans. 2002, 108 Pt 1, 3–17. [Google Scholar]
  41. Stanke, D.A.; Danks, R.A.; Muller, C.O.; Hedrick, R.L.; Fisher, F.J.; Osborn, J.E.; Butler, D.S.; Gallo, F.M.; Rasmussen, R.D.; Alevantis, L.E.; et al. Ventilation for acceptable indoor air quality. ASHRAE Stand. 2010, 2007, 1–70. [Google Scholar]
  42. KEA. Building Energy Efficiency Rating Certification System Operating Regulations; Korea Energy Agency; Available online: http://building.energy.or.kr (accessed on 21 January 2020).
  43. ASHARE. ASHRAE Standard 55-2010: Thermal Environmental Conditions for Human Occupancy; American Society of Heating, Refrigerating and Air Conditioning Engineers: Atlanta, GA, USA, 2010; ISSN 1041-2336. [Google Scholar]
Figure 1. Liquid desiccant and the indirect and direct evaporative-cooler-assisted 100% outdoor air system (LDIDECOAS).
Energies 13 00522 g001
Figure 2. Conditions of the process air with the LDIDECOAS.
Energies 13 00522 g002
Figure 3. Operation modes of the LDIDECOA on psychometric chart.
Energies 13 00522 g003
Figure 4. Liquid desiccant and dew-point evaporative-cooler-assisted 100% outdoor air system (LDEOAS).
Energies 13 00522 g004
Figure 5. Conditions of the process air with the LDEOAS.
Energies 13 00522 g005
Figure 6. Operation modes of the LDEOAS on a psychometric chart.
Energies 13 00522 g006
Figure 7. Annual thermal load demand of each component.
Energies 13 00522 g007
Figure 8. Air condition after passing through the MEE in the LDEOAS.
Energies 13 00522 g008
Figure 9. Comparison of annual energy consumption.
Energies 13 00522 g009
Figure 10. Comparison of seasonal energy consumption.
Energies 13 00522 g010
Figure 11. Comparison of monthly energy consumption.
Energies 13 00522 g011
Figure 12. Comparison of monthly coefficient of performance (COP).
Energies 13 00522 g012
Table 1. Information of the model buildings studied herein.
Building300 m3 (10 × 10 × 3)
LocationSeoul, Korea
Occupancy density5 people/100 m2 (ASHRAE Standard 62.1)
Occupancy/HVAC schedulesASHRAE Standard 90.1 (ASHRAE Standard 90.1)
Target room conditionCooling season24 °C, 55%
Heating season20 °C
Target supply air conditionCooling season15 °C
Heating season20 °C
Internal heat gainPeopleSensible75 W/person
Latent45 W/person
ElectronicsPC: 140 W/person (Sensible)
Lighting13 W/m2
U-valuesExterior wall0.259 W/m2 K
Roof0.149 W/m2 K
Window1.46 W/m2 K
Floor0.289 W/m2 K
Window-to-wall ratio17%
Table 2. Coefficients of vapor pressure equation.
a 0 4.582 b 0 −18.382 c 0 21.312
a 1 −0.159 b 1 0.567 c 1 −0.666
a 2 0.007 b 2 −0.019 c 2 0.013
Table 3. Coefficients and reference values.
Reference Values
V ˙ l o a d , r e f (m3/s) V ˙ s o u r c e , r e f (m3/s) Q l o a d , c , r e f (nominal capacity) (W) T r e f (K)
5.678 × 10−45.678 × 10−414,215.35283.00
Model Coefficients
A1A2A3A4A5
−2.8581 × 1004.3425 × 100−9.6592 × 10−11.0978 × 10−14.6779 × 10⁻²
Table 4. Operation time for the membrane enthalpy exchanger (MEE) and the liquid desiccant (LD) system when the MEE is operating.
SystemsMEE (h)LD (h)
LDEOAS17701538
LD-IDECOAS-1959
Table 5. Operating time of each component.
LDEOASLDIDECOAS
MEE (h)LD (h)LD (h)
17701727 (˟1538)1959
˟ The operation time of the LD system when the MEE is operating.
Table 6. Values of the desiccant solution in the LD system.
ParametersLDIDECOASLDEOASUnit
Δ T C C , s o l ¯ 11.9511.76°C
Δ T H C , s o l ¯ 11.9911.79°C
m ˙ s o l 1.611.12g/Kg
Table 7. Operating time of each component during the two seasons.
SeasonsLDEOASLD-IDECOAS
MEE (h)LD (h)LD (h)
Summer12951335 (˟1290)1463
Intermediate season475392 (˟248)496
˟ The operation time of the LD system when the MEE is operating.
Table 8. Operating time of each component during different months.
MonthLDEOASLD-IDECOAS
MEE (h)LD (h)LD (h)
46617(˟0)17
511472(˟43)137
6315355(˟310)441
7480480(˟480)508
8500500(˟500)514
9230284(˟205)295
104919(˟0)47
11160(˟0)0
˟ The operation time of the LD system when the MEE is operating.
Table 9. Average humidity ratio of the supply air conditions of the two systems.
CategoriesLDEOASLDIDECOAS
Average humidity ratioSummer4.7 g/kg9.1 g/kg
Intermediate season 6.7 g/kg7.2 g/kg
Winter5.4 g/kg2.6 g/kg
Average dry-bulb temperature12.9 °C15 °C

