1. Introduction
Electrically powered vehicles are generally considered to be much greener in terms of the absence of exhaust fumes. Unfortunately, the awareness that they carry other risks is very limited. Vehicle manufacturers make every effort to keep vehicles safe. This is due not only to the concern about product quality, but also to the standards in force in the automotive industry. Production standards apply not only to the vehicles as a whole, but also to the safety of individual components.
The development of vehicle design is aimed at increasing both passive and active safety. Pressure on manufacturers is exerted, inter alia, through advanced test programs, such as The European New Car Assessment Program NCAP, in which many of the assessment criteria are related to safety [
1]. However, these tests consider the vehicle as a whole. Unfortunately, despite the care of legislators and producers, accidents do happen. One of the greatest hazards when operating an electric vehicle is fire. If such a situation is publicized [
2], vehicle manufacturers’ representatives try to demonstrate that the cause was in external circumstances (e.g., [
3]). In addition, it is said that annually about 150,000 combustion-powered cars get on fire whereas, in contrast, electric vehicles burn statistically much less frequently. Research by the National Highway Traffic Safety Administration (NHTSA) shows that the main causes of electric car fires are high voltage batteries during charging and damage during road incident [
4]. While the occurrence of a fire during the accident itself can be explained by internal damage caused by mechanical impact, followed by electrical short circuits, then the ignitions of unused vehicles and vehicles standing in parking lots or garages are worrying the same as car fires during charging. In such cases, National Transport Safety Board (NTSB) investigations in the US and police investigations in Europe were carried out.
In recent years, Li-ion batteries have been used to a large extent as an energy source of EV drive and in portable devices. According to the forecasts, the increase in battery production, measured by the capacity to be accumulated, will be from 60 GWh (at 2017) to 0.6-4 (different forecasts) TWh (at 2040) [
5]. This number indicates the magnitude of the safety problem. The popularity of Li-ion batteries results from the possibility of accumulating a relatively large amount of energy per mass unit. This is an advantage from the user’s point of view, although when released in an uncontrolled manner, the energy “stored” in the battery poses a serious risk.
Safety tests of the use of Li-ion cells were conducted in many centers. The results given in [
6] are particularly interesting. The authors pose a fundamental question: “Are Lithium Ion Cells Intrinsically Safe?” These studies are conducted in the context of mining applications and the selection of safer cells from among the studied group. The starting point is the generally valid safety test standards for cells. In order to answer the question posed in the title of the paper, the tests used are analyzed Based on this analysis, they indicate that some of the cells may experience internal short circuits that are undetectable by methods and tools used in tests. At the same time, the conditions for the occurrence and course of the thermal runaway process and gas emission during the cell decay were investigated. Works of a similar nature were also performed by Polnik [
7]. The cell’s resistance to short-circuiting at the terminals, overcharge, and excessive over discharge was tested. During destructive tests, the composition of gases emitted by the cell was examined and the external temperature during the burning process of the battery was determined.
The thermal runaway process (TR) that is fundamental to safety is well documented in [
8,
9]. In these works, it was presented as a three-stage, occurring in Li-ion cells, which are especially characterized by high performance. In these cells a very thin separator made from one or more types of polymers is placed between the anode and the cathode. The separator prevents the short-circuit main electrodes. The separator is saturated with an electrolyte containing combustible organic materials. After exceeding the threshold temperature permissible for the cell, the anode material begins an exothermic reaction with the electrolyte. If the heat is not removed quickly enough, the temperature rises until the second phase begins, which is associated with even faster heat generation. In this phase, gases appear, internal pressure increases, leakage may occur, casing deformation and smoke may appear. A further increase in the amount of heat contained in the casing occurs in stage three when the highly reactive anode material ignites with a flame associated with a possible explosion. It is a thermal runaway (TR) of energy combined with a further rapid rise in temperature [
9]. Levy and Bro [
10] describe thermal runaway basically like the [
8].
They point out that in the event of damage (regardless of the causes), there are two processes, one for supplying heat and the other for removing heat to the outside. Depending on how much the supply process prevails over the removal process, it may happen that the third stage is not reached because the amount of heat supplied is not enough to ignite the anode. The electrolyte and separator material burns out, but the anode remains unburned. The authors call this process a mild thermal runaway.
The authors of the study became interested in the possibility of improving safety and reducing the risk of fire when using batteries that power electric vehicles. Basing on their own calculations and analyzing foreign research, they estimated the impact of the amount of energy stored in the cells on safety. In the course of the work, a review of the applicable cell testing standards was carried out in terms of the scope of tests aimed at excluding dangerous structures. The available instructions in the event of an electric vehicle fire were also analyzed [
4]. Moreover, by analyzing the available information on the design of vehicle electrical systems, including BMS [
11,
12] they identified potential modernization of cells and power systems for electric vehicles increasing safety in the event of damage and reducing the chances of a fire. It should therefore be emphasized that in the analyzed literature, no method has been found to actively reduce the fire risk of batteries by lowering the state of charge.
2. Materials and Methods
The work determines the specific heat value of Li-ion cells with the size of 18,650, made in the ICR technology of two different manufacturers, hereinafter referred to as red and green in the study. The cells had a nominal capacity of 2200 mAh (red-ICR-LiCoO
2-cathode) and 2600 mAh (green-INR-LiNiMnCoO
2-catode). The nominal operating voltage in both cases was 3.7 V. These cells can be taken as examples, the exact specific heat values for a particular batch of cells may vary depending on the internal structure and many new chemistries in use. The cell was treated as a mixture of various substances, assuming that in the presence of heat it would be heated to ambient temperature. The cells were pre-cooled and the temperature in the chamber in which they were located was carefully measured. They were then transferred to the calorimeter and the calorimeter was closed. The heat exchange took place in a calorimeter. Heating is assumed to be an adiabatic process, and the amount of heat absorbed by the cells is equal to the amount of heat given off by the liquid in the calorimeter and the calorimeter itself. The specific heat value and the measurement error were determined from the heat balance presented in
Section 3.1.
The literature analysis carried out in
Section 3.2.1 showed that the combustible properties of a cell strongly depend on its state of charge (SOC). Similarly, on the basis of research [
13] it was found out that 60 °C there is a threshold temperature value from which the TR process begins, (
Section 3.2.2). Research on the propagation of the TR phenomenon for cells fully charged by [
14] indicated that the incorporation of passive barriers into the battery significantly delays the propagation process. This time can be used to discharge the cells.
Using these data, a formula was derived for the amount of the cell SOC at which it is safe as a function of specific heat, mass and the threshold temperature of the TR process (
Section 3.3.1). The scale of the danger is illustrated in
Section 3.3.2. The hypothetical temperature to which a fully charged cell would be heated as a result of the conversion of all electricity into heat was calculated.
The analysis of the tests used for the safety of cells and the methods of counteracting security threats has shown that all the cell protection methods used are passive. There is no method to start reducing the risk before the TR process is fully developed.
As a result, a set of measures was proposed to reduce the fire risk as a result of active impact on SOC by discharging the most vulnerable cells in
Section 5.
3. Results
The first goal of the authors was to determine what part of the energy contained in the cell in electric form it is able to absorb without creating conditions for self-ignition. For this purpose, specific heat of the cell was determined experimentally.
Then, on the basis of literature studies, it was assumed that the intensity of the cell burning process is strictly dependent on its state of charge (
Section 3.2.1). The second important conclusion is the adoption of the temperature limit for the beginning of the thermal runaway process from the literature (
Section 3.2.2).
As a result, the energy dependencies resulting from the above investigations were determined (
Section 3.3). These are, first, the formula for the limit value of the state of charge of a cell below which it will not self-ignite as a result of the conversion of the electrical energy contained in it into heat (
Section 3.3.1). The second is the calculation of the hypothetical temperature to which the cell could heat up if all electrical energy contained in it was converted into heat and no escape occurred (
Section 3.3.2). As a result of the observation that the combustible properties of the cell are significantly lower in the state of its discharge, it is proposed to use the method of lowering the charge contained in the cell in a state of danger with the thermal runaway process.
In order to determine whether such a method is used anywhere, an analysis of the cell tests used (
Section 3.4) and the known and used cell protections (
Section 3.5) were carried out.
3.1. Experimental Determination of the Specific Heat of a Lithium Cell
For the purposes of this work, however, it was decided to determine such a coefficient having the meaning of specific heat as if the cell was a homogeneous substance. Determining the specific heat value in an analytical way from thermodynamic dependencies would require precise knowledge of the molecular composition of all cell elements and the masses of the components contained. Cell manufacturers keep the cell chemical compositions secret for commercial reasons. Spectral analysis would entail high research costs. Also the use of advanced measurement methods, such as fast scanning calorimetry [
15], was not available to the authors, but the result obtained by much simpler means seems to be sufficient. This will make it possible to estimate the heat values and temperatures to which the cell will be as a result of being subjected to heating.
The specific heat of materials is defined as:
where
Q is the heat amount needed to alter the temperature by the value Δ
T, body weight
m.
3.1.1. The Course of the Experiment
Two cylindrical lithium cells pre-cooled to temperature To were inserted into a calorimeter with a known inner vessel mass mk containing a heat transfer fluid mw and a known temperature TK. After the cell and water temperatures equalized, the heat transfer process was considered complete and the final temperature TE was read.
The cells whose specific heat was measured were two sets of two cells with a size of 18,650. In the experiment, the sets were named as red and green. For the experiment, a calorimetric vessel with a volume of 200 cm3 was used, allowing the measurement of temperature changes of the heating medium. The internal vessel of the calorimeter and the stirrer were made of aluminum. The part of the stirrer mass was taken for the calculations—it was immersed in the heating liquid. This was taken into account by introducing a correction factor of 0.73 as a result of the proportion of the submerged part of the stirrer to the total of the stirrer.
When conducting the heat balance, it was assumed:
- (1)
The initial temperature of the inner vessel of the calorimeter, the stirrer and the heating liquid is equal to the ambient temperature and amounts to TK
- (2)
The inner vessel and the stirrer give off heat in the amount of
Qk:
where
TE is the end temperature of the experiment.
- (3)
The heating liquid used in the experiment is distilled water in the first phase and ethyl alcohol in the second phase. The heating liquid gives off heat in quantity:
- (4)
The cells are chilled in a freezer to a temperature of −18 to −15 degrees Celsius, indicated as
To, and the cooled cells are placed in a calorimeter. As a result of this operation, the cells take up heat in quantity:
where
co is the desired specific heat capacity of the cell.
- (5)
It is assumed that during the experiment, the heat exchange with the environment is of negligible value and the heat absorbed by the cell is equal to the heat given off by the calorimeter and the heating liquid. In order to best meet this assumption, the calorimeter’s outer vessel is encased in a material with low thermal conductivity and is equipped with a lid that prevents heat loss through evaporation. In addition, lightweight silk threads with a total weight of 0.02 g were attached to the cells, allowing the cells to be removed from the freezer without touching them, thus eliminating the heat supplied by hands or tools. The weight of these threads and the heat absorbed by them have been ignored. With such assumptions:
After the substitutions 2, 3, 4 and transformation, the formula for specific heat of the cell was obtained:
In the first phase of the experiment, two series of measurements were made for each of the two cell types. Two cells were taken simultaneously for one measurement—the aim of this action was to increase the accuracy of the measurements obtained thanks to the transfer of twice as much heat, which, with the same measurement uncertainty, lowers the value of the relative error.
3.1.2. Calculation of Specific Heat with a Determination of the Specific Heat Measurement Error
Data and calculation results for the first phase of the experiment with water as the heating medium are summarized in
Table 1.
In order to determine the error in determining the required value of the specific heat of cells, the measurement uncertainties of individual values were estimated based on the knowledge of the metrological characteristics of the measuring instruments held.
Mass measurements − electronic scales with a 0.01 g resolution and measurement uncertainty of ± 2 digits. Temperature measurement − thermometer with a 0.01 °C resolution and measurement uncertainty of ± 5 digits which is summarized in
Table 2.
The values of the specific heat of water
cw = 4.182 [J (g K)
−1], aluminum
cAl = 0.897 [J (g K)
−1] and ethanol
ce = 2.440 [J (g K)
−1] later used in the discussion, were adopted according to tables [
16] and treated as certain values.
Since the specific heat is dependent on a number of indirect measurements, to determine the measurement error, the formula, according to [
17] for the mean square error of the S function was used, which depends on a series of intermediate quantities
X1,
X2, …,
Xn−1,
Xn related to the functional relationship in
Y:
In this formula, NXi denote the measurement uncertainties of intermediate quantities, while denote the partial derivatives of the function Y after the variable Xi. Applying the above formula to the dependence on the value of the specific heat capacity (6), it is necessary to determine the partial derivatives co with respect to mw, mAl, mo, TK, To, TE.
For this purpose, Formula (6) is written to simplify the notation in a slightly different form:
At the same time, the following designations are adopted:
and:
and then designates partial derivatives:
and continuing:
Line 11 of the table above contains the value
CM of the expression being the mean square error component depending on the mass measurement error:
whereas line 12 contains the part dependent on errors of temperature measurement
CT:
The resulting mean square error
S is given by Equation (19) corresponding to Equation (7):
Analyzing the values of these two components obtained in the measurements, it is easy to notice that the part dependent on the mass measurement is definitely smaller than the part of the error dependent on the temperature measurements. The easy conclusion is that to improve the measurement quality expressed by the reduction of the mean square error, a technique allowing to reduce the dependence on temperature should be used. Since the formulas for partial derivatives of errors from individual temperatures contain the expression (
TE—
To) in the denominator, increasing its value, with the same error in measuring a single temperature, will have the effect of reducing the value of individual partial derivatives. To achieve this, another heating fluid was used, namely ethyl alcohol. It has almost two times less specific heat than the specific heat of water. Therefore, a similarly cooled cell should cool the liquid almost twice as much.
So the measurements as in
Table 1 and the calculations as in
Table 3 were repeated by changing the heating liquid to ethyl alcohol. The same calculation algorithm, dependencies and measuring equipment with uncertainties as in
Table 2 were kept. The results are presented in
Table 4 and
Table 5.
In the experiment it is important to choose the starting temperature of the calorimeter and the heating liquid. When the liquid poured into the calorimeter is preheated, the temperature drops until it equalizes with the ambient temperature.
Unfortunately, in order to obtain a measurement of the specific heat of cells at temperatures higher than the ambient temperature, additional difficulties are encountered. It is related to the determination of the moment, including the temperature, when the heat exchange between the heating liquid and the calorimeter and the cells (cooled or heated) is completed. Then the rate of temperature decrease over time should be analyzed and the error in determining this moment would be significant. A different tactic was adopted. Namely, the experiment was started after the temperature in the calorimeter was equalized with the ambient temperature. And only then were the cells inserted into the calorimeter. From the moment the cells were inserted, the temperature drop in the calorimeter was observed, and the readings had to be quite frequent (at a rate of about 1 reading per 2 s). The temperature initially decreased, then stabilized and then increased. The stabilized temperature was taken as the final temperature of the experiment and a sign that the heat exchange between the cell and the heating fluid was complete.
3.1.3. The End Result of Determining the Specific Heat of LI-Ion Cells
The obtained results are presented in the
Table 6 separately for green and red cells.
It is easy to notice that the results obtained when measuring with ethanol have a narrower range of permissible error, moreover, the cells differ significantly in the value of the specific heat coefficient depending on the type. Finally, the value of the specific heat of green cells (
coz) was taken as the average value, and similarly (
cor) for red cells:
3.2. Selected Phenomena Related to the Presence of Electricity in a Li-Ion Cell
The safety of the cells is influenced by their state of charge. It significantly changes the course of the fire process. If the heat supply to the cell is higher than its removal, the amount of heat stored in the cell increases, and so does the temperature. This ultimately leads to the thermal runaway process.
3.2.1. The Impact of SOC on the Process of Cell Burning
The study [
18] describes the combustion tests of Li-ion cells. A fire calorimeter was used for these tests. This device also appears in the literature under the name of Tewarson Apparatus. In the described experiment, the oxygen consumption during the combustion process was measured. The aim of the experiment was to determine the dependence of the cells’ burning mode as a function of charge level.
This complicated but very clearly described experiment is based on the simultaneous measurement of the mass of the tested cell located in the combustion chamber, heating by high-power infrared lamps, and controlled oxygen flow through the chamber. The exhaust gas flow velocity and temperature were measured in the instrument outlet channel, and gases were collected for analysis.
The analysis of exhaust gases was carried out in terms of the quantitative assessment of the share of individual compounds in the exhaust gases, such as CO2, CO, total hydrocarbons and some toxic gases, such as SOx, HCN, NOx. Fourier transform infrared spectroscopy and paramagnetic analyser were also used in this experiment. One of the most important achievements of the work was the determination of the heat release rate (HRR) parameter for cells with different levels of charge.
The subject of the research was commercial Li-ion pouch type 2.2 Ah (4.2 Wh) cell. Before the test, the cell was completely disassembled and the measurements of its chemical composition, dimensions and weight, as well as all its components, were made.
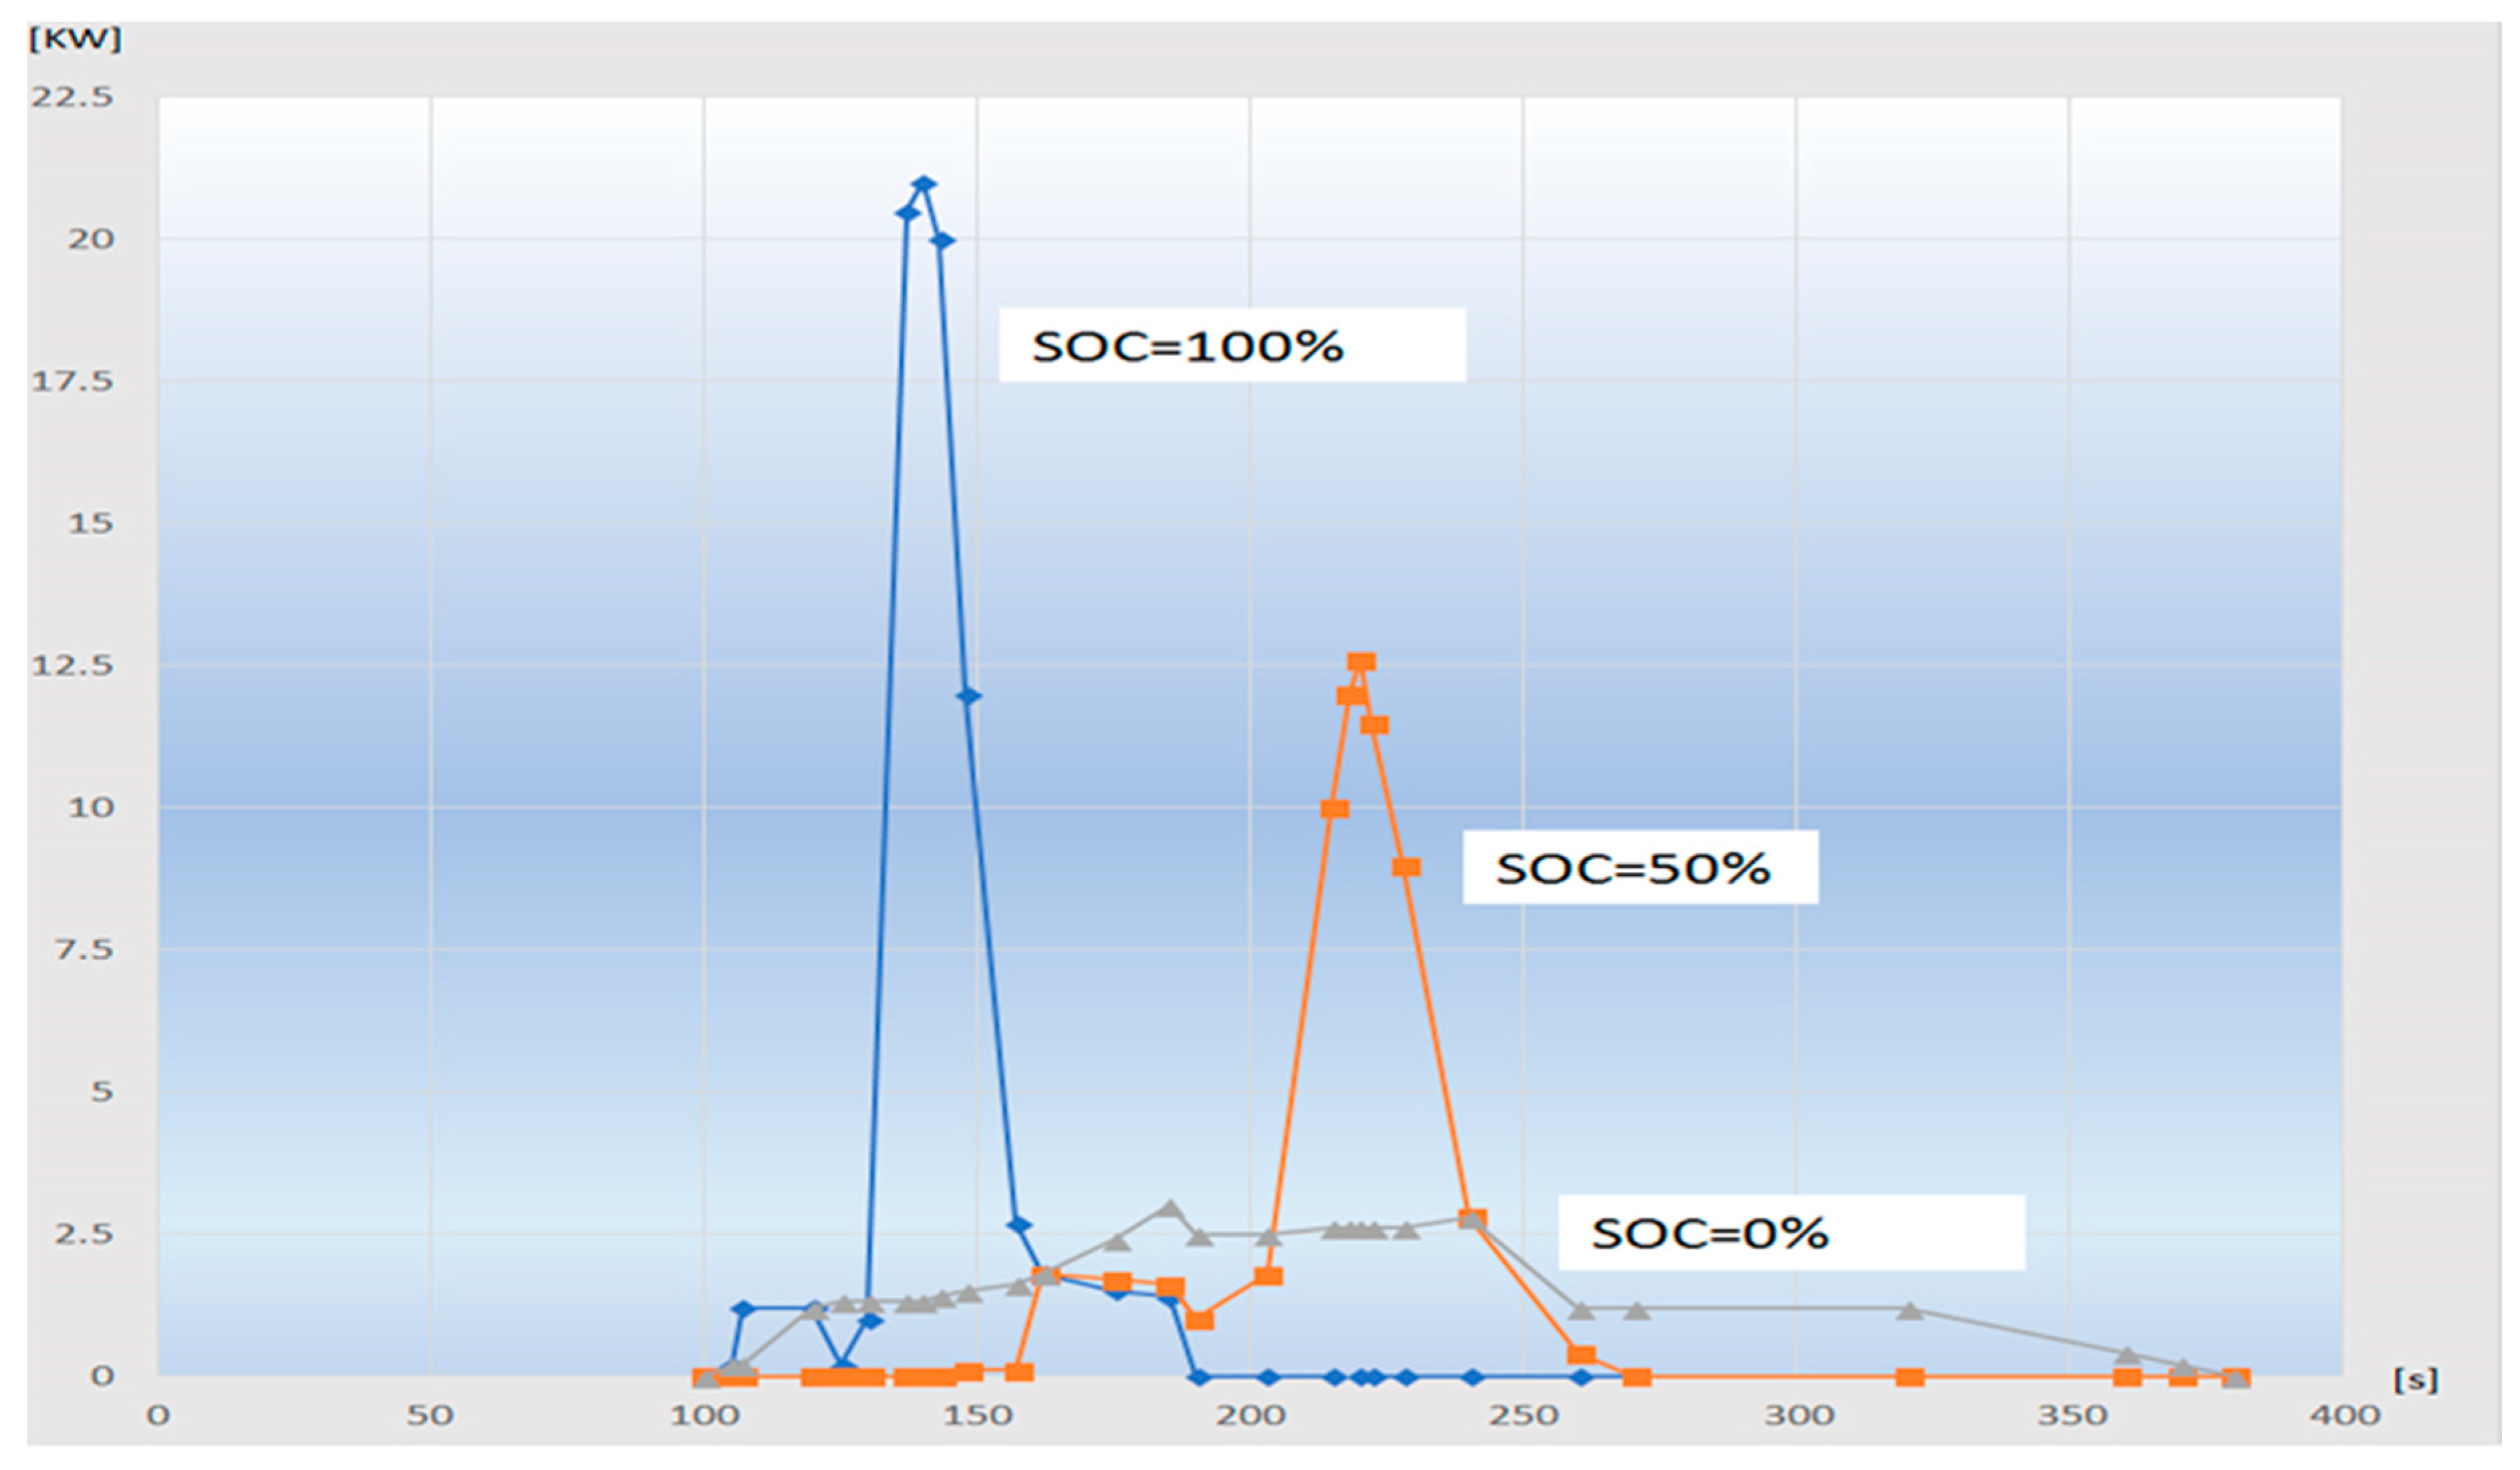
For the actual experiment, three batteries with pre-standardized SOC 0%, 50%, 100% were used. They were subjected to the combustion process in the Tewarson Apparatus. As a result, the distribution of weight loss as the time function was obtained, which
Figure 1 shows.
It is noteworthy that the mass loss onset process took place regardless of the state of charge at a similar point in time, which proves the repeatable ignition temperature. However, as the degree of charge increased, different rates of weight loss were observed. In the state of SOC = 100% charge, the battery burned in several seconds and the mass of the residue was established. Contrary to the discharge state, it took over 400 s to burn down to the same mass value of the residue.
The heat release rate (HRR) graph as a function of time is even better illustrated by the process of burning a cell, shown in
Figure 2. Heat release rate is indicator showing the course of the burning process of materials. Measurement of the HRR value is based on the determination of the oxygen mass loss in the vicinity of the burning material and further calculations resulting from the oxygen binding by other elements or compounds. An important result obtained during this measurement is not only the value of the energy released, but above all the way in which the release takes place.
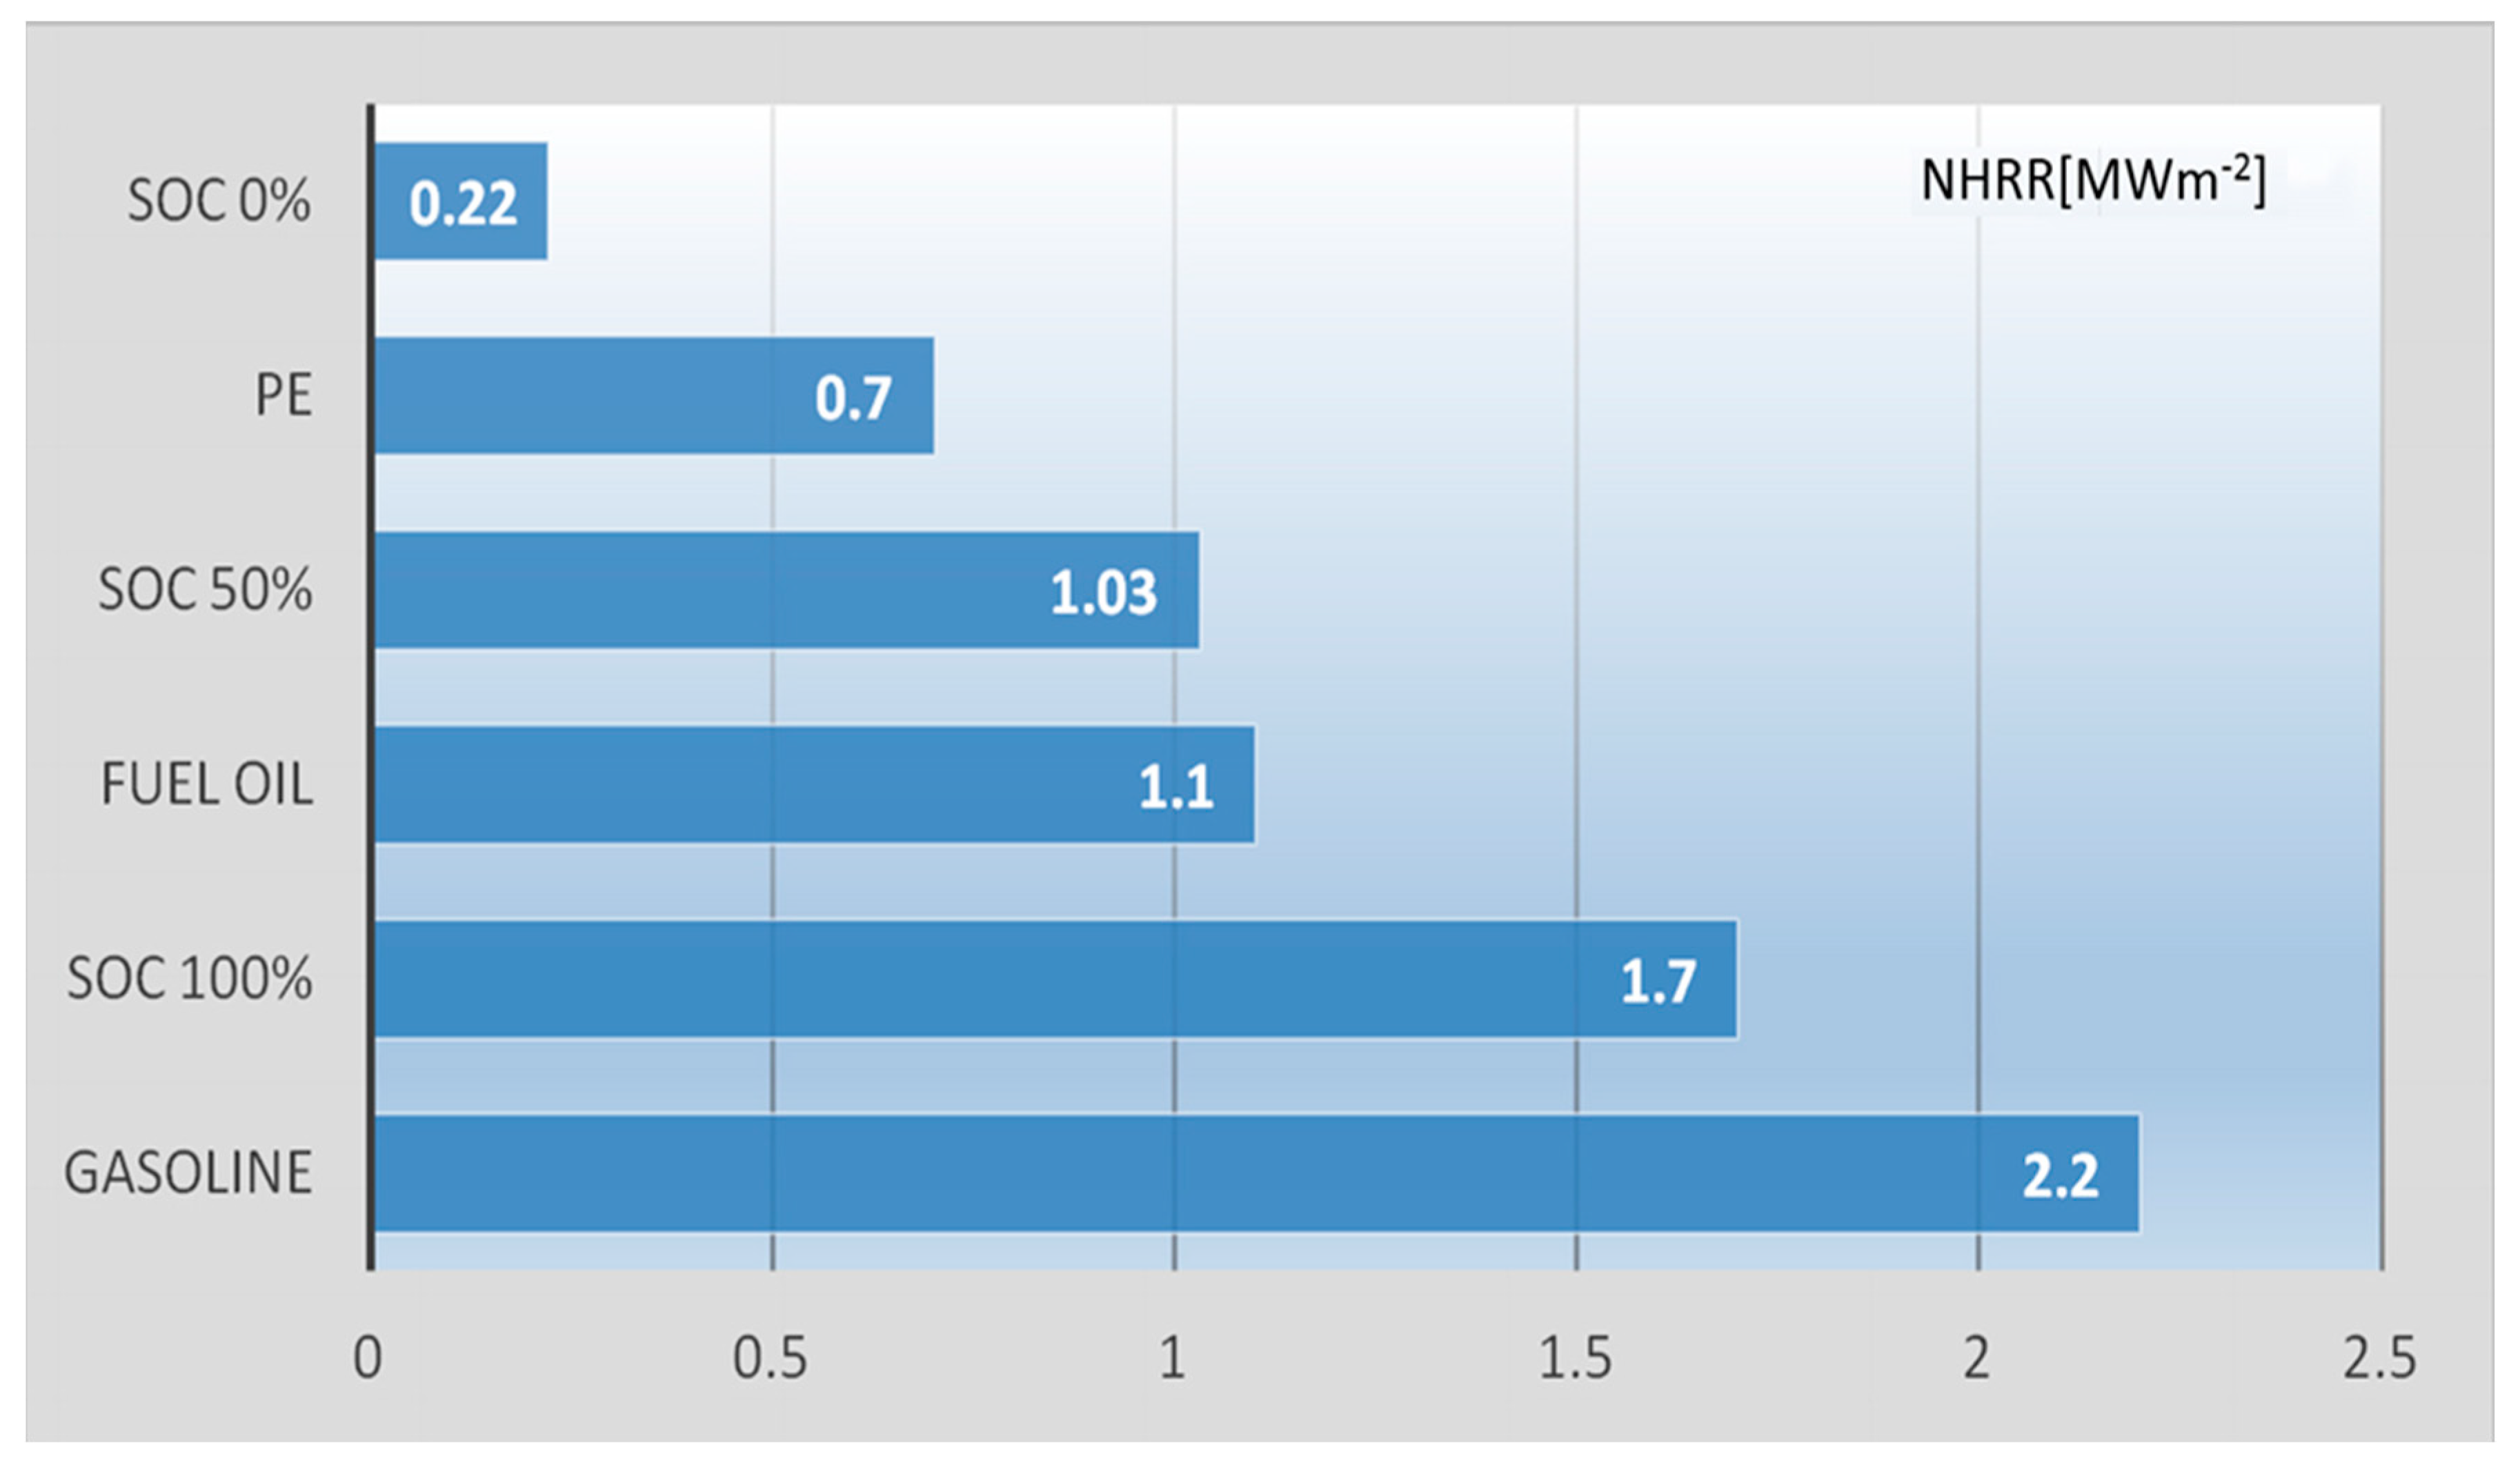
The combustion profile of the cells shows that the peak HRR values were 21 kW (SOC = 100%), 13 kW (50%), and 2.6 kW (0%), respectively. This means that in the case of a fully charged battery, the burning process was similar to an explosion. After normalizing the HRR value and referring to the area, it is possible to compare the burning of the battery with other combustibles.
The comparison presented in
Figure 3 shows that the burning process of a fully charged cell is similar to the burning of gasoline, while the burning of the cell in a charged state of SOC = 50% is similar to the burning intensity of fuel oil. Discharged cell (NHRR = 0.22 MWm
−2) burns even slower than polymers that are part of its composition (e.g., polyethylene − NHRR = 0.7 MWm
−2).
3.2.2. Temperature Changes in the Cell during the Thermal Runaway (TR) Process
Studies of the processes taking place in the cells as a function of temperature have been conducted for a long time [
6,
10,
13,
19]. The National Highway Traffic Safety Administration report summarizes them in a very compact way [
4]. Regardless of the reasons that caused them, the changes occurring in the cell are of a similar nature and their summary is presented in
Figure 4.
The onset of degradation changes is already observed at a temperature of 60 °C. In the tests [
13], the temperature of 180 °C is mentioned as indicating the third phase of the TR process. In the studies of Polnik [
7] it was observed that at a temperature of 100 °C there was a release of gases from the inside of the cell, and at 180 °C there was a flame visible from outside. The aforementioned tests [
18] indicate the onset of weight loss (
Figure 2) at about 110 s, regardless of the state of charge. It follows that the link was unsealed at this point. It is noticeable that the cell fully charged SOC = 100% (
Figure 3)started to emit heat after 110 s, and the peak of emission occurred around 145 s. Partially discharged cells also started to emit heat around 110 s, but after 180 s they had a heat emission of only 14% of that of the charged cell. The half-charged cell did not reach 62% of the charged emissions until 225 s, when almost all the fuel had burned out. The uncharged cell increased its emission only in 180 s and kept it at a percentage of 15% of the full cell emission, down to 250 s, and then the emission decreased down to 350 s. With a simultaneous slow weight loss.
The above simultaneous analysis of both processes of mass loss (which is equivalent to the burning of matter inside the housing) and of heat emission shows that the state of charge is a decisive factor for the combustible properties of the cell. At about 180 degrees, a fully charged cell burns at a rate comparable to gasoline.
The research of the team of McCoy, Sriramulu, Barnett [
13] showed the course of the stimulated TR process with simultaneous measurement of the most important parameter for the cell voltage and temperature as a time function. As in the previously presented studies, damage phenomena begin to develop at a temperature around 60 °C and the temperature at the top reaches over 680 °C. This peak temperature is confirmed in the work [
18] by stating that “drops of melted aluminum and unmelted fragments of copper foil were found in the remains after burning the cell”. Since the melting point of aluminum is 660 °C and copper is 1083 °C, these studies show that the peak temperature inside the cell was between 660 °C and 1083 °C. At the same time, it was shown that the loss of electrical properties of the cell occurs relatively early at a temperature of 60 °C. All the studies analyzed in this work show that the onset of degradation changes occurs at a temperature of 60 °C. Maintaining the heat supply, either from the outside or as a result of energy changes—charging, or as a result of internal damage, leads to the TR process whose speed of development is determined by the SOC. Thus, the threshold temperature should be 60 °C, below which the cell is safe.
3.3. Energy Dependencies
Comparing the amount of energy stored in the cell with the amount of heat that it can absorb without the risk of spontaneous combustion determines the safe state of charge. On the other hand, the calculation of the hypothetical temperature to which the cell would heat up in a fully charged state, if the energy stored in it was converted into heat, gives an image of the degree of danger both of these parameters will be set out below.
3.3.1. Safe State of Cell
Heat capacity (
C) expressed by the formula:
is understood as the amount of heat supplied to body mass (
mo) which causes the temperature to rise by one degree. Specific heat capacity is marked as (
co). Hence, the amount of heat that causes the temperature to rise by Δ
T is given by the equation:
where Δ
T is the temperature rise. Assuming that Δ
T =
Tamb −
Ttresh, where
Tamb—means the ambient temperature;
Ttresh—is the threshold temperature at which the thermal runaway process can be initiated.
The Ttresh temperature is characteristic for each type of cell and depends on its chemical structure, construction, heat dissipation capacity, etc.
Unevenness is a safety condition that guarantees that the cell does not self-ignite:
where:
Eo—the energy currently inside the cell [J];
Eel—maximum electric capacity of the cell expressed in [Wh]; SOC—state of charge expressed in [%].
Inequality (23) can be expanded and transformed to the form (25) and next (26):
The limit SOCsafe value means such a SOC when the stored energy is too small to cause the self-ignition process in the cell.
A limit value is defined for the purpose of this work and called safe state of charge:
The value of SOC < SOCsafe means a state SOC in which the stored energy in the cell is too small to cause the self-ignition process.
For safety reasons, the cells stored and transported should be in a state of charge lower than that of SOCsafe. Similarly, after a road incident involving an EV vehicle, until the power system, in particular the battery, is fully checked, the cells should be forced to discharge to a state lower than SOCsafe.
Of course, while the cell is used, it is charged to a higher value. But a value of the state of charge higher than SOCsafe indicates the need for external supervision of the cell.
3.3.2. The Relation, Energy Accumulated in a Cell and Its Heat Capacity
Using the previously determined value of the cell’s specific heat, it is possible to determine the hypothetical temperature (Thip) to which the cell will heat up as a result of converting the energy stored in the electrical form into heat. Stored electric energy is understood as the cell capacity in [Wh] declared by the manufacturer. For the tested cells Eel = 8.5 Wh.
After comparing:
we get the following reaction:
after substituting the values in the correct units it was obtained
Thip = 659 K. This temperature is very dangerous and lowering the energy in the cell reduces the level of danger.
3.4. Causes of Safety Risk Associated with Lithium-Ion Cells and Safety Tests
Manufacturers of batteries and products containing batteries design their products to achieve specific performance parameters under foreseeable operating conditions. Failures may be caused by incorrect workmanship, use in a manner not provided for by the manufacturer or exceeding the operating parameters permitted by the manufacturer. Internal passive protections are used for single cells, but their effectiveness is limited. For multi-cell batteries, e.g., such as in EV, external protections are used, which do not allow exceeding the main limit parameters.
These protections are an inherent part of BMS systems [
11,
12] The purpose of BMS is to control the amount of energy reaching the cells during charging (from an external charger or recuperation), and the distribution of energy between battery modules. On the other hand, BMS limits the amount of power expended by batteries to the values allowed when charging. The informative role of the BMS, which provides the driver with information about the battery status, is extremely important. For this purpose, the BMS, in most cases, calculates the state of capacity (SOC) and state of health (SOH) parameters on an ongoing basis. Both parameters are used to forecast not only the range of the vehicle, but also show the degree of aging of the cells. The exact algorithms for determining SOC and SOH are not published by manufacturers of power systems. Overall, the manufacturers strive to maximize the vehicle’s range while maintaining its guaranteed lifetime. Therefore, as an intermediate task, manufacturers are forced to take care of the safety of cells.
However according to Underwriters Laboratories (an independent inspection organization) the problem of the safety of the thermal stability of highly reactive materials at elevated temperatures and the occurrence of internal short circuits still exists. There are many research institutions and independent laboratories all over the world that deal with the editing of technical standards and safety tests aimed at maintaining and standardizing the cells produced. The subject of testing and diagnostics of cells is very wide and concerns both small cells intended for toys and home appliances, but also battery-powered tools, the aforementioned EVs, as well as in large energy farms. Among the standardization institutions and their studies related to cells, the following can be mentioned:
International Electrotechnical Commission
- ∘
IEC 62619: Safety Requirements for Secondary Lithium Cells and Batteries for Use in Industrial Applications
International Organization for Standarization
- ∘
ISO 12405-3: Test Specification for Lithium-Ion Battery Packs Part 3
National Electrical Manufacturers Association
- ∘
C18.2M: Part 2, Portable Rechargeable Cells and Batteries—Safety Standard
Society of Automotive Engineers
- ∘
J2929: Electric and Hybrid Vehicle Propulsion Battery System Safety Standard—Lithium-based Rechargeable Cells
United Nations (UN)
- ∘
IEC 62281 Recommendations on the Transport of Dangerous Goods, Manual of Tests and Criteria, Part III, Section 38.3
Underwriters Laboratories
- ∘
UL 1642: Lithium Batteries
- ∘
UL 2271: Batteries for Use in Light Electric Vehicle Applications
- ∘
UL 2580: Batteries for Use in Electric Vehicles
Only a few of the most important standards that directly apply to cells used in the automotive industry and limited to Li-ion cells will be mentioned in the following list. The standards with the widest test ranges have been selected and presented in the
Table 7.
It would be too extensive to discuss all the tests in detail, but note that the basic requirement for all of them is that the sample does not explode or ignite for a prescribed time period [
20]. The first of these tests—overcharge, overdischarge, external short circuit—are common to all standards and indicate the importance of resistance to these excess loads for cells.
The continuous rate charging test is similar to the normal charging/discharging tests, it is to ensure safety in situations of long-term connection of the cell to the power supply that does not cut off the charging voltage. Positive results of the mechanical tests crush, impact, shock, vibration, drop are to ensure the resistance of the cells to stresses related to the impact of external forces of different intensity, time of impact and variability. Each test uses standardized tools and forces over a specific cycle and time.
Another group is environmental tests. The reduced pressure test is intended to simulate the resistance of the cells to the effects of transport in cargo aircraft holds. Heating, temperature cycling, projectile/external fire, molded casing heating tests are to prove resistance to the effects of heat coming from outside and generated in various ways, of course within specified limits and time.
The measurement of insulation resistance is an obvious test resulting from the fact that large numbers of cells are connected together in batteries.
The voltages present in the entire supply system can reach a value close to 1 kV. Therefore, there is a need to construct such cells that will not puncture or cause a short circuit in the circuits. The last of the internal short circuit tests listed in the
Table 7 raises the most doubts.
The problem is in inducing a phenomenon that would correspond to conditions similar to an internal short circuit. In some versions of the tests, the internal short circuit was replaced by hammering a rod of a fixed thickness into the link. However, it has been shown [
10,
13] that this approach does not correspond to the phenomenon of internal short circuit development due to the formation of lithium dendrites, or as a result of accidental production residues in the form of metallic inclusions. The problem of internal short circuits is currently recognized as the most important cause of TR formation.
3.5. Review of the Applied Protection of Cells against Self-Ignition
The problem of safety risk due to damage to cells is well known and applies to both low-power cells and batteries used in e.g., smartphones and those that accumulate energy in the order of several dozen KWh used in EV. This problem is solved in two different ways. The first is to prevent the cell from entering a hazardous state by preventing the occurrence of external conditions and operating parameters for hazardous cells—this role is played by BMS systems. This type of security is called external. The second way depends on the link itself and the designers’ efforts are aimed at making the link “in itself” more secure. These safeguards are called internal. The currently known internal security features include:
The shut-off elements prevent the maximum cell current from being exceeded. They are usually based on elements with a positive temperature coefficient of resistance [
21] and after exceeding a certain value, they disconnect the load. Their use in small multi-cell batteries is justified. However, in multi-cell configurations it is problematic. The reason for this is the increase in the current of working cells due to the failure of some of the cells in which the protection was activated at high load states. This can lead to a thermal runaway process despite the existence of major safeguards, e.g., in the BMS system.
Elements disconnecting the circuit as a result of exceeding the internal pressure in the cell. The value of 1 MPa is assumed as the limit pressure [
22]. Breaking the current circuit makes sense when the current value is excessive and causes the components to break down. A further increase in temperature due to current generation can be prevented by opening the circuit. However, a pressure of about 1 MPa is high enough to indicate that the gases have already formed, i.e., the cell has already partially decomposed and its disconnection will prevent further operation.
Pressure valves unsealing the link at the pressure of 3 MPa [
23] The purpose of using this protection is to discharge gases resulting from the decomposition of compounds included in the cell to the outside. Most often, the release of gases through the safety valve occurs in the advanced TR phase. The positive effect is that the exhaust gas from the inside of the cell is controlled and does not burst explosively. Unfortunately, the exhaust gas has a high temperature and entrains solid particles that can be a fire source.
Heat management is usually implemented at a higher design level than a single cell, i.e., within a module or battery. Heat management is a primary task for the BMS, apart from controlling energy delivery during the use and energy consumption when charging. At the single cell design level, it is necessary to consider heat dissipation and therefore there have been cylindrical cell designs with a hollow tube in the center for cooling (manufacturer Saft). In the case of rectangular prismatic cells, thin heat sinks are used between individual cells connected by a thicker ribbed beam outside the housing (e.g., manufacturers EnerDel, GAIA), which is attached to the cooling system of the entire vehicle. Another proposed solution related to heat flow management is the use of phase change materials (e.g., paraffins). The idea is that in the vicinity of the cell there are containers with a material that absorbs heat. Since the heat of fusion is relatively high, and the material maintains a relatively constant temperature, before it changes its aggregate state in the entire volume, the temperature of the cell stabilizes, which is a heater for the container with the phase change material. The analysis and test driving experiments conducted by the team from NREL [
24], showed that this solution is suitable for devices that operate with load pulses, additional cooling is required in the case of long-term load to prevent TR. A so far not discussed aspect of security is the problem of fire propagation between cells in the battery module. Although the work of Lee et al. [
14] concerns large sources in energy storage, the problem of propagation is as important there as in the case of EV batteries. The authors observed the process of TR propagation between 18,650 fully charged cells arranged in a 3 × 4 or 3 × 5 matrix. The experiment was initiated by heating one of the cells with a resistance heater. The matrix was purged with a gas stream of different flow rates. The gas was air or nitrogen. The measure describing the experiment was the time between the fire jumping from one row to the next. In order to limit the transmission of fire, they used various passive barriers between the rows and rows of cells. The variable parameter was the type of barrier: no barrier, 5 mm gap, stainless steel barrier, intumescent barrier on a steel sheet substrate and a ceramic fiber barrier. The times of fire transfer from row to row were 7, 28, 295, 310 and 486 s, respectively. An important conclusion supplementing the measured propagation times was the statement that the nitrogen atmosphere reduces the fire propagation rate and also changes the composition of the gases coming from the battery. The authors conclude that none of the methods they used completely prevented the fire from spreading. However, it has been found out that it is possible to reduce the propagation speed by means of partitions. The use of ceramic fiber partitions reduces the fire propagation speed by over 30 times.
The use of separators which interrupt the ion exchange after exceeding the melting point of the separator material. The construction of the cells requires the use of a separator [
25] Its role during normal operation is to let electrolyte ions move between the electrodes of the cells with the simultaneous isolation of the anode from the cathode. The separator is therefore porous. However, during an increase in temperature and heating rate indicating possible further uncontrolled increase, the separator shrinks the pores by blocking the flow of ions. Thus, the separator turns off the cell. At the same time, closing the pores prevents chemical reactions between the electrodes. This solution, adopted and used in some cell designs, is a partial protection, especially in the event of external disturbances—overcharge, over discharge or exposure to external temperature. However, it is insufficient when there are internal short circuits.
Detection of internal short circuits. The TR process and the thermal stability of the battery are relatively well described in the literature. The factors leading to internal short circuits are much less known and are often the cause of the development of cell degradation ending with TR. The description of the phenomena is complicated and diverse. The situation is hampered by the fact that different chemistries are used in cells from different producers. The paper [
13] stated that internal short-circuits (internal shorts) constitute the most serious group of cell failures. The paper states that the CAMXPOWER Company (Lexington, MA, USA) has developed prototype devices that allow for tracking the development of internal faults. Thus, it is potentially possible to detect cells threatened by TR.
Unfortunately, the abovementioned security measures have limited effectiveness. They are sufficient in a stable state and in a state when both the individual cells and the BMS system are undamaged, but when this condition is not met, it is possible to reduce the fire risk as shown in
Section 6—Conclusions, by means of the design solutions proposed in
Section 5.
4. Discussion
The methodology for determining the specific heat adopted in the work relates more precisely to the specific heat at constant pressure, related to the mass. In the theory, there are also variants of determining the specific heat in relation to the volume and in relation to the amount of substance expressed in moles [
26]. The choice of specific heat at constant volume relative to mass for consideration was dictated by the fact of keeping the cell in a closed housing and keeping it in its entirety during the tests. Determination of the specific molar heat was not possible due to the complicated chemical composition of the mixture of substances making up the cell.
A more serious problem is the change in the value of specific heat as a function of temperature and external pressure. Pressure changes in the examined case occur in a narrow range and are not significant. Unfortunately, temperature changes significantly limit the range of accurate results. It must be borne in mind that when the threshold temperature of the thermal runaway process of the cell is exceeded, the breakdown of particles of some chemical compounds begins and reactions causing gas release occur. This gas, after the cell is unsealed, carries some of the heat with it. At the same time, less substances in the solid or liquid phase remain in the housing, that is, providing the same amount of heat as in the first phase will cause a greater increase in temperature. Additionally, the difficulty of the assessment is aggravated by the probable change in the value of the specific heat of the residues contained in the casing compared to the specific heat of the primary cell due to changes in the chemical composition. When the cell is in the third phase of the thermal runway, it is difficult to talk about the specific heat of the substance during combustion because the substance does not take up heat, but emits it. This substance could theoretically absorb energy, but much more important is the process of its release and the loss of mass inside the casing as a result of the transition to a gas state and escape to the outside. For safety reasons, it is more important that the content of the cell has flammable properties and it is possible to calculate its heat of combustion with a value comparable to popular fuels, as shown in
Section 3.2.1 and
Figure 4.
Thus, the use of the specific heat value for calculations makes sense mainly to estimate the ability of the cell to self-damage while reaching the threshold temperature without external heat. It is impossible to estimate a further increase in temperature of a cell undergoing disintegration with this value. As the research shows, after the destruction (for various reasons) of the cell a loss of voltage at the cell clamps occurs [
13], which certainly does not mean the disappearance of energy.
Regaining this energy in the form of electricity becomes impossible, but it is still present in the form of chemical bonds or internal reactions, often exothermic, causing the decomposition of compounds and the release of heat. The amount of heat dissipated outside determines how violent they are. It is important to associate the description of the thermal runaway process [
10] with the results obtained by the team [
18]. It is explained why the course, as Levy and Bro is noticed, is more or less violent.
The reason lies in the fact that the uncharged cell is, in a way, a mixture of various substances, the flammable properties of which have only about 20% of the mass (this is evidenced by the mass of the residue measured in the experiment related to the measurement of the speed of mass loss) and it burns relatively slowly (the normalized HRR factor for such a cell is about 0.22 MWm−2) so it is about nine times lower than for gasoline (HRR = 2.03 MWm−2). After charging a cell, the cell contains exactly the same amount of combustible material as before charging. This is evidenced by the fact that the residues after burning the cells had a mass similar to each other, regardless of the SOC. But it should be noted that in the experiment the cell was heated each time with heaters until the combustible material was completely burnt. In the case of charged cells, the role of the energy factor is played by the heat released during TR. (instead of the supplied heat of the burners as in the case of a cell with SOC = 0). Therefore, despite the fact that the starting chemical substances contained in the cell are the same regardless of SOC, in the state of charge they have the observed flammability properties (normalized HRR = 1.7 MWm−2) comparable to gasoline (HRR = 2.03 MWm−2).
5. Construction Postulates
The differences in the flammability of Li-ion cells with different degrees of charge can be used to reduce the risk of EV ignition or energy storage. Potentially possible use of these differences is presented in the following postulates and it assumes the introduction of circuits that automatically discharge individual cells when a threat is detected. It is connected with far-reaching structural changes in the construction of the battery and BMS systems:
BMS systems should be equipped, apart from the battery cut-off system in case of emergency, with circuits allowing for sector-controlled battery discharge with simultaneous cut-off of the charging and load systems.
The discharge should be triggered as a result of errors detected during charging or loading, or the detection of a road accident, e.g., due to the activation of accelerometers, or messages from the internal control systems of individual cells (if any).
Each battery should have its own internal emergency control system (IECS) independent of the BMS operating during normal service. IECS should monitor the condition of individual cells in the battery on an ongoing basis using its own thermal sensors and current values independent of sensors intended for cooperation with the BMS. The primary purpose of the IECS would be to discharge the battery in a controlled manner not causing an excessive rise in temperature, but in the shortest possible time. The IECS circuit should be non-disconnectable and continue to function even with the external battery disconnected until SOC < SOCsafe.
To obtain the longest possible time for discharging, it is proposed to use passive barriers between cells within the battery.
It is possible and advisable to design the discharging algorithms in such a way as to lower the SOC in the most endangered and neighboring cells in the first place. Around an endangered or even burning cell, there would be a zone around the cells in an at least partially discharged state, which reduces the intensity of burning and creates the possibility of spontaneous extinction of the fire.
Each battery should have simple visuals indicators (e.g., LED) outside that show the state observed by IECS. Connections to the central BMS system may be secondary, but the basic information about the state of the battery should come directly from it and be visible on it (for emergency services).
A complementary approach though requiring structural changes in each of the individual cells, would be to embed an additional discharge electrode connected to the external discharge system. Then the elements of the IECS system could be implemented inside the cell. This does not eliminate the need for the IECS that works for the whole battery as it is necessary for the scheduled discharge of cells, especially neighboring cells that are in good condition but at risk.
The advantage of using IECS systems would be their immediate impact after the occurrence of a hazardous event, before the emergency services arrive (for emergencies), or at the time of detecting an incident threatening the safety as a result of a slowly developing process of degradation, e.g., during parking in a car park.
6. Conclusions
It was found out that Li-ion cells are bodies with a low heat capacity and their specific heat is nearly four times lower than e.g., water. In order to obtain a higher accuracy of the specific heat value estimation, it is advisable to use a liquid with a low specific heat as a heating medium, e.g., ethanol. The detailed method of calculating the accuracy of specific heat determination is included and possible to recreate if needed.
The main conclusion from the research is that the heat capacity of a single Li-ion cell is small in relation to the energy that can be stored in it. The ratio of the energy stored in the cell to the heat capacity, which is unfavorable from the safety point of view, means that the energy conversion occurring in electric form into heat means the cell’s destruction as a result of the TR process. Also a low value of specific heat results in a quick achievement of high temperature under the influence of relatively small amounts of heat, which is a feature that promotes ignition. Thus, the Li-ion cell is a potentially hazardous material.
The burning speed of the cell is strongly dependent on the SOC and the higher the speed, the closer the SOC is to 100%. Lowering the amount of energy present in the cell in conditions where damage is suspected has the potential to reduce the risk of fire.
There are many known factors that can trigger the cell degradation process due to ignition, most of which are eliminated through proper construction and BMS operation when the cells are combined into a battery.
Cutting off the EV battery by the BMS when the vehicle is at risk is an action preventing the effects of external short circuits in relation to the battery, but it does not protect the battery against internal short circuits, and the energy contained in the cells is still a fire hazard.
Cutting off the cell by an internal polymer thermal fuse is a partial protection to prevent further external current flow, but does not prevent the flow of current closing inside the cell resulting from an internal short circuit and potentially leading to the TR. Discharging the cell by the emergency load system external to the cell is a possible action to reduce the probability of fire by reducing the risk of the TR.
Building in active battery protection systems based on discharging cells in emergency situations is a potentially, new tool to increase the fire safety of batteries. Such a solution may be of significant importance not only in the automotive industry but also in the mining industry, and in battery-based energy storage.


