Article

Humanity Can Still Stop Climate Change by Implementing a New International Climate Agreement and Applying Radical New Technology

by
Zvonimir Glasnovic
1,*,
Karmen Margeta
2 and
Nataša Zabukovec Logar
3,4
1
Faculty of Chemical Engineering and Technology, University of Zagreb, Savska cesta 16, 10000 Zagreb, Croatia
2
Faculty of Chemical Engineering and Technology, University of Zagreb, Marulicev trg 20, 10000 Zagreb, Croatia
3
National Institute of Chemistry, Hajdrihova ulica 19, 1000 Ljubljana, Slovenia
4
Faculty of Science, University of Nova Gorica, Vipavska 13, 5000 Nova Gorica, Slovenia
*
Author to whom correspondence should be addressed.
Energies 2020, 13(24), 6703; https://doi.org/10.3390/en13246703
Submission received: 12 October 2020 / Revised: 14 December 2020 / Accepted: 15 December 2020 / Published: 18 December 2020

Abstract

:
There is a broad consensus worldwide that anthropogenic climate change is a scientific fact. Likewise, the fact is that the UN’s efforts to address climate change over the last 28 years have not been successful enough. It is evident that the global average temperature is on the rise (1.1 °C above pre-industrial levels in 2019). A particular concern comes from the fact that the Paris Agreement on keeping increases in the global average temperature to below +2 °C is an unenforceable ambition, since the focus is more on consequences than causes. In addition, economic policies regarding global taxes, as well as adaptation and mitigation measures, are questionable, as there is no evidence that changes in the climate system will proceed at the same rate in the coming years. This paper proposes an engineering approach that considers all relevant aspects of the climate change problem and proposes a new policy, named the “Climate New Deal”. It deals with: (i) Reorientation from a high-carbon economy to a green economy; (ii) The intensive use of radically new technology, e.g., “Seawater Steam Engine” technology for the simultaneous production of thermal and electric energy and drinking water; and (iii) The intensive use of energy efficient technologies and RES technologies, especially in transport.

1. Introduction

Today, the majority of people no longer doubt the existence of anthropogenic climate change. However, there will always be individuals or interest groups who will try, directly or indirectly, to oppose this axiom. The reasons for such thinking include the following: fossil fuel lobbyists will continue to pursue their economic interests [1,2,3]; some people are unable to deal with this extremely unpleasant situation, resulting in a defense mechanism of negation [4]; some people are inclined to relativize scientific theses and evidence of from climate change [5]. This paper is based on evidence of climate change as established by numerous scientists. The authors agree with the fact that climate change is primarily caused by anthropogenic factors (i.e., the use of fossil fuels, and consequently, greenhouse gas emissions) for which there is a consensus of 97% of scientists worldwide [6].
The World Meteorological Organization (WMO) has laid out a set of seven main climate change parameters: (1) Surface Temperature, (2) Ocean Heat, (3) Greenhouse Gases, (4) Sea Level, (5) Ocean Acidity (pH), (6) Glaciers and (7) Sea Ice [7]. The first four parameters (1–4) are showing increasing trends, while the other three (5–7) are decreasing, as shown in Figure 1.
The World Meteorological Organization (WMO) publication, The State of the Global Climate in 2018 (2018) [8], provided an overview of the state of the climate in 2018 considering global temperature as a dominant parameter of climate change. The Special Report of the Intergovernmental Panel on Climate Change (IPCC) (2018) [9] stated that human activity had already caused an increase in global temperature by 1 °C before 2017 (i.e., in the possible range from 0.8 to 1.2 °C) in relation to the pre-industrial period. It was estimated that the increase in global temperature will probably reach 1.5 °C between 2030 and 2052 if CO2 emissions continue to increase at the current rate. However, the fact is completely overlooked that the temperature on Earth will not instantly decrease, even if humanity completely cuts it CO2 emissions, because the climate has its own inertia, and most probably will not follow the curves associated with various scenarios shown in the IPCC’s Special Report [9].
The study, Economic Losses Poverty & Disasters (1998–2017) [10], which considers the period of the last 20 years, describes the drastic consequences of climate change:
  • 562,677 people killed–91% of all disasters (which include people who have been injured, lost their home or those who were in need of emergency medical assistance) have been caused by climate change, i.e., floods, droughts, extreme temperatures, storms and other weather extremes.
  • 433 million people suffered from climate change (about 22 million people a year), as shown in Figure 2. In the 20-year period, there were 329 disasters annually, in contrast to the period of 1978–1997, during which there were 165 disasters annually, which means that the number of disasters doubled.
  • US$ 2245 billion economic losses caused by climate change in the last 20 years, or an average of US$ 112 billion annually [10]. The distributions of economic losses are shown in Figure 2.
The questions that inevitably arise are “Is someone responsible for the death of 562,677 people and injuries to 4.33 billion people in the past 20 years?” or “Have we really done enough to save human lives and prevent disasters?” Another question could also arise: “Who will be responsible for future deaths and climate-related disasters, the numbers of which will obviously increase”.
On 4 June, 1992, the United Nations (UN) adopted the International Environmental Treaty, the United Nations Framework Convention on Climate Change (UNFCCC) [11]. Since its inauguration in Berlin in 1995, a Conference of Parties (COP) has been organized every year, with the last COP 25 being held in Madrid in 2019, where conclusions (according to the Paris Agreement) were missing, because consensus among all countries could not be reached. Due to the COVID-19 pandemic, COP 26 in 2020 was postponed to November 2021 [12], and so two more years were lost.
The Kyoto Protocol [13] came into force on 16 February, 2005, when it was ratified by Russia (even though it was first proposed on 11 December, 1997). Given that the countries that ratified it comprise only 61% of polluters, it is clear that this agreement has failed to unite all countries. Rosen [14] gives an extensive analysis covering more than 130 scientific and other relevant references, and lists the reasons why the Kyoto protocol can be considered a failure. Other authors also point to the shortcomings of the protocol with a special view on the strangeness of the situation: “Within the international regime, we now have the odd situation in which the Kyoto system still exists alongside the Paris Agreement” [15]; as well as to the problems of sustainable development: “Future global climate change frameworks should focus on balancing the impact on economic and environmental performance in order to ensure sustainable development, especially for developing countries that have a low capacity to mitigate emissions” [16].
The Paris Agreement [17] was finalized on 12 December, 2015, and came into force on 4 October, 2016 after being ratified by the European Union. By December 2016, 194 member states of the UNFCCC had signed the Agreement, with 118 ratifying it. However, it is already clear that the realization of its +1.5 °C and +2 °C targets related to pre-industrial times is unrealistic (according to recent reports the World Meteorological Organization, the global average temperature reached 1.1 °C above pre-industrial levels in 2019 [18]).
The UN itself is currently ineffectual at solving this problem because, even with the organization of 25 COPs, numerous resolutions, papers and two global agreements (Kyoto Protocol and Paris Agreement), changes are not occurring fast enough to slow the temperature increase.
Given the above, we conclude that the UN currently has no real solutions to effectively control CO2 emissions and, consequently, global warming, or no appropriate “weapons” or realistic strategy.
The only solution the UN appeals to at the moment is the implementation of the Paris Agreement, which uses the vague terms mitigation (without any quantitative indicators and methods to achieve this) and adaptation, assuming that climate change will occur slowly without taking into account the fact that there may be cataclysmic consequences in the near future.
This paper, among other things, presents criticism of the UN’s policy of fighting climate change up to this point, because the temperature of the planet has been rising faster and faster from 1992 to today. If no significant steps have been achieved in 28 years (on the contrary, things are getting worse), who or what guarantee is there that there will be results in the next 28 years? All this leads to the conclusion that a radical U-turn is necessary in the UN’s policy of solving the climate change problem and in the search for the right “weapons” to fight climate change.

2. Methodology

How can the problem of climate change be solved? It is crucial to first select critical points, which, in our opinion, are:
(I)
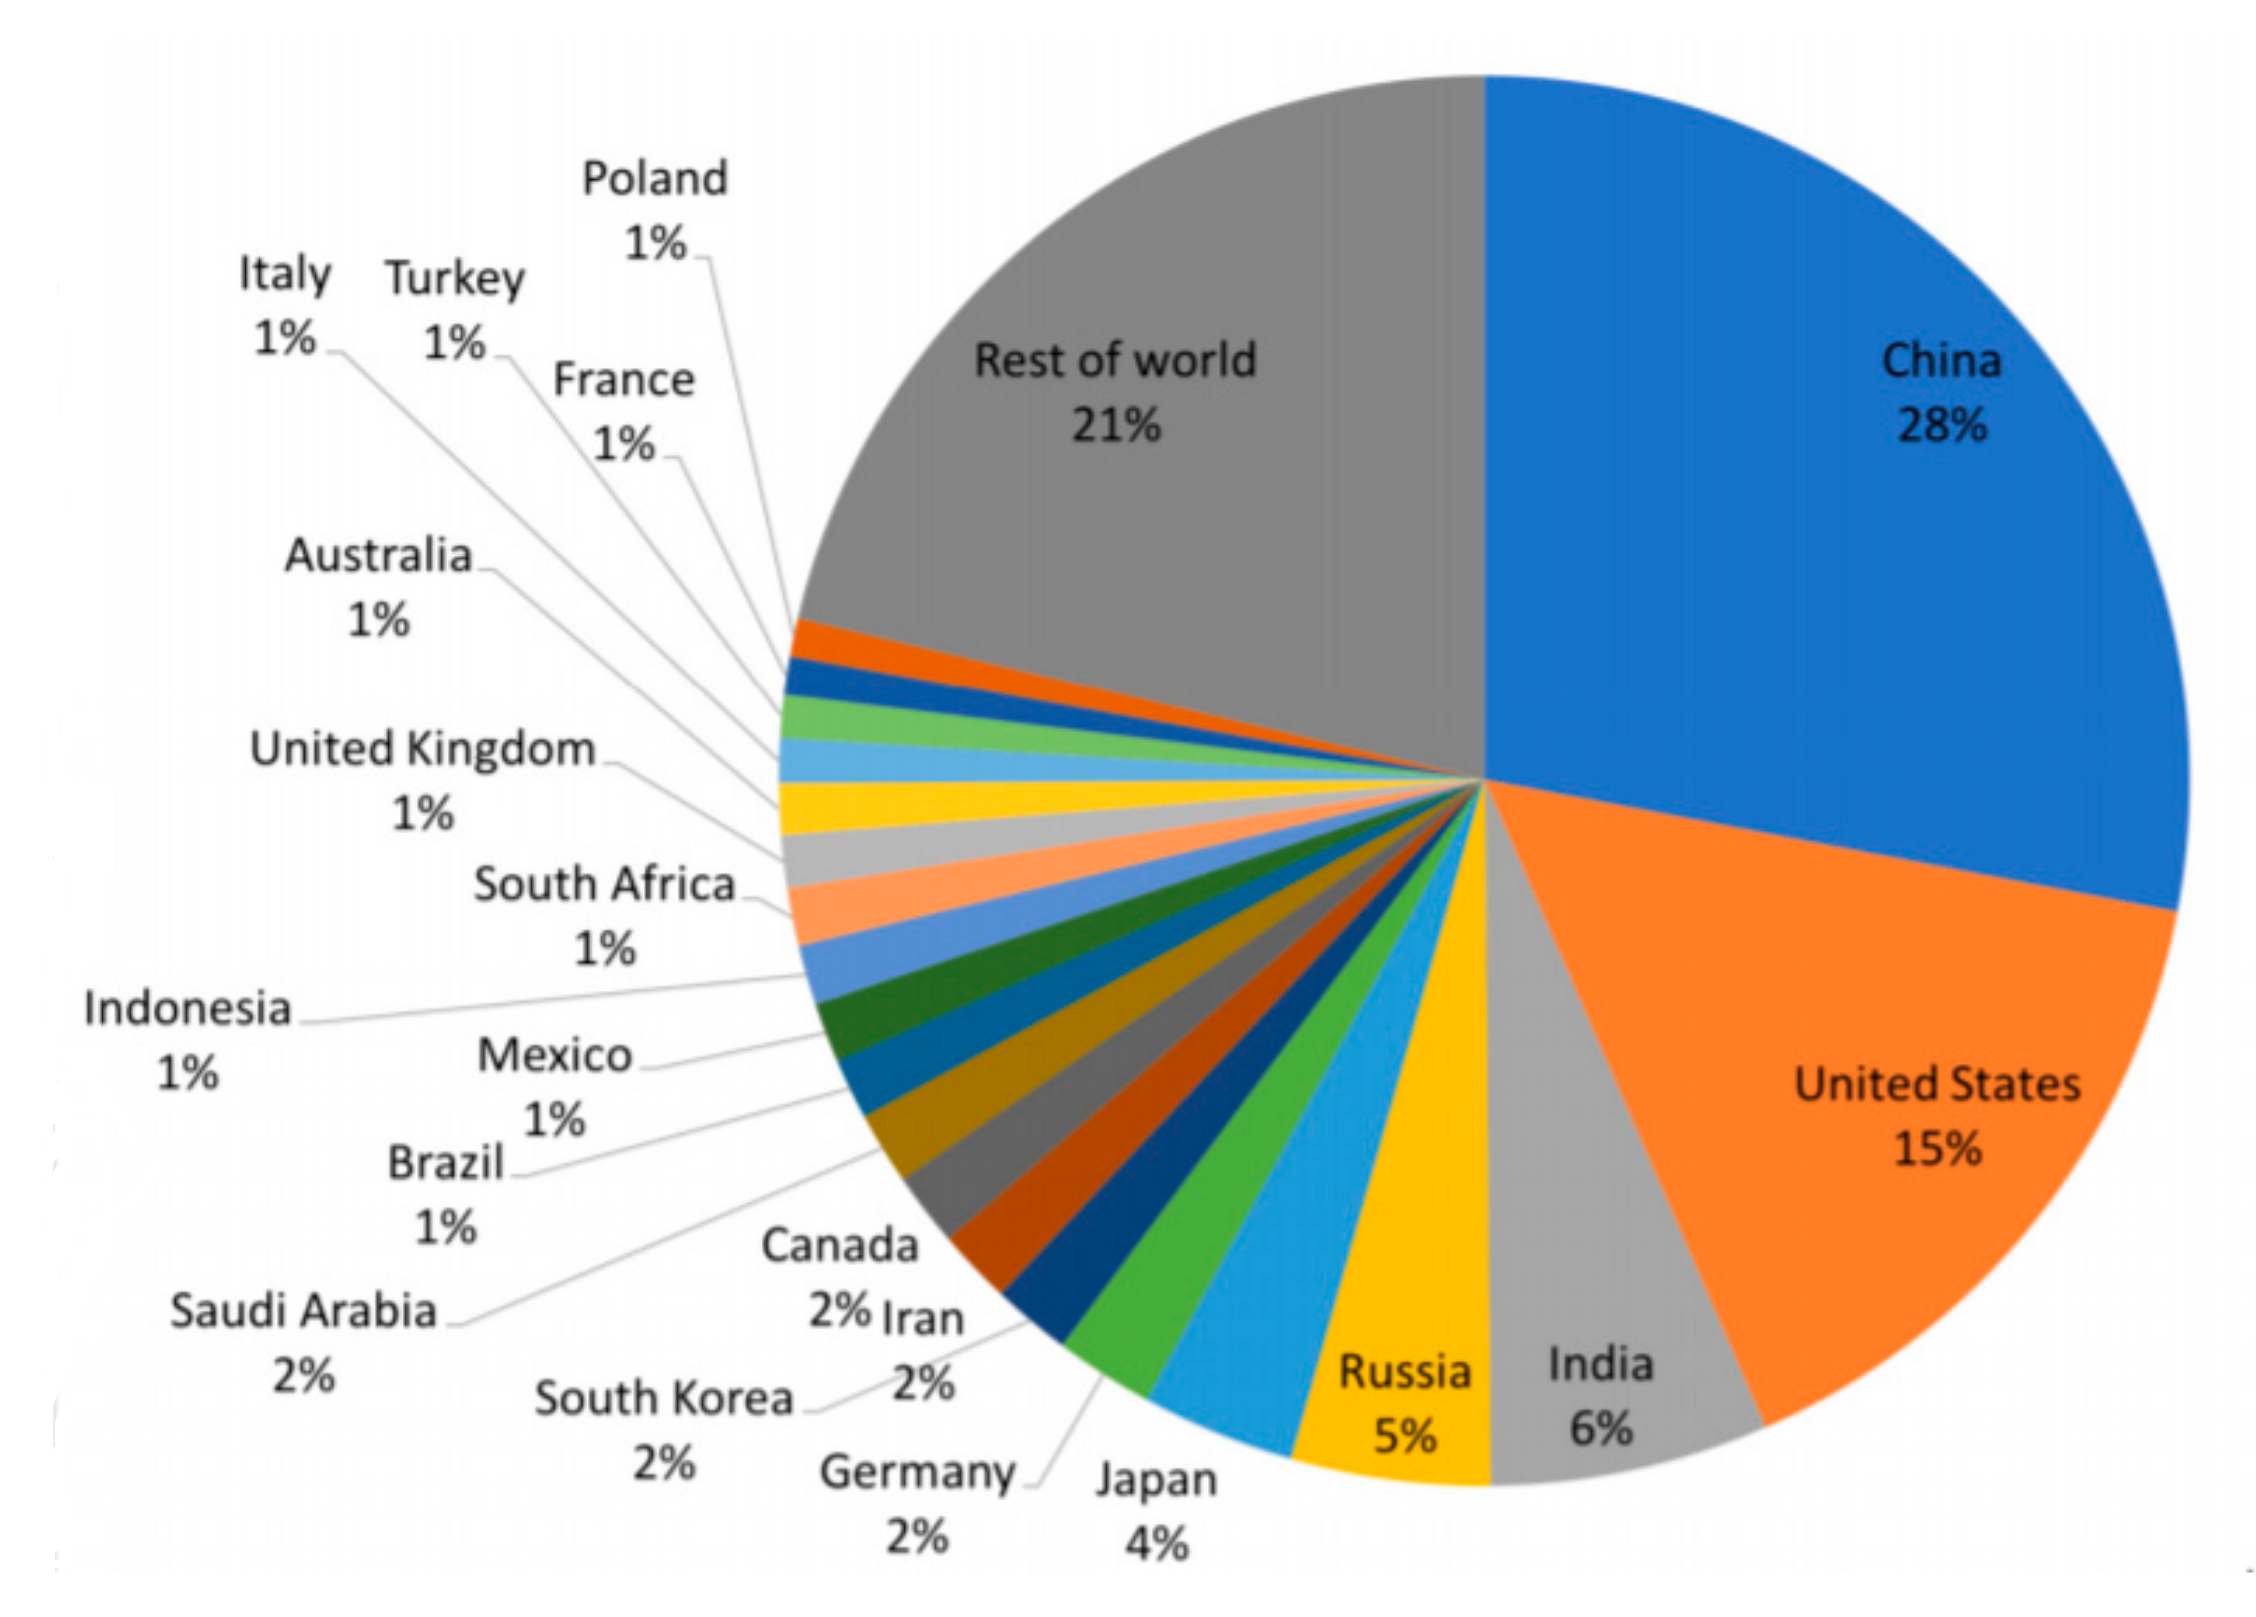
damage due to climate change increases every year and the burden of that damage is not equally distributed among all countries (CO2 emissions differ significantly from one country to another, i.e., five countries contribute 60% of total CO2 emissions and all other countries in the world 40%);
(II)
criticism of global taxing policy proposed by economic experts;
(III)
the Paris Agreement should be revised;
(IV)
high-carbon economies must reorient themselves to total green economies using innovative technologies that can change the current trend of global temperature increase as a result of GHG (especially CO2) emissions.
This paper proposes solutions to the above problematic points. It discusses a model of a fairer distribution of the burden of damage caused by climate change (Section 2.1), presents an expert view on the economic methods and models used in IPCC study (Section 2.2), proposes a new climate agreement, the Climate New Deal (Section 2.3), and proposes a solution for the fight against climate changes using an innovative new technology, the Seawater Steam Engine, that can produce both energy and drinking water using three natural sources (renewable energy sources, seawater, and gravity); by applying this technology, every city/settlement can become a sustainable community (Section 2.4).
Before the paper provides solutions, point by point, it stresses one key question: Will climate change occur slowly or rapidly? Today, there are many analyses, models and scenarios that try to predict increases in global temperatures. However, nobody can currently predict, with a high-degree of certainty, how climate change indicators will develop, because everything is, before all else, dependent on the capacity of climate to maintain balance. This is a physical and technical challenge.
What we know for certain is that global temperature is still on the rise, as are sea levels, as shown in Figure 2. The left side of Figure 2 shows the increase in global temperature from pre-industrial times to 2017, according to NASA Global Climate Change, Global Temperature (2019) [19], and the rise of sea level in the same period, according to NASA Global Climate Change, Sea Level (2020) [20]. These data clearly indicate that the global temperature has risen by around 1 °C and the sea level by 95 (±4) mm (most recent measurement taken in July 2020) in relation to pre-industrial times.
Most forecasts of the future rise in temperature remain conservative, meaning that they have a steady-state model of the climate. They suppose that, with today’s CO2 emission rates, or somewhat reduced rates, the changes in temperature will be slow, and that the global average temperature will increase by 2, 4 or 6 °C by 2100 [21].
However, the climate system is much more complex than it seems, and is essentially an unstable system (it should be modelled as a relationship between two fluids, i.e., sea water and air; at the contact point between these fluids, i.e., in the approximately 1-mm thick layer covering 2/3 of the surface of Earth where CO2 dissolution takes place, key physical and chemical changes take place) in which small changes in one parameter can cause enormous changes in the entire system and lead to a climate breakdown. What is especially overlooked is that the climate is not a laboratory environment for scientists to experiment with and manage (with repeated experiments in case of mistakes). Rather, all of humanity is in a “climate laboratory” and no one knows exactly the outcome of this “experiment”.
In order to develop this point, we can use a dynamic model of the system and consider a similar system in an unstable balance. To illustrate such a system, we here use a metaphor and compare the climate to the Leaning Tower of Pisa. As it is commonly known, the lean of the tower increases by around 1 mm annually; from the time of its construction until 1990, the tower has inclined by around 4 m from its axis. It is obvious that the leaning of the tower does not happen and at the same rate, culminating with a soft landing on the horizontal surface, but rather, that at some point there will be a collapse. In other words, this breakdown moment for the tower is the crucial point in time and is irreversible.
A similar situation might be happening to the climate, because the rising temperature may lead to a point where a sudden change could occur in the relationship between the water and the air, and there could be such changes in the climate (hurricanes, flooding, etc.) that would lead to a climate breakdown.
What is not understood (and is implicit in the improper steady-state view) is that the problem is not that the climate cannot maintain the high CO2 concentrations that are soon expected (we know that there have been much higher concentrations of CO2 in the atmosphere and much higher global temperatures in the Earth’s history); rather, the problem is that the changes in temperature are too impetuous for a climate in an unstable balance, meaning that its breakdown is highly likely.
When? Of course, nobody knows this; the most pessimistic forecasts claim that this could happen within a few years, while the more optimistic forecasts see it happening in several decades. We think that the forecasts predicting a slow increase in global temperature by 2100, with today’s or somewhat reduced CO2 emissions, are highly unrealistic. Our opinion is that climate change will not occur slowly but impetuously, with climate collapse being unavoidable if current and/or somewhat reduced CO2 emissions continue. For that reason, we think that a new systematic approach is needed, instead of just correcting current approaches and processes.

2.1. A Model of Fair Distribution of Expenditures

High-income countries, as well as countries with the highest CO2 emissions, are not interested in helping other countries solve their problems even though the issue of climate is a problem for all humanity. This could be a key point in negotiations to address the lack of success in the past, but also future climate agreements. China (28%), USA (15%), India (6%), Russia (5%) and Japan (4%) contribute to 58% of total global CO2 emissions, as shown in Figure 3 [22].
Therefore, it is logical to ask: “How can we ensure fair distribution in international endeavors for climate protection and simultaneously ensure that the world manages to overcome the impending climate change cataclysm?”
The answer to that question has actually already been provided in Table 1 (data downloaded from the study Economic Losses Poverty & Disasters (1998–2017) [10]. Table 1 lists the data of the absolute value of individual countries’ share in GDP (Recorded climate-related disaster losses per income group compared to GDP losses from1998 to 2017). High-income countries have US$1432 billion of losses, or 0.41% of GDP, upper-middle-income countries US$567 billion or 0.60% of GDP, lower-middle-income countries US$194 billion or 1.94% of GDP, and low-income countries only US$21 billion or 1.77% of GDP (data are shown in the second and third row, respectively, in Table 1).
The first row of Table 1 shows total GDP (billion US$) per income group of countries in the period of 1998–2017, and the fourth row shows countries with significant CO2 emission contributions in 2015 [22].
Upon completion of this paper (2020), comparing Climate-related disaster losses per income group compared to GDP losses 1998–2017 as well as the emissions of the five countries producing 60% of total CO2 emissions, and as an answer to the aforementioned question related to fair distribution among countries, we first calculated how much is required to build new, sustainable energy systems.
In that sense, we started with the required funding to build a Total Renewable Electricity Scenario, as calculated in [23], and determined that this scenario requires less than 1% of GDP. These calculations take into account the increased value of investing in such a system, but investments in the energy required to build this system were not calculated, nor was the recycling of equipment after the expiration of its lifetime, all of which could significantly contribute to the required investment. In addition, these investment estimates should also include stimulus investments in energy efficiency technology in all sectors. Therefore, the starting investment value of 1% of GDP should be proportionally increased by the obtained energy and recycling energy, while energy efficiency technology investments should not exceed the investments in the Total Renewable Electricity Scenario (below 1% of GDP in any case). All this leads to the conclusion that investments in the development of new sustainable energy systems, i.e., technology (“weapons”) against climate change, could conceivably cost 2% of the GDP of all the countries in the world (value shown in row 5 of Table 1).
On the other hand, since absolute values of total GDP (billion US$) for lower-middle income and low income countries are far below the absolute amount in high income countries (upper-middle income countries fall behind by a factor of 4, lower-middle by a factor of 21 and low income by a staggering 294 behind high income countries), it makes sense to conclude that high income countries should use a part of their 2% allocation to prevent climate change for lower-middle income and low income countries. The proposed model (Figure 4) is to set this figure to 0.5% of high income countries’ GDP. So, all high-income countries would allocate around 2% of their GDP, of which 0.5% of their GDP would go to lower-middle income and low income countries (in proportion to their GDP, i.e., 14:1—except for India, which has high CO2 emissions), as shown in row 7 of Table 1, while high income countries would apply 1.5% of GDP to develop and build new technology to combat climate change (row 6 of Table 1).
Even though China is the largest global polluter, with 28% of global CO2 emissions, and Russia a significant polluter, with 5% of global CO2 emissions, these two countries are upper-middle income countries, and it is better that they direct 2% of their GDP against climate change towards developing and building technology. With 6% of global CO2 emissions, India is a significant global polluter, but this is a country from the lower-middle income countries group. For that reason, it would be best that this country allocate 2% of GDP towards the development and creation of new sustainable energy systems.

2.2. View of the Economic Methods and Models Used in the IPCC Study

Can the problem of climate change be resolved with the recommended economic methods? A significant part of the answer to this question is provided by the Stern Review [24], which considered the effect of climate change on the global economy. Stern’s attitudes regarding climate change and policies related to its resolution can be seen in the following quote: “Climate change is the greatest market failure the world has ever seen, and it interacts with other market imperfections. Three elements of policy are required for an effective global response. The first is the pricing of carbon, implemented through tax, trading or regulation. The second is policy to support innovation and the deployment of low-carbon technologies. And the third is action to remove barriers to energy efficiency, and to inform, educate and persuade individuals about what they can do to respond to climate change.” The Stern study essentially represents a very positive step towards solving climate change, especially because it demanded urgent resolution of the problem back in 2006, and was a strong proponent of innovation: “The scientific evidence is now overwhelming: climate change is a serious global threat, and it demands an urgent global response”.
However, the problem of climate change is still primarily addressed in the pricing of carbon, through taxing, trading, or regulation, although the climate agreement, i.e., the Kyoto Protocol (in which a large number of countries committed to reducing emissions) showed that such an approach did not yield the expected results.
Following Stern’s approach, Nobel laureates William D. Nordhaus and Paul M. Romer [25,26,27] undertook an economic analysis by constructing models that explained how the market economy interacts with nature and knowledge, which the IPCC has adopted as policy in its Special Report [9].
Their scenarios (global taxing policy) have been criticized by economic experts [28,29]. An assessment of a rapid and significant reduction in CO2 emissions and, consequently, a slight increase in temperature by 2100 (Figure 5) must include aspects of “structural uncertainty” in the creation of such models [30].
Another problem is that innovation cannot occur at the speed, quality, and intensity that is required to counter climate change, whatever the regulations and measures may be, since the tempo of innovation (as well as its quality and intensity) depends on numerous parameters as well as the natural resources at our disposal to apply a given innovation in the quantity required to contribute to climate stabilization on a global level.

2.3. New International Climate Agreement

Today, the UN and most scientists take the Paris Agreement as the key policy addressing the climate change problem, with set goals as defined in Article 2(1) of that Agreement [17]:
  • Holding the increase in the global average temperature to well below 2 °C above pre-industrial levels and pursuing efforts to limit the temperature increase to 1.5 °C above pre-industrial levels, recognizing that this would significantly reduce the risks and impacts of climate change;
  • Increasing the ability to adapt to the adverse impacts of climate change and foster climate resilience and low greenhouse gas emissions development, in a manner that does not threaten food production; and
  • Making finance flows consistent with a pathway towards low greenhouse gas emissions and climate-resilient development.
Article 2(2) states: “This Agreement will be implemented to reflect equity and the principle of common but differentiated responsibilities and respective capabilities, in the light of different national circumstances.”
So, this agreement sets the following as the primary goals: limiting the increase of global average temperature to 2 °C above pre-industrial levels; increasing the ability to adapt to climate change and creating consistent finance flows, while Paragraph 2 states that the agreement will be implemented following the principles of equity and the capabilities of different parties.
The policy of the Paris Agreement looks more and more like common sense, which provides humanity with false hope regarding a solution, in particular because this agreement was signed by 194 member states of the UNFCCC by December 2016 and ratified by 118 of them. We are aware that our criticism of the Paris Agreement might cause great controversy, especially after setting out a completely different view with regard to solving the climate change problem.
To accomplish Article 2(2) of the Paris Agreement, it was necessary to establish Nationally Determined Contributions (NDCs), as defined by Article 4(2): “Each Party shall prepare, communicate and maintain successive nationally determined contributions that it intends to achieve. Parties shall pursue domestic mitigation measures, with the aim of achieving the objectives of such contributions.”
So, NDCs essentially represent the instruments/tools with which to realize the goals set out in the Paris Agreement. This means that cooperation among parties is key to accomplishing long-term goals. Five-year controls of accomplished results were also established, with the first evaluation taking place in 2023.
Unlike the Kyoto Protocol, representing a top-down international climate agreement (one ordered to all signatory countries, because the CO2 emission quotas have been determined “above” for each individual country, with countries under the obligation to comply with these quotas), the Paris Agreement, with its NDC instrument, is essentially a bottom-up solution, which means that it is an international climate agreement that starts with the parties working towards the targets set by the Paris Agreement (limiting global temperature), whereby this agreement is more flexible and more respectful of the sovereignty of nations.
However, despite the fact that the first results not yet come in, it is reasonable to assume that nationally determined contributions to protect the climate will be below expectations in 2023.
Namely, it is not possible to successfully “wage war” against climate change through a bottom-up type of organization of parties, since the NDC system lacks any sanctions for parties that do not abide by what they proclaimed, i.e., for the obligations they have accepted—instead, more or less everything is done on a voluntary basis. So, the problem of bottom-up style of organization is that this system has no chain of command (this can exist only through a top-down style of organization), and without a chain of command and sanctions for irresponsible parties, the NDC system simply cannot provide results, and the climate will certainly not wait for the signatories to get serious about what they have promised to do on the national level.
On the other hand, the need to actually do something about climate change can also promote the false belief that NDCs and COPs are better than nothing (with even the smallest success exaggerated and failures ascribed to the randomness of life), so such an NDC partnership could remain in effect for years without yielding significant results. In this case, the NDC instrumentation could become bureaucratized and an obstacle to alternative, essentially more efficient policies and more efficient methods of solving the problem; when this finally occurs, it might be too late for humanity, because the climate is a living laboratory that we inhabit, so we cannot make mistakes.
No international climate agreement or organizational structure can help us if we do not have strong enough “weapons” (technology) to combat climate change which are available to all countries and which can provide visible results very quickly.
In any case, we stand by the viewpoint that, in terms of content, organization and functionality, the NDC is a very complex and inefficient method of action against climate change, and that such a system, with erroneously set targets from the Paris Agreement, will become a hindrance to establishing a good policy and to implementing a more efficient strategy in the battle against climate change.
We therefore emphasize that we are proposing a means by which to solve the complex problem of climate change, and we consider it our responsibility to disseminate this information through the publication of this paper.
What is the problem with the Paris Agreement? The problem is clear from its poorly set objective, i.e., “Holding the increase in the global average temperature to well below 2 °C above pre-industrial levels …” [17]. To understand the mistake here, it is first necessary to determine the causes and consequences of climate change.
It is clear that the cause of global warming is a fossil-fuel-based economy, named a “high-carbon economy” (this term is practically unused in the literature). Figure 6 presents a symbolic representation of cause and effect, clearly showing that humanity cannot directly act upon consequences (global warming), but can only directly affect causes (high-carbon economy), seeing that the Earth is not a boiler heating up water to a certain temperature, after which the thermostat will turn off the heater, i.e., the high carbon economy.
In other words, consequences cannot be set as objectives. This means that the objective can in no way be to limit global temperature, because humanity has no direct handle on the consequences—it can only directly affect the causes. Two questions naturally follow from this: “What happens when the global temperature reaches the set value of 2 °C?” and “Who will be held responsible”.
The answer to the first question is that if nothing serious is done (which is not likely with the Paris Agreement), the global temperature will relatively quickly reach and exceed the 2 °C value, while the answer to the second question is that nobody will bear responsibility, because it is unknown who should be held responsible, and by whom. In such a scenario, new agreements will be invented to limit global temperature to another, greater value, e.g., 4 °C or 6 °C or 8 °C. All this looks pretty ironic because, on one hand, everyone is (supposedly) fighting global warming, while on the other hand, the temperature of the planet (evidently) is on a constant rise, so it is high time to use the Socratic method to destroy the false knowledge of sophists and to prove that this is but imaginary knowledge, i.e., ignorance, which could, in the present case of fighting climate change, be disastrous for humanity (NB. There are three stages to Socrates’ dialectics: irony, maieutic and definition of terms—irony is the first stage in which Socrates criticizes the knowledge of the arrogant sophists, proving that theirs is but imaginary knowledge, i.e., ignorance).
If the policy established by the Paris Agreement is unconvincing, the question arises of how to establish a new, realistic and feasible policy?
To give an answer to this question, an engineering approach is required (as opposed to an economic approach). Engineers have always been required to use limited resources to solve problems; such an approach recognizes that the first and most important step is to take into account all relevant aspects of the problem, and only then to clearly set the objective. This means that it is not enough to conclude that anthropogenic CO2 emissions are too large, that there are more and more CO2 in the atmosphere, that the global temperature is rising, that the glaciers are melting, that many countries do not want to give up their fossil fuel-based development, that climate change damage is growing year-to-year, etc. What is necessary is to devise a dynamic model for such a system, i.e., to ask how the system would behave during the period when changes are made. The objectives are described as general directions of change, making the repair of the climate primarily the work of an engineer, more so because the engineer can innovate and build new technology which is required to combat climate change.
After Socratic irony, it follows that we should use his maieutic (i.e., the skillful posing of questions and suggestion of possible answers in order to uncover the path to truth) and start with the premise that humanity cannot survive without an economy (and it cannot currently turn it off), but it also cannot allow further global warming, so, squeezed between the causes and consequences, the only logical answer is the reorientation of high-carbon economy to a green economy. In other words, the only realistic solution to today’s situation is to reorient the economy.

Climate New Deal

Humanity’s only solution is therefore the reorientation from a high-carbon economy to a total green economy, which means that it cannot be a “somewhat green economy”. This has to occur in a very strict timeframe, with no allowances for mistakes or compromise.
This means that the limitations are very serious but not insurmountable for the problems of reorientation.
However, if reorientation targets are set this way, with strict limitations (primarily, the timeframe for the accomplishment of this goal), then a strict top-down strategy follows with regards to implementation, because the entire project of saving the climate must take place under strict control (i.e., with a chain of command). And what is the instrument to impose a common chain of command? It must be money (as the medium of exchange), i.e., a certain percentage of individual countries’ GDPs.
One question that comes up is how to achieve a fair distribution of efforts to save the climate. The answer to this question is already given in Section 2.1. of this paper, stating that all countries would allocate 2% of GDP to fight climate change, where high-income countries would use 1.5% of their GDPs to reorient their own economies, while the remaining 0.5% would be used to reorient the economies of lower-middle and low-income countries.
So, all the money in the world would be invested in the reorientation of today’s high-carbon economy into a total green economy. However, it is very important to have a precise definition of the term “reorientation”.
In essence, reorientation would mean building new sustainable energy systems which are based exclusively on renewable energy source technologies, until all countries reach 100% renewable energy usage, because then there would be no more anthropogenic CO2 emissions; however, the CO2 emissions resulting from the construction of these energy systems (embodied energy) must also be taken into account, as well as the parallel application of energy efficiency technology.
However, the economy is, in addition to the environment, related to the society it affects, and this category becomes exceedingly important in this dynamic, i.e., when moving towards the desired change.
All this means that society also has to significantly change and invest its efforts towards building completely sustainable communities, because if a community depends on external sources of energy and drinking water, these being key survival necessities at any given location, this means that it is not sustainable, because one cannot be “more or less sustainable”—one can only be either completely sustainable or unsustainable, and, when faced with cost-related criticism, one always has to keep in mind that sustainability has no price. This means that today’s cities and settlements should transition toward total sustainability. At first, this does not seem like a new notion, but sustainability as presented in this paper, intended to save the climate from further destruction, has precisely that meaning—independence of external sources of energy and drinking water, something that will strongly affect the form and structure of future cities as well as interpersonal relations therein, with particular emphasis on relationships in terms of production. As such this is a new approach.
Furthermore, debates may occur regarding whether future cities/settlements will be mutually linked with energy (and water) systems as parts of smart grids, which ensues from the logic of the interconnected system that is the Internet, or whether future cities/settlements will each ensure energy and drinking water independently. The authors are of the opinion that, in relation to energy and drinking water, future cities should not connect, as they do for information pathways (i.e., follow the logic of the Internet) or for traffic; instead, as has already been stated, they should be completely independent of external sources of both energy and drinking water, the current disappearance of which could endanger the lives and health of people living in these communities. So, from today’s mutual interconnection of cities/settlements, there should be a movement towards complete independence, with storage of energy and drinking water being particularly important.
In addition to these societal changes, a separate problem is the increase of human population on Earth, which will, in addition to increased energy needs, also increase the need for drinking water, something that could lead to greater shortages thereof.
In that sense, the estimates of World Resources Institute [31] show that by 2030, half of humanity could live in so called “high water stress” conditions, and by 2040, one in five countries could have a water scarcity problem, with water stress also affecting the largest economies, such as the United States, China and India.
Therefore, the reorientation from a high-carbon economy to a green economy will essentially require technologies that will be able to produce enough energy and drinking water, and to do so continuously throughout year, which means that special attention should be paid to both seasonal energy storage technology (without which the continuous supply of energy from RES cannot be ensured) and drinking water reservoirs.
However, an exceedingly important question is whether today’s RES technology can handle a completely new energy system to get ahead of climate change, because, on that path, there are three large obstacles that are summarized in the following subquestions:
  • Are there enough natural resources to construct the requisite RES capacities, and are there enough resources to construct energy storage systems to obtain adequate energy from RES technology?
  • Is RES technology efficient enough to build a sustainable global energy system at the rate required to prevent climate change?
  • Is the price of RES technology acceptable, and can it be equally available to both developed and less developed countries?
The authors are skeptical that there are sufficient natural resources to build the requisite RES capacities as well as to build energy storage technology, except for pump storage hydroelectric technology, which has the largest energy storage capacity. Scientists have highlighted the risk of running out of a number of elements which are crucial for RES technology. Some elements have limited availability and are increasingly used, including lithium, platinum, nickel, helium, phosphorous, indium, etc. [32,33]. In addition, the authors are also skeptical regarding the rate of building a sustainable global energy system with today’s technologies, while they deem that the prices of RES technology are such that new technologies are not equally available to both developed and less developed countries.
Due to these obstacles, the authors believe that completely new technology should be developed as soon as possible that would be simpler, cheaper and much more reliable and widely available to all countries, both in terms of construction and development, i.e., technology that could ensure the continuous supply to energy consumers, having the potential to take most of the burden of reorienting from a high-carbon economy to a green economy.
Why is it so important to have technology that continuously supplies consumers throughout the year? Because the logic of many small units making a big whole, or today’s algebraic addition of the share of various RES that ought to satisfy the needs of a country (numerous papers handle this topic), cannot ensure the continuity of supply to customers from renewable sources throughout the year, which means that in this manner, climate change cannot be solved. For that reason, today, we face situations in which individual countries have installed relatively big RES capacities (large investments), but these capacities are not being well-used.
Why is it important to ensure drinking water in addition to energy? The entire reorientation is a dynamic process in which all relevant aspects of the problem must be accounted for, and, in that sense, perturbations of a greater scale must be foreseen and stopped, given that they arise from large-scale migrations and conflicts due to a lack of drinking water, regardless of whether they are caused by droughts, flooding, storms or other extreme weather events [34]. So, in parallel to solving the energy problem, the drinking water problem must be solved, since no drinking water means that there is no life at any given location.
Only after taking into account all the relevant aspects of reoriention from a high-carbon to a green economy can targets be set, i.e., a new policy defined to resolve the climate change problem, named the Climate New Deal by the authors.
                     CLIMATE NEW DEAL
1. 
Reorientation from a high-carbon economy to a green economy, implemented as follows:
(a)
2% of GDP allocated by high income countries, with 1.5% of GDP for internal reorientation and 0.5% of GDP to aid lower-middle and low income countries;
(b)
2% of GDP allocated by upper-middle income, lower-middle income and low income countries for internal reorientation;
2. 
Radically new technology as a new strong “weapon” against climate change that:
(a)
can simultaneously produce thermal and electric energy as well as drinking water throughout the year
(b)
has a large potential for further development;
(c)
is available to all countries;
3. 
The application of energy efficiency and RES technology, particularly in transport;
4. 
Time for realization: 30 years.

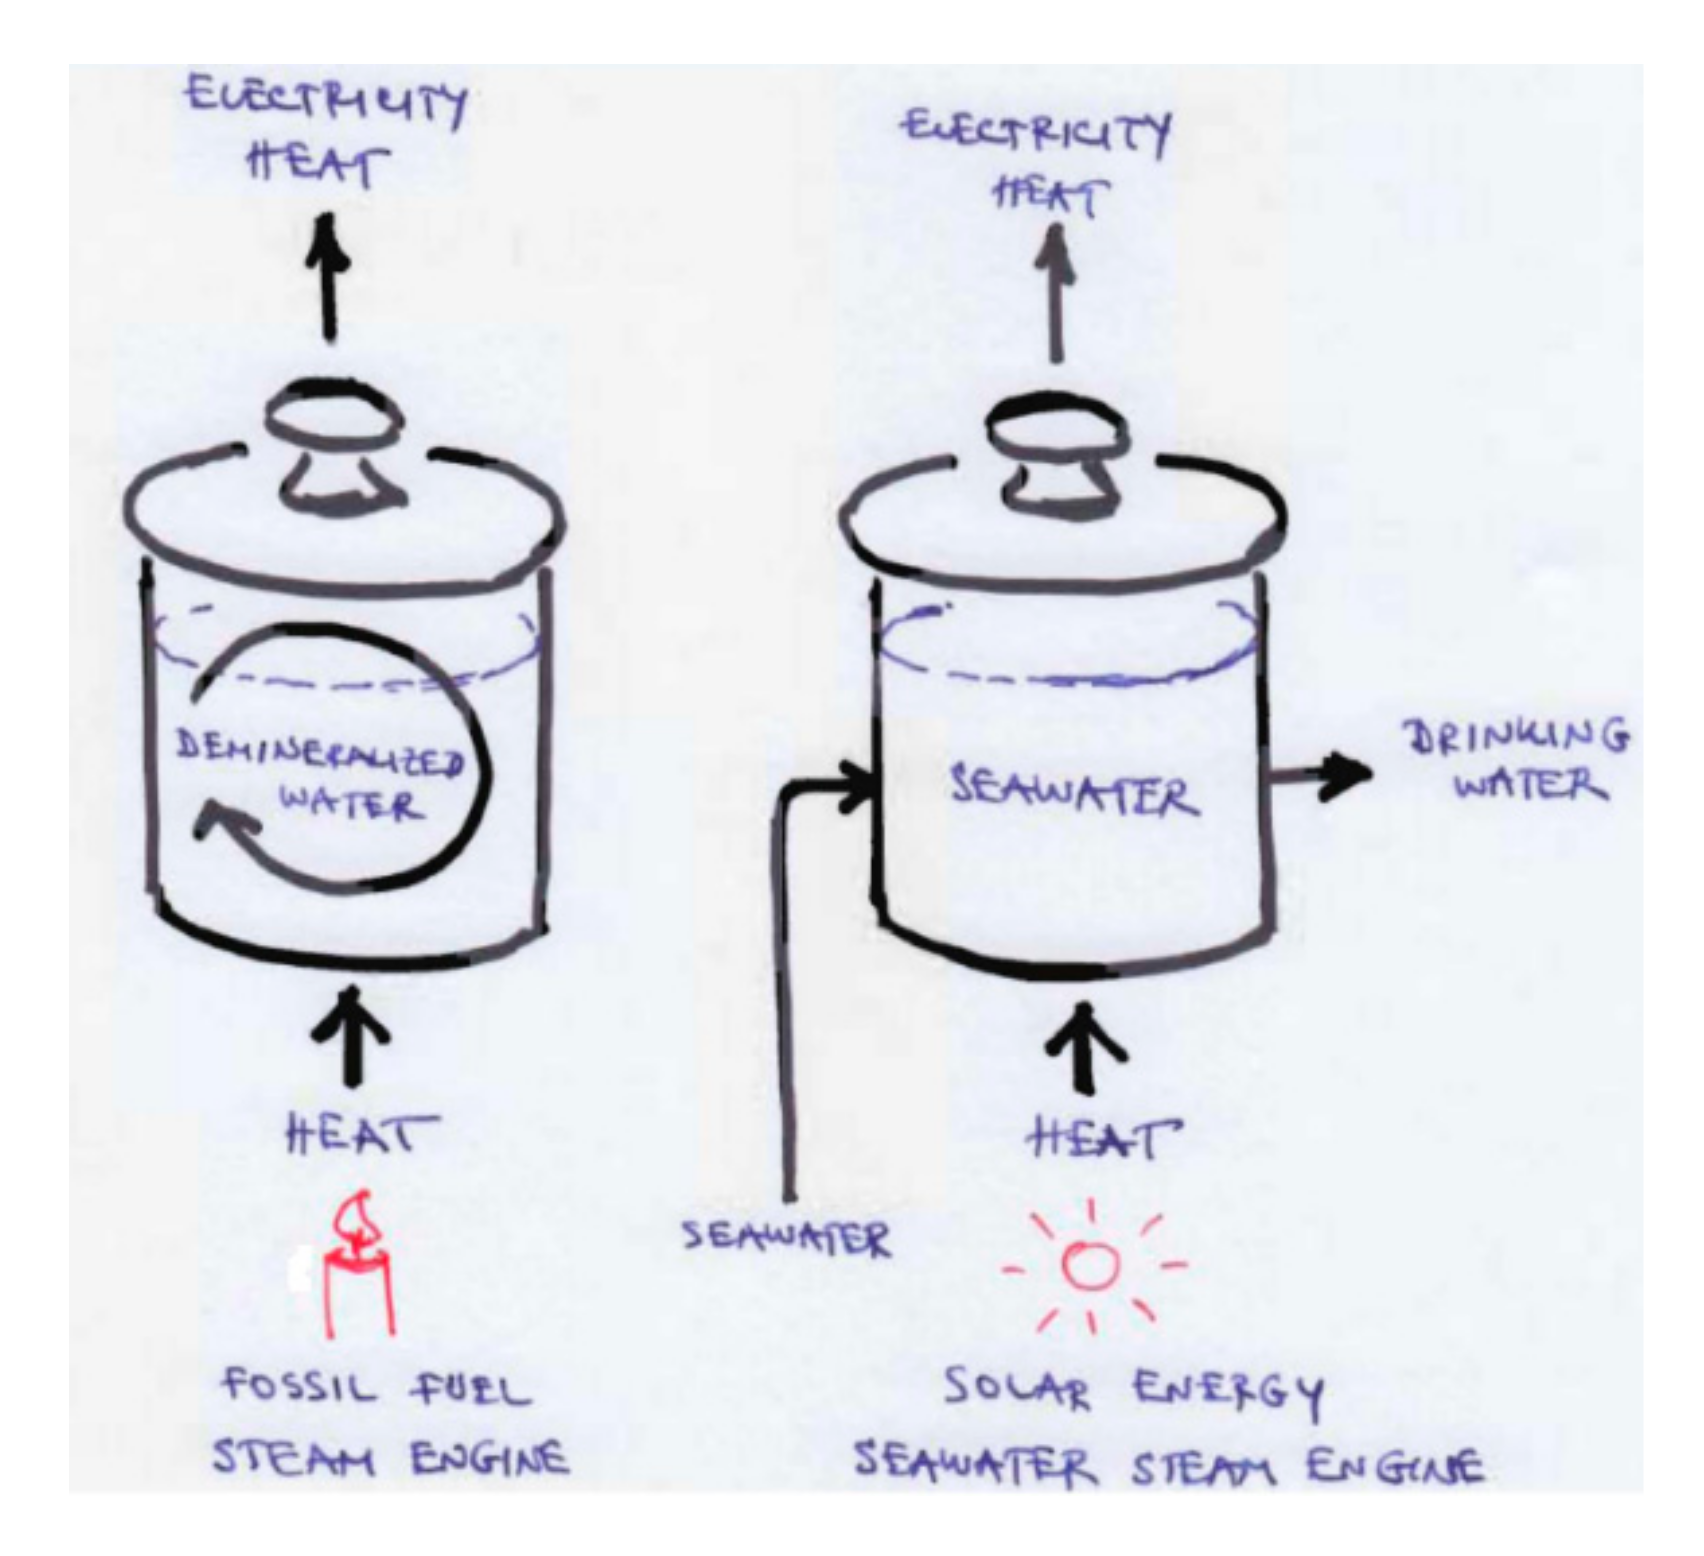
2.4. Seawater Steam Engine Technology—Technology to Combat Climate Change

2.4.1. State-of-the-Art Technology

The development of seawater steam engine technology began by solving the problem of continuous supply of energy to a settlement using a solar (Photovoltaic, PV, and Solar Thermal, ST) generator over an entire year (Figure 7). This problem is, in essence, very complex because of stochastic values (and the capacities to generate energy using a solar generator and of a settlement to consume this energy), so summer surpluses and winter deficits had to be brought in balance.
As seasonal energy storage, pump storage hydroelectric (PSH) was used since it has the greatest storage capacity compared to other storage technologies, and is a mature technology with relatively high efficiency (75–92%) that can be constructed at any location with a varying altitude.
The application of PSH technology obviates the need to use fossil fuels in ST power plants to ensure the continuity of supply when there is not enough solar radiation. The left side of Figure 7A shows a solar thermal power plant with direct steam generator (DSG) technology (avoiding the heat exchanger in the circuit of solar thermal collectors and turbines), still using fossil fuels as a substitute when there is no solar radiation, while the right side of Figure 7A shows PSH technology. Their integration and the elimination of fossil fuels comprise the system shown in Figure 7B, which ensures a continuous energy supply to consumers throughout the year.
Finally, Figure 7C shows the technological breakthrough because, instead of the previously obtained water steam, seawater flows directly through the collectors and then evaporates in a parabolic collector, afterward being separated in a high-pressure separator into steam and brine water (BW). Steam energy is transformed into electric energy in turbines and generators, while by condensation, the steam itself turns into drinking water after cooling and treatment, and may be stored for periods when there is insufficient solar radiation. Electric energy from the generator starts the pumps (PS) that pump seawater into the upper reservoir, the volume of which is enough to balance out summer surpluses and winter deficits, all with the purpose of continuously supplying consumers throughout the year.
According to the definition of radically new technology, the seawater steam engine represents a radical innovation based on (i) “different set of engineering and scientific principles” [35] which (ii) “incorporates substantially different core technology” [36] and which (iii) “serves as the basis for many subsequent technological developments” [37].
SSE technology is patented [38]; the present authors have published several scientific papers [39,40] on it, as well as a book in which they present its potential to launch the third industrial revolution [41].
In addition, in order for a technology to be categorized as radically new, it must be compared to the most similar “current technologies or ways of thinking”. In that sense, Figure 8 was created to show essential differences between the steam engine and the seawater steam engine, as well as the implications of its application.
In the Steam engine (Figure 8, left), thermal energy from fossil fuels (coal) is turned into output energy (thermal→mechanical→electrical), whereby demineralized water circulates in a closed thermodynamic system. In the SSE (Figure 8, right), thermal energy from RES is turned into output energy (thermal→mechanical→electrical), whereby the input seawater is a working fluid flowing through the open thermodynamic system which is separated into two stages: steam and liquid (brine, or highly concentrated seawater).
In two steps, current technologies can produce: (1) energy from RES (electric or thermal) and (2) drinking water (obtained energy from RES is used for produce water). SSE technology is the first technology that can simultaneously and continuously (i.e., in one step) produce both energy and drinking water, using seawater directly as the input fluid without prior desalination. Therefore, for one input (RES), SSE technology gives two outputs: (I) energy (thermal and electrical) and (II) drinking water, which represents a major breakthrough.
Furthermore, a significant breakthrough of SSE technology, compared to current technologies, relates to the field of application of seawater (as a working fluid) and the physical/chemical parameters that have not yet been explored.
The physical and chemical properties of seawater have not been researched under the following conditions (temperature, T = 300–350 °C, pressure, p = 80–120 bar, and salinity S = 0–120 g/kg). These parameters are prerequisites for the operation of SSE technology (getting seawater steam—vapor phase), as shown in Figure 9B. Current desalination technologies do not need such high temperatures, i.e., over 200 °C (Figure 9A). From previous studies, the following data were obtained for the physicochemical properties of seawater (T = from 273.14 to 468.06 K (194.92 °C), S ≈ 35 g/kg, p = 140 MPa (1400 bar) [42]; existing correlations and data within boundaries: T = 0–120 °C; p = 0–2 bar; S = 0–120 g/kg, [43]; T = 0–120 °C, p = 0–12 MPa (0–120 bar) and S = 0–120 g/kg, [44].
SSE technology, which essentially represents open thermodynamic system where an exchange of matter (water) and energy with the environment takes place, is founded on the following principles:
  • energy from RES as heat input;
  • seawater (or river, lakes, etc.) as the working fluid which flows in an open thermodynamic cycle;
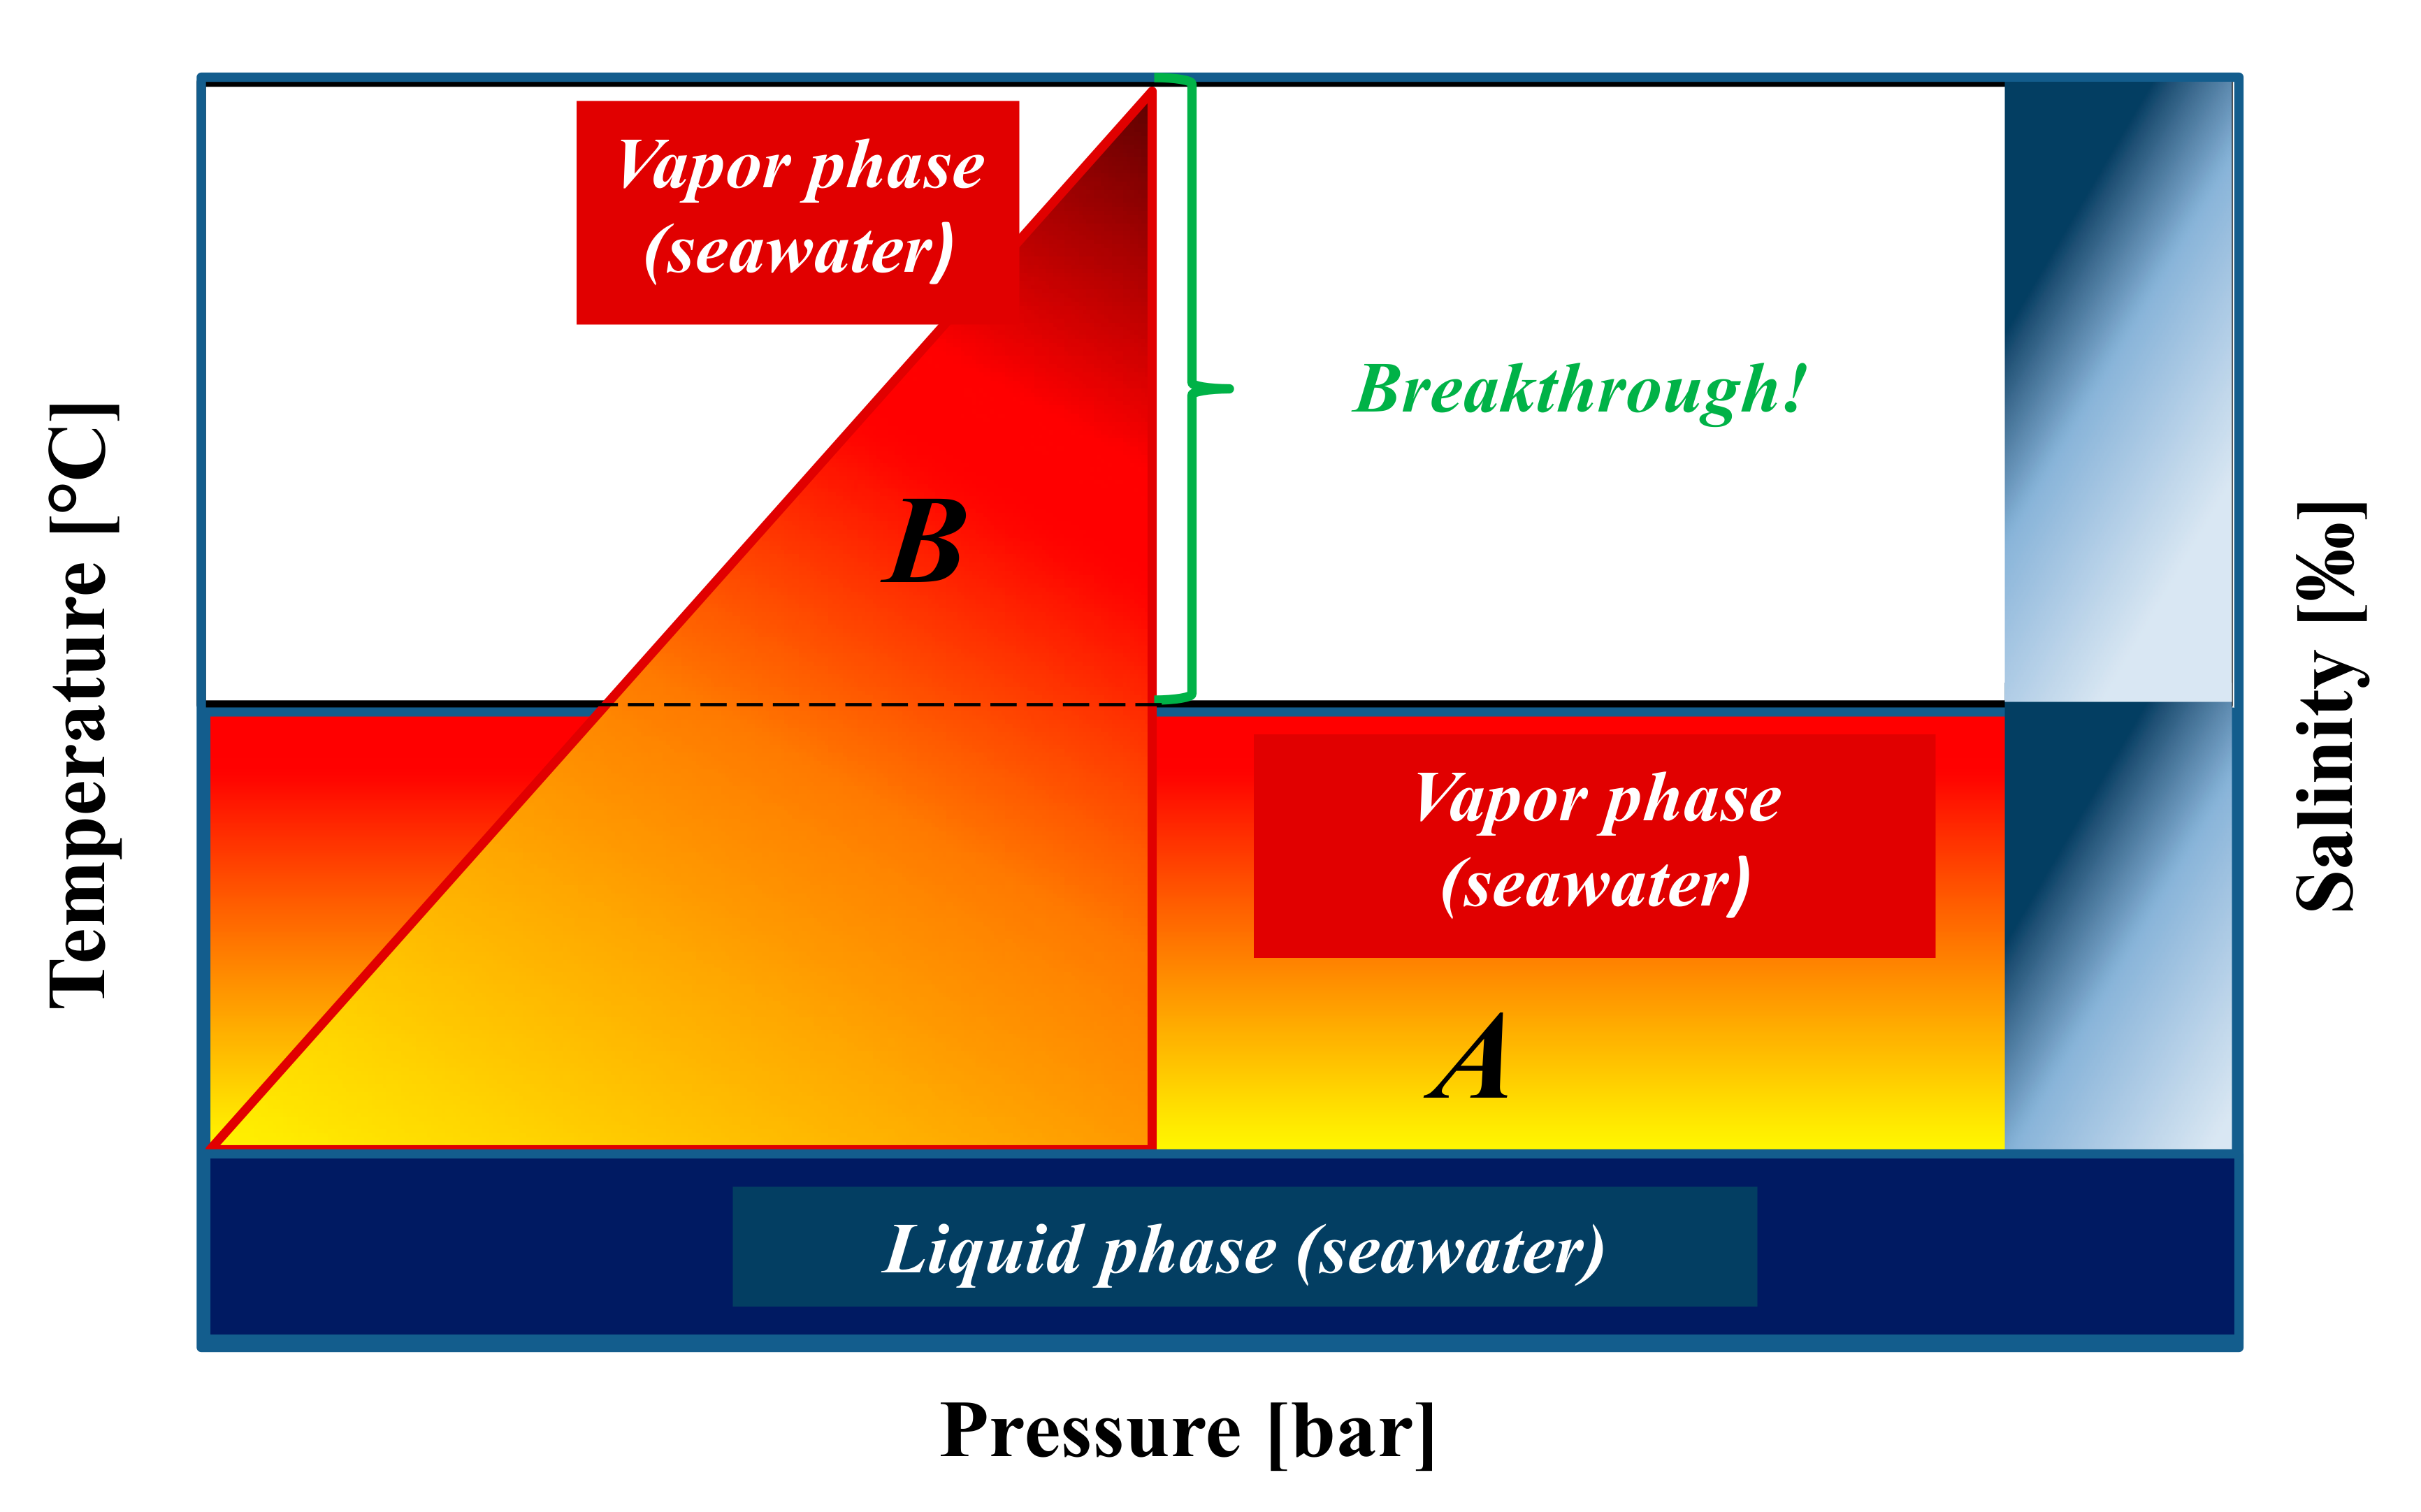
  • the use of seawater (as a working fluid) under the following conditions: high temperature (300–350 °C), high pressure (80–120 bars) and salinity (0–120 g/kg) – the parameters that have never been simultaneously applied;
  • future development of new materials that can withstand high temperatures and high pressure, as well as being resistant to seawater corrosion under the aforementioned conditions;
  • unknown physical and chemical processes of seawater evaporation and separation of seawater steam in the boiling process (a separation process in high pressure separator) under the aforementioned conditions.
  • Energy output (Electric energy + Heat) and simultaneous Drinking water output

2.4.2. Phase Transitions of Seawater in Seawater Steam Engine (SSE) Technology

The evaporation process of seawater as a working fluid in SSE technology (Figure 10A) begins when seawater is heated by an external source (solar, wind, other RES) and passes through a collector pipe, whereby there is a phase transition from the liquid to the vapor phase. The obtained vapor is separated in a high-pressure separator into steam and a liquid phase (i.e., saturated solution). The obtained vapor/steam is additionally heated and superheated steam is generated, which drives the turbine and generator, thereby producing electricity. At the same time, by passing through a turbine and cooling in a condenser, steam changes to the the liquid phase (Figure 10B). The obtained distilled water may be treated in a post-treatment processes (mineralization, chlorination, pH adjustment) and stored as drinking water which will be available to the end consumer throughout the year.

2.4.3. High Pressure Separator—Separation Process

One of the most important components of SSE technology is the high pressure separator. The authors call it the “heart of the system”. The prototype of a high pressure separator (Figure 11) was constructed in cooperation with the Faculty of Mechanical Engineering, University of Ljubljana (Slovenia) and company “Ecom-Ruše” (Slovenia). The technical characteristics of the high-pressure separator in laboratory conditions were determined at the Faculty of Mechanical Engineering, University of Ljubljana (Slovenia) [45]. Some of this laboratory research showed good results in comparison with the selected mathematical model.
For the efficient separation of seawater in the high pressure separator, it is necessary to define the physical and chemical parameters of the seawater at the inlet. During the separation of seawater within the high pressure separator (to the vapor and liquid phases), salt particles also exist in steam. This effect is called “carry over” and is undesirable. The steam is used to start the turbine, which can be damaged by the carry over effect, thereby reducing system efficiency. In the separation process, it is necessary to obtain dry steam.

2.4.4. Theoretical Research into SSE Technology and New Empirical Formulas

In previous research, the authors derived new empirical formulas relating to: Mass flows balance of separation process, Equation (1) [39]; Calculation of the nominal electric power of SSE generator, Equation (2) [46]; Calculation of produced heat energy of SSE generator (Heat energy output), Equation (3) [47]; Calculation of produced electric energy of SSE generator (Electric energy output), Equation (4) [47]; Calculation of drinking water volume (Drinking water output), Equation (5) [39]; Calculation of the upper reservoir volume of PSH, Equation (6) [39], as follows:
m ˙ v = 1 s w m ˙ M ˙ m ˙ H 2 O , s a t
P e l N O M i = ρ g H T E i η O S η S E η P S I R c o l l i E S i V A R T i
Q i = A c o l l · F · η ¯ o p t · Φ ¯ · E S c o l l i
E e l i = η Q E L · f m · A c o l l · F · η ¯ o p t · Φ ¯ · E S c o l l i
V D W = 1 ρ H 2 O · P e l N O M η M E · η T U R · Δ h i = 1 N f t D I R i · T S i
V = e   Ψ * P e l N O M Ψ + V r
Nomenclature: 
M—mass flow of incoming seawater; V—mass flow of vapor; mH20, sat—mass flow of water in the saturated solution; s—salinity of seawater; w—the ratio of mass flow of the non-evaporated part of water from liquid phase and mass flow of input seawater; Pel(NOM)—nominal electric power of SSE generator; ρ—water density (ρ = 1000 kg/m3); g—gravitational constant (g = 9.81 m/s2); HTE(i)—average total head (m); ηOS—efficiency of the open thermodynamic system; ηSE—efficiency of the collector field of SSE power plants; ηPSI—efficiency of the pumping system and inverter; Rcoll—conversion factor for conversion of mean daily radiation on a horizontal plane to mean radiation on the aperture of tracking parabolic collectors; ES(i)—mean daily solar radiation on horizontal plane at Earth surface; VART(i)—mean daily value of artificial water inflow which can be pumped by the SSE generator from sea into the upper reservoir; Acoll—the aperture area of parabolic collectors (m2); F—heat removal factor; η ¯ o p t —long-term average optical collector efficiency; Φ ¯ – long-term average utilization factor of solar energy based on Hottel-Whillier concept; ES(coll)—average daily value of the collected solar energy;   η Q E L —average value of conversion efficiency of thermal into electric energy; fm—load matching factor to the characteristics of the SSE generator; ηME—conversion efficiency of mechanical turbine power into electric generator power; ηTUR—isentropic (inner) turbine efficiency; ∆h– difference between the enthalpy of vapor at the inlet and outlet of the turbine; ft-DIR(i)—factor that describes the proportion of the number of hours of direct radiation exceeding 250 W/m2; TS(i)—insolation (duration of sunshine); V—total volume of the upper reservoir of PSH; Ψ, Ψ*parameters on the basis of location characteristics and technological features; Vr—reserve volume of the upper reservoir; i—time stage (increment) related to the dynamic programming; N—number of time stages (for time stage of 1 day, N = 365).

2.4.5. “Core Technology”

In essence, SSE technology is a “core technology” that is not limited to the application of solar thermal power, but can also input electric power from solar photovoltaic generators as well as wind, biomass, geothermal and marine generators (Figure 12). All these generators produce electric energy that needs to be converted into thermal energy, with which the seawater will again be brought into similar processing conditions as with solar parabolic collectors.
On the other hand, SSE technology is not limited only to PSH technology of energy storage; other forms of storage technology can be applied (Figure 12). However, it is important that this other technology is able to balance seasonal fluctuations of RES energy (summer surpluses and winter deficits of solar power) in order to ensure a continuous supply of energy and drinking water to consumers.

2.4.6. SSE as Trigeneration Technology and Costs

SSE technology represents cogeneration (simultaneous production of electric and thermal energy) (Figure 13A), that can also be used to produce drinking water. This way, it actually gives a higher quality than all previous technologies and can be modelled as trigeneration, since one input (RES energy) provides two energy outputs and drinking water (Figure 13B).

2.4.7. Sustainable Community and Third Industrial Revolution

Due to the ability of SSE technology to produce both electric and thermal energy as well as drinking water, every city/settlement can be made sustainable, i.e., independent of external sources of energy and drinking water.
Therefore, today’s preconceptions on connecting the energy and drinking water systems of cities/settlements by following the example of the Internet should be abandoned—these communities should, instead, be completely independent in order to achieve the sustainability of all of humankind and to stop climate change.
Figure 14 shows an illustration of a sustainable city/settlement that gets its electric and thermal energy from SSE technology. Thermal energy is forwarded to the city/settlement through thermal energy storage, while electric energy is conducted to the generator pump set by which water is pumped from the sea (or a lower water reservoir) into the upper seawater reservoir to be used as seasonal energy storage, balancing summer surpluses and winter shortages of solar energy (i.e., seasonal variations in the energy of the wind or marine energy). This way, the city/settlement gets a continuous energy supply for the whole year; it is very important to emphasize the reliability of such a supply.
A similar thing happens with drinking water. After treatment, the water goes to the drinking water reservoir from which an entire city/settlement can obtain drinking water throughout year and in a reliable fashion. Drinking water, after consumption in the city/settlement, goes to the sewers and then to the sea (a). However, it is exceedingly important to mix the sewer water with brine from the separation system (b) before release into the sea using special containers because (c) the dilution of brine with sewer waste water solves the problem of high salt concentrations in brine water, preventing negative effects in the marine environment.
An SSE technology system comprised in this way would contribute to the sustainability of cities/settlements.
Sustainable communities and the new SSE technology by which such communities could be realized are essentially related to the concept of the third industrial revolution, because they would deeply influence the economic paradigms that are key to stopping climate change.
In this sense, industrial revolutions are essentially economic projects that focus on the relationship between a source of energy and the workforce. This was not conceived in this way for a long time, and instead, this notion was related to various technological accomplishments, grouping them according to the time when they appeared, even though it was not necessarily connected.
In that sense, in the First Industrial Revolution, factories were built near to energy sources. In the Second Industrial Revolution, factories could be far away from sources of energy, while in the Third Industrial Revolution, factories could be built anywhere, with energy coming from RES technology. If factories and entire communities can obtain both energy and drinking water, they then become completely sustainable. For that reason, SSE technology has a particular significance in the construction of sustainable communities and the initiation of the Third Industrial Revolution, as described in a previous paper [41]. This way, SSE technology links three important notions: Industrial revolution, Sustainable communities and Climate change, as three key notions: Economy, Society and Environment.
Even though it is not possible to see beyond a Third Industrial Revolution, given that this essentially corresponds to the relationship between an energy source and the workforce, the literature still uses the notion of industrial revolution liberally (there is even the notion of a Fifth Industrial Revolution—“Artificial Intelligence“; a Sixth Industrial Revolution—“Grand Agriculture“; and a Seventh Industrial Revolution—“Replicating Machines“), which gives rise to confusion related to the term and its meaning, and devalues the significance of actual industrial revolutions. In that sense, it is interesting that back in 2007, the EU Parliament named the use of RES technology as the Third Industrial Revolution, European Parliament (2007), Written Declaration 2007 [48], but later gave up on such semantics, and for that reason, it has not been widely accepted. In addition, the literature often lists a Fourth Industrial Revolution, but after the realization that this is essentially not an industrial revolution, only the short-hand term “Industry 4.0” remained in use. What is also very interesting is that nobody has clarified the meaning of “Industry 4.0“; instead, everything revolves around keywords, such as industry, computers, the Internet, and it is not clear what is revolutionary here. It is also especially unclear what is so radically new that has changed industry with society-wide implications. A very similar situation happened with the term “fourth agricultural revolution” or “Agriculture 4.0”.

3. Results and Discussion

In order to evaluate the potential of SSE technology in terms of covering the needs for world energy and drinking water consumption and to achieve the objective set out by the proposed Climate New Deal, it was necessary to start from the basic characteristics of this technology, which may be determined by Equations (1)–(6). These equations were verified through a case study of the island Vis in Croatia, where the following values were obtained: Optimal nominal electric power of SSE generator Pel(NOM) = 52.277860 MW; Total annual electric energy production Eel = 62,593,399 kWh; Total annual drinking water production VDW = 480,754 m3; Working volume of upper reservoir V0 = 7 hm3; Total aperture area of collector field Acoll = 373,413 m2; Total annual heat energy production Qcoll = 178,838,282 kWh.
Of the total produced electric energy and drinking water, in the concrete case of the island of Vis, the unit value of produced drinking water per 1 kWh of electric energy is expressed as approximately:
1 kWh(el) ≈ 10 litres of drinking water
Section 2.4 discusses the significant technological advantage of SSE technology compared to current technologies, where the price of SSE technology would obviously be lower than that of energy (i.e., electrical or thermal produced by cogeneration) obtained in separate processes (i.e., technologies that first produce energy and then produce drinking water in separate processes):
CSSE(1 kWh(el) + 1 kWh(h) + 1 m3) « CST(1 kWh(el)) + CDES(1 m3).
where CSSE represents the costs of producing electric (“el” index) and thermal energy (“h“ index) and costs of producing drinking water; CST represents costs of producing only electric energy from ST power plants and CDES the costs of producing drinking water.

3.1. Potential of SSE Technology to Simultaneously Produe Thermal and Electric Energy and Drinking Water

Table 2 presents the values of individual parameters (1–10) using Equations (1)–(6), which prove the potential of SSE technology to simultaneously produce thermal and electric energy and drinking water. These calculations apply to the entire integrated system of SSE technology (including PSH for energy storage), as presented in previous papers by the authors [39,40,41].
Based on total final energy consumption (TFEC) data for 2015 [49], amounting to 109,136 TWh, and the data on the share of electric (20%) and thermal (48%) energy in the TFEC [50], the number of SSE systems needed to meet all consumption needs for electric and thermal energy worldwide can be calculated.
In this case study, 2015 was taken as the reference year, while unit values of production of electric energy and drinking water data, as well as data for thermal energy, were taken from previous papers by the present authors [39,46].
The first row of Table 2 shows total electric energy (Electricity), amounting to 20% of the TFEC; the second row shows the total thermal energy (Heat, i.e., heating and cooling), which amounts to 48% of the TFEC. The sum of the values of the first and second rows of column 1 shows the quantities of electric and thermal energy consumed globally in 2015 (74,212 TWh). The third row of column 1 shows total drinking water consumption, i.e., 168 km3.
Column 2 in Table 2 shows the capacity factor (CF) for solar concentrated systems (16%), while column 3 shows the total required power of SSE technology (16 TW), calculated as the ratio of energy from column 1 and column 2. Column 4 shows typical unit values for land use for RES systems (PV, Wind, Marine), in particular for concentrated solar power (CSP) systems, while column 5 shows total land use both for RES and for CSP systems, where an equal ratio of usage of CSP technology and other RES technology was assumed (50%:50%). The land use amounted to a total of 86,217 km2.
Column 6 in Table 2 shows the total required volume of PSH technology, and column 7 the total energy that can be stored using that technology. These data were obtained based on unit values from previous research by the present authors [38].
Column 8 shows the total amount of electric and thermal energy that can be produced with SSE technology (21,827 TWh), according to total coverage of electricity consumption (all 20%), while the produced thermal energy (62,363 TWh) even exceeds the required energy (total energy consumption of 52,385 TWh shown in column 1). The same column shows the total produced drinking water (218 km3), which is somewhat greater than the amount required (of the 168 km3 shown in column 1).
Column 9 shows the total CO2 emissions, calculated according to Ren SMART Calculators [51], i.e., 1 kWh = 0.28307 kg CO2, while column 10 shows the total CO2 savings (Gt) using SSE technology, which is not obtained on the basis of total energy production (column 8) from the calculation based on TFEC (column 1), presented in Table 2.
Global emissions from fossil fuel and emissions from industry in 2015 amounted to 35.5 Gt (36.3 ± 1.8 Gt) of CO2 [52].
According to the calculations shown in Table 2, the total annual CO2 savings with the use of SSE technology would be 21 Gt. It is evident that SSE technology has a significant savings potential, i.e., around 60%.
The total required water for domestic use, i.e., 168 km3 (shown in column 1, Table 2), represents 8% of total global water consumption [53].
According to the calculations (218 km3) in Table 3, SSE technology can satisfy domestic water needs (i.e., drinking water, sanitary water, and other domestic uses).
Table 3. Criticism of existing paradigms and establishment of new ones.
OLD CLIMATE CHANGE PARADIGMSUNCONVINCINGNESS OF OLD
AND ESTABLISHMENT OF NEW PARADIGMS
1Climate change will occur slowly.
-
UNCONVINCING
-
NEW PARADIGM: Climate change will occur impetuously and a climate breakdown will happen within a very short timeframe.
2The UN (UNFCCC) knows how to solve the problem.
-
UNCONVINCING: The UN (UNFCCC) has no efficient solution to the problem, and proof of this is that the global temperature is still on the rise.
-
NEW PARADIGM: Humanity is at war with climate change that it has caused, but it still has not developed adequate “weapons”, or formed able leadership, or created an appropriate strategy or employed financial and human resources that are a prerequisite in the fight against climate change. Therefore, the UNFCCC should be organised in a completely different way.
3The Paris Agreement is the solution to the climate change problem.
-
UNCONVINCING: The Paris Agreement has badly set objectives, making it unrealistic and unfeasible.
-
NEW PARADIGM: A new international climate agreement is needed, and the authors have recommended the ‘Climate New Deal’.
4Constant economic growth is possible.
-
UNCONVINCING: Constant economic growth is not possible, because it is limited by climate change.
-
NEW PARADIGM: Economic growth must be subordinated to the stabilisation of climate, and, if required, economic growth must be stopped for the following 30 years to ensure the survival of humanity.
5To solve the problem of climate change, it is enough to replace fossil fuels with RES.
-
INSUFFICIENTLY CONVINCING: It is true that fossil fuels need to be replaced with RES technology, but the process of reorientation from a high-carbon economy to a total green economy could lead to serious conflicts because of a lack of drinking water, making the entire reorientation process questionable.
-
NEW PARADIGM: New RES technology should simultaneously produce drinking water in addition to energy.
6All energy storage is good.
-
INSUFFICIENTLY CONVINCING: Small energy stores can be used to store excess energy from RES systems, but they do not have sufficient capacity to balance all energy produced by RES systems and TFEC.
-
NEW PARADIGM: Only seasonal storage of energy can ensure continuous supply of RES energy for the entire world (TFEC) during the entire year.
7Energy systems should be connected, like the Internet (Smart Grids).
-
UNCONVINCING
-
NEW PARADIGM: Energy and water systems should have the function to supply only sustainable communities (cities, settlements etc.).
8The only important thing is to build enough RES systems, regardless of their effect on the environment.
-
UNCONVINCING: It is not enough to build sufficient RES systems to replace fossil fuels; instead, their effect on the environment should be maximally reduced.
-
NEW PARADIGM: It is important to build enough new, sustainable energy systems that can produce drinking water in addition to energy, but it is no less important to figure out how waste from these systems will be handled after the expiration of their lifecycle.
9There are enough resources for RES technology
-
UNCONVINCING
-
NEW PARADIGM: There are not enough resources for existing RES technology, but there are enough resources for SSE because it mostly uses non-reare elements (Fe).

3.2. The Dynamic of Climate New Deal Implementation

Here, the question of the dynamics of the implementation Climate New Deal is discussed. We want to achieve 100% RES technology as soon as possible, but this is obviously not realistic. Therefore, the logical answer is that the dynamics should follow a logistic growth curve, i.e., the S-curve.
Today, a relatively small share of total final energy consumption originates from RES technology: in 2015, the share was 19.3% [54], while the goal is to achieve 100% by 2050 in order to ensure the production of adequate energy and drinking water for domestic use.
However, the key aspect of this is the race against time. We predict a time period of 30 years for implementation (from 2020 to 2050).
Considering the potential of SSE technology shown in Table 2, it is evident that it could provide the world with electric and thermal energy as well as drinking water. In concrete terms, this technology could be used to produce 21,827 TWh of electric energy, 52,385 TWh of heat energy and 218 km3 of drinking water in 2050.
Although we cannot accurately predict what the total final energy consumption will be in 2050, a goal may be set to keep it within the boundaries of the 2015 values. Why was 2015 taken as a reference year? Despite the relatively large growth in population expected from 2020 to 2050, and the increased need for energy (without which there is no development), there is a great potential for energy efficiency technology that can compensate for this increase in energy needs and the increase in global population, meaning that energy consumption in 2050 could be brought back to the levels of 2015.
Figure 15 shows an S-curve representing increasing application of SSE technology (E(SSE), green bold line), starting with zero in 2020 all the way to a total of 74,212 TWh of electric and thermal energy from SSE in 2050 (right y-axis).
The remaining 1/3 of TFEC (or 34,924 TWh) would be produced with other RES technology (E(OT), surface with grey lines above the green line), with special emphasis on RES technology in transport.
With the increasing application of SSE technology, global CO2 emissions, which show an S-curve (CO2 (SSE), bold black line), will be decreased from today’s value of 35.5 Gt/a CO2 to 14.5 Gt/a.
Considering other RES systems (primarily in transport) as well as the application of energy efficiency technologies (E(OT), surface with grey lines under the black line), the total CO2 emissions are expected to drop to zero.
This means that anthropogenic emissions would virtually disappear and, as a consequence, the climate could recover.
However, the recovery of the climate and its restoration to equilibrium will not happen quickly. Instead, it makes sense to first expect a further rise in temperature (because of the aforementioned inertia of the climate) from +1 °C to +1.5 °C, with a significant increase in the application of SSE and RES systems, before returning to today’s value, +1 °C, as shown in Figure 15 (bold red line); 2035 could be taken as an orientation year.
This paper intentionally does not aim for a global temperature drop to 0 °C in relation to pre-industrial levels, i.e., the temperature before the anthropogenic emissions of CO2, because to stop global warming completely will require much more than 30 years.
The Leaning Tower of Pisa was fixed in 10 years (1990–2001) by extracting sand from the side opposite to the inclination, and the incline was reduced by 45 cm; the climate system should be fixed within 30 years (2020–2050) by extracting CO2 from the atmosphere to maintain the temperature at today’s value of +1 °C in relation to pre-industrial levels.

Evaluation of the Proposed Solutions

The paper shows that today’s methods of solving the climate change problem do not achieve results, because the concentrations of CO2 and the global temperature are still on the rise.
Another greater problem is the rise of the concentration of CO2 in the last 140 years (i.e., from the start of the first industrial revolution) and, in particular, from the middle of the 20th century, which shows an exceedingly sudden increase in relation to the concentration in Earth’s atmosphere for the past 400,000 years (Figure 16) [55]. This dramatic rise during a relatively short geological time clearly points to an impending climate breakdown. It is obvious that the climate system does not have the elasticity to maintain further, sudden changes in CO2 concentrations, from 300 ppm in 1950 to over 415 ppm at the beginning of 2019 (only 70 years) [56], nor can it endure further sudden increases in global temperature.
Nobody knows what the limit of global temperature that can be maintained by a stable climate system is, but the situation is so serious that there should be no further experimentation.
The increases of CO2 concentrations and global temperature as a consequence imposes the need to get ahead of climate change, which means a radical change in the policy of stopping climate change.
The UN has no solution to the problem, as exemplified in the collapse of the last UN Climate Change Conference COP25 held in Madrid in 2019 (UN Climate Change Conference—COP25, 2019) [57], there results of which may be summarized as follows:
  • There is a “significant gap” between the existing pledges and temperature goals established by the Paris Agreement, which implicitly acknowledges that it will not be possible to reach the goals of the Paris Agreement (also claimed by authors);
  • Countries could not establish market rules for trading carbon credits (which was considered the most controversial issue at the conference, while we believe that this carbon tax policy, which is the basis of both the Kyoto Protocol and the Paris Agreement, is unconvincing and will not yield adequate results);
  • Rich countries could not find a way to help poorer countries in order to mitigate the damages caused by climate change (therefore, no burden of sharing between countries was established);
  • All 200 participating countries have been invited to respect the goals set by the Paris Agreement and to make progress in this direction next year, which is basically an empty UN appeal that binds no one and demonstrates the UN’s inability to resolve the climate change problem.
Finally, COP25 did not result in any agreement, so everything was left for the next COP26; however, COP25 decried the problem, i.e., that the UN had not realized that the agreement could not be reached on the basis of the unconvincing policy of the Paris Agreement (which, apparently, no one has considered critically, let alone questioned it), and even if it were to be reached, an agreement on such foundations would not yield results, as politics alone cannot succeed in combating climate change without strong technology. According to the authors, there is less and less time for decisive action.
Getting back to the first stage of Socratic dialectics against the knowledge of sophists, proving that this is but imaginary knowledge, i.e., ignorance, and to today’s main paradigms (and it is clear that it is those with authority who establish the paradigms), which are the reason why humanity is so hindered and unable to take a stand against climate change. Since the paradigms only grow from one year to another, the authors have decided to criticize the existing ones and establish new paradigms in Table 3.
Considering the interdependence of sustainable energy systems—(primarily based on SSE technology) that would meet the needs of both world energy consumption and world drinking water consumption—and reduction of CO2 emissions, as well as the consequent reduction of global temperature, it seemed logical to put all these values on the same graph (Figure 15), which occupies a central place in this paper because it shows what outcomes are expected if a new climate policy and new SSE technology are applied and how such a policy could be implemented.
Therefore, unlike previous approaches which mainly deal with predictions of global temperature and CO2 over time, the approach of the author of this paper started from the notion of stopping climate change through building sustainable energy systems based on SSE technology which would result in a drop in anthropogenic CO2 emissions. That is realistic, because these two curves are inversely proportional to each other (“S” curve—green bold line and “S” curve—black bold line in Figure 15).
However, the global temperature, which is dependent upon CO2 emissions, was the most difficult to predict because there are many parameters that affect it, and it is not possible to predict which of these are irreversible, i.e., how long it would take for them to return to their previous state.
In addition, it is very difficult to predict the level of inertia that the climate system has. Despite this, even with a relatively rapid reduction of anthropogenic CO2 emissions to virtually zero (over a period of 30 years, which is relatively short for the climate system), global temperatures will certainly not drop immediately, but will continue to rise, albeit more slowly than before.
On the other hand, this paper also assumed a complete recovery of the climate (i.e., the reversibility of the process, which is a realistic assumption, because there is a natural tendency to return the system to equilibrium if the cause of the imbalance is removed (similar to the stabilization of the Leaning Tower of Pisa, described in Section 2) in a period of 30 years of annulment of anthropogenic CO2 emissions. The temperatures at the end of that period, i.e., by 2050, would be around +1 C (as 2020). In this way, it would be possible to stop climate change by 2050, which is the main objective set out in this paper.
The authors propose a model of fair distribution of expenditures (described in Section 2 and shown in Figure 3 based on the calculations given in Table 1) from which it follows that investments would be made in the construction of new sustainable systems (i.e., new technologies) estimated on 2% of the GDP of all countries of the world.
A very interesting fact is that the figure of 2% of GDP, even though it was obtained in different ways, completely corresponds to the figure recommended by Nicholas Stern, published in Jowit and Wintour, The Guardian (2008) [58] in 2008: “Stern said evidence that climate change was happening faster than had been previously thought meant that emissions needed to be reduced even more sharply. This meant the concentration of greenhouse gases in the atmosphere would have to be kept below 500 parts per million, said Stern. In 2006, he set a figure of 450–550 ppm. ‘I now think the appropriate thing would be in the middle of that range,’ he said. ‘To get below 500 ppm ... would cost around 2% of GDP”.

4. Conclusions

The implementation of the current climate policy faces several issues related to the facts that:
(i)
although there are a growing number of countries that have committed to achieving net-zero emissions goals by around the mid-century, the reduction of the global greenhouse gas (GHG) emissions will only be achieved if countries implement their own climate mitigation commitments (bottom-up approach);
(ii)
reductions of emissions which are consistent with the Paris Agreement temperature goal would only be possible if they are implemented globally (as stated in the latest UNEP report, 2020) [59];
(iii)
the economic approach of the “global taxing policy” is not convincing [28,29,60].
In this paper, a systematic engineering approach was applied; in this sense, the relevant aspects of the problem were considered, requiring a broader multidisciplinary approach, to set a goal, i.e., to stop climate change in the next 30 years.
In this regard, we used an original methodology which involved the implementation of a new international agreement as a new policy, called the Climate New Deal (described in Section 2.3), and an innovative Seawater Steam Engine (SSE) technology that can simultaneously produce thermal and electric energy and drinking water (described in Section 2.4), which would be equally available to developed and less developed countries. The SSE technology is a RES technology and is of particular importance because it could enable equal opportunities for its development and, in particular, is applicable to most countries as a strong “weapon” in the fight against climate change. In relation to the SSE technology, we note that there is no similar technology, except for that listed under reference [61], for which intensive research began in 2018.
However, as the implementation of this new policy basically means allocating 2% of each country’s GDP (the model of fair distribution of expenditures, described in Section 2.1) to build sustainable energy systems that would meet the required total final energy consumption for the whole world (TFEC—from 2015, with 48% spent on heat, 20% on electricity and 32% on transport) within the next 30 years, it was necessary to take into account the potential application of the new SSE technology (described in Section 3.1). The results showed that SSE technology can cover heat (62,363 TWh) and electricity Needs (21,827 TWh), which represent around 2/3 of TFEC, and can also provide drinking water for domestic use (218 km3), thereby reducing CO2 emissions by about 21 Gt (roughly 60%). As such, it would enable the development of sustainable communities. In addition to energy efficiency measures and the energy required by the transport sector (new fuels), the paper has shown that it is possible to completely eliminate anthropogenic CO2 emissions.
To implement the proposed measures in a relatively short period of time, i.e., 30 years, the dynamics of the development of sustainable energy systems is of great importance and should occur according to a logistic curve, which would result in a decrease in CO2 emissions that would itself follow a logistic curve (the logistic curves presented in Figure 15 are inversely proportional to each other). Such a dynamic reduction of CO2 emissions would have the most important consequence, i.e., changes in the global temperature in the form of an inverted parabola and its retention at today’s value of around +1 °C.
Thus, this paper presents, in a general sense, a strategy for the application of new technology and provides a meaningful plan to stop climate change. Likewise, the authors identify clear limitations in relation to the goals of the Paris Agreement, evaluate existing paradigms and propose new ones (Table 3), all with the intention of promoting discussion and the improvement of these paradigms with the wider scientific community.
The SARS-CoV-2 pandemic in 2020 clearly shows the consequences that zoonoses can have on humanity, which still prioritizes profit over the preservation of the environment. It is also clear that if the present mentality persists, it cannot be ruled out that there may be new pandemics against which humanity will find it increasingly difficult to fight. Therefore, it is necessary to urgently address the main cause of such terrible threats to humanity by building sustainable communities (as described in Section 2.4.7), which include energy sources, drinking water, and also food, as well as improving living standards in the future. Such communities would also be more resistant to the occurrence of future epidemics due to easier localization.
Thus, an extremely important conclusion can be drawn from the current coronavirus pandemic, namely, that the required reduction of CO2 emissions cannot be achieved by the Paris Agreement, which is set on a voluntary basis (mentioned in Section 2.3), effectively making it “as much as you can”, without any sanctions for those who do not implement it. Indeed, a new international climate agreement based on the top-down principle and strict control of its implementation is crucial.
The SARS-CoV-2 pandemic has caused a significant reduction in anthropogenic CO2 emissions [62]. The authors can anticipate from this that a certain coercion mechanism is necessary in order to start reducing CO2 emissions, and that this possible only with new politics.
The SARS-CoV-2 pandemic has revealed another important fact, namely, that the world lacks solidarity and empathy in general. Each country has been solving the problem in its own country with a lack of strong international cooperation, including health equipment supplies. At the same time, national economies were, in many cases, put ahead of people’s health and lives. If joint UN-led (or top-down) actions had been taken in a timely manner, perhaps this pandemic could have been prevented or at least managed much better. It is exactly the same with stopping climate change; humanity is not in solidarity, and does not have a unified and well-organized policy, just as it does not have a strategy or the instruments for its implementation. Furthermore, there are no sanctions for actors who do not pursue common policy.
Based on past and current experience with the coronavirus pandemic, it can be concluded that humanity can only survive if it develops global empathy that translates into a common policy and an effective strategy to stop climate change.

Can Humanity Succeed?

Dramatic warnings about rising risks to the survival of humanity [63] are reason enough to overcome our mutual differences and to unite and act together against climate change. Whether or not we will be successful is mostly dependent on our understanding of the dangers we are facing and our willingness to cooperate. Given that the endeavor of saving the climate system holds many unknowns, especially the time window (with estimates ranging from several years to several decades), this success is uncertain.
But what we can do is join forces to at least try and fix the climate system, thereby trying to get ahead of its breakdown. It is our obligation to ourselves and to generations to come.

Author Contributions

These authors contributed equally to this paper. All authors have read and agreed to the published version of the manuscript.

Funding

This research received no external funding.

Conflicts of Interest

The authors declare no conflict of interest.

References

  1. Hunnes, J.A. More planet and less profit? The ethical dilemma of an oil producing nation. Cogent Bus. Manag. 2019, 6, 1648363. [Google Scholar] [CrossRef]
  2. Øyvind, I. Business and Climate Change: The Climate Response of the World’s 30 Largest Corporations. Environ. Commun. 2009, 3, 244–262. [Google Scholar] [CrossRef]
  3. Bach, M.S. Is the Oil and Gas Industry Serious About Climate Action? Environ. Sci. Policy Sustain. Dev. 2017, 59, 4–15. [Google Scholar] [CrossRef] [Green Version]
  4. Lomborg, B. False Alarm: How Climate Change Panic Costs Us Trillions, Hurts the Poor, and Fails to Fix the Planet; Basic Book: New York, NY, USA, 2020. [Google Scholar]
  5. Oreskes, N. The scientific consensus on climate change: How do we know we’re not wrong? In Climate Change, 2nd ed.; DiMento, J., Doughman, P., Eds.; MIT Press: Cambridge, MA, USA, 2014; pp. 65–99. [Google Scholar]
  6. Cook, J.; Oreskes, N.; Doran, P.T.; Anderegg, W.R.L.; Verheggen, B.; Maibach, E.W.; Carlton, J.S.; Lewandowsky, S.; Skuce, A.G.; Green, S.A. Consensus on consensus: A synthesis of consensus estimates on human-caused global warming. Environ. Res. Lett. 2016, 11, 1–7. [Google Scholar] [CrossRef]
  7. Global Climate Indicators 2018, World Meteorological Organization (WMO). Available online: https://gcos.wmo.int/en/global-climate-indicators (accessed on 21 November 2020).
  8. The State of the Global Climate in 2018, World Meteorlogical Organization (WMO). Available online: https://library.wmo.int/doc_num.php?explnum_id=5789 (accessed on 21 November 2020).
  9. Global Warming of 1.5 °C, Intergovernmental Panel on Climate Change (IPCC). 2018. Available online: https://www.ipcc.ch/site/assets/uploads/sites/2/2019/06/SR15_Full_Report_High_Res.pdf (accessed on 21 November 2020).
  10. Wallemacq, P.; House, R. Economic Losses, Poverty & Disasters (1998–2017). United Nations Office for Disaster Risk Reduction (UNISDR) and Centre for Research on the Epidemiology of Disasters (CRED). 2018. Available online: https://www.unisdr.org/files/61119_credeconomiclosses.pdf (accessed on 21 November 2020).
  11. United Nations Framework Convention on Climate Change, United Nation. 1992. Available online: https://unfccc.int/resource/docs/convkp/conveng.pdf (accessed on 21 November 2020).
  12. Glasgow Climate Change Conference. Available online: https://unfccc.int/process-and-meetings/conferences/glasgow-climate-change-conference (accessed on 21 November 2020).
  13. United Nations. Kyoto Protocol; United Nations: Tokyo, Japan, 1997; Available online: https://unfccc.int/kyoto-protocol-html-version (accessed on 21 November 2020).
  14. Rosen, A.M. The Wrong Solution at the Right Time: The Failure of the Kyoto Protocol on Climate Change. Polit. Policy 2015, 43, 30–58. [Google Scholar] [CrossRef]
  15. Grubb, M. Full legal compliance with the Kyoto Protocol’s first commitment period—Some lessons. Clim. Policy 2016, 16, 673–681. [Google Scholar] [CrossRef] [Green Version]
  16. Kim, Y.; Tanaka, K.; Matsuoka, S. Environmental and economic effectiveness of the Kyoto Protocol. PLoS ONE 2020, 15, e0236299. [Google Scholar] [CrossRef]
  17. United Nations. Paris Agreement; United Nations: Paris, France, 2015; Available online: https://unfccc.int/files/essential_background/convention/application/pdf/english_paris_agreement.pdf (accessed on 21 November 2020).
  18. Closing Statement by the Finnish Presidency and the European Commission on Behalf of the EU and Its Member States at COP25. Available online: https://ec.europa.eu/commission/presscorner/detail/en/statement_19_6779 (accessed on 21 November 2020).
  19. NASA Global Climate Change. Global Temperature; Global Land-Ocean Temperature Index. Available online: https://climate.nasa.gov/climate_resources/127/global-temperature/ (accessed on 21 November 2020).
  20. NASA Global Climate Change. Sea Level. Latest Measurement: July 2020. Available online: https://climate.nasa.gov/vital-signs/sea-level/ (accessed on 21 November 2020).
  21. Gao, Y.; Gao, X.; Zhang, X. The 2 °C Global Temperature Target and the Evolution of the Long-Term Goal of Addressing Climate Change—From the United Nations Framework Convention on Climate Change to the Paris Agreement. Engineering 2017, 3, 272–278. [Google Scholar] [CrossRef]
  22. Union of Concerned Scientists. Science for a Healthy Planet and Safer World, Share of Global Carbon Dioxide Emissions from Fuel Combustion (2015); IEA: Paris, France, 2018. [Google Scholar]
  23. Glasnovic, Z.; Margeta, J. Vision of Total Renewable Electricity Scenario. Renew. Sust. Energy Rev. 2011, 15, 1873–1884. [Google Scholar] [CrossRef]
  24. Stern, N. Stern Review on the Economics of Climate Change; Government of the United Kingdom: London, UK, 2006. Available online: http://mudancasclimaticas.cptec.inpe.br/~rmclima/pdfs/destaques/sternreview_report_complete.pdf (accessed on 21 November 2020).
  25. Nordhaus, W. Projections and Uncertainties about Climate Change in an Era of Minimal Climate Policies. Am. Econ. J. Econ. Policy 2018, 10, 333–360. [Google Scholar] [CrossRef] [Green Version]
  26. The Prize in Economic Sciences. Integrating Innovation and Climate with Economic Growth. Nordhaus, W.D., Romer, P.M., Eds.; 2018. Available online: https://www.nobelprize.org/prizes/economic-sciences/2018/press-release/ (accessed on 16 December 2020).
  27. The Royal Swedish Academy of Sciences. Economic Growth, Technological Change, and Climate Change; Scientific Background on the Sveriges Riksbank Prize in Economic Sciences in Memory of Alfred Nobel 2018; Nordhaus, W.D., Romer, P.M., Eds.; The Committee for the Prize in Economic Sciences in Memory of Alfred Nobel, 2018; Available online: https://www.nobelprize.org/prizes/economic-sciences/2018/summary/ (accessed on 16 December 2020).
  28. Murphy, P.R. Rolling the DICE William Nordhaus’s Dubious Case for a Carbon Tax. Indep. Rev. 2009, 14, 197–217. [Google Scholar]
  29. Murphy, P.R.; Michaels, P.J.; Knappenberger, P. The Case Against a U.S Carbon Tax. Cato Institute Policy Analysis No. 801; Washington, DC, USA, 17 October 2016; Available online: https://www.cato.org/sites/cato.org/files/pubs/pdf/pa801.pdf (accessed on 21 November 2020).
  30. Weitzman, M.L. Reactions to the Nordhaus Critique, Discussion Paper 2009-11; Harvard Environmental Economics Program: Cambridge, MA, USA, 2009; Available online: https://projects.iq.harvard.edu/files/heep/files/dp11_weitzman.pdf (accessed on 21 November 2020).
  31. World Resources Institute. Ranking the World’s Most Water-Stressed Countries in 2040. Available online: https://www.wri.org/blog/2015/08/ranking-world-s-most-water-stressed-countries-2040 (accessed on 21 November 2020).
  32. Hunt, A.J.; Farmer, T.J.; Clark, J.H. Elemental sustainability and the importance of scarce element recovery. In Elemental Recovery and Sustainability; Hunt, A.J., Ed.; Royal Society of Chemistry: Cambridge, UK, 2013; pp. 1–28. [Google Scholar]
  33. Nickless, E. Resourcing Future Generations: A Contribution by the Earth Science Community. Nat. Resour. Res. 2018, 27, 143–158. [Google Scholar] [CrossRef]
  34. Water and Climate Change. Available online: https://www.unwater.org/water-facts/climate-change/ (accessed on 21 November 2020).
  35. Henderson, R.M.; Clark, K.B. Architectural Innovation: The Reconfiguration of Existing Product Technologies and the Failure of Established Firms. Adm. Sci. Q. 1990, 35, 9–30. [Google Scholar] [CrossRef] [Green Version]
  36. Chandy, R.K.; Tellis, G.J. Organizing for Radical Product Innovation: The Overlooked Role of Willingness to Cannibalize. J. Mark. Res. 1998, 35, 474–487. [Google Scholar] [CrossRef]
  37. Ahuja, G.; Lampert, C.M. Entrepreneurship in the large corporation: A longitudinal study of how established firms create breakthrough inventions. Strateg. Manag. J. 2001, 22, 521–543. [Google Scholar] [CrossRef]
  38. WO2013072709-Solar Thermal Hydro Electric Power Plant for Simultaneously Energy and Drinking Water Production. Available online: https://patentscope.wipo.int/search/en/detail.jsf?docId=WO2013072709 (accessed on 21 November 2020).
  39. Glasnovic, Z.; Margeta, K.; Premec, K. Could Key Engine, as a new open-source for RES technology development, start the third industrial revolution? Renew. Sust. Energy Rev. 2016, 57, 1194–1209. [Google Scholar] [CrossRef]
  40. Margeta, K.; Glasnovic, Z. Seawater Steam Engine—The most powerful tecnology for building sustainable communities and stopping the climate change. In Proceedings of the II International Energy & Environmental Summit—2017, Dubai, UAE, 18–20 November 2017. [Google Scholar] [CrossRef]
  41. Glasnovic, Z.; Margeta, K. Seawater Steam Engine as a Prime Mover for Third Industrial Revolution; LAP LAMBERT Academic Publishing: Saarbuecken, Germany, 2017. [Google Scholar]
  42. Safarov, J.; Millero, F.; Feistel, R.; Heintz, A.; Hassel, E. Thermodynamic properties of standard seawater: Extensions to high temperatures and pressures. Ocean Sci. Discuss. 2009, 6, 689–722. [Google Scholar] [CrossRef]
  43. Sharqawy, M.H.; Lienhard, V.J.H.; Zubair, S.M. Thermophysical Properties of Seawater: A Review of Existing Correlations and Data. Desalin. Water Treat. 2010, 16, 354–380. [Google Scholar] [CrossRef]
  44. Nayar, K.G.; Sharqawy, M.H.; Banchik, L.D.; Lienhard, V.J.H. Thermophysical properties of seawater: A review and new correlations that include pressure dependence. Desalination 2016, 390, 1–24. [Google Scholar] [CrossRef] [Green Version]
  45. Šömen, M. Analysis of the Experimental System for Determining Separator Characteristics. Master’s Thesis, University of Ljubljana, Ljubljana, Slovenia, 2017. [Google Scholar]
  46. Glasnovic, Z.; Margeta, K.; Omerbegovic, V. Artificial water inflow created by solar energy for continuous green energy production. Water Resour. Manag. 2013, 27, 2303–2323. [Google Scholar] [CrossRef]
  47. Glasnovic, Z.; Rogosic, M.; Margeta, J. A model for optimal sizing of solar thermal hydroelectric power plant. Sol. Energy 2011, 85, 794–807. [Google Scholar] [CrossRef]
  48. European Parliament. Written Declaration 2007. 2007. Available online: https://www.europarl.europa.eu/sides/getDoc.do?pubRef=-//EP//NONSGML+WDECL+P6-DCL-2007-0044+0+DOC+PDF+V0//EN&language=EN (accessed on 16 December 2020).
  49. International Energy Agency. Key World Energy Statistics 2017. 31–35, rue de la Fédération 75739 Paris Cedex 15. 2017. Available online: http://svenskvindenergi.org/wp-content/uploads/2017/12/KeyWorld2017.pdf (accessed on 22 November 2020).
  50. Renewables 2018. Global Status Report. REN21 Secretariat, c/o UN Environment, 1 rue Miollis, Building VII, 75015 Paris, France. 2018. Available online: https://www.ren21.net/wp-content/uploads/2019/05/GSR2018_Full-Report_English.pdf (accessed on 22 November 2020).
  51. RenSMART Calculators. Wet-Wired.com Ltd.. 2020. Available online: https://www.rensmart.com/Calculators/KWH-to-CO2 (accessed on 19 June 2020).
  52. Global Carbon Project. Global Emissions from Fossil Fuel and Industry: 36.3 ± 1.8 GtCO2 in 2015. Available online: https://www.globalcarbonproject.org/carbonbudget/archive/2016/GCP_CarbonBudget_2016.pdf (accessed on 22 November 2020).
  53. Lenntech (European Head Office), Distributieweg 3, 2645 EG Delfgauw, The Netherland. Available online: https://www.lenntech.com/specific-questions-water-quantities.htm#ixzz5fMJfVtds (accessed on 22 November 2020).
  54. Renewables 2017. Global Status Report. REN21 Secretariat. Available online: https://www.ren21.net/gsr-2017/ (accessed on 22 November 2020).
  55. NASA. Global Climate Changes; Evidence. Available online: https://climate.nasa.gov/evidence/ (accessed on 19 June 2020).
  56. Daily CO2. Available online: https://www.co2.earth/daily-co2 (accessed on 22 November 2020).
  57. UN Climate Change Conference—COP25. 2019. Available online: https://unfccc.int/cop25 (accessed on 22 November 2020).
  58. Jowit, J.; Wintour, P. Cost of Tackling Global Climate Change Has Doubled, Warns Stern; The Guardian: London, UK, 2008. [Google Scholar]
  59. United Nations Environment Programme (UNEP) and UNEP DTU Partnership (UDP), Emissions Gap Report 2020. Available online: https://www.unep.org/emissions-gap-report-2020 (accessed on 22 November 2020).
  60. Rosenbloom, D.; Markard, J.; Geels, F.W.; Fuenfschilling, L. Why carbon pricing is not sufficient to mitigate climate change—And how “sustainability transition policy” can help. Proc. Natl. Acad. Sci. USA 2020, 117, 8664–8668. [Google Scholar] [CrossRef] [Green Version]
  61. Solar Desalination, Department of Energy, USA. Available online: https://www.energy.gov/eere/solar/solar-desalination (accessed on 22 November 2020).
  62. Le Quéré, C.; Jackson, R.B.; Jones, M.W.; Smith, A.P.J.; Abernethy, S.; Andrew, R.M.; De-Gol, A.J.; Willis, D.R.; Shan, Y.; Canadell, J.G.; et al. Temporary reduction in daily global CO2 emissions during the COVID-19 forced confinement. Nat. Clim. Chang. 2020, 10, 647–653. [Google Scholar] [CrossRef]
  63. The UN Global Assessment Report on Disaster Risk Reduction (GAR); United Nations Office for Disaster Risk Reduction (UNDRR): Geneva, Switzerland, 2019.
Figure 1. Trends of seven main climate change parameters.
Energies 13 06703 g001
Figure 2. Global temperature and sea level rising [19,20] (Left) and Pisa tower as metaphor (Right).
Energies 13 06703 g002
Figure 3. Share of global carbon dioxide emissions from fuel combustion (2015) [22].
Energies 13 06703 g003
Figure 4. Model of distribution for investments in the development and creation of new sustainable energy systems for the protection of the climate.
Energies 13 06703 g004
Figure 5. Left: CO2 Emissions over time for four climate scenarios (Predictions from the DICE-2016R2 model, according to Nordhaus’ own simulations); Center: Concentrations of CO2 in different scenarios; Right: Increases in the global mean temperature, Taken from [25]. (“The four scenarios are the business as usual (BAU) or baseline (“Base”), which is the central version of no climate policy studied here; the cost-benefit economic optimum (“Opt”), which optimises climate policy over the indefinite future; a path that limits temperature to 2½ °C (“T < 2.5”); and a policy with an extremely low discount rate as advocated by the Stern Review (“Stern”)”).
Energies 13 06703 g005
Figure 6. The problem of the Paris Agreement—The Earth is not a boiler that can be turned off; it is not possible to directly manage the consequences (global temperature), but only on the causes (high carbon economy). Photo: Concept of a warming earth with a thermometer, adapted from Can Stock Photo, https://www.canstockphoto.com/global-warming-23706508.html.
Energies 13 06703 g006
Figure 7. Development of SSE technology: (A) solar thermal power plant with DSG technology (use fossil fuels) and PSH technology, separately; (B) integration of solar thermal power plant with DSG technology (use the previously obtained water steam as a working fluid) and PSH technology; (C) SSE technology—integration of solar thermal power plant with DSG technology (use directly seawater as a working fluid in the open thermodynamic cycle) and PSH technology.
Energies 13 06703 g007
Figure 8. The original sketch of the breakthrough of SSE technology (Right)—comparison to the steam engine (Left).
Energies 13 06703 g008
Figure 9. Breakthrough of Seawater steam engine technology (A) compared to research of physical/chemical parameters in current technology (B).
Energies 13 06703 g009
Figure 10. Phase transitions, physical and thermodynamic parameters of SSE technology ((A)—evaporation process; (B)—condensation process; Δhmv—change of enthalpy (seawater at the entrance into the collector tube); Tmv—temperature of seawater at the entrance into the collector tube; Δhp—change of enthalpy (steam at the exit from the collector tube); Tp—temperature of steam at the exit from the collector tube; Δhpp—change of enthalpy (overheated steam); Tpp—temperature (overheated steam); Δhmp—change of enthalpy (wet steam); Tmp—temperature (wet steam); Δht—change of enthalpy (liquid phase at the exit from the condenser); Tt—temperature (liquid phase at the exit from the condenser); Qsolar—heat (from solar energy); W—mechanical energy; Q—produced heat energy.
Energies 13 06703 g010
Figure 11. A prototype of high pressure separator (Left) and determination of technical characteristics of the high-pressure separator in laboratory conditions (Right).
Energies 13 06703 g011
Figure 12. Seawater Steam Engine (SSE) as “Core technology”.
Energies 13 06703 g012
Figure 13. Seawater Steam Engine (SSE) technology: (A) cogeneration, (B) trigeneration.
Energies 13 06703 g013
Figure 14. Role of SSE technology in building sustainable communities.
Energies 13 06703 g014
Figure 15. Dynamic of implementation SSE technology increasing green energy production, CO2 emission reduction, and stopping global warming.
Energies 13 06703 g015
Figure 16. Carbon dioxide level over the past 400,000 years (NASA, Global Climate Changes, 2020) [55]. This graph, based on the comparison of atmospheric samples contained in ice cores and more recent direct measurements, provides evidence that atmospheric CO2 has increased since the Industrial Revolution. (Credit: Vostok ice core data/J.R. Petit et al.; NOAA Mauna Loa CO2 record.) Find out more about ice cores (external site).
Energies 13 06703 g016
Table 1. Climate-related disaster losses per income group compared to GDP losses 1998–2017 and significant contributors to CO2 emissions.
Climate Changes Characteristics/CountriesHigh IncomeUpper-Middle IncomeLower-Middle IncomeLow Income
1Total GDP (billion US$)349,26894,50017,0181186
2Total Losses—Absolute value (billion US$)143256719421
3Losses (% GDP)0.410.61.141.77
4Significant contributions to CO2 emissions in 2015
(Share in %)
USA (15%), Japan (4%)China (28%), Russia (5%)India (6%)-
52% of GDP6985189034024
61.5% GDP (High income)5239
7Distribution of 0.5% GDP from High income countries – Absolute value (billion US$)1746=1631 +115
Table 2. Potential for the production electric and thermal energy and drinking water with SSE technology.
SSE-PSH12345678910
I20% ELECTRICITY21,82716161.9 (RES)20,7362401209521,827621
II48% HEAT52,3856.0 (CSP)65,48262,36315
IIIDRINKING WATER168 218
Legend: (SSE—Seawater Steam Engine; PSH—Pump storage hydroelectric; 1—Total energy (TWh) and drinking water (km3) consumption; 2—CF (%); 3—RES Total Power (TW); 4—RES Unit land use (km2/TWh); 5—RES Total land use (km2); 6—PSH Volume (km3); 7—PSH Energy (TWh); 8—Total energy (TWh) and drinking water (km3) production; 9—Power and Heat CO2 savings (Gt); 10—Total CO2 savings (Gt)).
Publisher’s Note: MDPI stays neutral with regard to jurisdictional claims in published maps and institutional affiliations.

