Article

Small-Signal Modeling of PMSG-Based Wind Turbine for Low Voltage Ride-Through and Artificial Intelligent Studies

1
Department of Electrical Engineering, Islamic Azad University, Abhar Branch, Abhar 4563934367, Iran
2
Future Technology Research Center, National Yunlin University of Science and Technology, 123 University Road, Section 3, Douliou, Yunlin 64002, Taiwan
3
Electrical and Computer Engineering Faculty, University of Tabriz, Tabriz 5881743571, Iran
4
Electrical and Computer Engineering Department, University of Louisiana at Lafayette, P.O. Box 43890, Lafayette, LA 70504, USA
5
Bachelor Program in Interdisciplinary Studies, National Yunlin University of Science and Technology, 123 University Road, Section 3, Douliou, Yunlin 64002, Taiwan
*
Author to whom correspondence should be addressed.
Energies 2020, 13(24), 6685; https://doi.org/10.3390/en13246685
Submission received: 21 October 2020 / Revised: 13 November 2020 / Accepted: 18 November 2020 / Published: 18 December 2020

Abstract

:
In recent years, due to the several advantages of permanent magnet synchronous generator (PMSG), the number of wind farms utilizing this technology has been significantly grown. The determination of the failure mechanism in these devices is the major challenge which has been addressed in many studies. Particularly, response to grid code compliance by wind power in the voltage drop situation needs to be comprehensively analyzed. In this paper, a small signal model of a PMSG-based wind turbine for low voltage ride-through (LVRT) and suitable for stability and artificial intelligent studies is presented. Accordingly, the generator side converter controls the dc-link voltage, and the maximum power point tracking is performed by the grid side converter. Given the proposed model, the speed of the simulation for stability analysis studies can be significantly increased by intelligent methods. Furthermore, the simplified approach can be achieved for calculating the optimal coefficients of the proportionality-integral controller by intelligent methods in a short time. By simulating the proposed small-signal model and comparing it with the block-based simulation in MATLAB/SIMULINK software, the appropriate accuracy and efficiency of the proposed model are confirmed.

1. Introduction

Considering the depletion of fossil fuels and environmental pollution, the application of renewable energy is an efficient substitution for traditional thermal power plants. The utilization of renewable energy has been rapidly growing because of cost reduction and improvement in power electronics. Considering the worldwide development of renewable energy, the future of the power grid extremely depends on this type of energy. In this regard, wind farms take an important portion of the electric power generation. Among the types of generators used in wind farms, direct-driven permanent magnet synchronous generator (PMSG) with grid-tied back-to-back power electronic converter is considered as an effective option (Figure 1a) [1,2]. The advantages of this topology include the simple control method for active and reactive powers, simple implementation of the maximum power point tracking (MPPT), high power quality, no need to the gearbox, the excitation winding, etc. [3].
One of the major challenges in the PMSG-based wind turbine is the low voltage ride-through (LVRT) operation [4,5]. During voltage drop in the grid, due to the current limitation of the grid side converter (GSC), the transmitted power to the grid is relatively reduced. On the other hand, the machine side converter (MSC) transmits the generated PMSG power from the wind independently of the injected active power to the grid [6]. This imbalance of input and output power causes a sharp increase in the voltage of the dc-link and the possibility of damaging the components (e.g., converters and generators). Numerous studies have thus far provided desirable and low-cost methods for LVRT operation. In [7], a comprehensive review of LVRT methods is done in two general categories: (a) high cost, using external devices; and (b) low cost, modifying control circuit of back-to-back converters and pitch angle. External devices that improve LVRT include FACTS devices [8], the braking chopper system [9,10], the fault current limiter (FCL) [11,12], and the energy storage system (ESS) [13] utilized at the common coupling point (PCC), dc-link, grid side, and dc-link, respectively. In addition, many studies have been performed in the field of improving back-to-back converter control circuits [14], including the use of active current droop in the MSC controller [9] as well as changing control functions between MSC and GSC [15]. In the method which changes the control function between MSC and GSC, dc-link voltage is regulated by MSC, while MPPT is controlled by GSC. During a voltage drop across the grid, MSC keeps the dc-link voltage constant and the GSC controller provides a balance between the generator’s active power and the allowable amount of injected active power into the grid.
For instance, in [3,16,17,18,19], nonlinear control methods such as sliding mode control and back-stepping controls are presented as effective controls of the dc-link voltage. Utilizing an applicable and comprehensive model is essential to achieve accurate control studies and stability analyses. In addition, this model can be useful for intelligent control. In terms of the maximum power extraction from wind and power smoothing, in [20], a small-signal model for PMSG and its active output power is presented. However, the small-signal analysis with a proper control method has not been carried out during voltage drop. In similar studies (e.g., [21]), models for MSC and GSC have been presented using the current-based equivalent complex calculation methods. Therefore, providing a simple small-signal model that can be effectively used in LVRT is essential. It is also important to note that the small-signal model responds well in quantitative ranges in the cases where the operation of the system is nonlinear. Furthermore, the basic operation function of the system and the place of the system’s poles and zeros can be obtained by the implementation of this method [22]. Hence, the small-signal model is a useful approach for stability studies of PMSG.
In this paper, a small-signal model of high-inertia wind turbines based on direct-driven PMSG (without gearbox) is presented, in which the dc-link voltage is controlled by MSC. To confirm the application of this method for use in LVRT studies, the related analysis and numerical results are shown. In addition to the proposed model of control studies and stability analysis, it is possible to determine the optimal coefficients of the proportional-integral (PI) law by different methods such as intelligent methods for control loops, including the dc-link voltage control loop. As a result, the proper performance of the controller can be achieved. The major contribution of the proposed model is to increase the simulation speed and its high accuracy compared to the application of the blocks on the MATLAB/SIMULINK software library. This model provides a powerful tool for designers and researchers in the field of PMSG-based wind power plants to calculate the optimal coefficients of the PI controllers. Meanwhile, the proposed model can be combined with intelligent methods to increase the speed and accuracy of calculations [23]. To confirm the validation of the proposed model, the responses of the proposed model are compared with the simulated wind turbine system using block-oriented simulation. Simulations demonstrate that the proposed model can be used to handle the non-minimum phase system.
This paper is organized as follows. The model of the PMSG-based wind turbine is presented after the Introduction. Then, the small-signal model is obtained based on the mathematical analyses of Section 2. The simulation results and validation of the proposed model are studied in Section 4. The conclusion is the last section of this paper.

2. Modeling of the Wind Energy Conversion System Based on PMSG

According to Figure 1, the wind energy conversion system based on PMSG has two main parts. The first part consists of mechanical and electrical parts (Figure 1a), and the other major part includes control circuits (Figure 1b,c). In this section, at first, the relations related to mechanical and electrical parts are presented, and then the control circuits of MSC and GSC converters are introduced.

2.1. Model of Mechanical and Electrical Parts

2.1.1. Wind Turbine Model

The mechanical power of wind turbine received from wind energy is expressed as follows [24]:
P T u r = 0.5 ρ A C p ( λ , β ) v w 3
where C p ( λ , β )   is the conversion factor of turbine power which is obtained as follows:
C p ( λ , β ) = 0.5176 ( 116 λ i 0.4 β 5 ) exp ( 21 λ i ) + 0.0068 λ  
1 λ i = 1 λ + 0.08 β 0.035 β 3 + 1  
According to (1), the mechanical torque of the turbine is expressed as follows:
T T u r = 0.5 ρ A C p ( λ , β ) λ v w 2  
Considering the single-mass model of the turbine–generator structure, which is a correct assumption due to the lack of gearbox, the equation of the mechanical part can be written as follows:
T T u r = J e q d ω m d t + B e q ω m + T e  

2.1.2. Electrical Model of PMSG

In this study, the surface-mounted PMSG model is used, which is in the d and q axes of the synchronous reference frame. Its equations are defined as follows [20]:
V d s = R s i d s + L s d i d s d t ω e L s i q s  
V q s = R s i q s + L s d i q s d t + ω e L s i d s + ω e ψ  
To prevent the permanent magnet from demagnetization, the reference value   i d s is considered to be zero ( i d s r e f = 0 ). In this regard, the instantaneous active output power and its electric torque are obtained as:
P g e n ( t ) = 3 2 p 2 ψ i q s ω m 3 2 R s i q s 2 3 2 L s i q s d i q s d t  
T e = 3 2 p 2 ψ i q s  
The noteworthy point in Equations (8) and (9) is that, due to the negative sign of   i q s , the signs of P g e n ( t ) and T e are positive. Therefore, this sign should be considered in the linearization stage.

2.1.3. DC-Link Model

The electrical model of the back-to-back converter with the dc-link capacitor is shown as:
P g e n ( t ) P g r i d ( t ) = C V d c ( t ) d V d c ( t ) d t  
The variations of dc-link voltage are the functions of the amount of output instantaneous active power from the generator (injected power into the grid), as well as the capacity of the dc-link capacitor.

2.1.4. Grid-Side Model

In this paper, the grid is considered as an infinite bus to which the wind farm is connected by an RL filter (and a coupling transformer). The equations for the grid-side are expressed in the synchronous reference frame of the d and q axes as follows [25]:
V d f = e d f R f i d f L f d i d f d t + ω f L f i q f  
V q f = e q f R f i q f L f d i q f d t ω f L f i d f  
Assuming that the reactive current injected into the grid ( i q f = 0 ) and component q of PCC voltage ( V q f = 0 ) are zero, the amount of transmitted instantaneous active power from the GSC to the grid is calculated from the following equation:
P g r i d ( t ) = 3 2 e d f i d f = 3 2 V d f i d f + 3 2 R f i d f 2 + 3 2 L f i d f d i d f d t  

2.2. Control Circuits of the Back-to-Back Converter

As mentioned above, the back-to-back converter consists of MSC and GSC. Each of these converters located on one of the orthogonal axes d and q is controlled by two control loops. In what follows, the controller of each converter is introduced and modeled.

2.2.1. MSC Controller

The MSC controller is controlled on the d and q axes (Figure 1b). Generally, the function of the d-axis controller is to control the generator flux, which is set to zero to prevent the demagnetization of PMSG. The function of the q-axis controller in the conventional control method is to control the generator output active power based on extracting the maximum output power from the wind. In the controller of this axis, the inner loop is used to control the current of the q axis and the outer loop is used to control the power. Various methods have been introduced for MPPT, which include optimized torque control (OTC) (Figure 2a) or optimal active power control (OPC), tip speed ratio (TSR) control, the perturbation and observation method (P&O) [26], etc. In all of these methods, to track MPP, i q s r e f is calculated and given to the q-axis controller to track it. On the contrary, in this paper, the value of the reference current of the q axis is obtained from the output signal of the PI controller of the dc-link voltage loop. To generate   i q s r e f , the reference value of the dc-link voltage is compared with the actual value of the dc-link voltage, and its error signal is used as the input of the PI controller (Figure 2b). The relations related to the q-axis controller are expressed as follows:
i q s r e f = k p d c ( V d c ( t ) V d c r e f ( t ) ) + k I d c ( V d c ( t ) V d c r e f ( t ) ) d t  
V q s C = k p q ( i q s r e f ( t ) i q s ( t ) ) + k I q ( i q s r e f ( t ) i q s ( t ) ) d t + ω e ψ  

2.2.2. GSC Controller

Normally, the dc-link voltage is controlled by the GSC based on determination of d-axis current and injecting q-axis current (reactive current). Consequently, the appropriate regulation of voltage and power factor of the grid can be achieved. Figure 1c shows d- and q-axes control circuit of the GSC. However, in the method presented in [7], the maximum power extraction from the wind is implemented by d-axis. Obviously, according to (13), by determining the reference current of d-axis, the injected instantaneous active power into the network can be controlled. In this paper, the instantaneous active power on the grid-side is obtained using the OPC method. The optimal power value for MPPT is as follows:
P m p p t = k o p t ω m 3  
where
k o p t = 0.5 ρ π R 5 C p max λ o p t 3 .
Considering (13) and (16) and neglecting the stored power in   L f , the following relation is obtained.
k o p t ω m 3 = 3 2 V d f i d f + 3 2 R f i d f 2  
In (17), by equalizing   i d f with the reference current of d-axis, the current   i d f r e f can be calculated. As shown in Figure 3, a noteworthy point in the calculation of i d f r e f is the application of a bounder to keep   i d f in allowable limits by using a current limiter.
As mentioned above, the purpose of this paper is to evaluate the performance of a new control method for improving the LVRT of dc-link voltage control. In addition, the active power is injected by the d-axis controller of GSC into the network. Therefore, using (11), the control circuit of the axis is modeled as follows:
V d f C = k p f ( i d f r e f ( t ) i d f ( t ) ) + k I f ( i d f r e f ( t ) i d f ( t ) ) d t + V d f

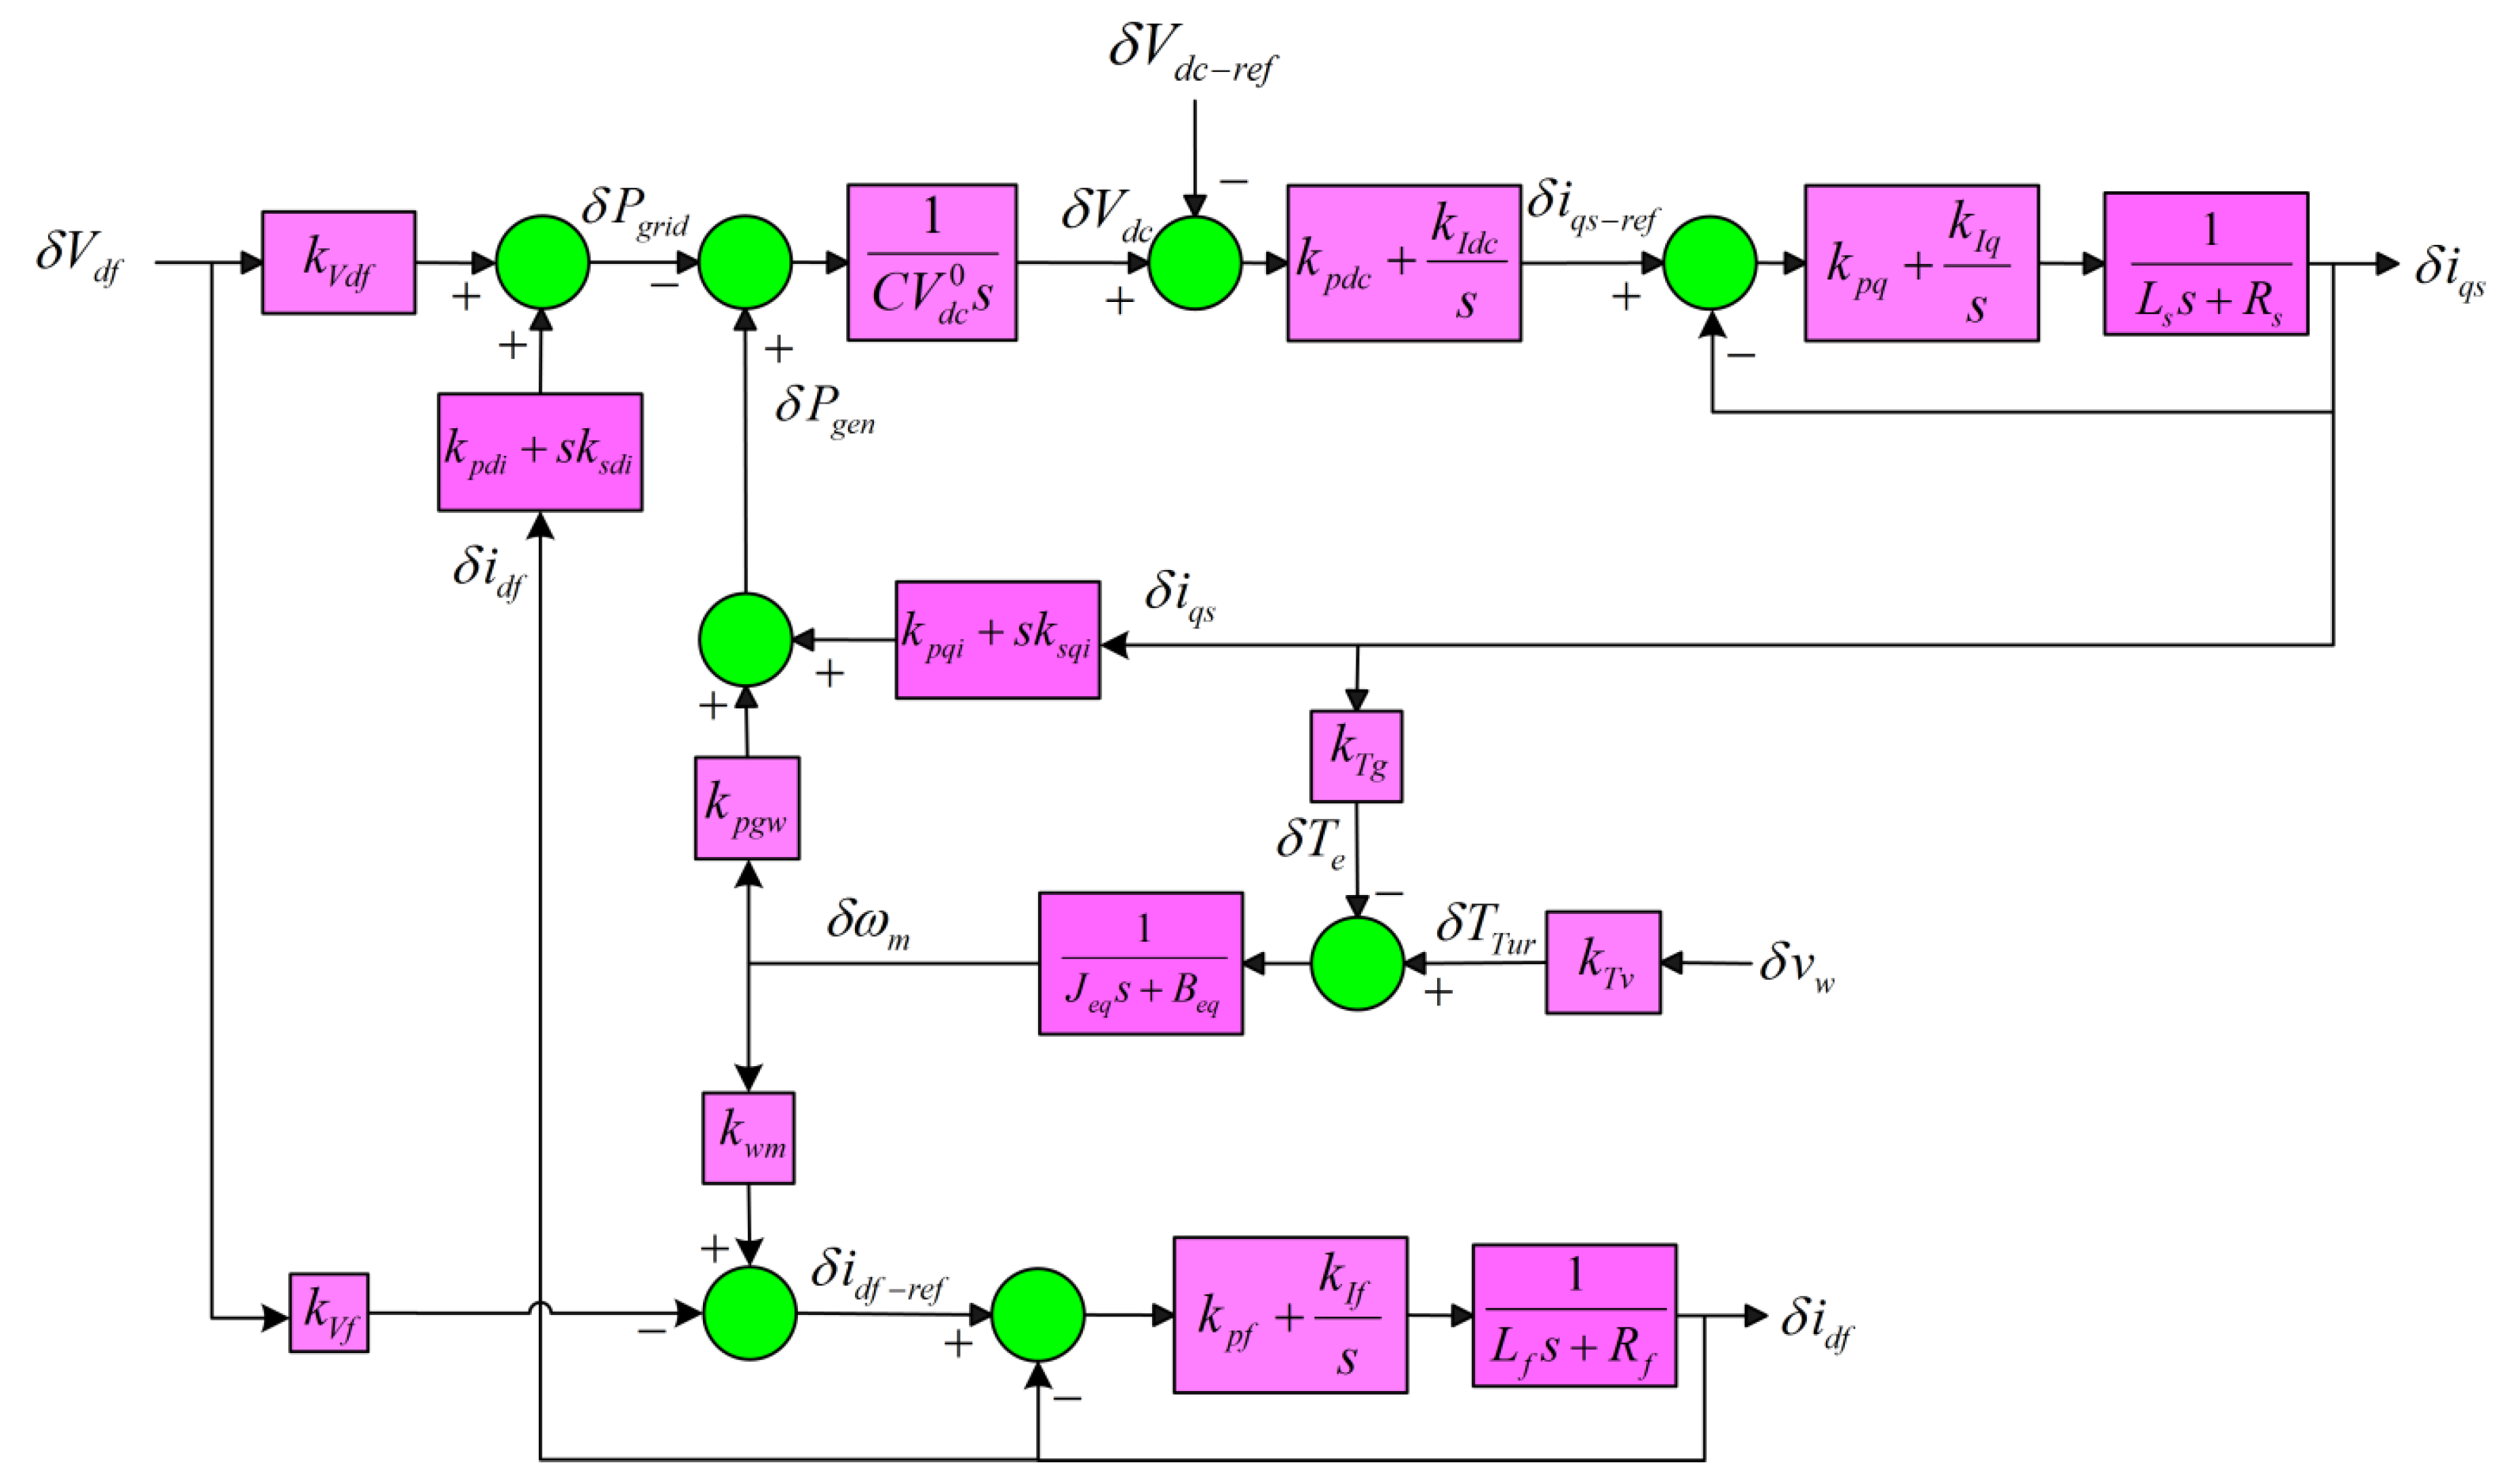
3. Small Signal Model of the Wind Turbine System

In this section, we present the small-signal model of different parts of wind turbines by the equations indicated in Section 2.
For small-signal analysis, it is assumed that each variable x consists of two parts: a fixed value (value at the working point) indicated by X and very small changes around the working point indicated by δx. Correspondingly, a small-signal model of different parts can be obtained.

3.1. Small Signal Model of the Mechanical Part

According to (4), if the sudden variations in the mechanical speed of the turbine are neglected, the mechanical torque of the turbine is a function of wind speed ( v w ) and pitch angle ( β ). As a result, we have [20]:
δ T T u r = k T v δ v w + k T β δ β  
where
k T v = T T u r v w | ( v w 0 , β 0 )                           , k T β = T T u r β | ( v w 0 , β 0 ) .
On the other hand, the small-signal model is expressed by substituting (19) into (5) as follows:
J e q d ( δ ω m ) d t + B e q δ ω m = k T v δ v w + k T β δ β δ T e  
In this paper, the variations of   β are ignored. Consequently, Figure 4 shows the small-signal block diagram of the mechanical part.

3.2. Small-Signal Model of PMSG Electrical Part

To analyze the voltage drop across the grid, only the q-axis equations of the PMSG are required. Thus, the linearized version of (7) is found as follow:
R s δ i q s + L s d ( δ i q s ) d t = δ V q s k w m q δ ω m  
where
k w m q = p 2 ψ .
Using (8) and (9), the instantaneous active output power and PMSG torque can be linearized as follows:
δ P g e n = k p g w δ ω m + ( k p q i + s k s q i ) δ i q s  
δ T e = k T g δ i q s  
where
k T g = 3 2   p 2 ψ ,         k p g w = 3 2 p 2 ψ i q s 0 ,         k p q i = 3 2 p 2 ψ ω m 0 3 R s i q s 0 ,         k s q i = 3 2 p 2 ψ i q s 0 .
It should be noted that   k s q i is a positive coefficient and k p q i is a negative coefficient. Figure 5 shows the small-signal block diagram of (22).

3.3. Small-Signal Model of DC-Link

To model the back-to-back converter, the averaged model of converters is used. In this case, it is assumed that these converters produce exactly the desired waveform without the effects of the high switching frequency. With this assumption, the back-to-back converter can be modeled as a dc-link, in which the generated active power of PMSG is received from MSC-side; then, the active power is injected to the grid by GSC. Hence, the small-signal model of the dc-link is expressed using (10) as follows:
δ P g e n ( t ) δ P g r i d ( t ) = C V d c 0 d δ V d c ( t ) d t  
However, in (24), the term d V d c ( t ) d t | V d c 0 is neglected. Furthermore, the term δ P g r i d ( t ) is calculated in Section 3 and Section 4. Figure 6 shows the small-signal block diagram of dc-link voltage.

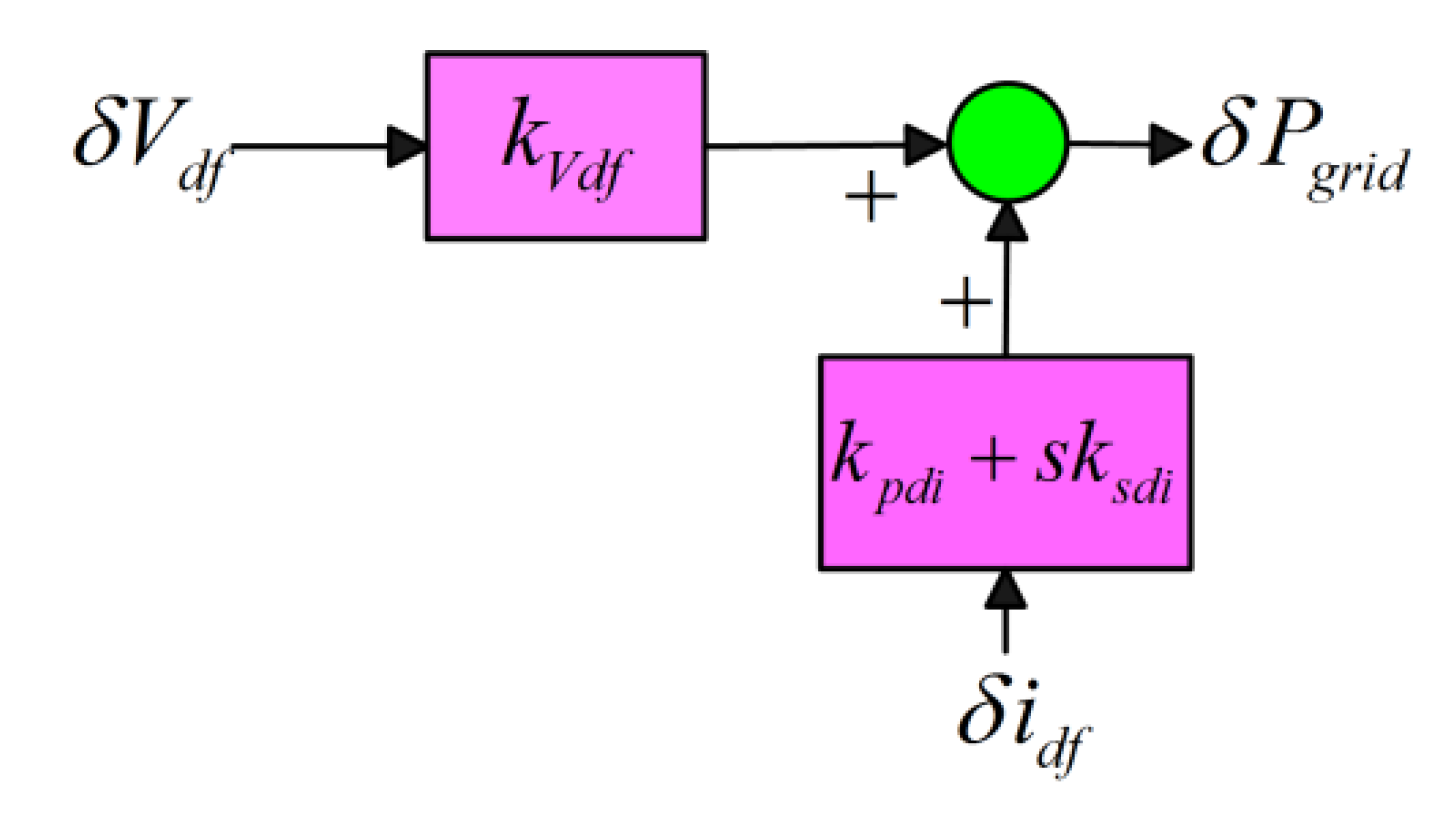
3.4. Small-Signal Model of Grid-Side

The small-signal model of the grid in (25) and (26) is obtained by linearizing (11) and (13), respectively, as:
R f δ i d f + L f d ( δ i d f ) d t = δ e d f δ V d f  
δ P g r i d ( t ) = k V d f δ V d f + ( k p d i + s k s d i ) δ i d f  
where
k V d f = 3 2   i d f 0 ,         k p d i = 3 2 V d f 0 + 3 R f i d f 0 ,         k s d i = 3 2 L f i d f 0 .
The block diagram-based illustration in Figure 7 shows the small-signal model of the instantaneous power injected into the grid using (26).

3.5. Small-Signal Model of Back-to-Back Converter Controllers

To obtain the integrated small-signal model, including the control circuits and the electrical and mechanical parts of the wind turbine, in this section, we obtain the small-signal model of the MSC and GSC controllers.

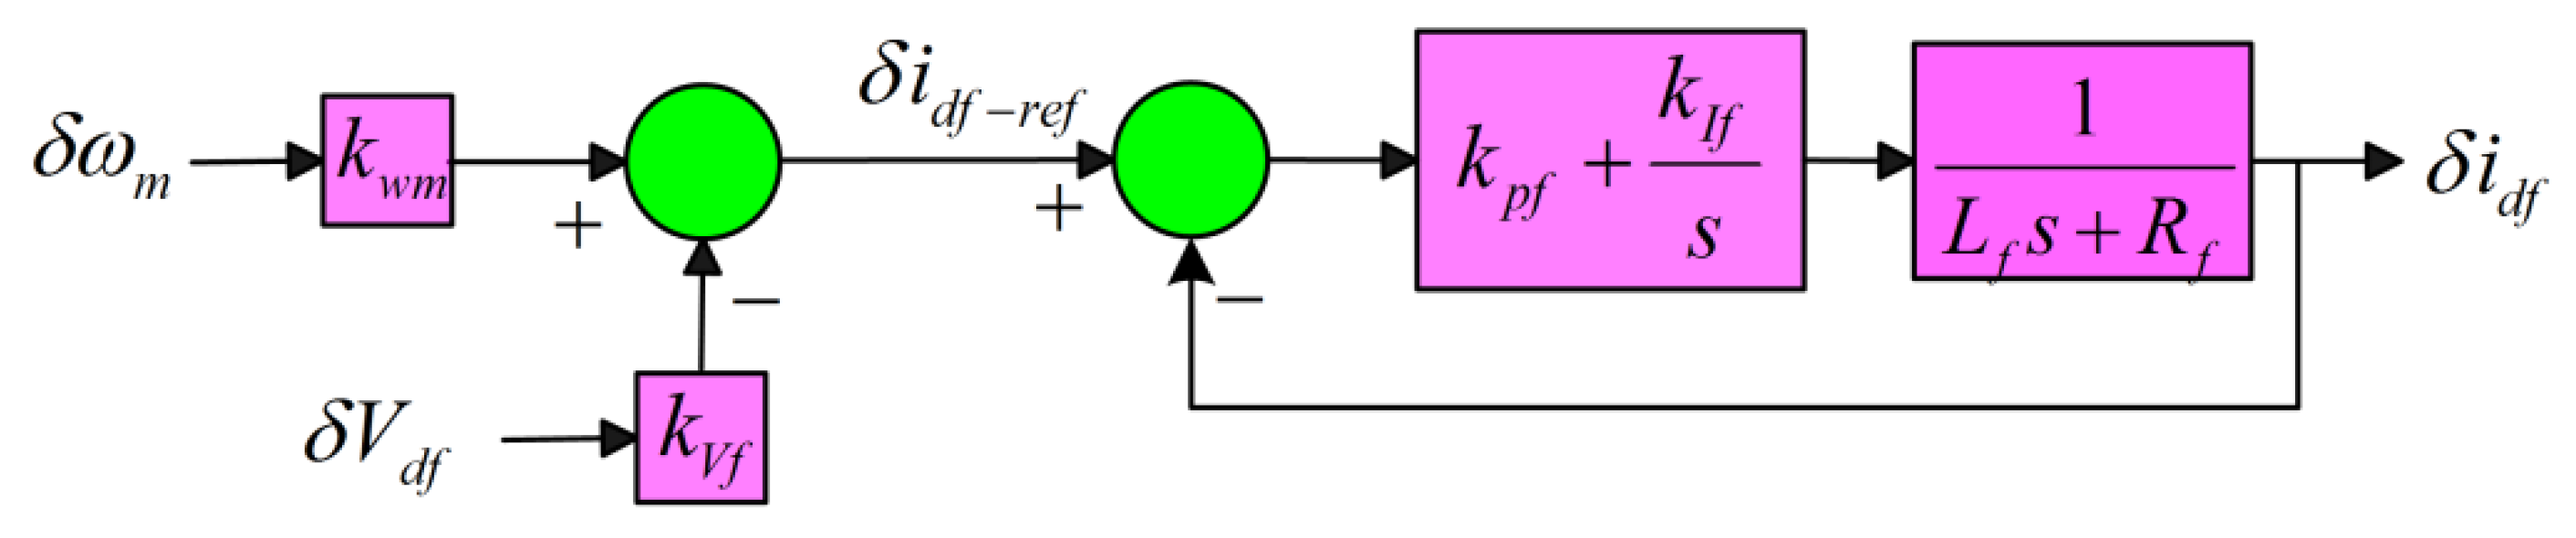
3.5.1. Small-Signal Model of MSC Controller

According to Section 2.2.1, as well as (14) and (15), the small-signal model of the MSC controller is obtained as follows:
δ i q s r e f = k p d c ( δ V d c ( t ) δ V d c r e f ( t ) ) + k I d c ( δ V d c ( t ) δ V d c r e f ( t ) ) d t  
δ V q s C = k p q ( δ i q s r e f ( t ) δ i q s ( t ) ) + k I q ( δ i q s r e f ( t ) δ i q s ( t ) ) d t + k w m q δ ω m  
By replacing (27) in (28), a small-signal model of δ V q s C (control input) of the MSC converter is calculated. In addition, an illustration can be obtained by substituting the model of δ V q s C in (21), as shown in Figure 8.

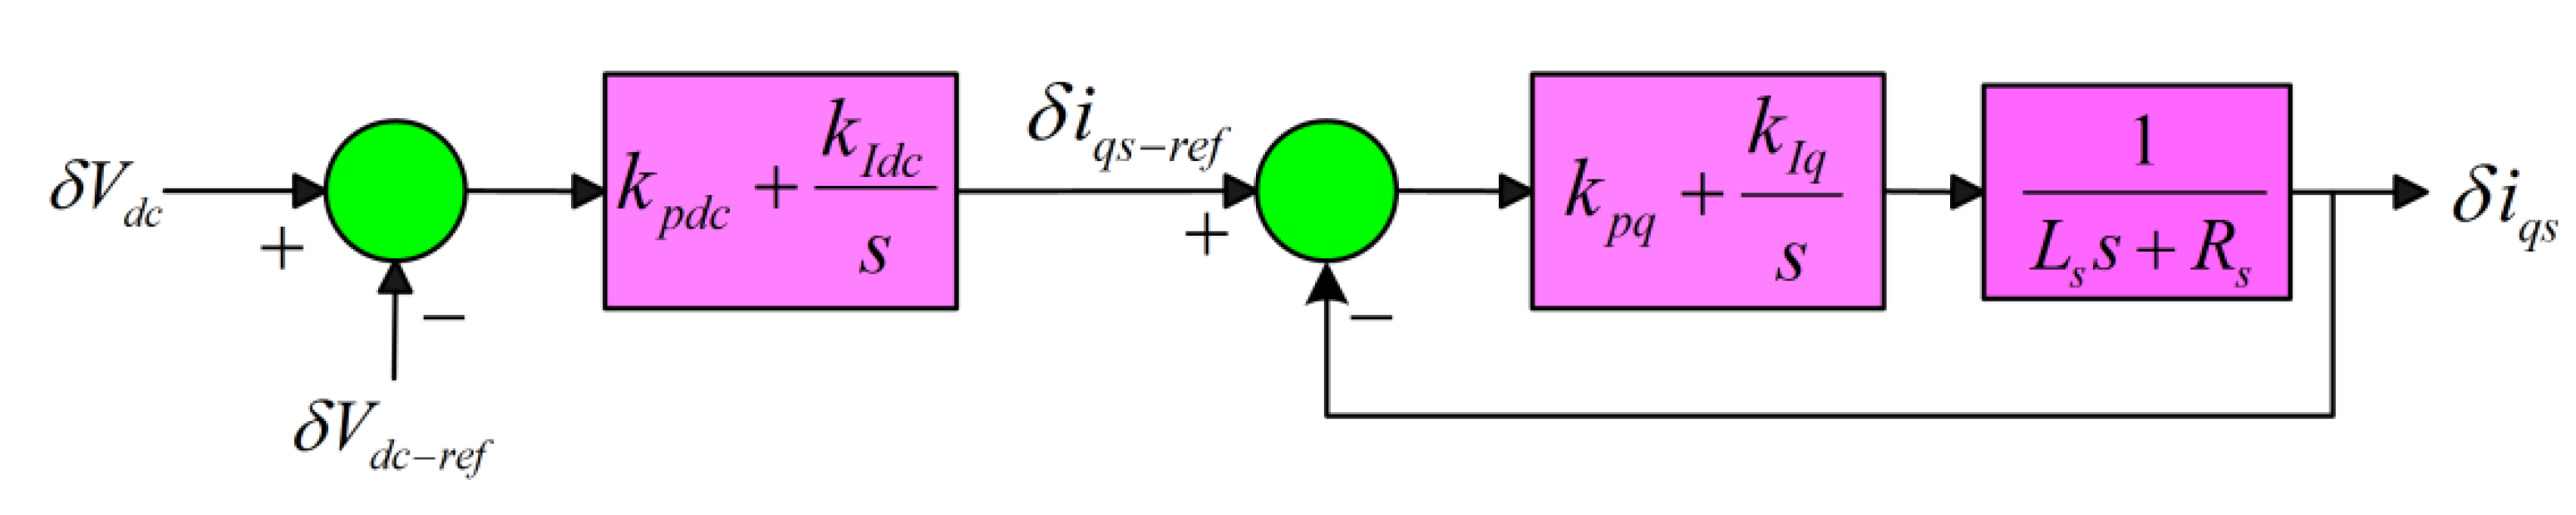
3.5.2. Small-Signal Model of GSC Controller

According to Section 2.2.2 and (17), the small-signal model of the d-axis reference current ( i d f r e f ) is obtained as follows:
δ i d f r e f = k w m δ ω m k V f δ V d f  
where k w m = 2 k o p t ω m 0 V d f 0 + 2 R f i d f 0 ,           k V f = i d f 0 V d f 0 + 2 R f i d f 0 .
To determine the current limit of the converter, the current of the converter should be measured at the operating point. In addition, the maximum allowable current should be less than the current of the operating point in (29). Accordingly, in the small-signal model, the maximum current limit is determined by the converter current at that operating point. According to Figure 1c, the small-signal model of d-axis control circuit is given as follows.
δ e d f C = k p f ( δ i d f r e f ( t ) δ i d f ( t ) ) + k I f ( δ i d f r e f ( t ) δ i d f ( t ) ) d t + δ V d f  
By replacing (29) in (30), the d-axis control voltage (control input) of the GSC converter is obtained.
Moreover, the block diagram in Figure 9 is obtained by replacing the proposed model for   δ V q s C in (25).

4. Simulation Results

By integrating of the small-signal model of all parts and adding the small-signal model of the controllers, the comprehensive small-signal model diagram block of the PMSG -based wind turbine system is obtained (Figure 10). The input signals of this block diagram are   δ V d c r e f ,   δ v w , and   δ V d f . The performance of the controller in [7] was evaluated by the proposed small-signal model to control and improve the LVRT. Hence, the system performance against   δ V d c r e f and   δ V d f changes was analyzed.
To evaluate the accuracy of the proposed model, a 1.5 MW generator was simulated in MATLAB/SIMULINK software. This simulation used predefined SIMULINK blocks. In addition, the switching frequency of the converters as 5 kHz. The detailed specifications of this system are shown in the Appendix A. To confirm the validation of the proposed small-signal model, the simulation results were compared with the results of the block diagram in Figure 10.
In this section, the simulation is presented for three different cases (Cases (a)–(c)).
Case (a) Optimization of the PI controller gains in the dc-link voltage loop
Case (b) Step response simulation and comparison of the   δ V d f
Case (c) Step response simulation and comparison of the   δ V d c r e f .

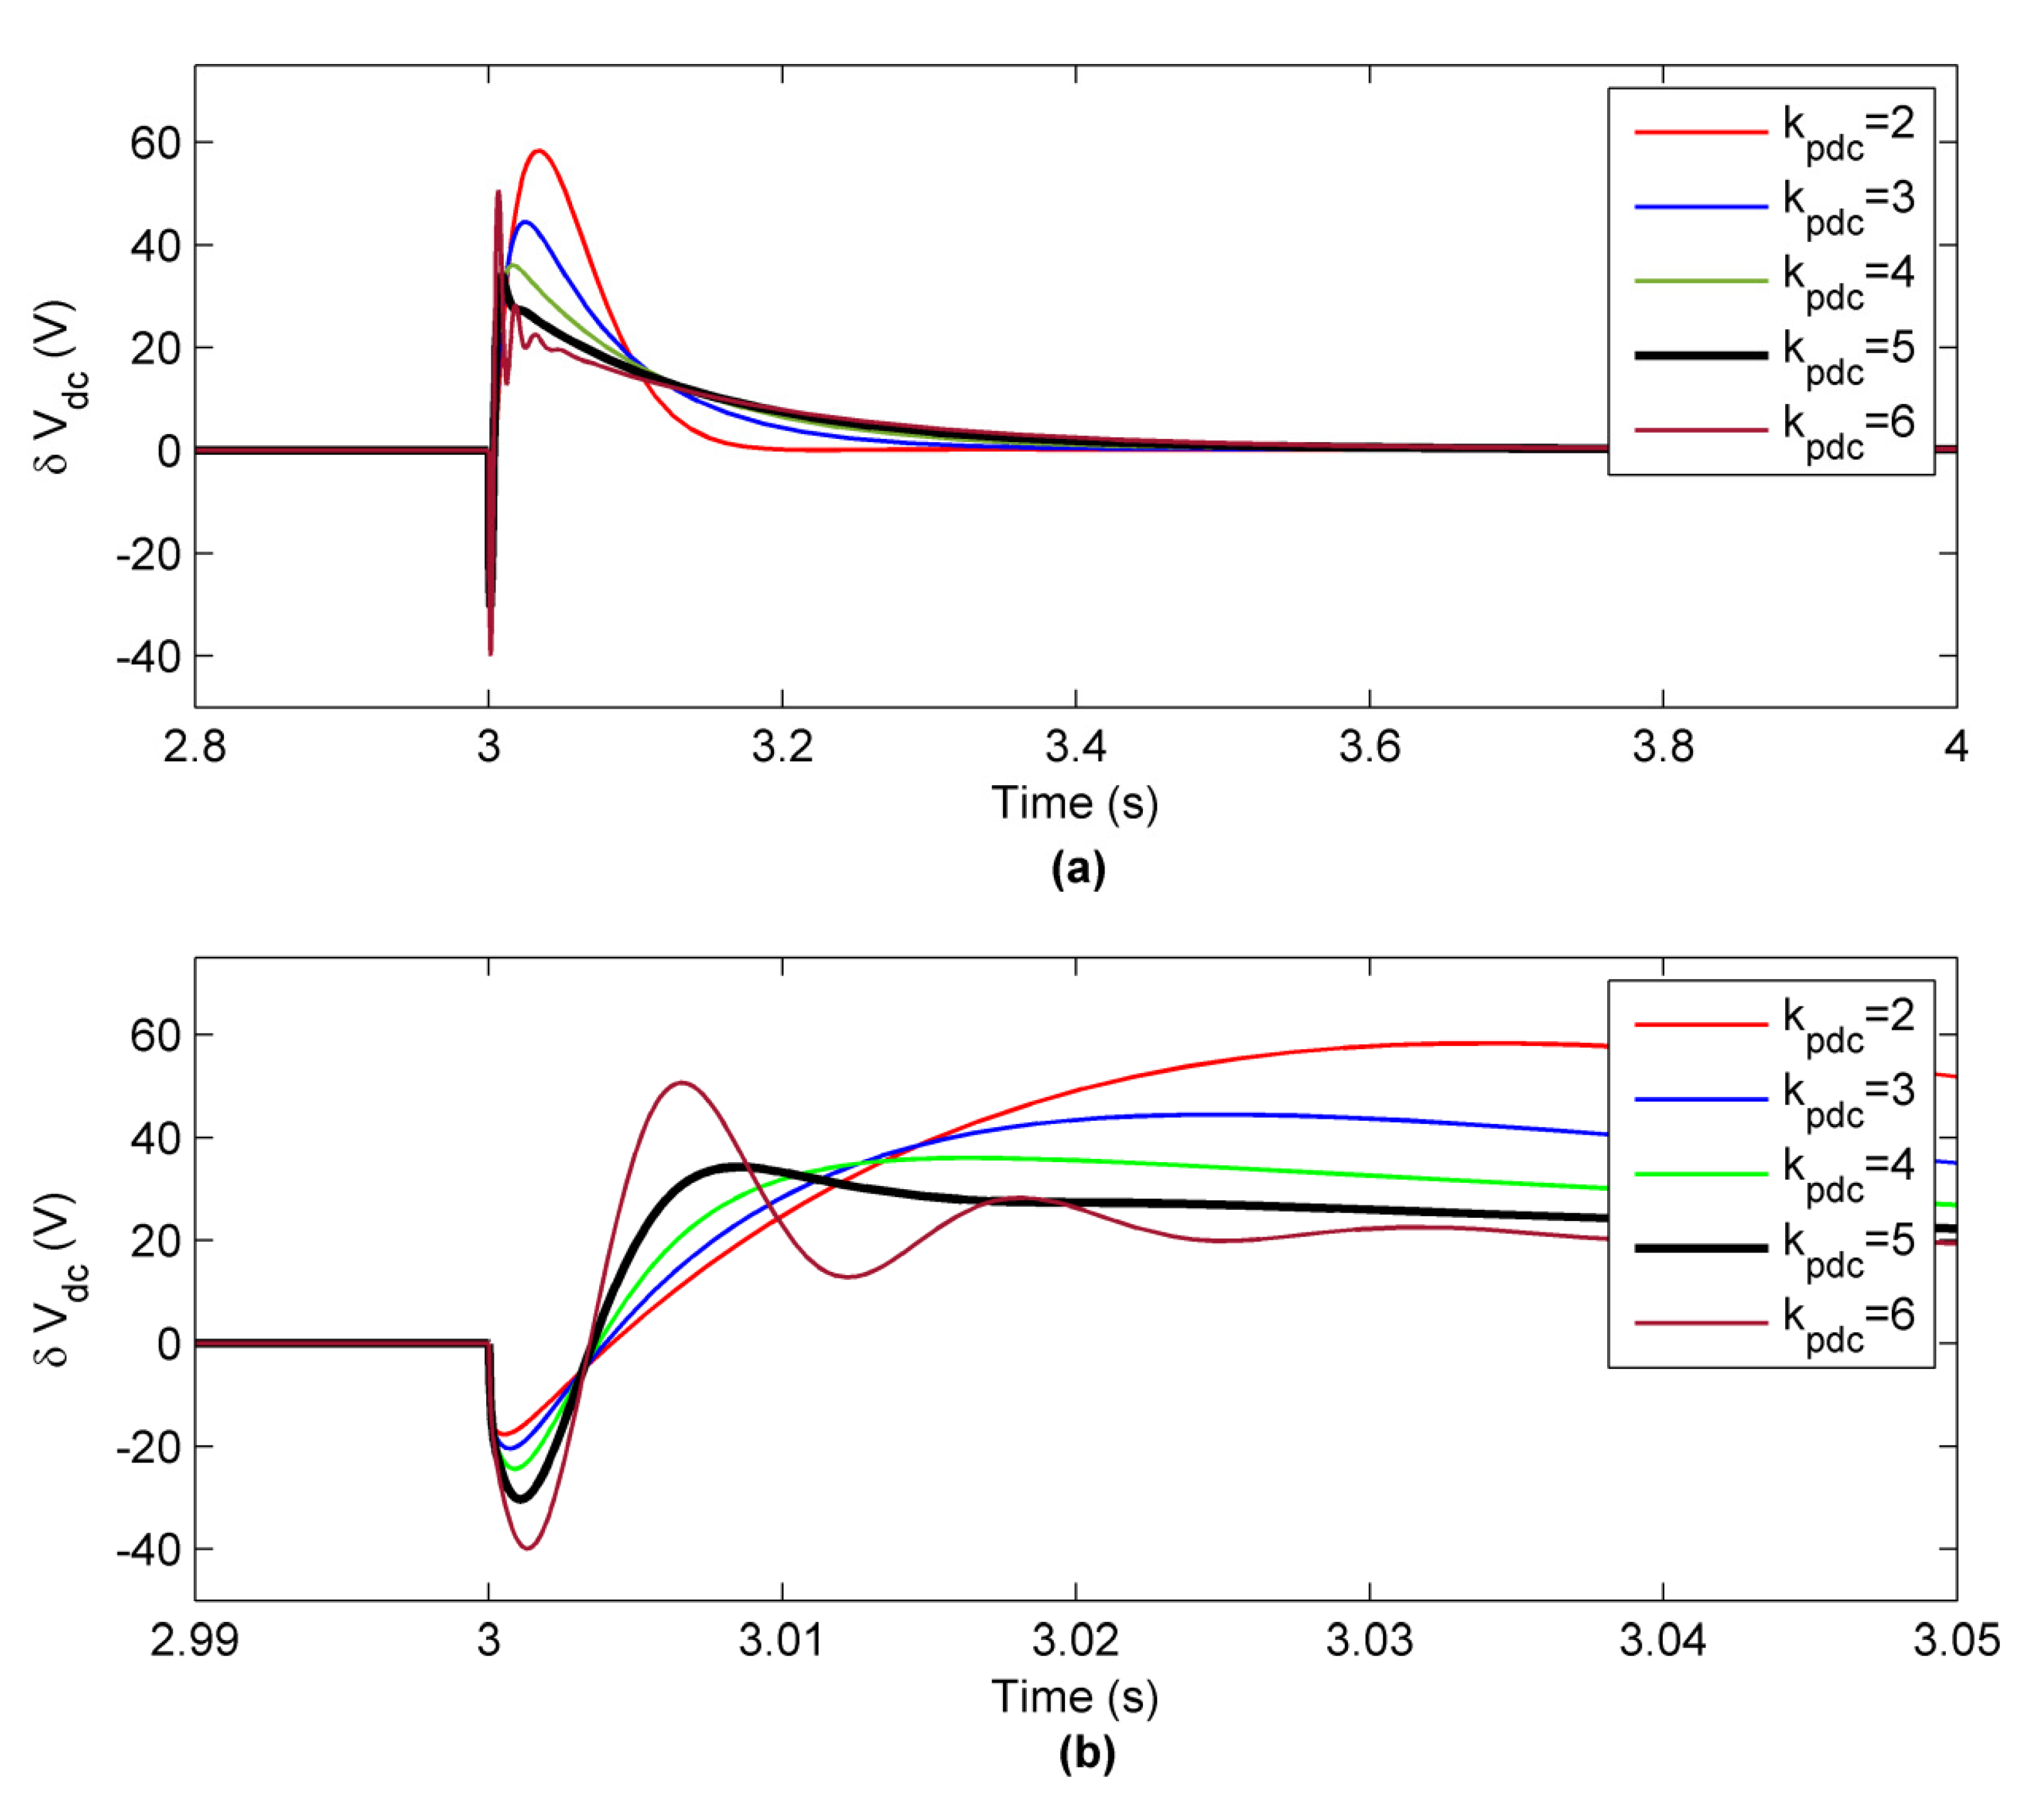
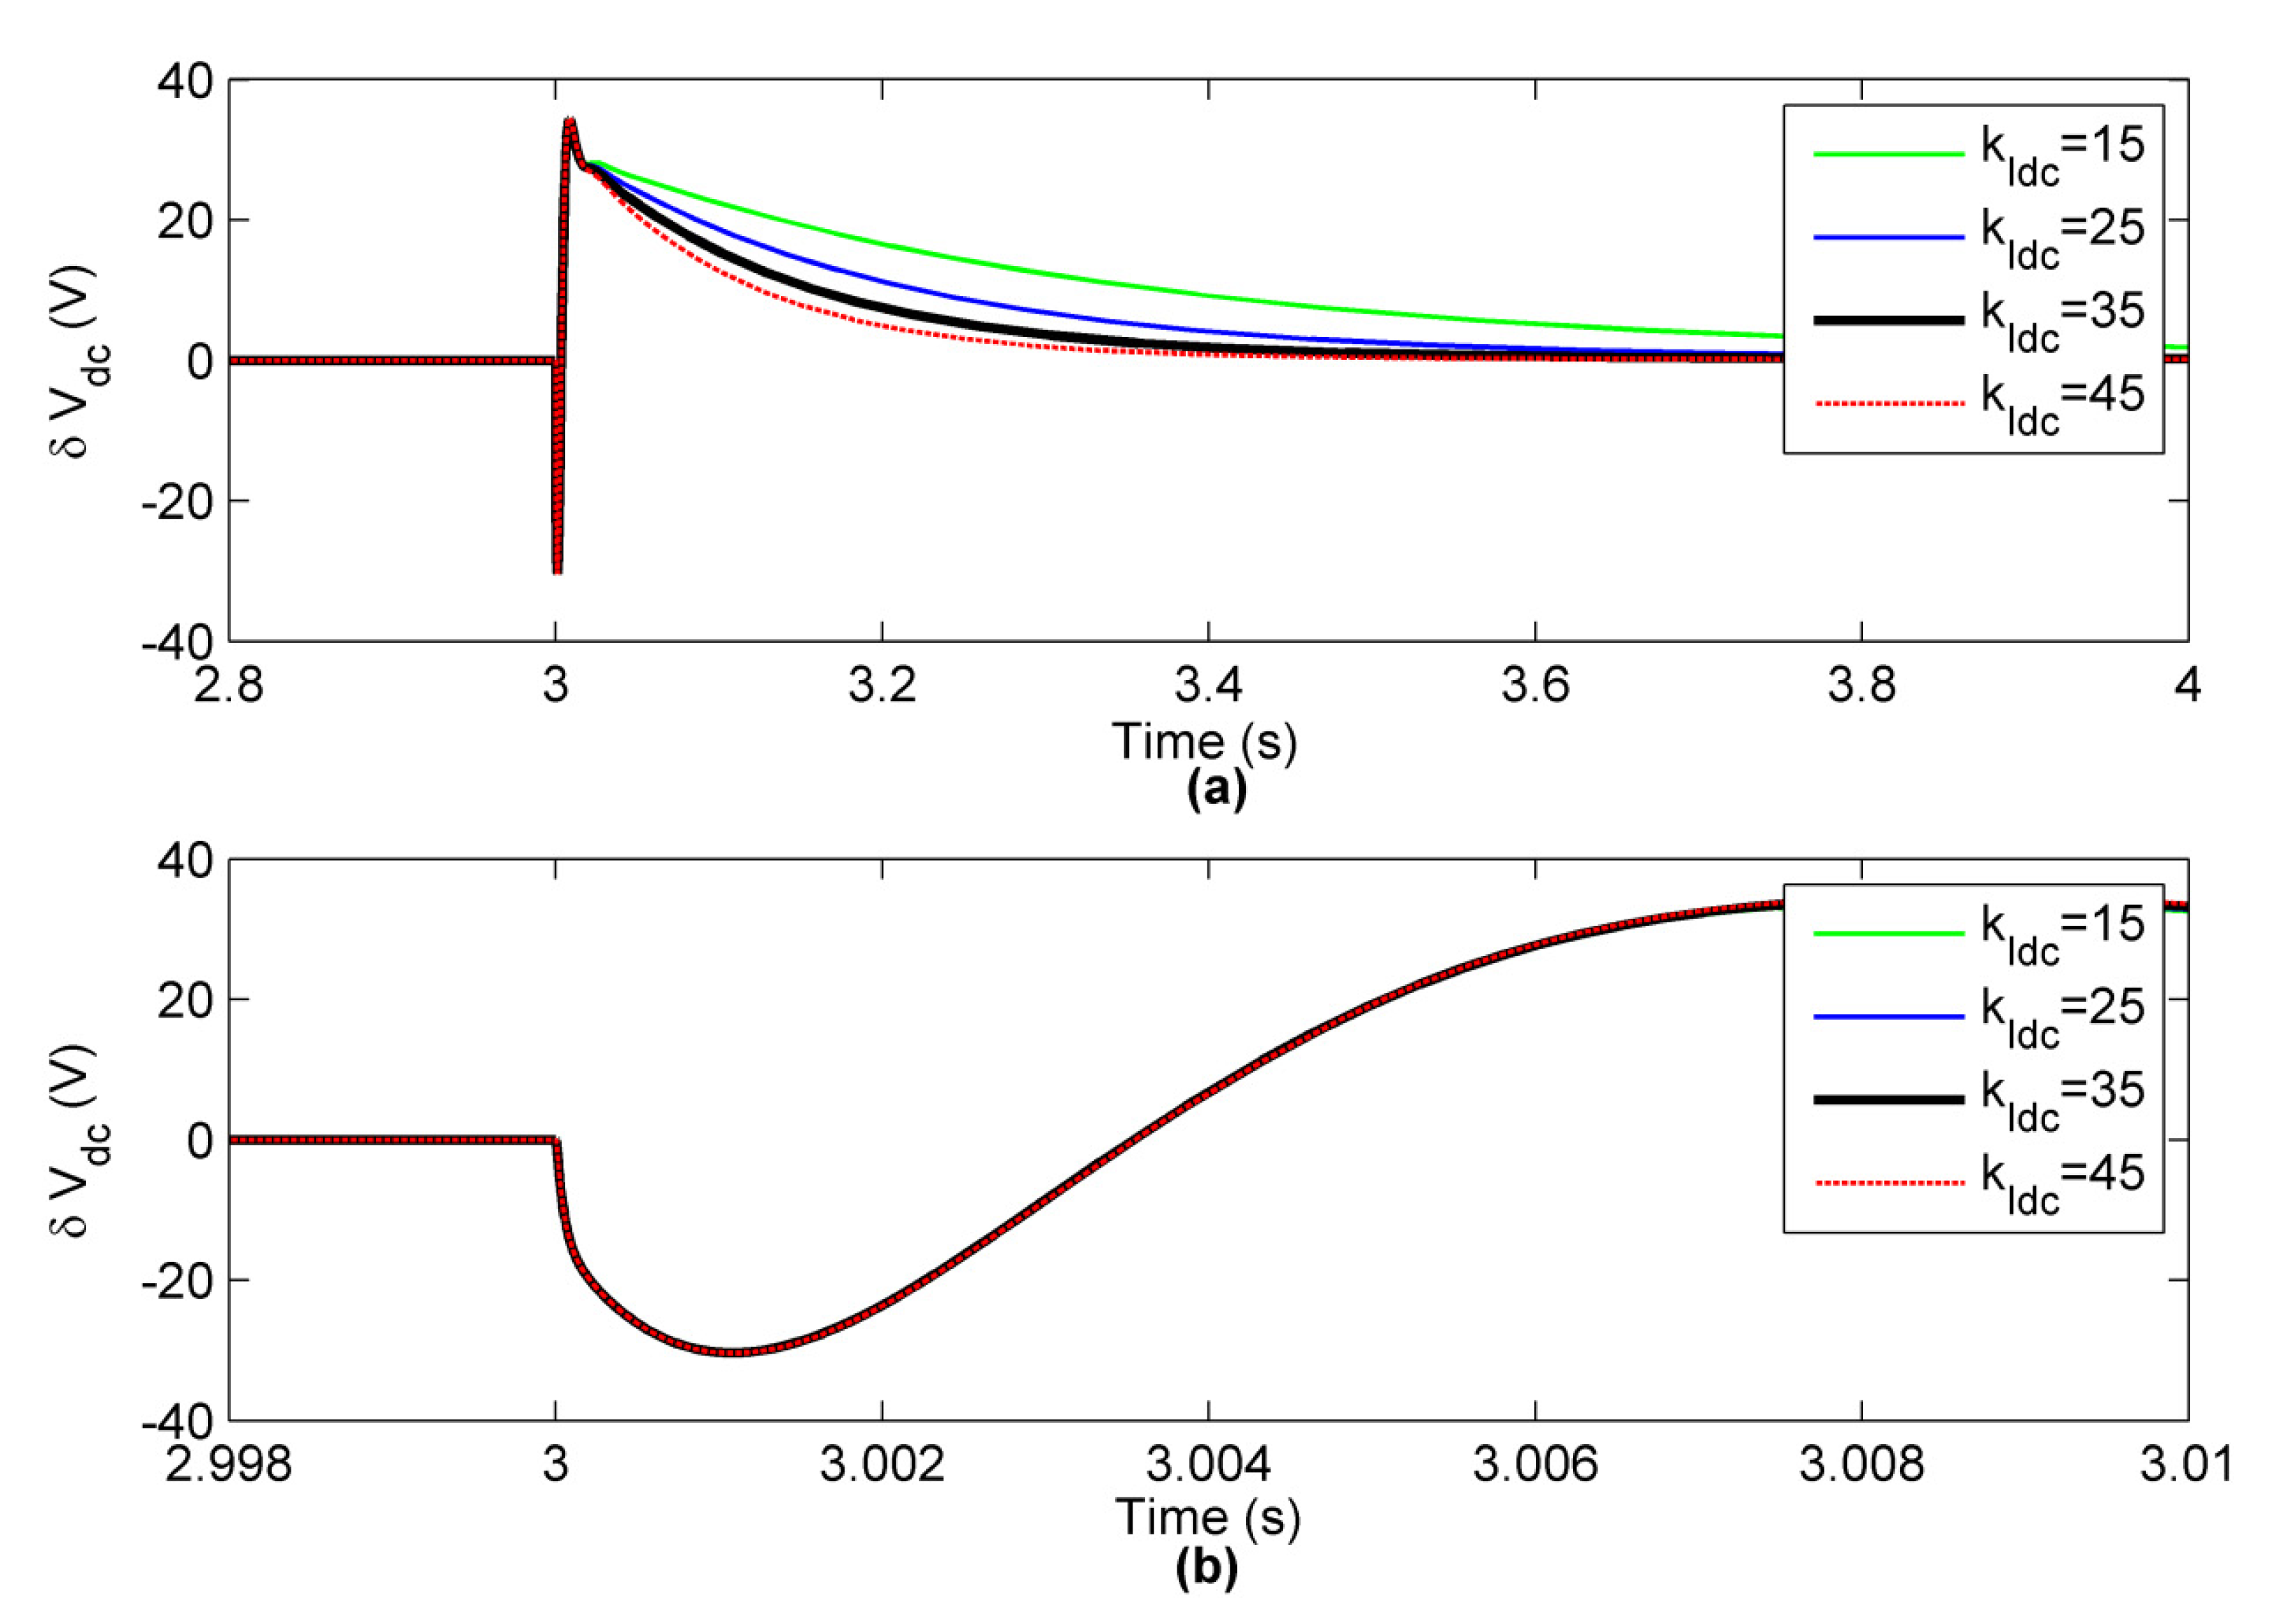
4.1. Case (a) Optimization of the PI Controller Gains in the DC-Link Voltage Loop

The optimal values of PI gains were obtained using the proposed small-signal model. This can be achieved by varying the PI gains of the dc-link voltage controller.
Initially, the proportional gain of the dc-link voltage loop controller ( k p d c ) was changed from 2 to 6, as shown in Figure 11a, and, in all steps, a 50% voltage drop was given at PCC voltage ( δ V d f ). As shown in Figure 11b, by increasing the gain to 5, the overshoot of the dc-link voltage decreases, although the undershoot value has the opposite trend as the overshoot decreases. However, at the value 6, the amount of overshoot increases again. Therefore, the proportional gain of 5 seems to be a good value for   k p d c .
Furthermore, to determine the value of the integral gain ( k I d c ), the value of k p d c was set to 5. Additionally, k I d c was increased from 15 to 45 in steps of 15 (Figure 12a). As can be seen, by increasing this gain to 45, the speed of reaching to the final value increases. In contrast, the high amounts of gains have no significant effect on damping speed. Therefore, the gain of 35 was selected for k I d c . According to Figure 12b, the noteworthy point is that the amount of k I d c does not affect the amount of undershooting.

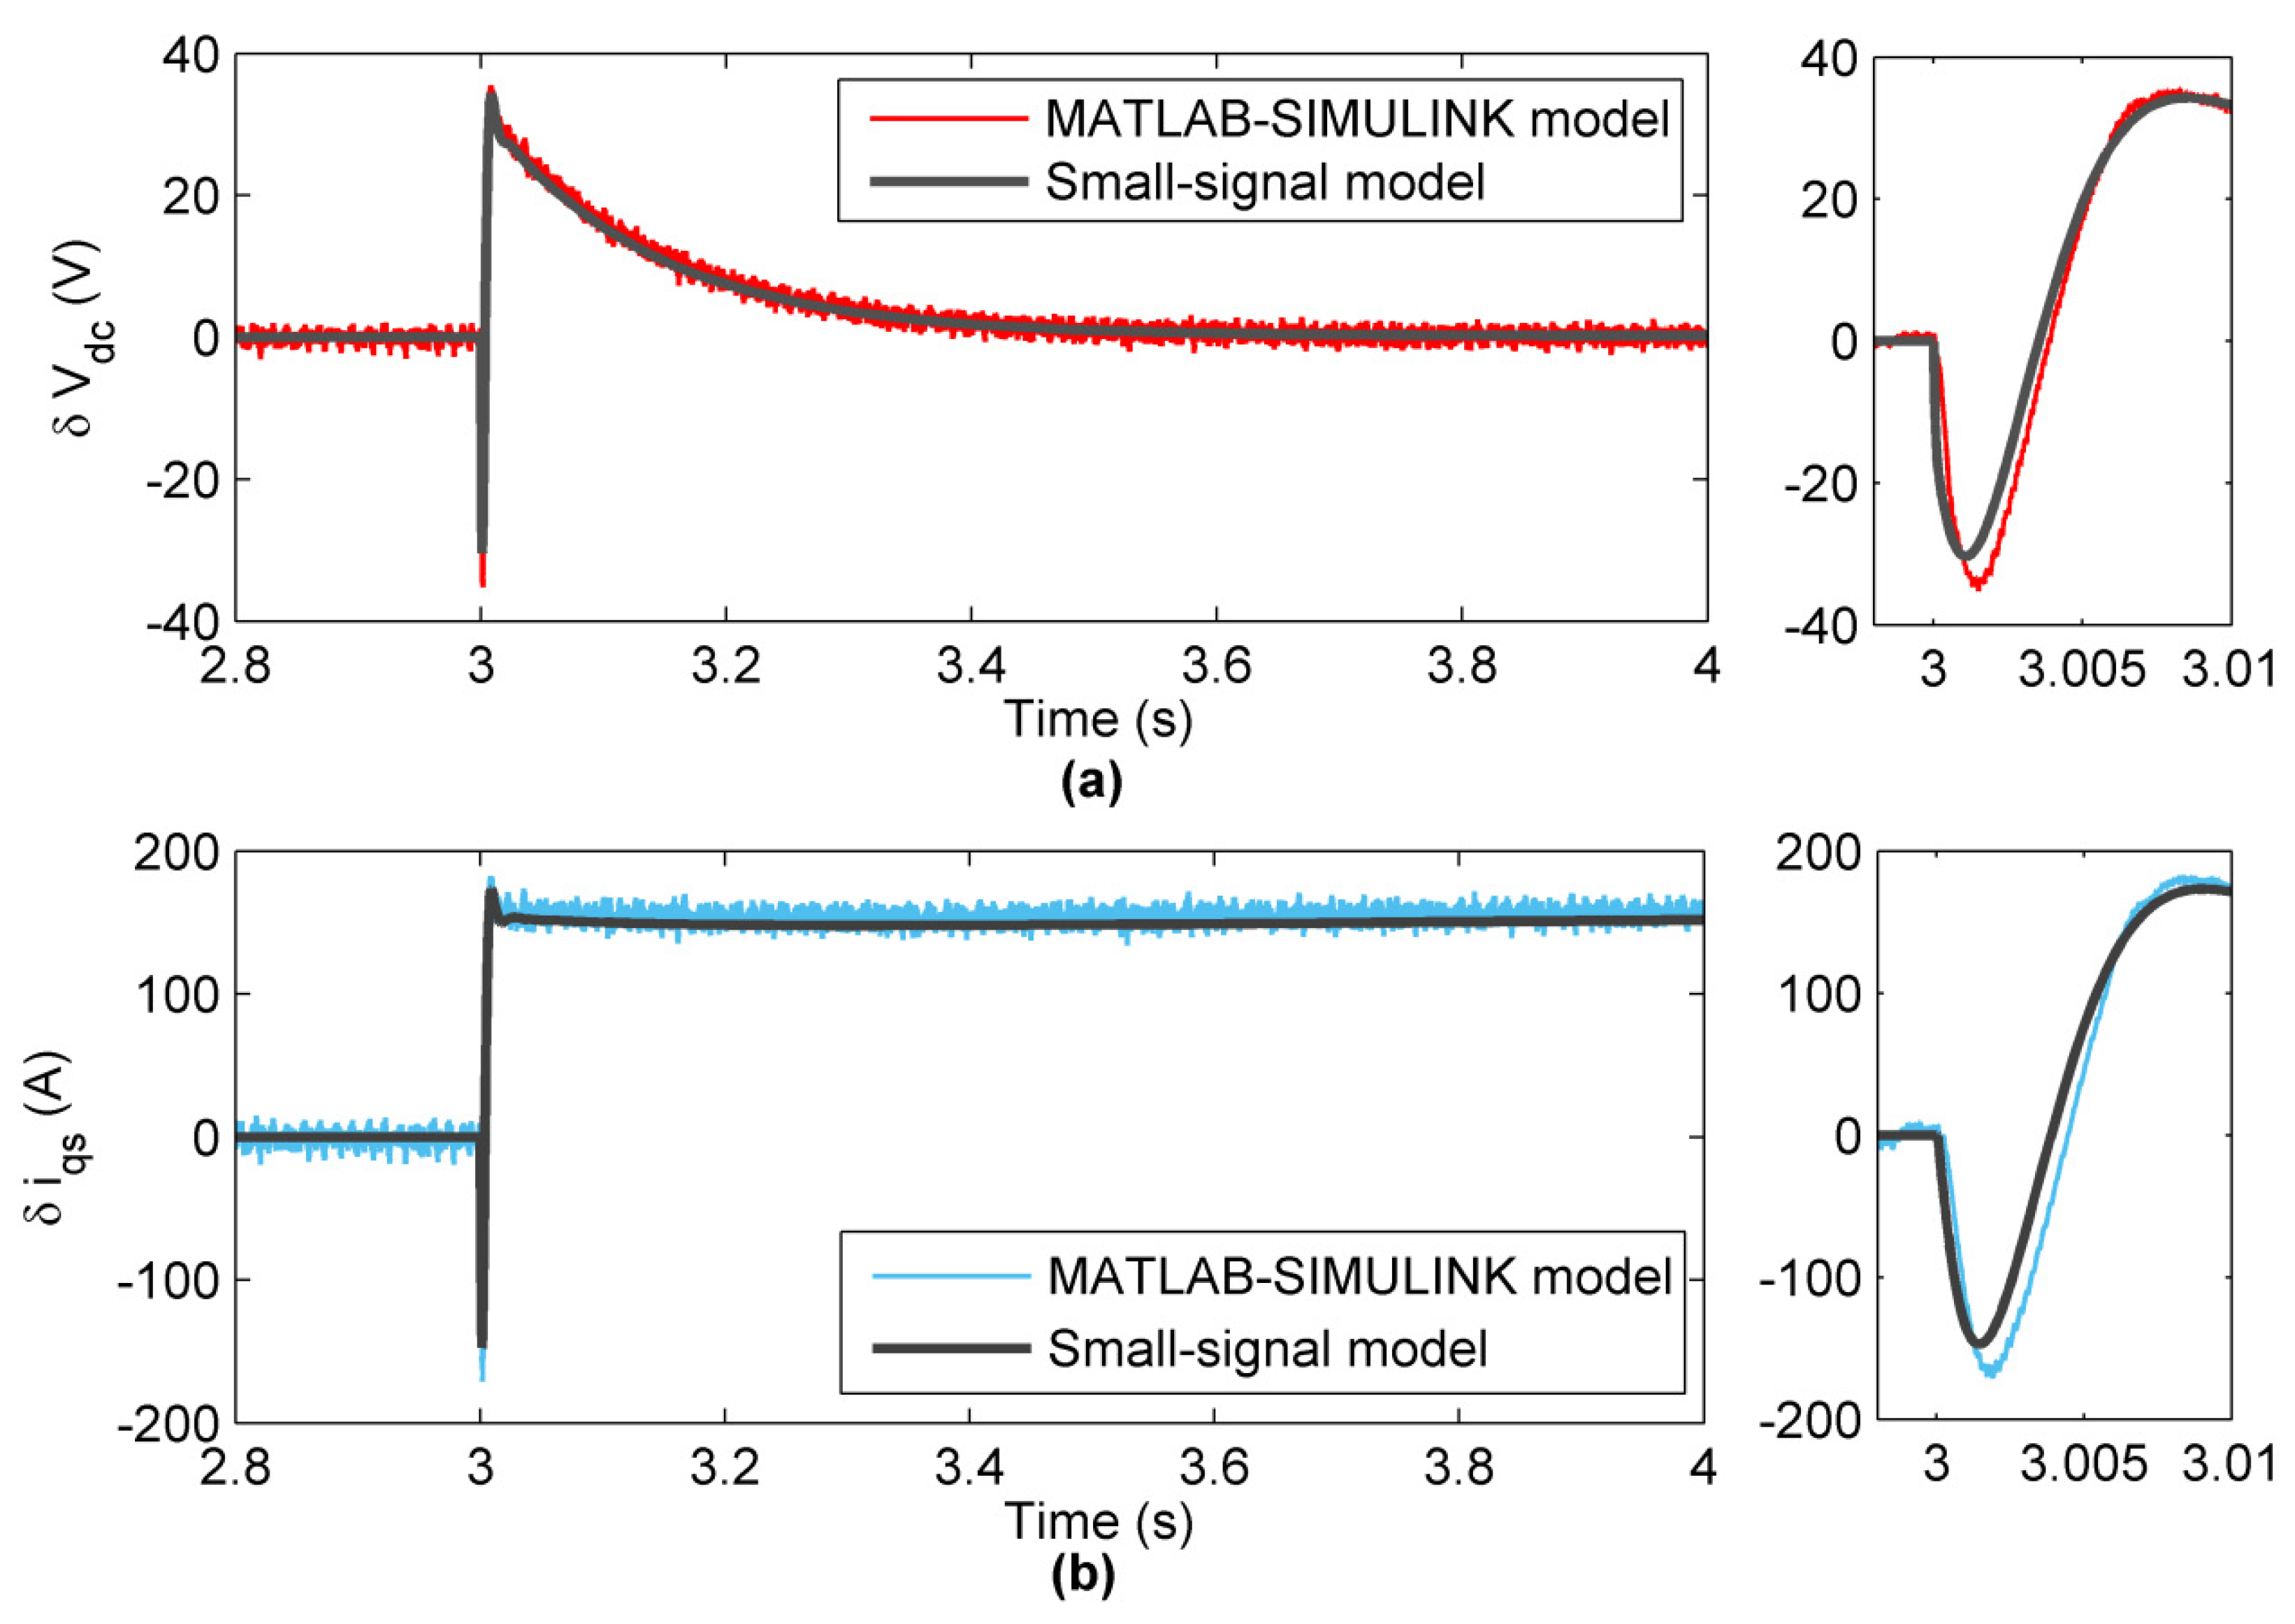
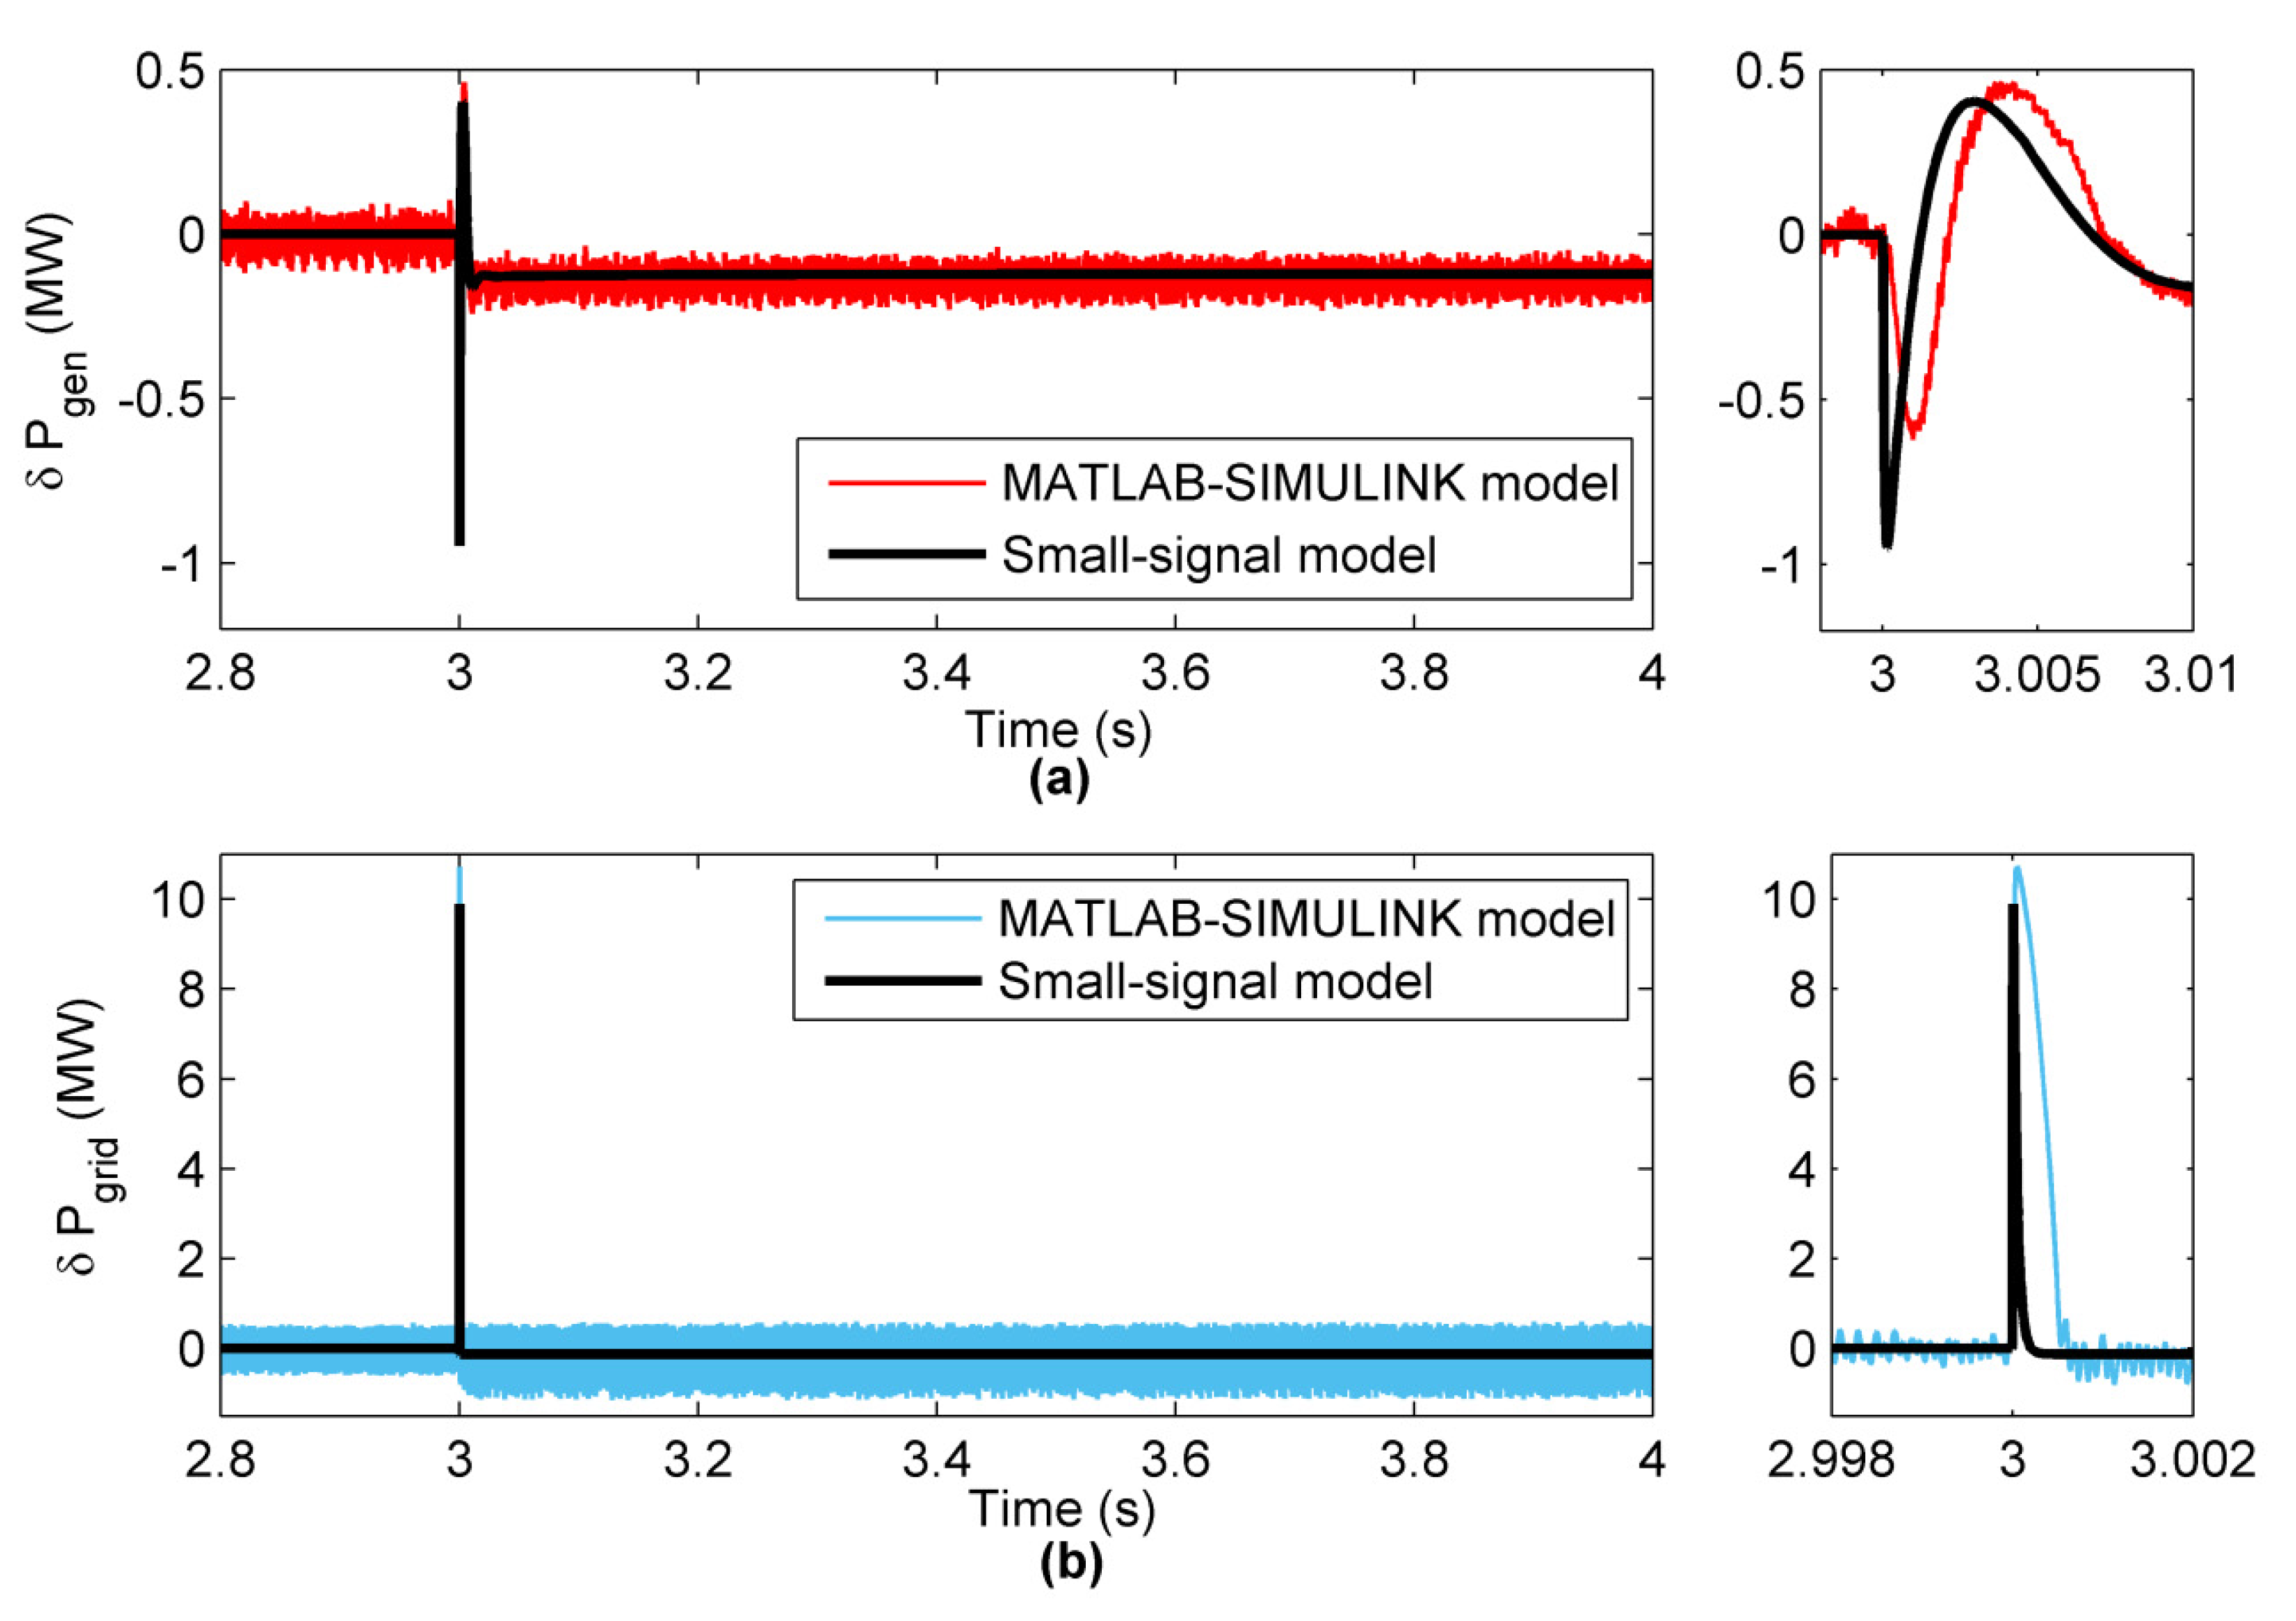
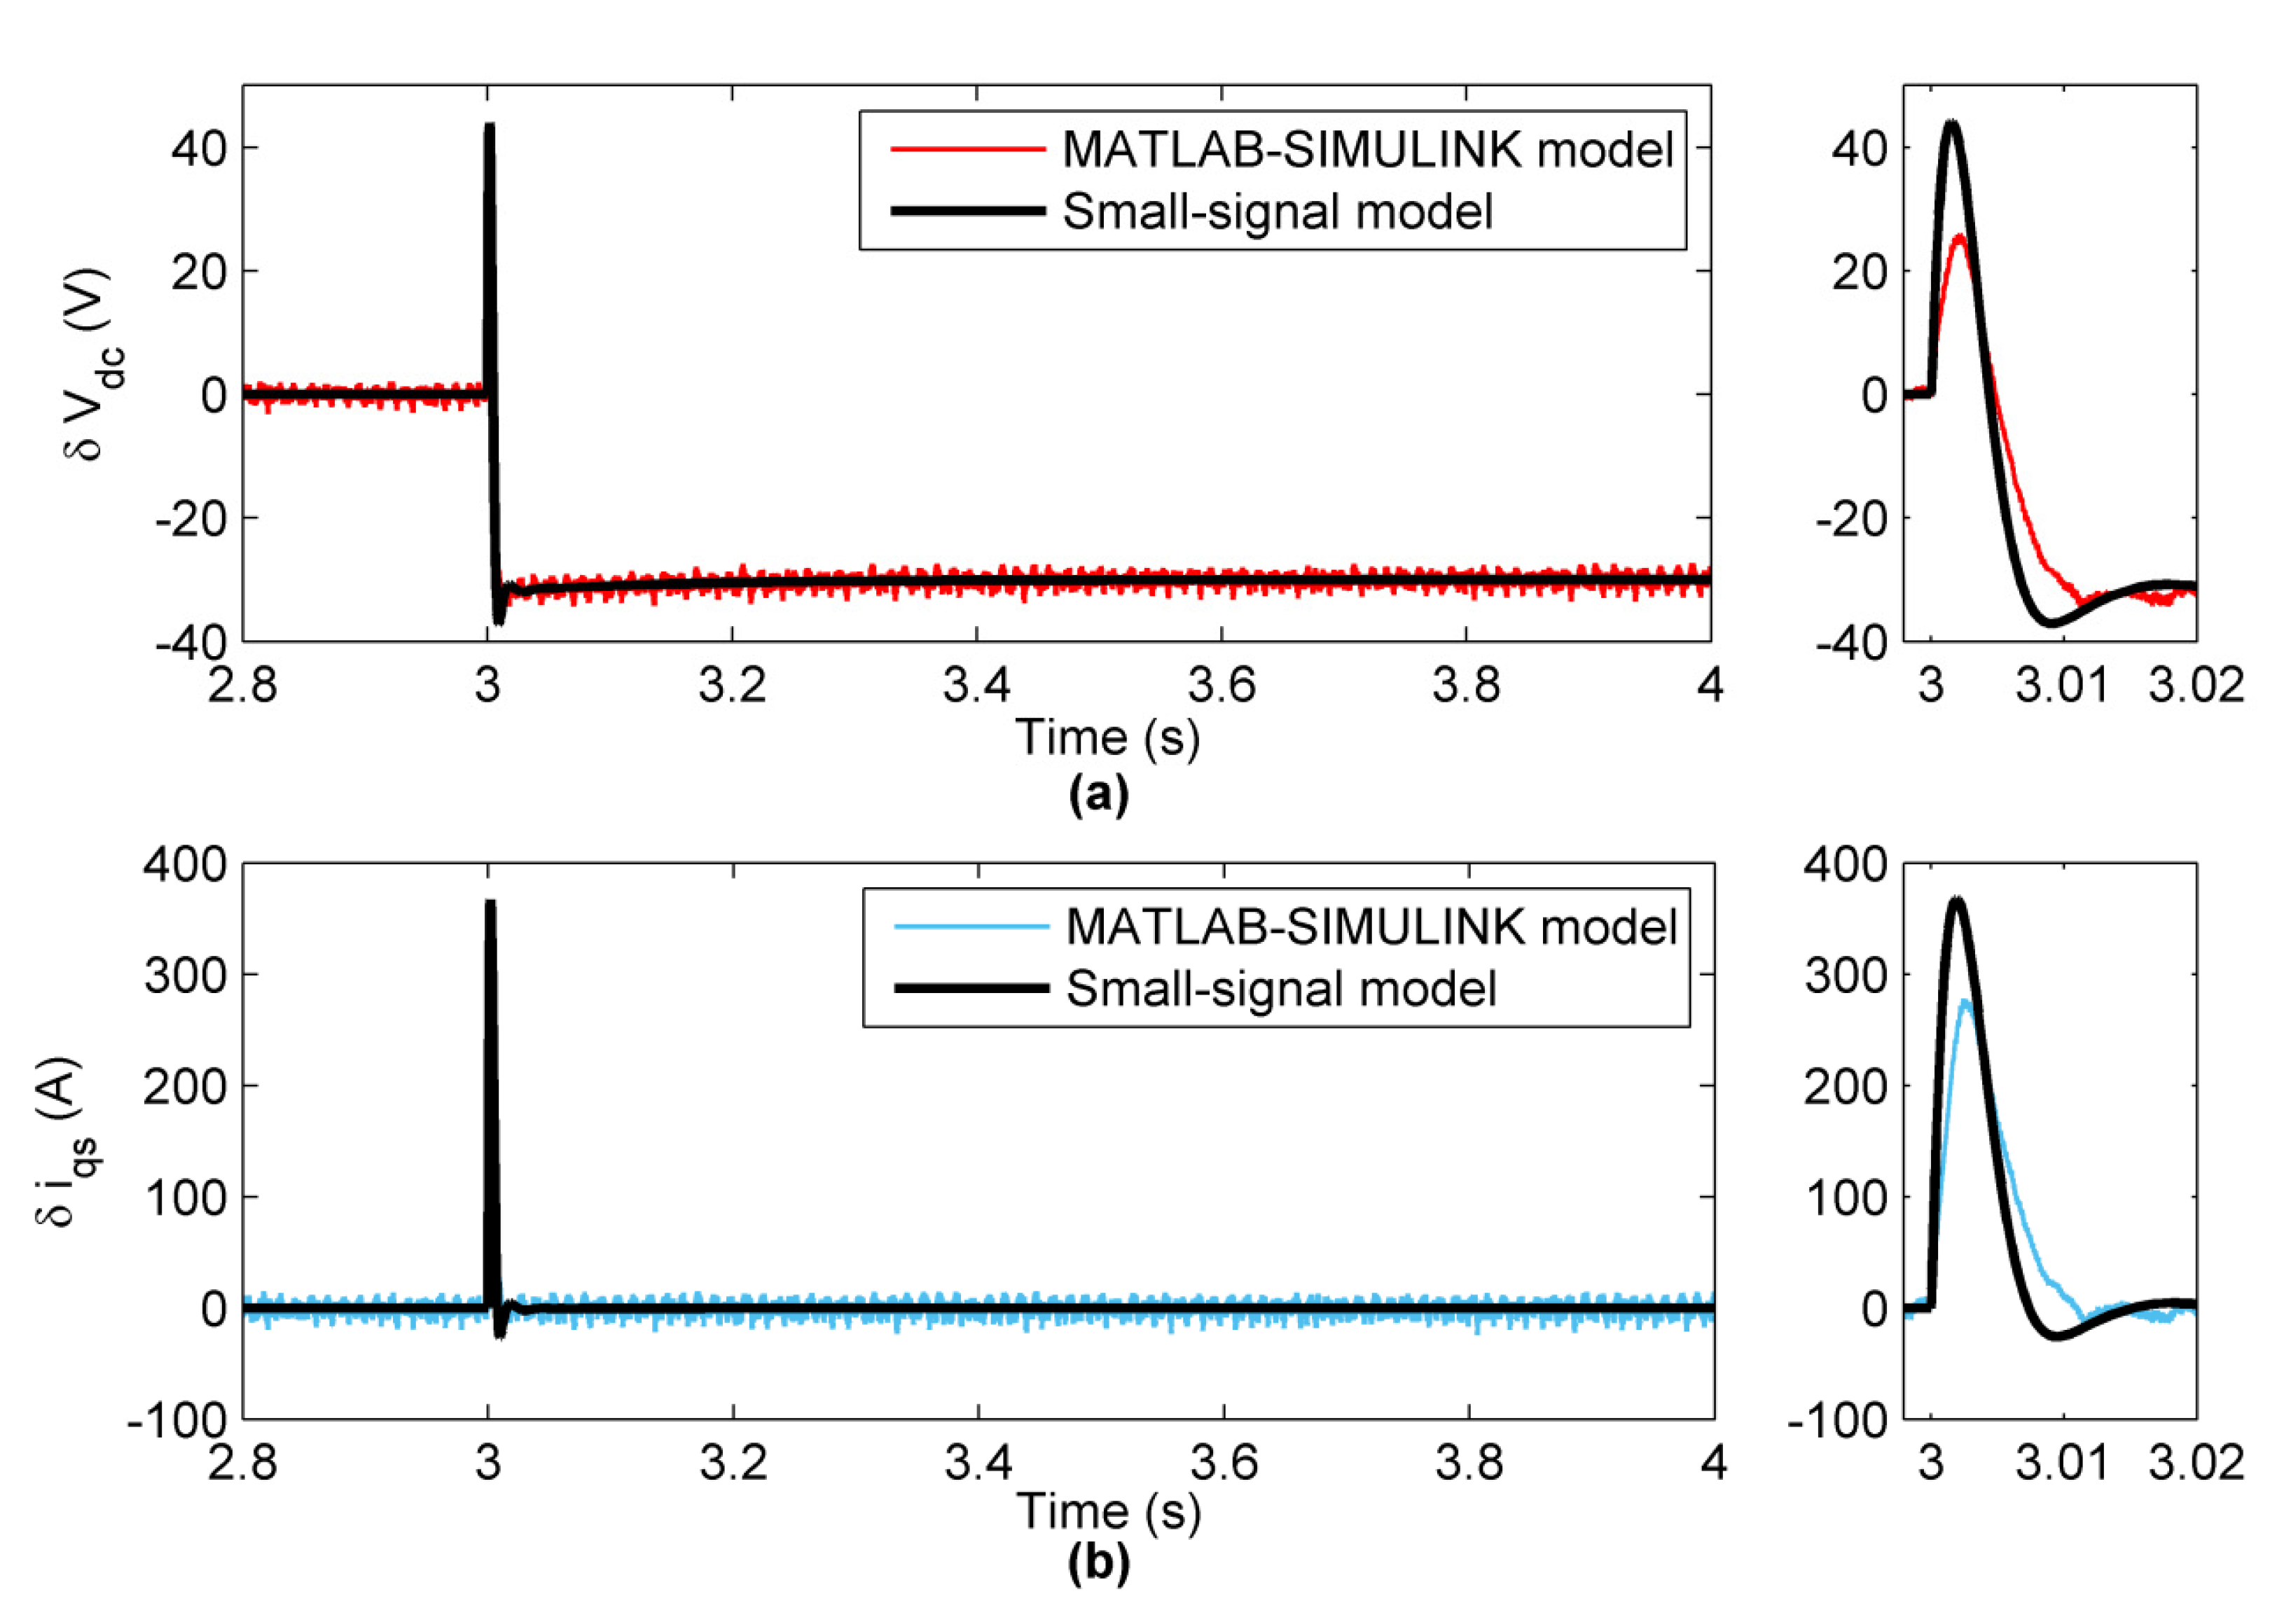
4.2. Case (b) Step Response Simulation and Comparison of the   δ V d f

In this case, the proposed small-signal model was compared with the predefined block-based simulation results in MATLAB/SIMULINK (MATLAB-SIMULINK model) for the   δ V d F step change response. By applying a voltage drop of 50% at 3 s for   V d f , the obtained values for   δ V d c and   δ i q s were obtained, as shown in Figure 13a,b. As shown in Figure 13a, the dc-link voltage variations under the proposed small-signal model are in proper correlation with the MATLAB-SIMULINK model. In addition, the proposed small-signal model well illustrates the undershoot phenomenon. Figure 13b shows the changes in the q-axis current of the generator ( δ i q s ). According to this figure, the   δ i q s also has an undershoot at the beginning of the change. When the PCC voltage is dropped, the generator active power and consequently   i q s decrease. Due to this issue and the fact that the amount of current at the operating point is equal to −1075 A, the changes are 175 A in the positive axis. As a matter of fact, by dropping PCC voltage, the absolute value of q-axis current of generator is decreased and the final value of q-axis current reaches to −900 A.
In what follows, the speed variations in the generator shaft ( δ ω m ) and the d-axis current changes of the GSC converter ( δ i d f ) are compared. According to Figure 14a, as the PCC voltage drops, the wind power is stored in the mass of the rotor of the generator and wind turbine by increasing the speed of the generator shaft. There is excellent coordination between the proposed small-signal model and the MATLAB/SIMULINK model at the operating point. However, moving away from the operating point reduces its accuracy. Since the value of the d-axis current of the GSC converter at the operating point is equal to 1000 A and its upper current limit is 1750 A, a limit of 750 A is used in the proposed small signal-model (Figure 14b).
Other effective signals that should be checked to confirm modeling accuracy are the generated active power from the generator and injected active power into the grid. In Figure 15a,b, the waveforms of the changes in the output active power of the generator (   δ P g e n ) and the changes in the active power injected by the GSC converter into the grid (   δ P g r i d ) are shown, respectively. It is clear that, in   δ P g r i d , the non-minimum phase phenomenon leads to the undershoot. On the other hand, there is an appropriate similarity between the proposed model and the MATLAB-SIMULINK model.

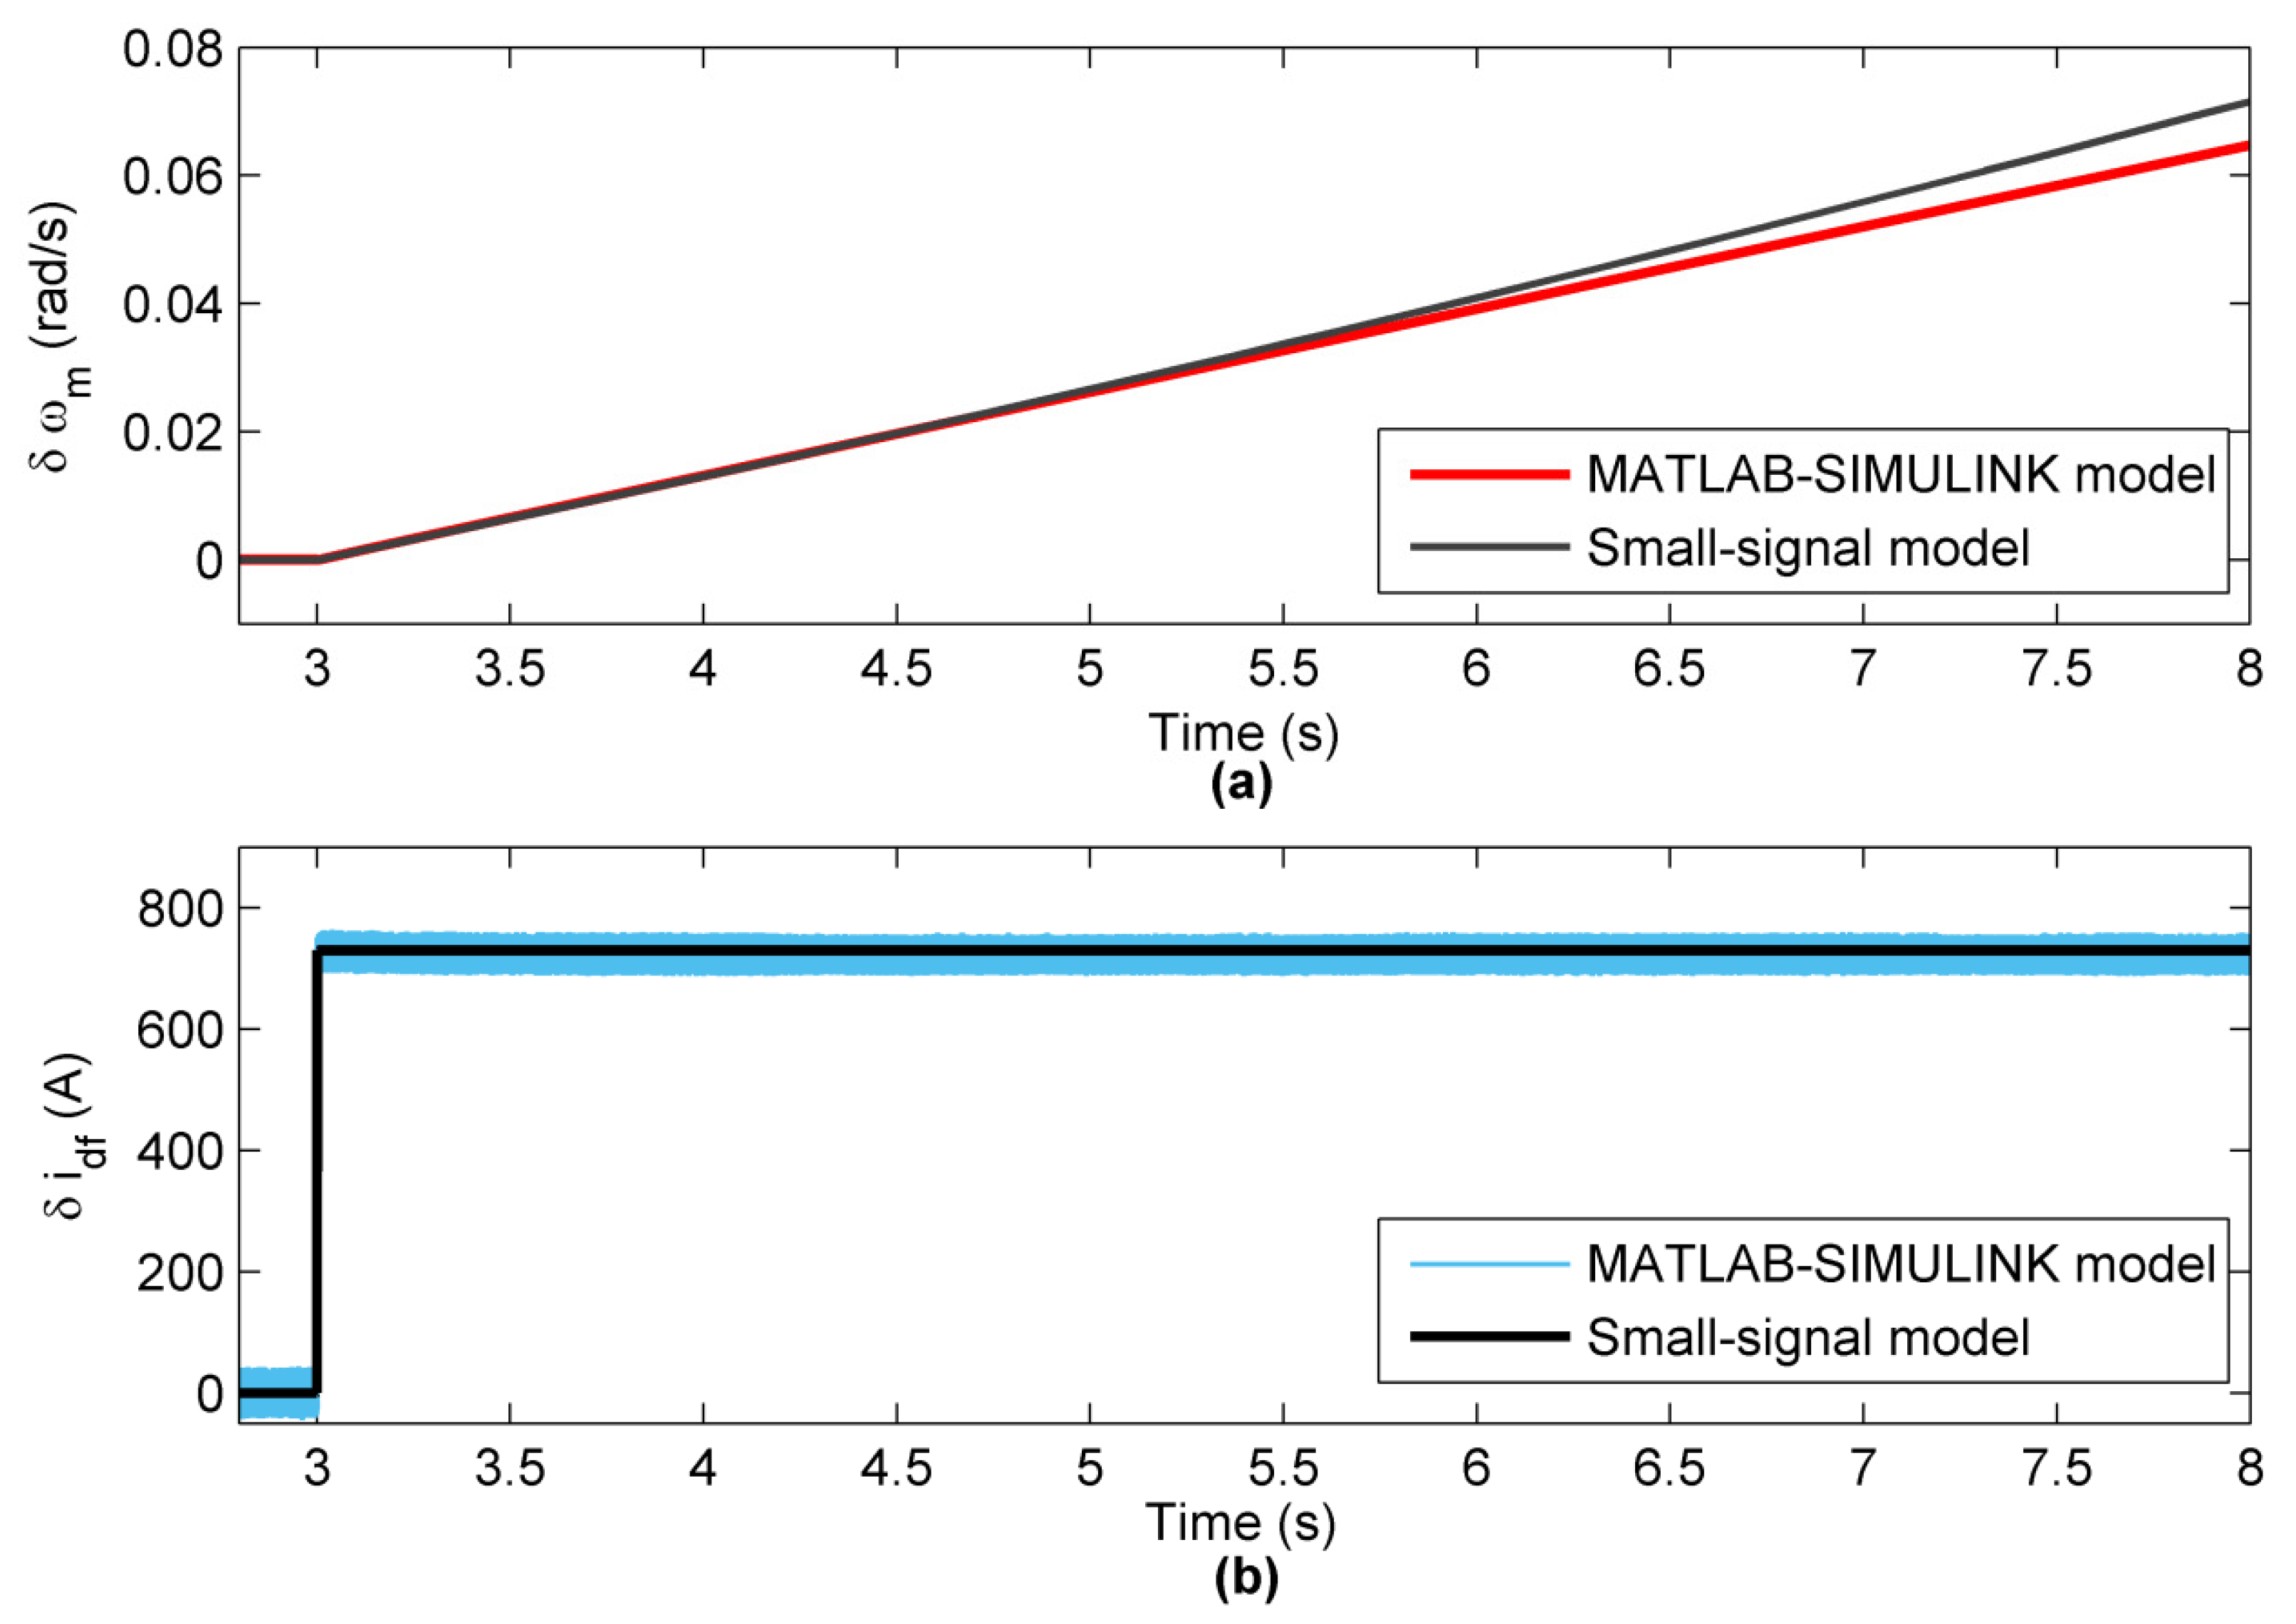
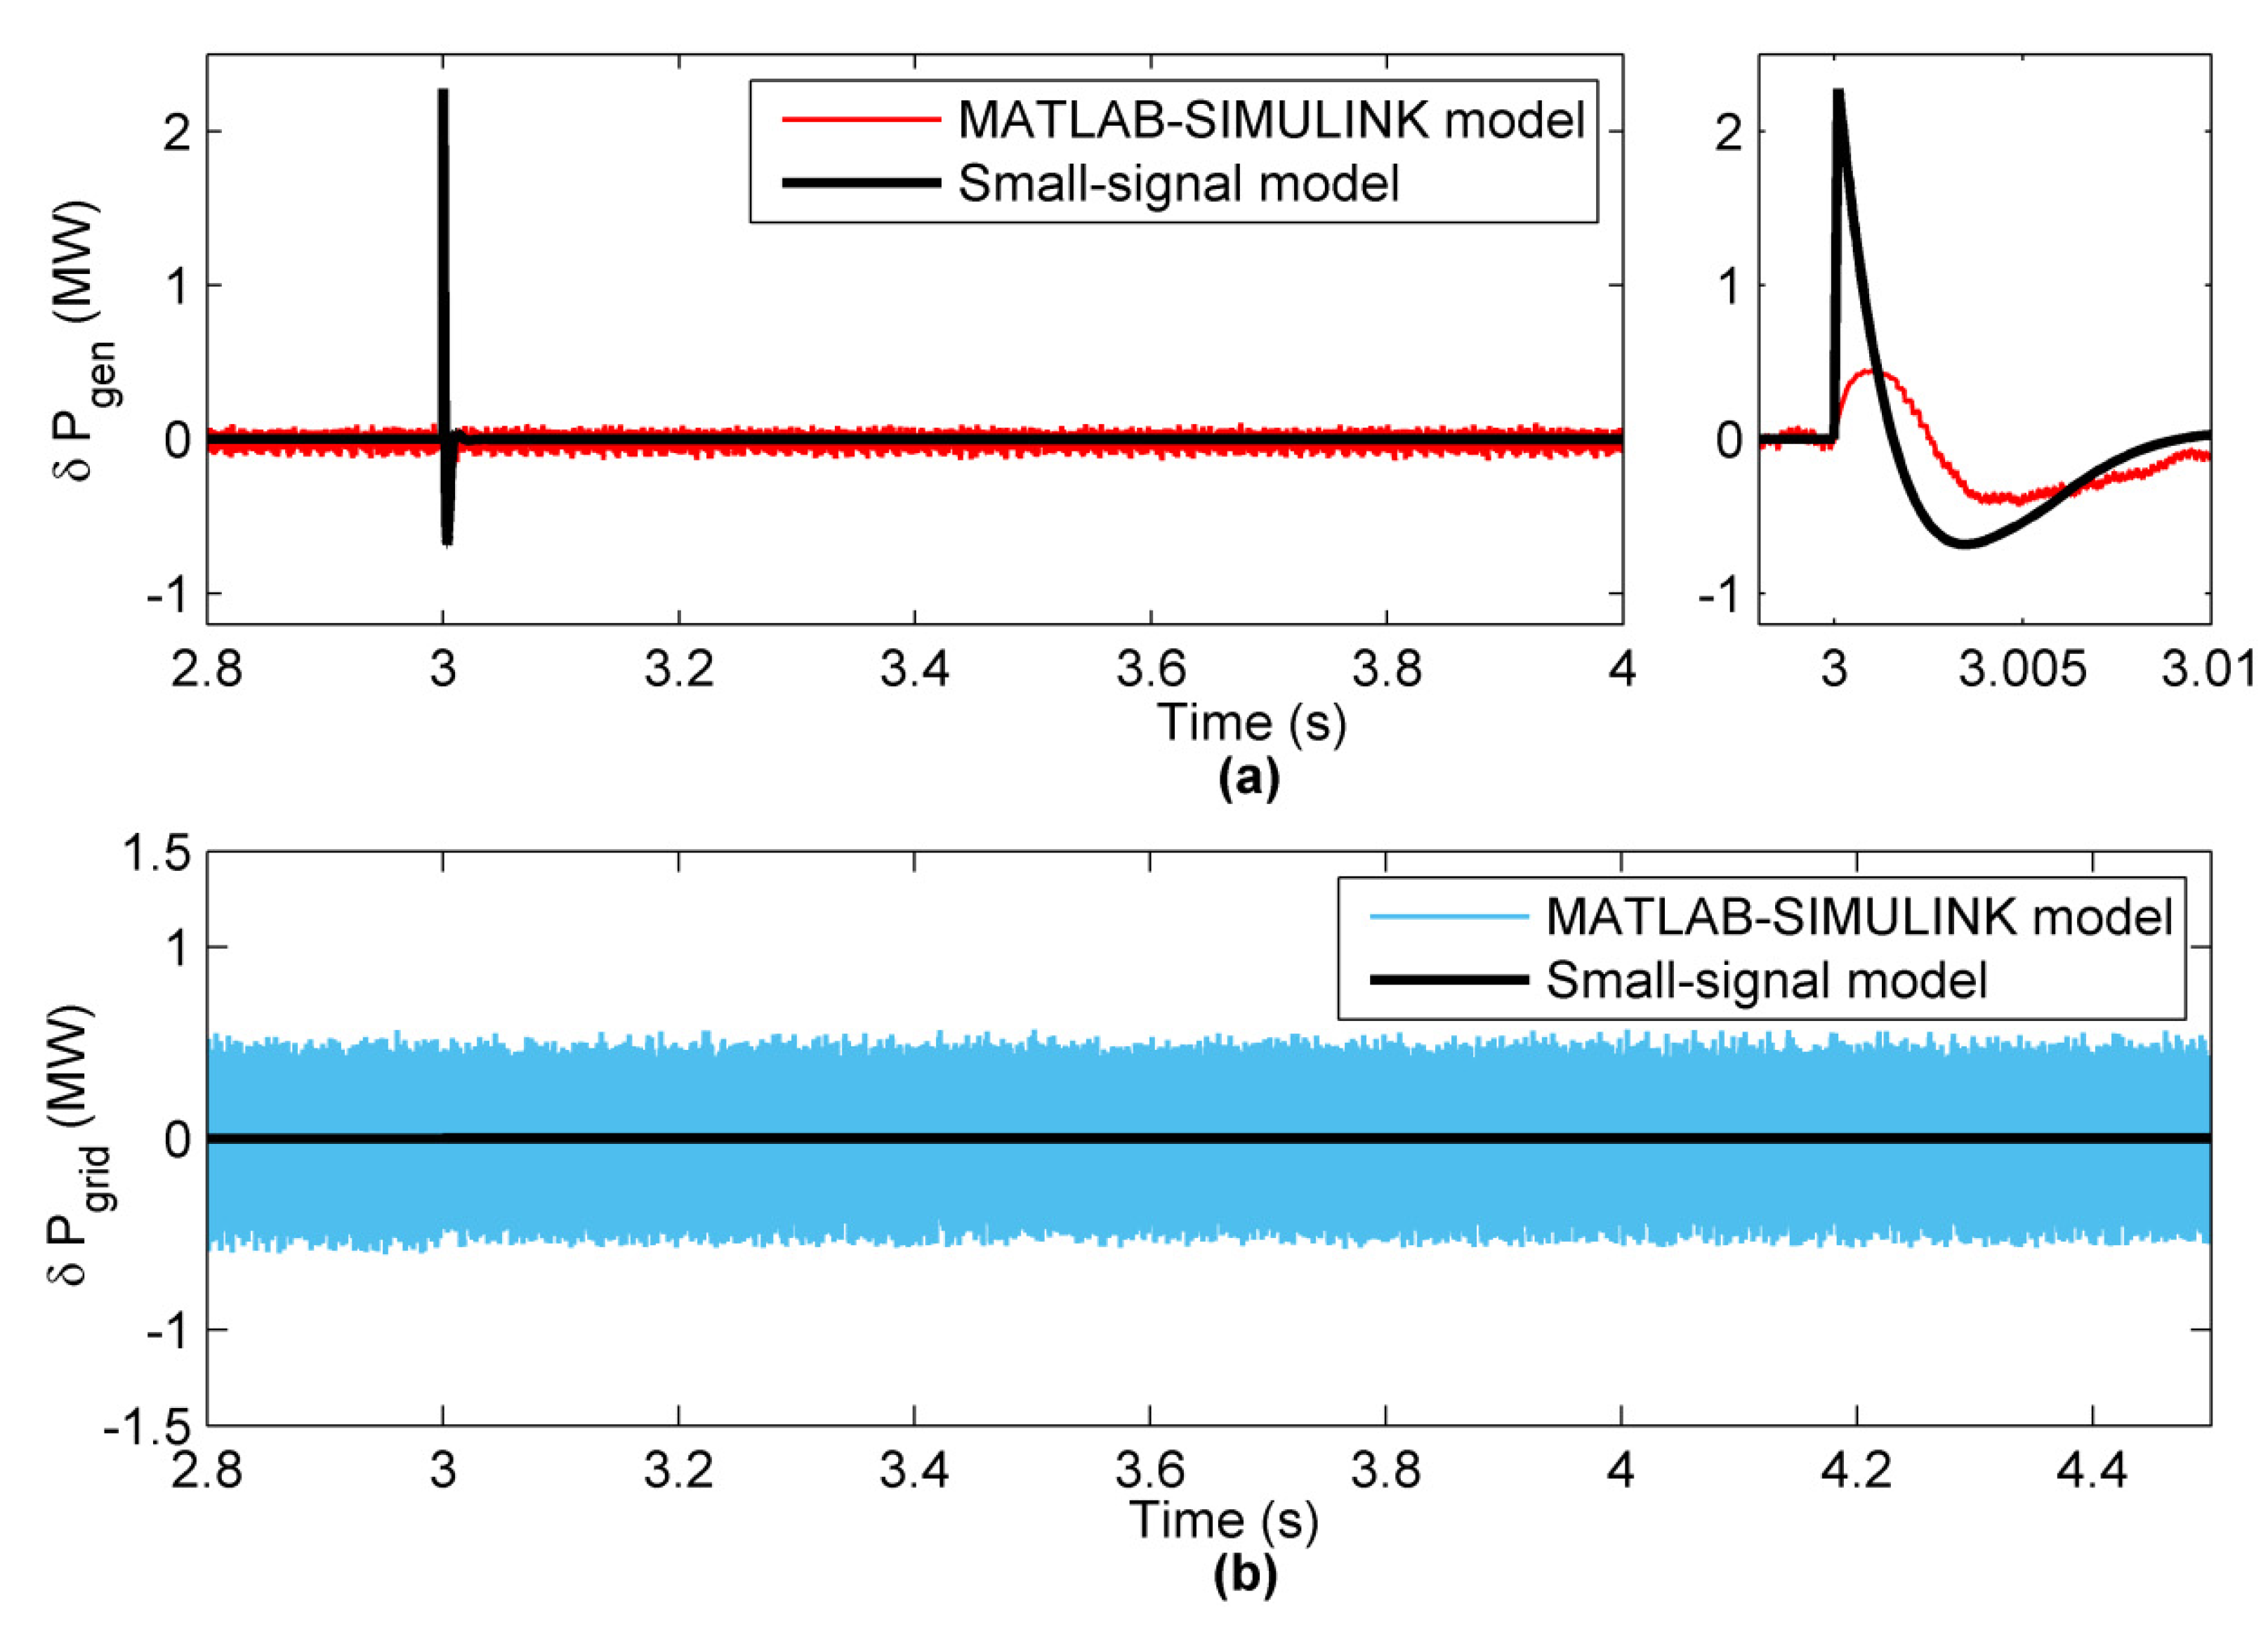
4.3. Case (c) Step Response Simulation and Comparison of the   δ V d c r e f

In this case, the accuracy of the proposed model for the step changes of δ V d c r e f was analyzed. The value of dc-link voltage is not constant in practical applications. Hence, the proposed model accuracy in terms of the system dynamics should be simulated for variable dc-link voltage reference.
As shown in Figure 16a, the dc-link voltage changes in the proposed small-signal model are in good agreement with the MATLAB-SIMULINK model. Furthermore, in the proposed small-signal model, the undershoot phenomenon is well shown. Additionally, the changes in the generator q-axis current ( δ i q s ) are illustrated in Figure 16b. According to this figure, it has an undershoot at the beginning of the changes.
The waveform’s changes in the shaft speed of the generator (   δ ω m ) and the d-axis current of the GSC converter (   δ i d f ) are compared in Figure 17. According to Figure 17a,   δ ω m does not change with a 30 V voltage variation of   δ V d c r e f because the 30 V variation in dc-link creates low energy changes. This value of energy cannot affect   δ ω m . On the other hand, the d-axis of GSC controls MPPT. Hence,   δ i d f is not affected by dc-link voltage reference changes (Figure 17b).
In Figure 18a,b, the waveforms of the active power generated by the generator (   δ P g e n ) and the active power injected by GSC into the grid (   δ P g r i d ) are shown, respectively. The dc-link voltage is regulated and controlled by the MSC. Hence, the voltage drop of dc-link causes an intense increase in   δ P g e n , while   δ P g r i d is not changed. As the voltage of the dc-link decreases, the amount of energy stored in dc-link decreases. Due to this decrease, an instantaneous increase in generator output power is obvious.

5. Conclusions

This paper presents a small-signal model for a PMSG-based wind turbine that is gearbox-less. This grid-tied configuration includes a back-to-back converter. The control circuit of the converters is designed to regulate the dc-link voltage and perform MPPT by MSC and GSC, respectively. Based on the proposed model, the optimal values of the PI gains in the control circuit can be determined by intelligent methods. In addition, due to the use of transfer functions instead of using the blocks of the MATLAB/SIMULINK, which require the use of power electronic converters, the speed of program execution is significantly increased. The use of power electronic converters, which require high-frequency switching, slows down the execution of the program and is therefore not a good option in tasks that require repetition of the program. Therefore, the proposed method in these cases has a faster response and significant advantage. In this paper, the PI coefficients of the dc-link voltage control loop are determined with the proposed model and then compared by simulation results of the grid-connected PMSG-based wind turbine on the SIMULINK environment. The simulation results show the high accuracy of the proposed model. Moreover, this model can be used to analyze the dc link voltage response and improve the LVRT, in terms of both determining the appropriate value of the dc link capacitor and the gains of the PI controller of the dc link voltage loop. Furthermore, according to the results, the non-minimum phase property in some waveforms is obvious using this control method. This model can also be used by researchers in stability studies.

Author Contributions

M.N., conceptualization, methodology, and software; S.M., A.F.and A.C. supervision and editing; and B.F., formal analysis and writing—original draft preparation. All authors have read and agreed to the published version of the manuscript.

Funding

Funding: Part of this work was financially supported for Arthur Chang by the “Intelligent Recognition Industry Service Research Center” from The Featured Areas Research Center Program within the framework of the Higher Education Sprout Project by the Ministry of Education (MOE) in Taiwan.

Conflicts of Interest

The authors declare no conflict of interest.

Nomenclature

Vectors and SymbolsSubscripts
ρ Air density w Wind
A Blade swept area T u r Turbine
λ Tip speed ratio d s , q s Direct and quadrature components of stator
β Pitch angle d f , q f Direct and quadrature components of grid side
v Speed g e n Generator
P Power d c dc-link
T Torque r e f Reference
J Inertia of turbine and generator m p p t Maximum power point tracking
B Damping coefficient m , e Mechanical, Electrical
ω Angular speed o p t Optimal
V , i Voltage, Current max Maximum
R , L Resistance, Inductance 0 Operating value
ψ Magnetic FluxSuperscripts
e Output voltage of GSC C Control input

Appendix A

Parameters of system: Turbine: R = 36.6     m , ρ = 1.225     k g / m 3 , J e q = 4.87 × 10 6   k g . m 2 , B e q = 200     N . m . s / r a d , C p max = 0.48 , PMSG) 1.5 MW, 690 V. R s = 3.174     m Ω , L s = 3.07     m H   , ψ = 7.0172       w b   , p = 80   , Back-to-Back converter) C d c = 0.023     F   , V d c = 1500     V   , f s w = 5 k H z   , Grid) 690V, 50 Hz, L f = 0.44     m H   , R f = 3.174     m H   .
Operating point values: i q s 0 = 1075   A , ω m 0 = 1.991   r a d / s , k t v = 100140 , k o p t = 112592 , i d f 0 = 1050   A .

References

  1. Takahashi, K.; Jargalsaikhan, N.; Rangarajan, S.; Hemeida, A.M.; Takahashi, H.; Senjyu, T. Output Control of Three-Axis PMSG Wind Turbine Considering Torsional Vibration Using H Infinity Control. Energies 2020, 13, 3474. [Google Scholar] [CrossRef]
  2. Deng, J.; Wang, J.; Li, S.; Zhang, H.; Peng, S.; Wang, T. Adaptive Damping Design of PMSG Integrated Power System with Virtual Synchronous Generator Control. Energies 2020, 13, 2037. [Google Scholar] [CrossRef] [Green Version]
  3. Nasiri, M.; Milimonfared, J.; Fathi, S.H. Efficient Low-Voltage Ride-Through Nonlinear Backstepping Control Strategy for PMSG-Based Wind Turbine During the Grid Faults. J. Oper. Autom. Power Eng. 2018, 6, 218–228. [Google Scholar] [CrossRef]
  4. Zhong, C.; Wei, L.; Yan, G. Low Voltage Ride-through Scheme of the PMSG Wind Power System Based on Coordinated Instantaneous Active Power Control. Energies 2017, 10, 995. [Google Scholar] [CrossRef] [Green Version]
  5. Gencer, A. Analysis and Control of Fault Ride-Through Capability Improvement for Wind Turbine Based on a Permanent Magnet Synchronous Generator Using an Interval Type-2 Fuzzy Logic System. Energies 2019, 12, 2289. [Google Scholar] [CrossRef] [Green Version]
  6. El Sayed, W.; Abd El Geliel, M.; Lotfy, A. Fault Diagnosis of PMSG Stator Inter-Turn Fault Using Extended Kalman Filter and Unscented Kalman Filter. Energies 2020, 13, 2972. [Google Scholar] [CrossRef]
  7. Nasiri, M.; Milimonfared, J.; Fathi, S.H. A review of low-voltage ride-through enhancement methods for permanent magnet synchronous generator based wind turbines. Renew. Sustain. Energy Rev. 2015, 47, 399–415. [Google Scholar] [CrossRef]
  8. Geng, H.; Liu, L.; Li, R. Synchronization and Reactive Current Support of PMSG-Based Wind Farm During Severe Grid Fault. IEEE Trans. Sustain. Energy 2018, 9, 1596–1604. [Google Scholar] [CrossRef]
  9. Nasiri, M.; Faridpak, B.; Farrokhifar, M. Low Voltage Ride Through Enhancement in PMSG-based Wind Turbines using De-loading Droop. In Proceedings of the 2020 11th Power Electronics, Drive Systems, and Technologies Conference (PEDSTC), Piscataway, NJ, USA, 4–6 Febuary 2020; IEEE: New York, NY, USA, 2020; pp. 1–6. [Google Scholar]
  10. Mendes, V.; Matos, F.; Liu, S.; Cupertino, A.; Pereira, H.; De Sousa, C. Low Voltage Ride-Through Capability Solutions for Permanent Magnet Synchronous Wind Generators. Energies 2016, 9, 59. [Google Scholar] [CrossRef] [Green Version]
  11. Firouzi, M.; Nasiri, M.; Benbouzid, M.; Gharehpetian, G.B. Application of multi-step bridge-type fault current limiter for fault ride-through capability enhancement of permanent magnet synchronous generator-based wind turbines. Int. Trans. Electr. Energy Syst. 2020, e12611. [Google Scholar] [CrossRef]
  12. Firouzi, M.; Nasiri, M.; Mobayen, S.; Gharehpetian, G.B. Sliding Mode Controller-Based BFCL for Fault Ride-Through Performance Enhancement of DFIG-Based Wind Turbines. Complexity 2020, 2020, 1259539. [Google Scholar] [CrossRef]
  13. Kim, C.; Kim, W. Coordinated Fuzzy-Based Low-Voltage Ride-Through Control for PMSG Wind Turbines and Energy Storage Systems. IEEE Access 2020, 8, 105874–105885. [Google Scholar] [CrossRef]
  14. Abdelrahem, M.; Kennel, R. Fault-Ride through Strategy for Permanent-Magnet Synchronous Generators in Variable-Speed Wind Turbines. Energies 2016, 9, 1066. [Google Scholar] [CrossRef]
  15. Kim, K.; Jeung, Y.; Lee, D.; Kim, H. LVRT Scheme of PMSG Wind Power Systems Based on Feedback Linearization. IEEE Trans. Power Electron. 2012, 27, 2376–2384. [Google Scholar] [CrossRef]
  16. Nasiri, M.; Mobayen, S.; Zhu, Q.M. Super-Twisting Sliding Mode Control for Gearless PMSG-Based Wind Turbine. Complexity 2019, 2019, 6141607. [Google Scholar] [CrossRef]
  17. Pradhan, S.; Singh, B.; Panigrahi, B.K.; Murshid, S. A Composite Sliding Mode Controller for Wind Power Extraction in Remotely Located Solar PV–Wind Hybrid System. IEEE Trans. Ind. Electron. 2019, 66, 5321–5331. [Google Scholar] [CrossRef]
  18. Lee, S.-W.; Chun, K.-H. Adaptive Sliding Mode Control for PMSG Wind Turbine Systems. Energies 2019, 12, 595. [Google Scholar] [CrossRef] [Green Version]
  19. Chavira, F.; Ortega-Cisneros, S.; Rivera, J. A Novel Sliding Mode Control Scheme for a PMSG-Based Variable Speed Wind Energy Conversion System. Energies 2017, 10, 1476. [Google Scholar] [CrossRef] [Green Version]
  20. Nasiri, M.; Milimonfared, J.; Fathi, S.H. Modeling, analysis and comparison of TSR and OTC methods for MPPT and power smoothing in permanent magnet synchronous generator-based wind turbines. Energy Convers. Manag. 2014, 86, 892–900. [Google Scholar] [CrossRef]
  21. Rahimi, M. Mathematical modeling, dynamic response analysis, and control of PMSG-based wind turbines operating with an alternative control structure in power control mode. Int. Trans. Electr. Energy Syst. 2017, 27, e2423. [Google Scholar] [CrossRef]
  22. Hosseinipour, A.; Hojabri, H. Small-Signal Stability Analysis and Active Damping Control of DC Microgrids Integrated With Distributed Electric Springs. IEEE Trans. Smart Grid 2020, 11, 3737–3747. [Google Scholar] [CrossRef]
  23. Kim, Y.-S.; Chung, I.-Y.; Moon, S.-I. Tuning of the PI Controller Parameters of a PMSG Wind Turbine to Improve Control Performance under Various Wind Speeds. Energies 2015, 8, 1406–1425. [Google Scholar] [CrossRef] [Green Version]
  24. Nasiri, M.; Mohammadi, R. Peak Current Limitation for Grid Side Inverter by Limited Active Power in PMSG-Based Wind Turbines During Different Grid Faults. IEEE Trans. Sustain. Energy 2017, 8, 3–12. [Google Scholar] [CrossRef]
  25. Nasiri, M.; Milimonfared, J.; Fathi, S.H. Robust Control of PMSG-based Wind Turbine under Grid Fault Conditions. Indian J. Sci. Technol. 2015, 8. [Google Scholar] [CrossRef]
  26. Cortes-Vega, D.; Ornelas-Tellez, F.; Anzurez-Marin, J. Comparative analysis of MPPT techniques and Optimal Control for a PMSG-based WECS. In Proceedings of the 2019 IEEE 4th Colombian Conference on Automatic Control (CCAC), Medellin, Colombia, 15–18 October 2019; pp. 1–6. [Google Scholar]
Figure 1. (a) PMSG-based wind turbine; (b) controller of MSC; and (c) controller of GSC.
Energies 13 06685 g001
Figure 2. (a) Conventional OTC method; and (b) utilized method for   i q s r e f the calculation to improve LVRT.
Energies 13 06685 g002
Figure 3. Calculation of   i d f r e f by the proposed method in [7].
Energies 13 06685 g003
Figure 4. Small-signal block diagram of the mechanical part.
Energies 13 06685 g004
Figure 5. Small-signal block diagram of generator output power.
Energies 13 06685 g005
Figure 6. Small-signal block diagram of dc-link voltage.
Energies 13 06685 g006
Figure 7. Small-signal block diagram of injected power into the grid.
Energies 13 06685 g007
Figure 8. Small signal block diagram of dc-link voltage and q-axis current controller.
Energies 13 06685 g008
Figure 9. Small-signal block diagram of the grid-side controller.
Energies 13 06685 g009
Figure 10. Comprehensive small-signal block diagram of PMSG-based wind turbine system.
Energies 13 06685 g010
Figure 11. (a) The dc-link voltage variation by increasing   k p d c in a 50% voltage drop in the grid; and (b) zoom of starting time of variation.
Energies 13 06685 g011
Figure 12. (a) The dc-link voltage variation by increasing k I d c in 50% voltage drop in grid; and (b) zoom of starting time of variation.
Energies 13 06685 g012
Figure 13. (a) The waveforms of dc-link voltage; and (b) the q-axis current of the generator ( δ i q s ) in a 50% voltage drop at PCC.
Energies 13 06685 g013
Figure 14. (a) The waveforms of generator speed; and (b) the d-axis current of the generator ( δ i d f ) in a 50% voltage drop at PCC.
Energies 13 06685 g014
Figure 15. (a) The output active power of the generator; and (b) the injected active power by GSC into the grid ( δ P g r i d ) in a 50% voltage drop at PCC.
Energies 13 06685 g015
Figure 16. (a) The waveforms of dc-link voltage; and (b) the q-axis current of the generator ( δ i q s ) in 30 V voltage variation of   δ V d c r e f .
Energies 13 06685 g016
Figure 17. (a) The speed of the generator; and (b) the d-axis current of GSC ( δ i d f ) in 30 V dc-link voltage variation.
Energies 13 06685 g017
Figure 18. (a) The output power of the generator; and (b) the injected power by GSC ( δ P g r i d ) in 30 V dc-link voltage variation.
Energies 13 06685 g018
Publisher’s Note: MDPI stays neutral with regard to jurisdictional claims in published maps and institutional affiliations.

