Article

The Energy Lock-In Effect of Solar Home Systems: A Case Study in Rural Nigeria

Centre for Environment and Sustainability, University of Surrey, Guildford GU2 7XH, UK
*
Author to whom correspondence should be addressed.
Energies 2020, 13(24), 6682; https://doi.org/10.3390/en13246682
Submission received: 23 November 2020 / Revised: 12 December 2020 / Accepted: 14 December 2020 / Published: 17 December 2020
(This article belongs to the Special Issue Energy for Sustainable Future)

Abstract

:
Ongoing reductions in the costs of solar PV and battery technologies have contributed to an increased use of home energy systems in Sub-Saharan African regions without grid access. However, such systems can normally support only low-power end uses, and there has been little research regarding the impact on households unable to transition to higher-wattage energy services in the continued absence of the grid. This paper examines the challenges facing rural energy transitions and whether households feel they are energy ‘locked in’. A mixed-methods approach using questionnaire-based household energy surveys of rural solar home system (SHS) users was used to collect qualitative and quantitative data. Thematic analysis and a mixture of descriptive and inferential statistical analyses were applied. The results showed that a significant number of households possessed appliances that could not be powered by their SHS and were willing to spend large sums to connect were a higher-capacity option available. This implied that a significant number of the households were locked into a low-energy future. Swarm electrification technology and energy efficient, DC-powered plug-and-play appliances were suggested as means to move the households to higher tiers of electricity access.

1. Introduction

Energy plays a pivotal role in the social, economic and cultural development of any population [1]. Energy from carriers (e.g., electricity) is converted via end-use technology (e.g., televisions, mobile phones, bulbs and mechanical fans) into useful household energy services (e.g., entertainment, communication, lighting and space cooling). Energy also supports income-generating activities including construction, agriculture and manufacturing. This is especially relevant for developing nations, who have been shown to exhibit a much larger increase in the Human Development Index (HDI) for a corresponding increase in energy consumption per capita, compared to developed nations [2]. However, it is estimated that almost 800 million people lack any access to electricity, with approximately 550 million of them living in Sub-Saharan Africa [3]. Transitioning these people from traditional sources of energy (biomass and waste) to accessing modern energy such as that provided by electricity poses a major challenge. The importance of this challenge is encapsulated by the United Nation’s (UN) Sustainable Development Goal (SDG) 7, which calls for universal access to affordable, sustainable, reliable and modern energy by 2030. There has been significant progress towards the goals of SDG7 at the country level in developing regions, with countries such as Kenya, Uganda and Sudan making the most progress, even though the current pace of global efforts has so far been insufficient [3].
While there is no single definition of energy poverty, it has been referred to as a lack of access to modern energy services [4] and a deficiency in the consumption of energy required to meet basic human needs [5,6,7]. Reddy [8] (p. 44) captures the multi-dimensional nature of energy poverty by defining it as “the absence of sufficient choice in accessing adequate, affordable, reliable, high-quality, safe and environmentally benign energy services to support economic and human development”. This recognition of the multi-dimensional nature of energy poverty (and therefore access) helped shape development of the Multi-Tier Framework (MTF) formulated by the World Bank’s Energy Sector Management Program (ESMAP) designed to provide a measurement framework for measuring energy access [9], although it does focus mainly on electricity. The MTF has been referred to as providing the most sophisticated energy measurement metric [
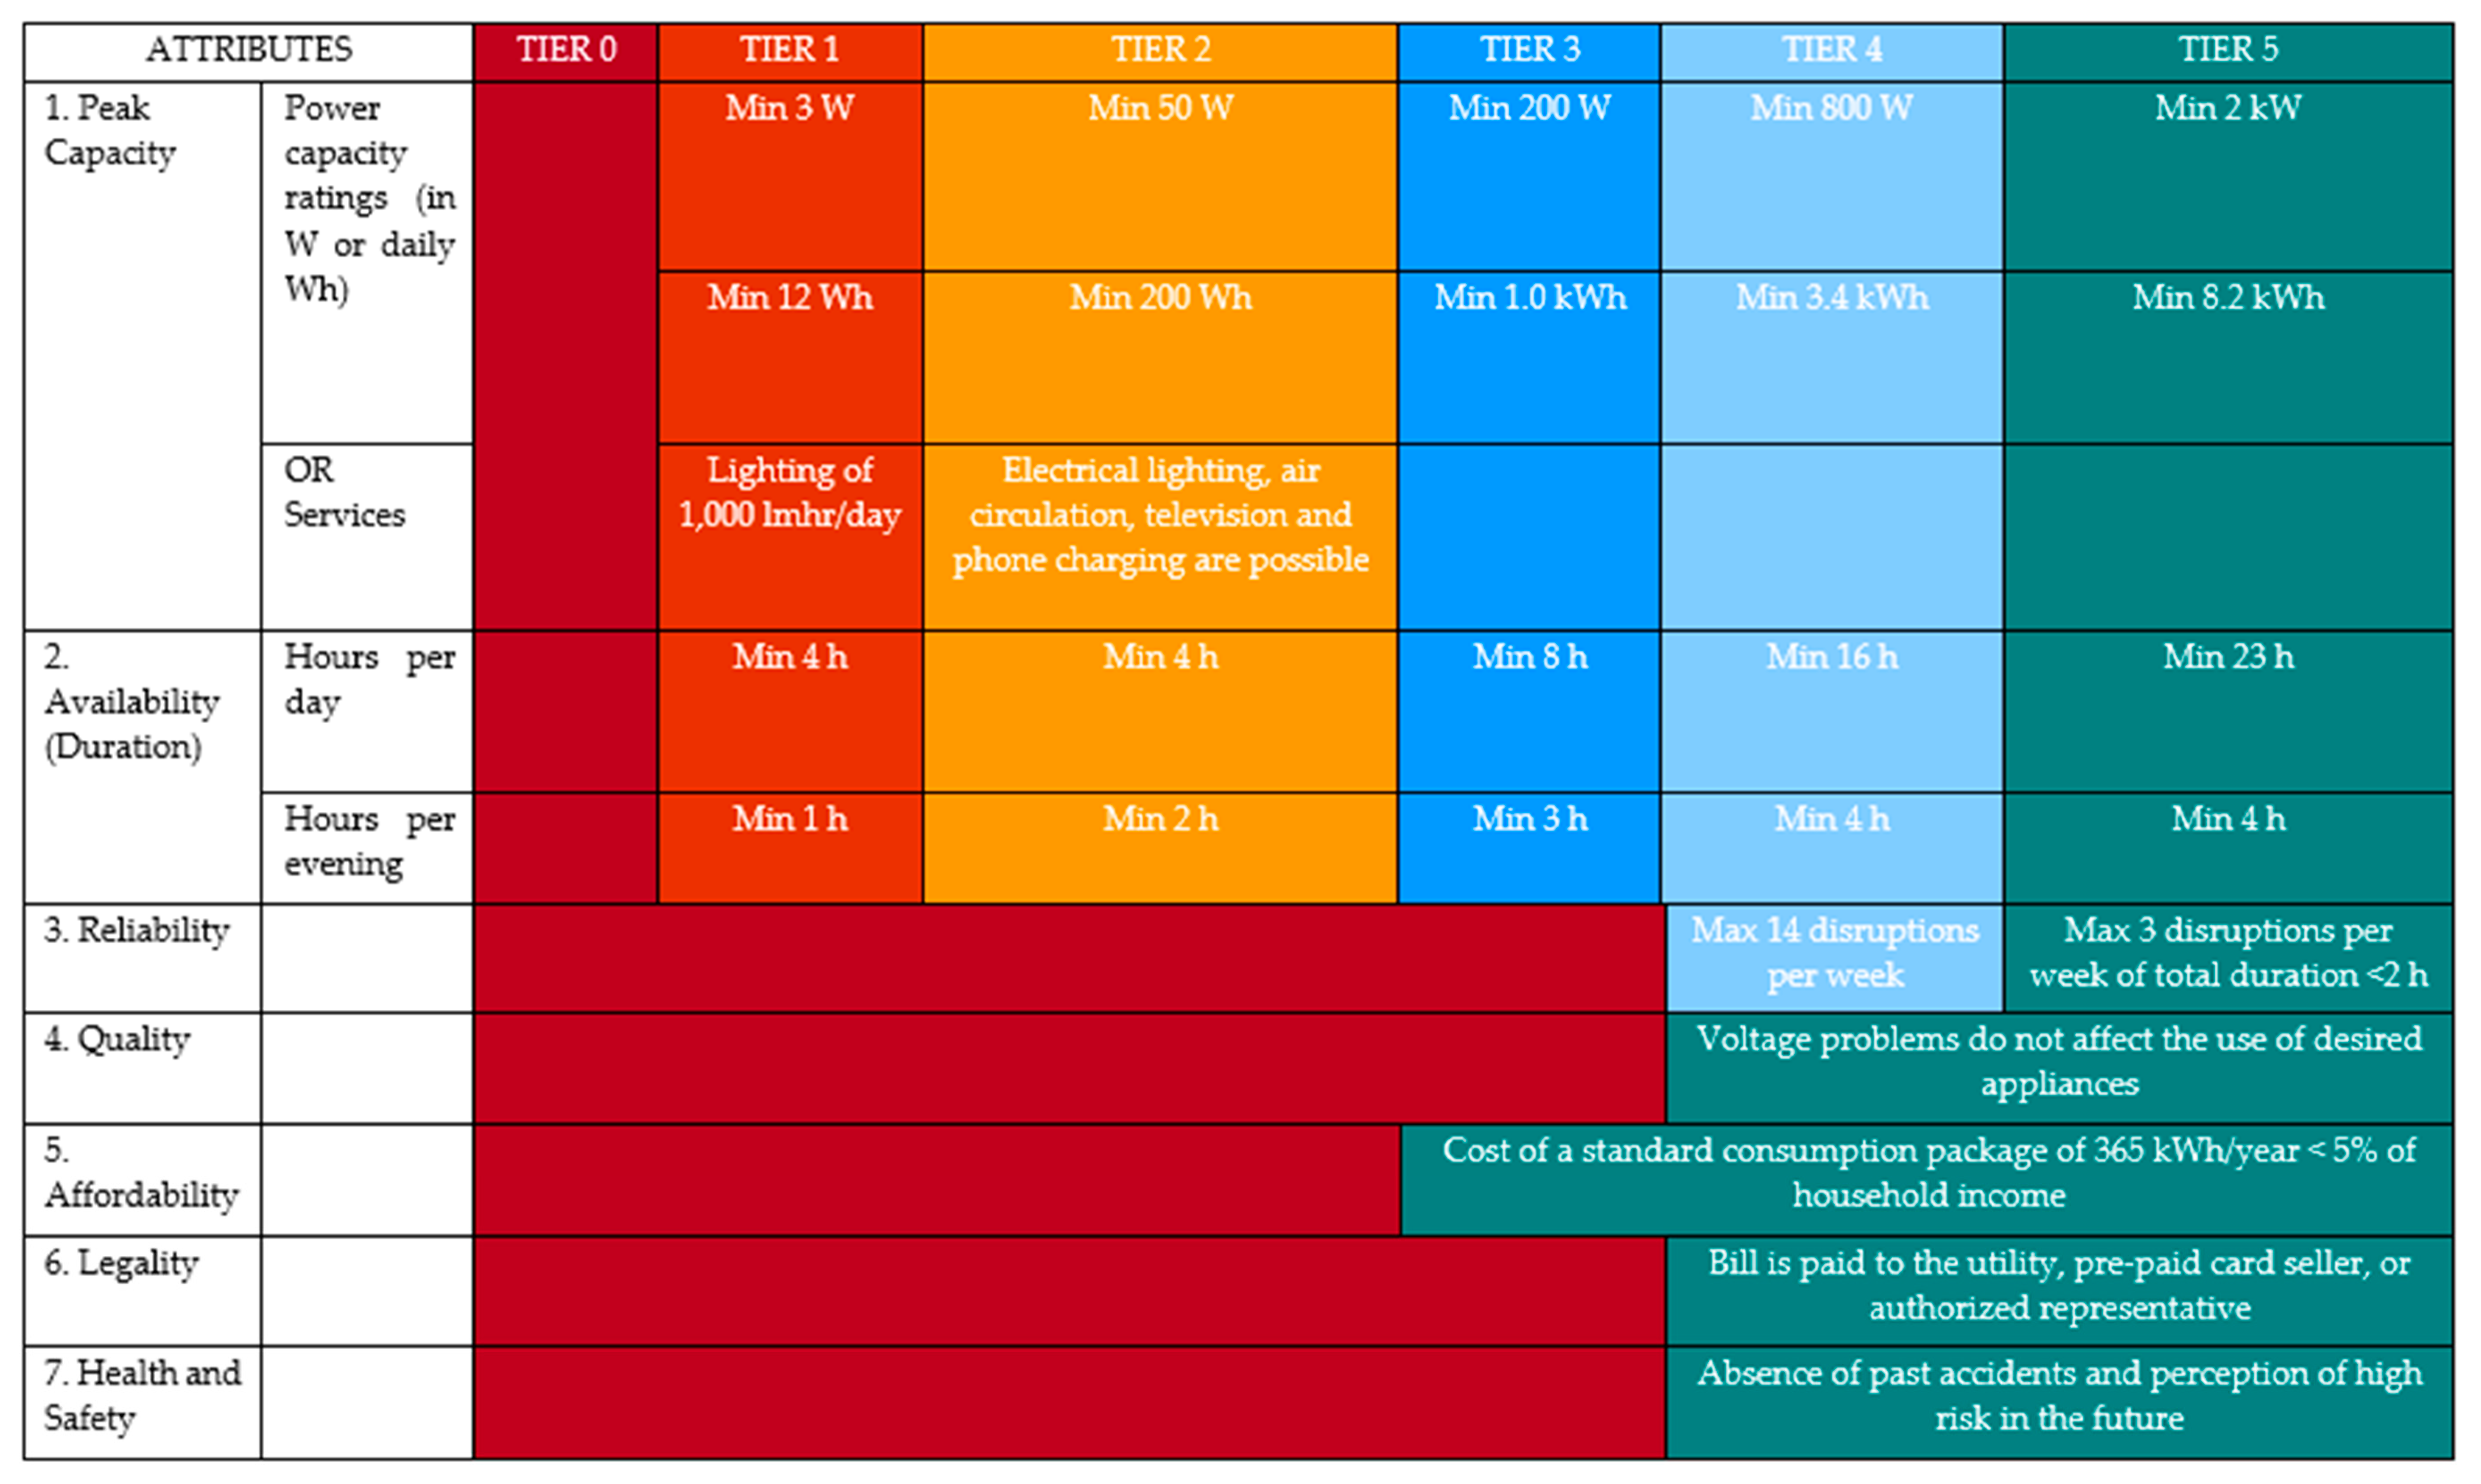
10], and measures seven attributes of capacity, availability, reliability, quality, affordability, legality, and health and safety, an approach that takes into account the various factors that influence a household’s ability to access energy. It also recognizes that energy access is not a binary ‘have or have-not’ condition, but rather that households can exist at varying levels of access depending on socioeconomic factors and other circumstances dictated by the seven attributes listed earlier. The levels of energy (electricity) access described in the MTF are referred to as ‘tiers’ and vary from Tier 0 (no access) to the highest level of access, which is Tier 5. Moving up these tiers can be seen as climbing up the so-called ‘energy ladder’. A visual representation of the MTF, showing the various tiers, is shown in Figure 1, a matrix for measuring access to household electricity supply, and 
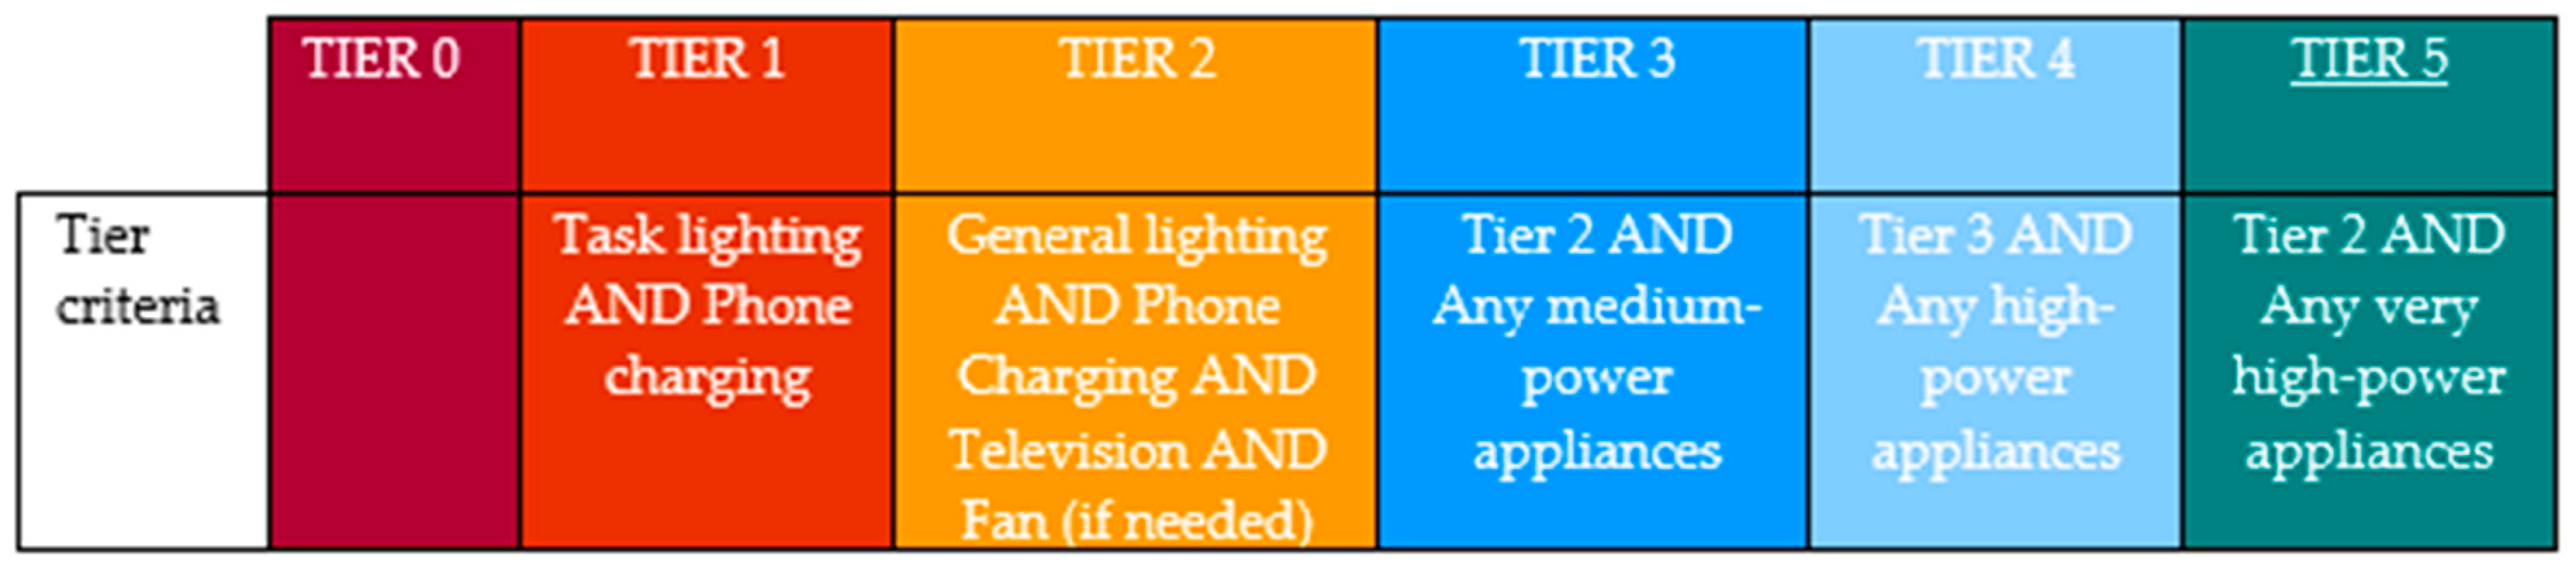
Figure 2, a matrix for measuring access to household electricity services.
For decades, rural electrification in developing regions has primarily been achieved via grid extension, and this is still integral to rural electrification policies in many parts of the developing world [11,12,13]. However, grid extension has been much slower than anticipated in many regions [12,14], and a key barrier to it is that it is not profitable for utilities to invest the capital required to deliver electricity to rural communities with relatively low patterns of consumption [15,16]. In the meantime, decentralized options such as solar home systems (SHSs) have proven to be popular for electrifying households and other small users due to their falling prices and renewable power source; in Kenya, more than 30% of off-grid households have a solar PV product at home [17].
A typical SHS consists of a PV module typically placed on a rooftop to capture sunlight, a battery for storing energy, and end-use appliances which provide energy services. Capacities of SHS can range from 10 to 200 W [18]. However, the typical SHSs used in rural Sub-Saharan Africa are in the 10–100 range [19,20]. While the upfront costs of SHSs, at up to $400 for an 80 W system [21], can act as a barrier to entry for many of the poor rural households, the introduction of Pay-As-You-Go (PAYG) service has helped improve its uptake. This is achieved by providing the SHS as a service, with the households making small, regular payments to access the service over an agreed time period, after which they own the SHS [22,23]. Companies such as M-KOPA and Bboxx in Kenya have successfully integrated mobile payment technologies with their SHS services, providing their customers with the convenience of making payments using their mobile phones, and increasing the flexibility of the amounts they pay and the payment intervals [24,25].
Multiple studies have shown that households moving from Tier 0 (i.e., unelectrified) to using SHS (typically Tiers 1 and 2) have seen an improvement in their quality of life [26,27,28]. SHS use has been linked to health benefits, as it displaces household use of kerosene and candles which expose users to a range of health risks including burns, child poisoning due to inadvertent consumption of fuels, and a variety of conditions linked to indoor air pollution from fine particulate matter, sulphur and nitric oxides. The most common use for SHSs is the improved lighting service it provides compared to kerosene or candles [29] with educational improvements for children who use the light to read and do homework as a key outcome [26,30]. SHS use has also reduced the need for household members to travel long distances for charging their mobile phones [31].
Access to, and initial consumption of electricity has been shown to lead to increases in consumption over time, as users purchase more appliances (if affordable) [32]. This is in line with the study by Opiyo [33], which demonstrated that rural households in Kenya, upon realising the socioeconomic benefits of their basic electricity access from SHS, began to desire more high-powered appliances such as televisions and cooling fans. However, some researchers, such as Lee et al. [34] and Stojanovski et al. [20], have observed that while rural households purchased these appliances to benefit from the services they provide, they could not be accommodated by their SHSs due to their relatively small energy capacity, and hence these appliances were unusable. Hence, despite their broad appeal, there are questions surrounding home solar products and the energy services they are able to provide to rural households. There is a paucity of research designed to explore the nature of the energy services home solar products provide to rural communities in the developing world and especially the views and aspirations of households regarding access to energy services. For example, do households feel that they may become ‘trapped’ into what they see as an ‘inferior’ source of energy? In this paper, the results of a household energy survey conducted across two locations in Nigeria are used to provide an empirically based analysis of SHS use in rural households and how those households view such systems vis-à-vis alternatives such as an extension of the grid supply. In particular, the research aims were to:
1.
Assess whether the SHS technologies taken up by these rural communities met their non-cooking household energy service demands,
2.
Whether households may feel ‘energy trapped’ by the inherent limited capacity of the SHS technology.

2. Methodology

2.1. Location of Research

Data collection for this research was carried out in rural communities across two states in Nigeria, a lower-middle-income country in West Africa [35]: Lagos State, located in the South West region, and the Federal Capital Territory (FCT), which is located in the geographical centre of the country. See Figure 3 for a map of Nigeria, including the locations used for data collection.
Nigeria is a multi-ethnic and culturally diverse country, with 36 states and the Federal Capital Territory [36]. Rural locations across the country differ in terms of wealth, culture and weather, all of which can affect energy use. Hence, the locations were chosen in part to reflect a range of socioeconomic conditions. The selected communities were in what can be termed the ‘urban fringe’ of two major cities in Nigeria–Lagos (Lagos State) and Abuja (FCT). Lagos used to be the Federal Capital of Nigeria, but that role has now been adopted by Abuja, and the communities selected for the research have been involved in projects designed to increase energy provision via SHS. Indeed, the choice of communities was based on advice from Nigerian experts in rural electrification, including providers of SHS. A total of 150 households (50 in Lagos State and 100 in FCT), the majority without any type of access to grid electricity were surveyed face to face in six communities across both locations, and this was undertaken between May and June 2019. The households were selected using the following criteria:
  • Community designation: All the households considered had to be rural. As described earlier, the communities were located on the ‘urban fringe’ of the cities of Lagos and Abuja.
  • Location: All communities visited were to be in locations accessible with a car, and also could not be located in regions designated as “advise against all but essential travel” or “advise against all travel” on the UK Foreign and Commonwealth Office travel advice website, at the time of the research.
  • Age/status: Head of households were preferred as respondents. In Nigeria, households are generally headed by men [37], who make most of the household decisions, including energy purchases. When they were not available, the next senior family member (usually a spouse or sibling) could be interviewed. Respondents under the age of 18 years were excluded, as age can be a powerful symbol of inequality in many Nigerian cultures [38]. They were also excluded for ethical concerns.
  • Wattage: The SHSs used by the households were to be in the range of 10 to 100 Wp.
  • Duration of ownership of SHS: Households should have been using their SHS for no less than 6 months prior to the interviews. This is so they would have had time to have gotten familiar with using the SHS.
Note that a few of the households surveyed had varying classifications of access to the grid. Some, particularly in Lagos State, lived ‘under the grid’, i.e., people who live in an area where electricity is available, but they are not able to access it for any number of reasons. Others had a connection, but the duration of electricity per day would not qualify them as having access under the MTF tiered system (see Figure 1).
The communities selected for the research are shown in Table 1. The sample for each location was drawn from three communities and while the intention was also to have 100 households for Lagos State this was not possible due to logistical constraints.

2.2. Participant Selection, Data Collection and Analysis

The selected households had SHS products with ratings of 12 Watts-peak (Wp) in FCT, and 50 Wp in Lagos State, both of which possess 4 LED lighting points and providing lighting service for at least 6 h a day. They also powered a small radio, charged mobile phones and LED torchlights, while the higher capacity systems in Lagos State were connected to a DC-powered television with the ability to pick up selected satellite broadcasts. At the time the interviews were held, the households had owned their SHSs between 6 months and 4 years, with a median ownership period of 29 months. The households made monthly PAYG payments for accessing the SHS via an authorised agent.
Data collection was via face-to-face interviews and respondents (one per household, usually the household head unless unavailable) were first asked basic demographic-type questions, and due to the seasonal nature of their occupation (mostly farmers and fishermen), they were not asked about their income; instead the researchers used the numbers of household members, size of the house, i.e., number of rooms, and the amount spent on non-cooking energy purchases, as proxy indicators for wealth. Respondents were then asked about their non-cooking energy mix, including their current expenditure patterns and willingness to pay for grid electricity. They were also asked about the electrical appliances already owned by the household, and the appliances they desired to own. The survey questionnaire is included in Appendix A.
The questions were mostly ‘closed’ in nature where respondents were provided with a series of options and asked to tick the ones which applied to them. The options provided to the respondents were based in part on published research designed to explore energy use by rural households but also on a series of interviews held with key informants in both Lagos and FCT. There were a few open-ended questions to allow the respondents to provide answers in their own words rather than select from a range of options. In both locations, research assistants familiar with the local languages were recruited to help with the interviewing, as many of the respondents did not understand, or speak English. The questionnaire was written in English and the research assistants verbally translated the questions into the local languages in situations where the respondents did not understand English. While translation between languages risked introducing errors in the results, the structured nature of the questionnaire (which, other than 3 open-ended questions, consisted of closed questions and predefined answers), mitigated this risk.
Data analysis was performed using both quantitative and qualitative methods. The approach to the analysis of the qualitative data was a deductive one and thematic analysis method was used in analysing the data, with the transcription and coding of the interviews performed in Microsoft Word and Nvivo 12, respectively. The quantitative data were analysed using a mixture of descriptive and inferential statistics. As the quantitative data comprised counts of responses, analysis was undertaken using non-parametric statistical tests to explore associations between categories. The Chi-square test was used to determine whether potential associations between different variables were in fact significant. In cases where at least 80% of the expected frequencies of the data are less than 5, the Fisher’s exact test was used instead. For post hoc testing, the odds ratio (for 2 × 2 tables) method was used, while the adjusted standardized residual method proposed by Agresti [39] was used for all other tables. The software Statistical Package for the Social Sciences (SPSS) was used to perform the statistical analyses. The statistical tests for FCT and Lagos State households were performed separately and are presented in the subsequent tables.
All interviewed participants gave their informed consent for inclusion before they participated in the study. The data collection protocol involving human subjects was vetted and approved by the University Ethics Committee (UEC) of the University of Surrey (UEC ref: UEC 2018 039 FEPS).

3. Results

3.1. Sample Description and Household Fuel Sources

The breakdown of the sample in terms of age group, gender of respondent, number of permanent household members and education of respondent is shown as Table 2. Most of the sample respondents were between 18 and 45 years of age, and most were male (especially in FCT). As mentioned earlier, most household heads in Nigeria tend to be male and they make many of the key decisions for the household, so the preponderance of males in the sample is not surprising. However, there were two female household heads in the sample, and both were in the Lagos State communities. Household sizes tended to be in the 1 to 7 range for Lagos State communities (82% of households were in this category) but the figure was higher for the FCT communities with over a third of the households having 14 or more members. This was reflected in the number of rooms across both locations, with the majority of Lagos State households having 1–4 rooms (84% of the households) while the households in the FCT communities had a higher number of rooms on average, with 65% having greater than 4 rooms per households. Most of the respondents in both areas were educated to at least secondary level.
Table 3a shows the households used a variety of energy sources as their main non-cooking fuel. The patterns of use were observed to vary across both locations. The majority (86%) of households surveyed in Lagos State used a solar home system (SHS) as their main energy source for providing lighting, followed by grid electricity, and then petrol (for powering a generator). Solar home systems also provided the main source of home lighting in FCT communities surveyed; however, the percentage of users was lower, at 66%, compared to the Lagos State households. The next largest lighting energy source in the surveyed FCT households were dry cell batteries at 30%, with kerosene at 4% completing the list.
Table 3b is a frequency table showing the satisfaction of the surveyed households with the energy capacity of their main non-cooking household energy sources. Across both locations, most respondents (90% in Lagos State and 79% in FCT) indicated not being satisfied with the capacity of their main non-cooking energy source. In the FCT, the only energy source mentioned by households as satisfactory, capacity wise, were dry cell batteries. In Lagos State, 2% of households were satisfied with the energy capacity of their petrol-powered generators, while 8% were satisfied with the capacity provided by the grid. None of the households across both locations indicated being satisfied with the energy capacity of their SHS.
Table 4 is a frequency table showing the spending on non-cooking energy sources by the households across both Lagos State and FCT. These data show that the surveyed Lagos State households spend more money on non-cooking energy than the surveyed FCT households; 52% of Lagos State households mentioned spending at least $20 per month, while the figure for FCT households was 7%. The median spending of both locations was calculated using SPSS, and the values were rounded to $20 for the Lagos State households and $6 for the FCT households. The monthly spend on non-cooking energy variable is used as a proxy for household wealth in the sections covering the inferential statistical analyses, and the calculated median spending for both locations are used as thresholds to indicate the wealthier and less wealthy households.
The following sections will present the associations between the outcome variables and the monthly spend on non-cooking energy across both locations.

3.2. Ownership of Household Appliances

Table 5 (FCT) and Table 6 (Lagos State) are contingency tables with the association between the households’ ownership of various household appliances and their monthly spend on non-cooking energy. The results from Table 5 show a statistically significant association between the FCT households’ ownership of various household appliances and their monthly spend on non-cooking energy. Households that spend at least $6 monthly on non-cooking energy owned more mechanical fans than would be expected, and the post hoc analysis using the odds ratio (OR) suggested that these households were 3.62 times more likely to own a mechanical fan compared to those spending less than $6 monthly on non-cooking energy. A similar result was obtained with the ownership of televisions, i.e., households spending at least $6 dollars monthly on their non-cooking energy owned more televisions than could be explained by chance, and the OR implied that these households were 7.65 times more likely to own a television compared to those spending less than $6 per month. Ownership of a CD/DVD player was also significantly associated with the monthly spend on non-cooking energy. The OR suggested that households spending at least $6 monthly on non-cooking energy were 8.7 times more likely to own a CD/DVD player compared to those spending less than $6 monthly.
The results in Table 6 also show that there is a significant association between the ownership of household appliances in Lagos State households, and their monthly spend on non-cooking energy. The households were asked about their ownership of selected household appliances, and just as with the FCT results, the predictor variables here were used as proxies for household wealth. The results show that there was a significant positive association between the ownership of the household appliances and household monthly spend on non-cooking energy, suggesting the wealthier households owned more appliances in their households, even when these appliances could not be powered by their SHS. The OR values indicates wealthier Lagos State households, i.e., those spending at least $20 monthly on non-cooking energy, are almost 124 times more likely to own a mechanical fan and almost 6 times more likely to own a CD/DVD player, when compared to the households spending less than $20 monthly.

3.3. Preference for Grid Connection and Satisfaction with SHS Capacity

Table 7 sets out the association between amount households are willing to pay for grid connection and the monthly spend on non-cooking energy, FCT. The results indicate a statistical association between the amount the FCT households were willing to pay for a one-off connection fee, and their monthly spend on non-cooking energy. For the households willing to pay a connection fee for the grid, their willingness to pay, in monetary terms, was significantly associated with their monthly spend on non-cooking energy. This association was driven by households willing to pay amounts greater than $28 for this connection—households that spent at least $6 monthly on non-cooking energy were more likely to be willing to pay a minimum grid connection fee of $28, compared to those spending less than $6 monthly. Note that other outcome variables were tested for an association with ‘monthly spend on cooking energy’ to gauge the households’ desire for grid electricity (e.g., preference for stable grid connection for 4–6 h/day to current SHS connection, willingness to pay a one-off grid connection fee, maximum monthly tariff households are willing to pay for this connection, and their satisfaction with daily duration of SHS). However, none provided a significant result.
The dissatisfaction with SHS capacity, and desire for grid electricity (or any technology capable of powering larger appliances) was also mentioned in the respondents’ answers to questions about how they felt about their SHS, for example (‘FCT-R’ stands for ‘FCT respondent’):
‘The only problem I have with it is that it cannot (power) my television or my fridge and my fan, that is the only problem I have with the solar’ (FCT-R1).
‘I would prefer a bigger one that can take a fridge and television’ (FCT-R4).
‘I really want NEPA, if it were available, I would pay for NEPA. But since there is no NEPA, that is why we went for solar’ (FCT-R7).
NEPA is an acronym for the National Electric Power Authority, a now defunct institution that once managed the electricity supply system in Nigeria and is commonly used as a metaphor for grid electricity in Nigeria.
Table 8 shows that the preference of the Lagos State households to connect to the grid, and to pay a one-off connection fee, was significantly associated with their monthly spend on non-cooking energy. The results suggested that wealthier households (spending more than $20 monthly on non-cooking energy) were 13 times more likely to prefer a stable grid connection with 4–6 h of electricity access per day, and were 9 times more willing to pay a connection fee to access this stable grid, compared to the less wealthy households spending less than $20 monthly on non-cooking energy. Table 8 also shows that the maximum amount these households were willing to spend as monthly tariffs for this connection was significantly associated with their monthly spend on non-cooking energy. The results implied that the wealthier households were more likely to pay higher sums (in excess of $40), as monthly tariffs for this stable connection to the grid compared to the less wealthy households, while the less wealthy households were more likely to pay smaller sums (less than $30) as monthly tariffs for the stable grid electricity.
The preference for grid-based electricity was also suggested by the respondents’ answers to questions about how they felt about their SHS, with responses such as the following (‘LG-R’ stands for ‘Lagos State respondent’):
‘I prefer NEPA because, you know the solar cannot (power) a fan, but NEPA can (power) the fan, fridge, television’ (LG-R3).
‘If NEPA (is available) I would prefer it, so I can have fridge and fan’ (LG-R12).
‘I just think it (SHS) is a waste of money (…) it does not have fan, it cannot (power) a freezer, meanwhile in one week you spend N2,500 ($7) on it (…) If there is NEPA, nobody in this environment will use it’ (LG-R11).
The households were asked if they were satisfied with the daily duration of their SHS, and the results for the Lagos State communities are also shown in Table 8. There was a significant association between their response to this question and the household monthly spend on non-cooking energy. The results suggest that the less wealthy households (spending less than $20 monthly on non-cooking energy) were more likely to be satisfied with its duration while the wealthier households (spending more than $20 monthly on non-cooking energy) were less likely to be satisfied, than could be explained by chance. The OR value suggests that less wealthy households were 8.4 times more likely to be satisfied by the SHS duration, compared to the wealthier households.
In summary, the results show that while most of the households across both FCT and Lagos State use SHS as their main household lighting energy source, none of them were satisfied with its capacity. It also suggested that the wealthier households in both locations were likely to own appliances that could not be accommodated by their SHSs, when compared to the less wealthy households. Furthermore, the results imply that among the FCT households, the wealthier ones were significantly more willing to pay for a connection to the grid, compared to their less wealthy neighbours. The Lagos State results were similar, with wealthier households more likely to prefer a grid connection and be more willing to pay for it, compared to the less-wealthy households.

4. Discussion

Four themes emerged from the data obtained across both locations. First, differences were observed in the main lighting energy source used by the households across both locations. SHS was the dominant source used for lighting across both locations, 66% using it as their main source in FCT while 86% used it as a main source in Lagos State. Further, 30% of households in FCT used dry cell batteries for their main lighting energy source, while no household in Lagos State reporting this. The dominant nature of SHS for lighting in the households is to be expected, considering research has shown that once solar PV technologies are introduced into households, they displace kerosene used for lighting [40,41,42]. The difference in SHS use observed across both locations could be explained by the fact the FCT households, on average, have a greater number of rooms compared to the Lagos State households (see Table 2). Both types of SHS used in the households surveyed provide only 4 lighting points, hence many of the FCT households (65% with greater than 4 rooms) would require separate energy sources to provide lighting for the other rooms. This likely explains their relatively high use (30%) of dry cell batteries, compared to Lagos State households (84% with less than 5 rooms).
Second, as set out in Table 5 and Table 6, multiple households owned various appliances that could not be accommodated by their SHS and hence were, for all intents and purposes, unusable. While this behaviour seemed baffling, it has been documented in previous research. In their survey in rural Kenya, Lee et al. [34] (p. 91) observed a similar situation and referred to it as “aspirational” purchases, while Stojanovski et al. [20], in their survey of SHS-using rural Kenyan and Ugandan households, implied that these purchases might provide their owners with a sense of having higher social status. Stojanovski et al. [20] also indicated the households believed, without any proof, that the national grid would soon be extended to their communities, which would allow them to use these aspirational appliances.
Third, studies on communities using SHS as their primary lighting providers have shown that many view it as more of a pre-electrification process, and are willing to make payments to a value that would be economically sustainable for a grid-type utility [13,43]. This was observed in the results of this study as seen in Table 7 and Table 8, with 86% of FCT households and 68% of Lagos State households stating a willingness to pay a one-off connection fee for access to grid electricity. This follows on from the earlier observation, i.e., a significant number of households purchase electrical appliances that cannot be accommodated by their SHS, in the hope of getting a grid connection in the future and make use of the energy services (space cooling, entertainment, etc.) these appliances provide. Finally, while the energy services afforded to the households by their SHSs differed across both locations (FCT households had lighting and mobile phone charging, while the Lagos State households’ SHS included a television) none of the households in either location indicated being satisfied with the energy capacity of their SHS.
These themes show that while both locations had similar issues with their lack of electrification, there were some differences in the way households used energy sources, and their desire to connect to the grid. This suggests it might be pertinent for policy makers and private institutions involved with rural electrification to tailor their interventions as opposed to applying a blanket approach to these rural communities. For example, the levels of subsidies or grants that might be offered for rural electrification projects could be made to be dependent on the relative wealth of the communities to be electrified, based on metrics that indicate their wealth and willingness to pay for electricity access. However, further research is required to determine whether these observed differences are statistically significant.
SHSs are often seen as a means to get households onto the modern energy ladder [33,44,45]. However, the results show that for many it was a less desirable substitute for a grid-based service. Their inability to connect as many appliances to the SHS as they would have liked seemingly led to the statistically significant associations between the wealth of a household and (i) their ownership of various household appliances with wattages too high for their SHS, and (ii) their desire to connect to, and pay for, a grid-type electricity supply. This confirms the intuition that wealthier households are more likely to purchase these high wattage appliances and therefore will be more inclined to prefer a grid connection. The minimum wage of approximately $50 per month in Nigeria [46] at the time of conducting the survey provides some context regarding the FCT households’ willingness to spend in excess of $28 for a one-off grid connection fee, and the Lagos State households’ willingness to make monthly $40-plus electricity tariff payments for ongoing access to the grid. However, it is important to note that a household stating they are willing to pay for a grid connection does not necessarily equate to their ability to pay for said connection or indeed a decision to actually do it if the opportunity arises. Nonetheless, the findings demonstrate that a significant number of the households are unable to move up the energy ladder (or in the case of the MTF, up the tier levels) regardless of their willingness or ability to pay, as they do not have access to an electricity connection that can meet their demands. In this situation, the household can be referred to as being ‘energy locked in’.
There are other ways to get rural households up the energy ladder ahead of expansion of the national grid, and ahead of alternative major infrastructure investments in mini-grids. One approach is so-called “swarm electrification”, to connect a number of SHS units across a community, which will act to smooth the total electricity demand through diversity effects and share the generation capacity from all individual systems [47], as a sort of ‘micro-grid’. This bottom-up approach to electrification eliminates the typical oversizing in the design of mini-grids and grid extension projects while enabling households to transition to a higher energy access tier using their legacy SHS [44,47]. Another approach is the development of a diverse and competitive market for energy efficient, DC-powered plug-and-play appliances. As described by Narayan et al. [48], these consume a fraction of the energy required by their mainstream counterparts running on AC. Some SHS providers bundle these efficient appliances with their service, and in the households surveyed for this research the SHS came with four energy efficient, DC-powered LED bulbs at 1 W each, a torchlight at 1.1 W, and (in Lagos State) a television at 10.8 W. Creating more energy efficient appliances, such as the Youmma refrigerator which has a power rating of 17.8 W [49] and having them come with a standardized, compatible plug-and-play facility, can enable SHS-using households to move up the MTF tiers. However, in order for this energy efficient appliance market to grow, quality standards need to be created and adopted by countries involved with SHS electrification programs. Further, traditional household electronics manufacturers, with the know-how of making these appliances, could be encouraged to get involved in the production of energy-efficient DC-powered appliances. This would help provide a greater selection of appliances, and more competition in the market.
A natural progression of this research would be to expand the numbers of surveys to include communities using a wider variety of off-grid technologies, for example from simple solar lanterns to solar mini-grids, and observe the changes, if any, to the results of this research. Further, expanding the number of locations to include more remote rural communities that are a further distance from major cities/urban centres than in this research, might result in energy-use patterns that provide different results. It should also be noted that the choice of interviewing the heads of households led to the majority of the respondents in the study being male. The traditional role women have with the collection of cooking fuel, food preparation and cooking due to cultural gender norms [50,51,52] would likely reduce the time they can spend using certain energy services provided by the SHS, for example watching a television. It is therefore possible women might have different opinions to men with regards to their views and aspirations about their non-cooking energy service demands and the ability of a SHS to meet them, and the significance of these gender-based differences, if any, could be the subject of future research.

5. Conclusions

Energy is a crucial input for socioeconomic development, and it follows that the ability to not only access modern energy, but to transition to a wide range of energy services, is instrumental to the development of any society. This research set out to examine energy transitions in rural Nigeria, with the following objectives:
  • Examine if the SHS technologies distributed to these rural communities met their non-cooking household energy services demand.
  • Examine if energy lock-in effects occur in these rural households using SHS technologies.
The results showed that none of the households were satisfied with the energy capacity of their SHS, and that the wealthier households were willing to pay relatively large sums to connect to the grid so they could use energy services unavailable to them with their SHS. However, they were unable to do so due to the unavailability of any electricity supply technology that would power their appliances. While the goal of SDG7 may have been achieved across these communities with the provision of SHS, many of the households clearly exhibited some frustration and dissatisfaction with the actual level of energy access, as they do not see a clear transition pathway up the energy ladder.
Two methods were suggested to help rural households in this situation move up the MTF energy access tiers: swarm electrification using the existing SHS technologies, and the provision of a greater selection of energy efficient, plug-and-play DC-powered appliances. Public and private entities in Nigeria involved in rural electrification with SHS could use the findings shown here to better understand the energy transition needs of rural households, and provide the interventions required to move them up the ladder. For example, they could provide funding into researching swarm electrification technology in rural Nigeria.

Author Contributions

Conceptualisation, O.H., S.M., and M.L.; methodology, O.H., S.M., and M.L.; software, O.H.; validation, O.H., S.M., and M.L.; format analysis, O.H., investigation, O.H.; resources, O.H., S.M., and M.L.; data curation, O.H.; writing—original draft preparation, O.H.; writing—review and editing, O.H., S.M., and M.L.; visualisation, O.H.; supervision, S.M. and M.L. All authors have read and agreed to the published version of the manuscript.

Funding

This research received no external funding.

Acknowledgments

This work was supported by the Centre for Environment and Sustainability, University of Surrey.

Conflicts of Interest

The authors declare no conflict of interest.

Appendix A. Survey Questionnaire

SECTION 1: RESPONDENT DETAILS
1.1
Age of respondent ☐ 18–21 (1) ☐ 22–25 (2) ☐ 26–30 (3) ☐ 31–35 (4) ☐ 36–40 (5)
  •  ☐ 41–45 (6) ☐ 46–50 (7) ☐ 51–55 (8) ☐ 56–60 (9) ☐ 61+ (10)
1.2
Gender of respondent ☐ Female (2) ☐ Male (1)
SECTION 2: HOUSEHOLD INFORMATION
2.1
What is the highest level of formal education by respondent? ☐Nursery (1) ☐Primary (2) ☐ Secondary (3) ☐Undergraduate (4) ☐Postgraduate (5)
  •  ☐Other (please explain) (6) _____________________
  •  ☐None of the above (7)
2.2
Is the respondent the head of the household ? ☐Yes (1) ☐No (2)
2.3
If (no) to 2.2, what is the relationship of respondent to head of ☐ Brother (1) ☐ Sister (2) ☐ Friend (3)
  • household? ☐ Husband (4) ☐ Wife (5) ☐ Father (6)
  •  ☐ Mother (7) ☐ Child (8)
  •  ☐ Other (please explain) (9) _______________________________
2.4
What is the main occupation of the respondent? ☐ Store owner (1) ☐ Farmer (2) ☐ Street Hawker (3)
  •  ☐ Civil servant (4) ☐Factory worker (5) ☐ Teacher (6)
  •  ☐ Trader (7) ☐ Mechanic (8) ☐ Hairdresser (9)
  •  ☐ Others (specify) (10) ____________________________________
2.5
What type of dwelling is the household? ☐ separate house (1) ☐ semi-detached house (2) ☐ Hut (3)
  •  ☐ Tent (4) ☐ Compound house (5) ☐ Flat (6)
  •  ☐ Other (specify) (7) _______________________________________
2.6
What material is the roof mostly made of? __________________________________________________________
2.7
What material is the floor mostly made of? __________________________________________________________
2.8.
What material are the walls mostly made of? ___________________________________________________________
2.9
How many ‘family’ or living spaces does the home have? ____________________________________________________
2.10
How many rooms are in the household? ___________________________________________________________
2.11
Does the respondent keep any livestock? ☐ Yes (1) ☐ No (2)
  •  If yes, please list all and the number of each
  •  Type ____________________ Number ______________
  •  Type ____________________ Number ______________
  •  Type ____________________ Number ______________
  •  Type ____________________ Number ______________
  •  Type ____________________ Number ______________
2.12
Do you grow your own crops? ☐ Yes (1) ☐ No (2)
  •  If yes, please list all and approximate area of total farmland (plot)
  •  Type ____________________ Area of farm __________
  •  Type ____________________
  •  Type ____________________
  •  Type ____________________
  •  Type ____________________
2.13
What proportion of your income would you say you spend
  • on household energy (non-cooking)? ___________________________________________
2.14
How many people live in this household? ___________________________________________
2.15
Of the people in (2.14), how many live in the house at least
  • 18 days or more per month? ___________________________________________
SECTION 3: HOUSEHOLD ENERGY MIX/CONSUMPTION
3.1
Which of these is your main household fuel for lighting only? Please select no more than one
  •  ☐ Candles (1) ☐ Kerosene (2) ☐ LPG (3) ☐ firewood/biomass (4) ☐ Car batteries (5) ☐ Dry cell batteries (6) ☐ Electricity (grid) (7) ☐ electricity (mini-grid) (8) ☐ Electricity (SHS) (9) ☐ Petrol (10) ☐ Diesel (11) ☐ Other (please specify) (12) ____________________________
3.2
Reasons for using the above fuel?
  •  ☐ Familiar fuel (1) ☐ No other fuel available (2) ☐ Easy to use (3) ☐ Easily available (4) ☐ Cheap (5) ☐ Other fuels are not affordable (6) ☐ Other (please explain) (7) _________________________
3.3
(a) Are you satisfied using this (main) fuel?
  •  ☐Yes (1) ☐ No (2)
  • (b) If No to (3.3), please give reason why. Select up to 3 reasons
  •  ☐ Not selected (0) ☐ Not safe (1) ☐ Expensive (2) ☐ Health concerns (3) ☐ Other (please explain) (4) ___________
3.4
What other fuel sources do you use at home for lighting? Please select at least one
  •  ☐ Candles (1) ☐ Kerosene (2) ☐ LPG (3) ☐ firewood/biomass (4) ☐ Car batteries (5) ☐ Dry cell batteries (6) ☐ Electricity (grid) (7) ☐ electricity (mini–grid) (8) ☐ Electricity (SHS) (9) ☐ Petrol (10) ☐ Diesel (11) ☐ Mobile phone (12) ☐ Other (please specify) (13)______ ☐ None (14) (if none, skip to question 3.6)
3.5
When do you use this other fuel source for lighting?
  •  ☐ Main fuel too expensive (1) ☐ Main fuel not available (2) ☐ Main fuel capacity inadequate (3) ☐ Other (please explain) (4)__________________________ ☐ not applicable (5)
3.6
What other fuel source do you use at home for other non-lighting & non-cooking activities? (radio, television, fan, fridge, etc.)
  •  ☐ Car batteries (1) ☐ Dry cell batteries (2) ☐ Electricity (grid) (3) ☐ electricity (mini-grid) (4) ☐ Electricity (SHS) (5) ☐ Petrol (6) ☐ Diesel (7) ☐ Other (please specify) (8) _____________ ☐ None (9)
3.7
Other sources of fuel which are available for purchase (for any non-cooking purpose) that are not used, and why (please tick if relevant):
Available FuelNot Safe (1)Expensive (2)Smoky (3)Unreliable (4)Health Concerns (5)Redundant (6)Not Available (7)
Candles
Kerosene
LPG
Electricity (grid)
Electricity (mini grid)
Electricity (SHS)
Petrol
Diesel
Other (specify)
3.8
Who determines the household choice of fuels (for non- ☐ Head of household (1) ☐ Other (please specify) (2)
  •   cooking activities only, e.g., lighting, fan, fridge, etc.)? ______________________________
3.9 
Energy Access Attributes: Make notes of the units used (per week, per month, kg, bag, etc. to allow for consistency). If individual respondents prefer to use weekly or monthly basis, make a note of which one they used.
Household Consumption QuestionsCandles (i)Kerosene (ii)LPG (iii)Electricity (Grid) (iv)Electricity (Mini Grid) (v)Electricity (SHS) (Hours) (vi)Petrol (Litres) Q (vii)Diesel (viii)Car Batteries (ix)Dry Cell Batteries (x)Other (xi)
(a).
How much do you use, on average, on a weekly basis for household fuel?
(b).
How long does it take to purchase, or how far do you have to travel to purchase?
(c).
* How often do you charge it, on a weekly basis?
Notes: For (a), measuring the consumption of grid electricity might be difficult to ascertain. Calculate based on how much they are charged in their tariffs. Further, the questions with “*” is for car batteries only.
3.10 
 
Reliability QuestionsCandles (i)Kerosene (ii)LPG (iii)Electricity (Grid) (iv)Electricity (Mini Grid) (v)Electricity (SHS) (Hours) (vi)Petrol (Litres) Q (vii)Diesel (viii)Car Batteries (ix)Dry Cell Batteries (x)Other (xi)
(a).
In the past 1 month, would you say you have experience shortages/interruptions with this fuel?
(b).
In the past 1 month, how many times have you experienced shortages/interruptions with this fuel?
Notes: For the electricity fuels, number of shortages would be measured by how many hours per day there was no electricity. For other fuels, they would involve number of times these fuels have not been available to purchase in that month period.
3.11 
 
Affordability QuestionsCandles (i)Kerosene (ii)LPG (iii)Electricity (Grid) (iv)Electricity (Mini Grid) (v)Electricity (SHS) (Hours) (vi)Petrol (Litres) Q (vii)Diesel (viii)Car Batteries (ix)Dry Cell Batteries (x)Other (xi)
(a).
Over the past 1 month, how much on average, per unit, do you spend on purchasing the fuel?
(b).
Would you say that you can afford to purchase the fuel:
1.
   All the time
2.
   Only some of the time
3.
   Can barely or cannot afford it
Notes: Per unit here means per kg, per litre, per bag, etc. Ensure the “per unit” is defined by the respondent. It does not have to be an exact figure, but an approximation of size/quantity should be obtained. ‘Per unit’ is different for SHS users as they would most likely be paying a flat rental rate per week/month, hence their ‘unit’ would be a period of time.
SECTION 4: HOUSEHOLD ELECTRIFICATION
4.1
(a) Is this household connected to the national grid supply for electricity? (only national provider should be considered, i.e., PHCN)
  •  ☐ Yes (1) ☐ No (2)
  • (b) If No, please say why you are not connected
  •  ☐ High cost of connection (1) ☐ High cost of tariff/monthly payments (2) ☐ not reliable (3) ☐ not available (4) ☐ other (please explain) (5)
4.2
(a) Does this household receive electricity from the grid (defined as defined as 12+ hours of grid electricity per week)
  •  ☐ Yes (1) ☐ No (2)
  • (b) If No, then how is electricity supplied to the household?
  • ☐ PV solar panel (1) ☐ Mini-grid (2) ☐ Car battery (3) ☐ Dry cell battery (4) ☐Personal generator (5) ☐ Communal
  • generator (6) ☐ Other (please specify) (7) ☐ not applicable (8)
4.3
Do you own a solar home system (SHS)?
  •  ☐ Yes (1) ☐ No (2)
    (if “no”, skip to question 4.19)
  • (if “yes”, skip questions 4.19 & 4.20)
4.4
(a) Did you purchase the SHS, or was it provided for free?
  •  ☐ Purchase (1) ☐ Free (2) ☐ Not applicable (3)
  • (b) If “free”, would you still have gotten the SHS if it was not free? ☐ Yes (1) ☐ No (2) ☐ Not applicable (3)
4.5
How long ago (in months) did the household first get the SHS?
  •  ____________ months
4.6
What is the capacity of your SHS (in Watts?) (If they do not know the answer to this, offer to check the unit)
  •  ____________ watts
4.7
Which of the following appliances do you want to own, already own, do not want/care to own, or cannot use? (Tick as appropriate)
AppliancesWant to Own (1)Already Own (2)Do Not Need/Want (3)Own, But Cannot Use (4)Not Applicable (5)
LED bulb
Mechanical fan
Radio
Television
Fridge/freezer
Water Pump
Mobile Charger
Rechargeable Torch
Electric Iron
CD/DVD Player
Air conditioning
Electric Cooker
Other (please specify)
4.8
If you ticked any appliance under “want to own”, why haven’t you purchased the equipment?
  •  ☐ Too expensive to purchase (1) ☐ Not available to purchase (2) ☐ capacity of power source not adequate (3) ☐ other (please explain) (4)
4.9
In the past 3 months, how many hours a day would you say you use the SHS system?
  •  ☐ <1 (1) ☐ 1 (2) ☐ 2 (3) ☐ 3 (4) ☐ 4 (5) ☐ 5 (6) ☐ 6 (7) ☐6+ (8) ☐ n/a (12)
4.10
What is the duration, in hours/day, you would prefer to have the supply of electricity, as opposed to what you have now?
  •   a ☐ From _______ to _________ (1) b ☐ Happy with the current duration (2) c ☐ n/a (3)
4.11
What has been the most important use of your SHS for your household? Please tick in descending order of importance, with 4 being the most important and 1 the least important.
Entertainment (television, radio) (a)Security (as a result of better light outside) (b)Using it for work (mobile phone charging business, etc.) (c)For general household lighting (d)
4
3
2
1
n/a
4.12
In the past 1 month, has your SHS failed to provide electricity for more than half the time it did when you got it?
  •  ☐ Yes (1) ☐ No (2) ☐ n/a (3)
4.13.
Do you feel the capacity of your SHS limits your ability to fully enjoy the benefits of electricity, i.e., would you enjoy it more if it were able to power more electrical appliances?
  •  ☐ Yes (1) ☐ No (2) ☐ n/a (3)
4.14
(a) Do you prefer a mini-grid/national grid connection guaranteed for, say 4 to 6 h per day, (use NEPA or PHCN acronym if it helps them understand) than the SHS for the whole day?
  •  ☐ Yes (1) ☐ No (2) ☐ n/a (3)
  • (b) If “Yes, what are your reasons? __________________________________________________________________________________________
  •  ____________________________________________________________________________________________________________________
  • (c) If “No”, what are your reasons? ____________________________________________________________
  •  ___________________________________________________________________________________________________________________
4.15
(a) Would you be willing to pay a part of the connection/set up cost if it meant you would get connected to a national/mini grid that promises to provide uninterrupted supply of electricity?
  •  ☐ Yes (1) ☐ No (2) ☐ n/a (3)
  • (b) If “yes”, how much would you be willing to pay? ____________
  • (c) If “yes”, what is the minimum number of hours per day of electricity you would expect from the grid to be worth your payment?
  •  Amount ___________
4.16
How much more compared to your SHS payments would you be willing to pay regularly on a monthly basis for electricity, if you can upgrade to the national grid/mini grid? (If SHS use is free, then just ask how much they would be willing to pay monthly to use the grid, as opposed to comparing to SHS payments)
  •  Amount: __________
4.17
Has your SHS lived up to the expectations you had before you purchased it. Please explain ________________________________________________________________________________________________________________________________________________
4.18
If the answer to 4.3 is “no”, why do you not own a SHS?
  •  ☐ High cost of connection (1) ☐ High cost of tariff/monthly payments (2) ☐ not reliable (3) ☐ not available (4)
  •  ☐ Not needed (5) ☐ other (please explain) (6) ☐ n/a (7) ☐ capacity too small (8)
4.19
(a) If the answer to 4.3 is “no”, have you previously owned a SHS?
  •  ☐ Yes (1) ☐ No (2)
  • (b) If “yes”, why do you no longer have one? Please explain _____________________________________________________________________________________________________________________________________________________________
  • (c) If “yes”, what has been your experience since you have switched to using other fuel sources for your household? Please
  • explain ____________________________________________________________________________________________________________________________________________________________________________________________________________________________________________________________________________________________________________________

References

  1. Oyedepo, S.O. Energy and sustainable development in Nigeria: The way forward. Energy Sustain. Soc. 2012, 2, 1–17. [Google Scholar] [CrossRef] [Green Version]
  2. Martínez, D.M.; Ebenhack, B.W. Understanding the role of energy consumption in human development through the use of saturation phenomena. Energy Policy 2008, 36, 1430–1435. [Google Scholar] [CrossRef]
  3. IEA; United Nations Statistics Division; International Renewable Energy Agency; World Bank; World Health Organization. Tracking SDG 7: The Energy Progress Report 2020; Washington, DC, USA, 2020; Available online: https://www.iea.org/reports/tracking-sdg7-the-energy-progress-report-2020 (accessed on 4 November 2020).
  4. Zubi, G.; Fracastoro, G.V.; Lujano-Rojas, J.; El Bakari, K.; Andrews, D. The unlocked potential of solar home systems; an effective way to overcome domestic energy poverty in developing regions. Renew. Energy 2019, 132, 1425–1435. [Google Scholar] [CrossRef]
  5. Bednar, D.J.; Reames, T.G. Recognition of and response to energy poverty in the United States. Nat. Energy 2020, 5, 432–439. [Google Scholar] [CrossRef]
  6. González-Eguino, M. Energy poverty: An overview. Renew. Sustain. Energy Rev. 2015, 47, 377–385. [Google Scholar] [CrossRef]
  7. Jessel, S.; Sawyer, S.; Hernández, D. Energy, Poverty, and Health in Climate Change: A Comprehensive Review of an Emerging Literature. Front. Public Health 2019, 7, 357. [Google Scholar] [CrossRef] [Green Version]
  8. Reddy, A.K.N. Energy and Social Issues. In World Energy Assessment: Energy and the Challenge of Sustainability, 1st ed.; Goldenberg, J., Ed.; UNDP: New York, NY, USA, 2000; pp. 39–61. [Google Scholar]
  9. Bhatia, M.; Angelou, N. Beyond Connections: Energy Access Redefined; The World Bank: Washington, DC, USA, 2015. [Google Scholar]
  10. Culver, L.C. Energy Poverty: What You Measure Matters. In Proceedings of the Reducing Energy Poverty with Natural Gas: Changing Political, Business and Technology Paradigms Symposium, Stanford, CA, USA, 9–10 May 2017; pp. 1–25. [Google Scholar]
  11. Bhattacharyya, S.C.; Palit, D. Introduction. In Mini-Grids for Rural Electrification of Developing Countries, 1st ed.; Bhattacharyya, S.C., Palit, D., Eds.; Springer International Publishing: Cham, Switzerland, 2014; pp. 1–10. [Google Scholar]
  12. Palit, D.; Bandyopadhyay, K.R. Rural electricity access in South Asia: Is grid extension the remedy? A critical review. Renew. Sustain. Energy Rev. 2016, 60, 1505–1515. [Google Scholar] [CrossRef]
  13. Palit, D.; Chaurey, A. Off-grid rural electrification experiences from South Asia: Status and best practices. Energy Sustain. Dev. 2011, 15, 266–276. [Google Scholar] [CrossRef]
  14. Bos, K.; Chaplin, D.; Mamun, A. Benefits and challenges of expanding grid electricity in Africa: A review of rigorous evidence on household impacts in developing countries. Energy Sustain. Dev. 2018, 44, 64–77. [Google Scholar] [CrossRef]
  15. Agenbroad, J.; Carlin, K.; Ernst, K.; Doig, S. Minigrids in the Money: Six Ways to Reduce Minigrid Costs by 60% for Rural Electrification; Rocky Mountain Institute: Boulder, CO, USA, 2018. [Google Scholar]
  16. Deichmann, U.; Meisner, C.; Murray, S.; Wheeler, D. The economics of renewable energy expansion in rural Sub-Saharan Africa. Energy Policy 2011, 39, 215–227. [Google Scholar] [CrossRef] [Green Version]
  17. Carr-Wilson, S.; Pai, S. Pay-As-You-Go: How a Business Model Is Helping Light Millions of Rural Kenyan Homes with Solar. Case Stud. Environ. 2018, 2, 1–10. [Google Scholar] [CrossRef]
  18. Sawin, J.L.; Sverrisson, F.; Rickerson, W. Renewables 2015 Gobal Status Report; REN21: Paris, France, 2015. [Google Scholar]
  19. Baurzhan, S.; Jenkins, G.P. Off-grid solar PV: Is it an affordable or appropriate solution for rural electrification in Sub-Saharan African countries? Renew. Sustain. Energy Rev. 2016, 60, 1405–1418. [Google Scholar] [CrossRef]
  20. Stojanovski, O.; Thurber, M.; Wolak, F. Rural energy access through solar home systems: Use patterns and opportunities for improvement. Energy Sustain. Dev. 2017, 37, 33–50. [Google Scholar] [CrossRef]
  21. Ashden. Mobisol/Electrifying East Africa. Available online: https://www.ashden.org/winners/mobisol#continue (accessed on 10 January 2018).
  22. Barrie, J.; Cruickshank, H.J. Shedding light on the last mile: A study on the diffusion of Pay as You Go Solar Home Systems in Central East Africa. Energy Policy 2017, 107, 425–436. [Google Scholar] [CrossRef] [Green Version]
  23. Adwek, G.; Boxiong, S.; Ndolo, P.O.; Siagi, Z.O.; Chepsaigutt, C.; Kemunto, C.M.; Arowo, M.; Shimmon, J.; Simiyu, P.; Yabo, A.C. The solar energy access in Kenya: A review focusing on Pay-As-You-Go solar home system. Environ. Dev. Sustain. 2020, 22, 3897–3938. [Google Scholar] [CrossRef]
  24. Bisaga, I.; Puźniak-Holford, N.; Grealish, A.; Baker-Brian, C.; Parikh, P. Scalable off-grid energy services enabled by IoT: A case study of BBOXX SMART Solar. Energy Policy 2017, 109, 199–207. [Google Scholar] [CrossRef] [Green Version]
  25. IRENA. Pay-as-You-Go Models: Innovation Landscape Brief; International Renewable Energy Agency: Abu Dhabi, UAE, 2020. [Google Scholar]
  26. Azimoh, C.L.; Klintenberg, P.; Wallin, F.; Karlsson, B. Illuminated but not electrified: An assessment of the impact of Solar Home System on rural households in South Africa. Appl. Energy 2015, 155, 354–364. [Google Scholar] [CrossRef] [Green Version]
  27. Mondal, A.H.; Klein, D. Impacts of solar home systems on social development in rural Bangladesh. Energy Sustain. Dev. 2011, 15, 17–20. [Google Scholar] [CrossRef]
  28. Rahman, S.M.; Ahmad, M.M. Solar Home System (SHS) in rural Bangladesh: Ornamentation or fact of development? Energy Policy 2013, 63, 348–354. [Google Scholar] [CrossRef]
  29. Lemaire, X. Solar home systems and solar lanterns in rural areas of the Global South: What impact? Wiley Interdiscip. Rev. Energy Environ. 2018, 7, e301. [Google Scholar] [CrossRef]
  30. Diallo, A.; Moussa, R.K. The effects of solar home system on welfare in off-grid areas: Evidence from Côte d’Ivoire. Energy 2020, 194, 1–12. [Google Scholar] [CrossRef]
  31. Opiyo, N.N. Impacts of neighbourhood influence on social acceptance of small solar home systems in rural western Kenya. Energy Res. Soc. Sci. 2019, 52, 91–98. [Google Scholar] [CrossRef]
  32. Gustavsson, M. Educational benefits from solar technology—Access to solar electric services and changes in children’s study routines, experiences from eastern province Zambia. Energy Policy 2007, 35, 1292–1299. [Google Scholar] [CrossRef]
  33. Opiyo, N.N. How solar home systems temporally stimulate increasing power demands in rural households of Sub-Saharan Africa. Energy Transit. 2020, 1–13. [Google Scholar] [CrossRef]
  34. Lee, K.; Miguel, E.; Wolfram, C. Appliance Ownership and Aspirations among Electric Grid and Home Solar Households in Rural Kenya. Am. Econ. Rev. 2016, 106, 89–94. [Google Scholar] [CrossRef] [Green Version]
  35. World Bank. Nigeria on the Move: A Journey to Inclusive Growth. Systematic Country Diagnostic; World Bank: Washington, DC, USA, 2020. [Google Scholar]
  36. Adegbami, A.; Uche, C.I.N. Ethnicity and Ethnic Politics: An Impediment to Political Development in Nigeria. Public Adm. Res. 2015, 4, 59–67. [Google Scholar] [CrossRef]
  37. Oginni, A.; Ahonsi, B.; Ukwuije, F. Are female-headed households typically poorer than male-headed households in Nigeria? J. Socio Econ. 2013, 45, 132–137. [Google Scholar] [CrossRef]
  38. Van Den Berghe, P.L. Power and Privilege at an African University, 1st ed.; Schenkman Publishing Company, Inc.: Cambridge, MA, USA, 1973. [Google Scholar]
  39. Agresti, A. An Introduction to Categorical Data Analysis, 2nd ed.; John Wiley & Sons, Inc.: Hoboken, NJ, USA, 2007. [Google Scholar]
  40. Chaurey, A.; Kandpal, T.C. Carbon abatement potential of solar home systems in India and their cost reduction due to carbon finance. Energy Policy 2009, 37, 115–125. [Google Scholar] [CrossRef]
  41. Rehman, I.H.; Malhotra, P.; Pal, R.C.; Singh, P.B. Availability of kerosene to rural households: A case study from India. Energy Policy 2005, 33, 2165–2174. [Google Scholar] [CrossRef]
  42. Sarker, S.A.; Wang, S.; Adnan, M.K.M.; Anser, M.K.; Ayoub, Z.; Ho, T.H.; Tama, R.A.Z.; Trunina, A.; Hoque, M.M. Economic Viability and Socio-Environmental Impacts of Solar Home Systems for Off-Grid Rural Electrification in Bangladesh. Energies 2020, 13, 679. [Google Scholar] [CrossRef] [Green Version]
  43. Alam, M.; Bhattacharyya, S. Are the off-grid customers ready to pay for electricity from the decentralized renewable hybrid mini-grids? A study of willingness to pay in rural Bangladesh. Energy 2017, 139, 433–446. [Google Scholar] [CrossRef]
  44. Narayan, N.; Chamseddine, A.; Vega-Garita, V.; Qin, Z.; Popovic-Gerber, J.; Bauer, P.; Zeman, M. Quantifying the Benefits of a Solar Home System-Based DC Microgrid for Rural Electrification. Energies 2019, 12, 938. [Google Scholar] [CrossRef] [Green Version]
  45. Narayan, N.; Chamseddine, A.; Vega-Garita, V.; Qin, Z.; Popovic-Gerber, J.; Bauer, P.; Zeman, M. Exploring the boundaries of Solar Home Systems (SHS) for off-grid electrification: Optimal SHS sizing for the multi-tier framework for household electricity access. Appl. Energy 2019, 240, 907–917. [Google Scholar] [CrossRef]
  46. Nwanne, C. New Minimum Wage of N30,000 Takes Effect. Available online: https://search.proquest.com/docview/2330910722 (accessed on 28 December 2019).
  47. Koepke, M.; Groh, S. Against the Odds: The Potential of Swarm Electrification for Small Island Development States. Energy Procedia 2016, 103, 363–368. [Google Scholar] [CrossRef]
  48. Narayan, N.; Qin, Z.; Popovic-Gerber, J.; Diehl, J.; Bauer, P.; Zeman, M. Stochastic load profile construction for the multi-tier framework for household electricity access using off-grid DC appliances. Energy Effic. 2020, 13, 197–215. [Google Scholar] [CrossRef] [Green Version]
  49. Youmma. Reinvent Access. Available online: https://www.yoummasolar.com/ (accessed on 4 November 2020).
  50. Atagher, P.; Clifford, M.; Jewitt, S.; Ray, C. What’s for dinner? Gendered decision-making and energy efficient cookstoves in benue state, north central nigeria. WIT Trans. Ecol. Environ. 2017, 224, 101–111. [Google Scholar]
  51. Abdullahi, A.A. An Analysis of the Role of Women in Curbing Energy Poverty in Nigeria. J. Sustain. Dev. Stud. 2017, 10, 45–60. [Google Scholar]
  52. Jewitt, S.; Atagher, P.; Clifford, M. “We cannot stop cooking”: Stove stacking, seasonality and the risky practices of household cookstove transitions in Nigeria. Energy Res. Soc. Sci. 2020, 61, 101340. [Google Scholar] [CrossRef]
Figure 1. Multi-tier matrix for measuring access to household electricity supply (source: [9]).
Energies 13 06682 g001
Figure 2. Multi-tier matrix for measuring access to household electricity services (source: [9]).
Energies 13 06682 g002
Figure 3. Map of Nigeria showing the states and local government areas (LGA) where the energy surveys were performed. Note that the FCT does not have LGAs, but instead is made up of Area Councils, of which Gwagwalada is one.
Energies 13 06682 g003
Table 1. Communities selected for the survey along with the number of households (HH) in each community.
Lagos StateFederal Capital Territory (FCT)
CommunityNumber of Households%CommunityNumber of Households%
Magbon2315.3Wuna5536.7
Eleko1711.3Rafin Zurfi3020.0
Akodo106.7Dukpa1510.0
Total5033.3 10066.7
Table 2. Sample description in terms of age, gender, number of rooms in the house, size of household and education.
FrequencyPercentage of Total Sample
(a) Age group of respondents
Lagos StateFCTLagos StateFCT
18–3012392439
31–4524434843
46+14182818
Total50100100100
(b) Gender of respondents
Male37917491
Female139269
Total50100100100
(c) Number of permanent household members
1–741298229
8–136361236
14+335635
Total50100100100
(d) Number of rooms in the household
1–442358435
5–88331633
9+032032
Total50100100100
(e) Maximum education level of respondent
Male respondents
Primary5231425
Secondary20375441
Tertiary10212723
No formal education210511
Total3791100100
Female respondents
Primary127.722
Secondary1057756
Tertiary107.70
None127.722
Total139100100
Table 3. Main energy source for non-cooking (mostly lighting) purposes and satisfaction with the capacity of the main household non-cooking energy source.
Main Household Lighting Energy Source
Lagos StateFCT
FrequencyPercentFrequencyPercent
(a) Main household non-cooking energy source
Electricity-SHS43866666
Petrol3600
Dry cell batteries003030
Electricity grid4800
Kerosene0044
Total50100100100
(b) Household satisfaction with the capacity of the main household non-cooking energy source
SatisfiedNot SatisfiedSatisfiedNot Satisfied
Electricity-SHS043066
Petrol1200
Dry cell batteries002010
Electricity grid4000
Kerosene0013
Total5452179
Table 4. Household monthly spend on non-cooking energy across both locations.
Monthly Spend on Non-Cooking Energy, USD ($)Lagos StateFCT
FrequencyPercentFrequencyPercent
0–4.99004242.0
5.00–9.991122.02929.0
10.00–14.991122.01515.0
15.00–19.9924.077.0
20.00–24.9948.044.0
25.00–29.99816.000
30+1428.033.0
Total50100100100
Table 5. Association between the ownership of household appliances and the monthly spend on non-cooking household energy, FCT.
Household ApplianceOwnershipMonthly Spend on Non-Cooking Energy, USD ($)Total
Less than 66 and Greater
Mechanical fan (for indoor cooling)No40 (33.5)27 (33.5)67
Yes9 (15.5)22 (15.5)31
Chi square7.97 ** (df = 1, N = 98)
Odds ratio3.62 (95% CI: 1.45, 9.05)
TelevisionNo40 (29)18 (29)58
Yes9 (20)31 (20)40
Chi square20.45 *** (df = 1, N = 98)
Odds ratio7.65 (95% CI: 3.03, 19.35)
CD/DVD playerNo42 (31)20 (31)62
Yes7 (18)29 (18)36
Chi square21.25 *** (df = 1, N = 98)
Odds ratio8.70 (95% CI: 3.26, 23.23)
Figures provided in the table are counts of respondents in the categories while figures in parentheses are expected counts. Results of the Chi-square statistical tests are provided, while the post hoc test results are presented using the odds ratio. ** p < 0.01; *** p < 0.001.
Table 6. Association between the ownership of household appliances and the monthly spend on non-cooking energy, Lagos State.
Household ApplianceOwnershipMonthly Spend on Non-Cooking Energy, USD ($)Total
Less than 2020 and Greater
Mechanical fan (for indoor cooling)No17 (8.16)0 (8.84)17
Yes7 (15.84)26 (17.16)33
Chi square27.90 *** (df = 1, N = 50)
Odds ratio123.67 (95% CI: 6.63, 2306.11)
CD/DVD playerNo15 (10.08)6 (10.92)21
Yes9 (13.92)20 (15.08)29
Chi square7.22 ** (df = 1, N = 50)
Odds ratio5.56 (95% CI: 1.62, 19.03)
Figures provided in the table are counts of respondents in the categories while figures in parentheses are expected counts. Results of the Chi-square statistical tests are provided, while the post hoc test results are presented using the odds ratio. ** p < 0.01; *** p < 0.001.
Table 7. Association between amount households are willing to pay for one-off grid connection fee and the monthly spend on non-cooking energy, FCT.
One-Off Grid Connection Fee Household is Willing to Pay, USD ($)Monthly Spend on Non-Cooking Energy, USD ($)Total
Less than $6$6 and Greater
Less than $1117 (15.7) [0.59]13 (14.3) [−0.59]30
Between $11 and $2822 (18.31) [1.62]13 (16.69) [−1.62]35
Greater than $286 (10.99) [−2.51]15 (10.01) [2.51]21
Chi square6.53 * (df = 2, N = 86)
Total454186
Figures provided in the table are counts of respondents in the categories while figures in round parentheses are expected counts. Results of the Chi-square test is presented, * p < 0.05. The figures in square parentheses are the adjusted standardized residual values.
Table 8. Association between the preference for a stable grid connection to SHS, willingness to pay for one and the satisfaction with SHS duration, and monthly spend on non-cooking energy in Lagos State households.
Preference for Grid over SHS, Willingness to Pay for Access to a Grid Connection & Satisfaction with Duration of SHS Monthly Spend on Non-Cooking Energy, USD ($)Total
20 and GreaterLess than 20
Preference for stable grid connection for 4–6 h/day to current SHS connectionYes22 (15.08)7 (13.92)29
No4 (10.92)17 (10.08)21
Chi square15.57 *** (df = 1, N = 50)
Odds ratio13.36 (95% CI: 3.35, 53.20)
Willing to pay a connection fee to access stable grid?Yes23 (17.68)11 (16.32)34
No3 (8.3)13 (7.7)16
Chi square10.42 ** (df = 1, N = 50)
Odds ratio9.06 (95% CI: 2.13, 38.49)
Maximum regular monthly payment households are willing to make for access to stable grid electricity, USD ($)$10–$293 (8.12) [−3.93]9 (3.88) [3.93]12
$30–$407 (6.09) [−0.76]2 (2.91) [0.76]9
$41–$8313 (8.79) [−3.17]0 (4.21) [3.17]13
Fisher’s exact test16.63 *** (N = 34)
Are you satisfied with the daily duration of your SHS?Yes16 (10.08)5 (10.92)21
No8 (13.92)21 (15.08)29
Chi square11.53 *** (df = 1, N = 50)
Odds ratio8.40 (95% CI: 2.31, 30.60)
Figures provided are counts of respondents in the categories while figures in parentheses are expected counts. Results of the statistical tests are provided using the Chi-square and Fisher’s exact test. Post hoc tests are performed using the odds ratio and adjusted standardized residuals, which are presented in square parentheses. ** p < 0.01; *** p < 0.001.
Publisher’s Note: MDPI stays neutral with regard to jurisdictional claims in published maps and institutional affiliations.

