Abstract
This paper considers a long dataset of both Brent and West Texas Intermediate (WTI) crude oil prices and the Commodity (fuel) energy index (CEI) to identify possible bubbles. Using the Supremum Augmented Dickey–Fuller (SADF) test, we compare results from WTI and Brent with CEI. We prove that the CEI follows Brent crude oil (they provide similar bubble periods) and that Brent is recognized as a crude oil benchmark. Financial managers should incorporate it into their analysis and forecasts. The findings are strongly recommended to energy policymakers and investors.
1. Introduction
Are there bubbles in the energy market? This question is still important to be answered due to the fact that energy prices fluctuate over time for many reasons (economic, geopolitical, etc.). Studying the behavior of energy markets is highly important due to their effect on equity markets and the global economy. Energy prices rose steadily from the late 1990s until the financial crisis in 2007 [1].
The most energy commodity product is oil, which is a significant indicator of economic growth. Ahmad et al. [2] report that crude oil is a vital input for driving global economic growth, and oil price shocks can jeopardize this growth prospect. According to Zhang and Yao [3], “oil prices have experienced drastic fluctuations. Specifically, there exists a collective upsurge of oil prices in the sub-sample periods from 2001 to mid-2008 and from 2009 to 2011 while a sharp drop in the sub-sample period from mid-2014 to 2015. Especially from November 2001 to July 2008, several types of oil prices experienced a collective upsurge. Specifically, the monthly spot prices of West Texas Intermediate (WTI) crude oil, Brent crude oil, diesel, and gasoline have increased 579%, 606%, 509%, and 517% during the period, respectively”. The fluctuation of the energy price affects industry development and plays an important role in terms of national investment structures, economic performance, and inflation rates [4]. Further, Su et al. [5] argue that the fluctuation of prices has brought huge shocks to economic development. They reported that fluctuations were mainly due to wars in the Organization of Petroleum Exporting Countries (OPEC) or appreciation/depreciation in the United States dollar (USD). Lammerding et al. [6] reported that the price movement explanations were: (1) Oil supply shocks, (2) oil demand shocks driven by global economic activity, and (3) oil-specific demand shocks. They argue “that price changes due to financial shocks may lead to speculative bubbles” [6]. Recently, Pavlidis et al. [7] reported the role of speculation as a key driver of price fluctuations.
It is obvious that energy prices behave like many financial assets; hence, noise trading, speculation, and asset bubbles appear in energy markets [8]. Liu and Lee [4] reported that the fluctuation of energy prices indicates that prices can systematically deviate from their fundamental values. They argued that the volatility of energy prices has a significant impact on macroeconomic variables such as the consumer price index and economic growth.
It is essential to examine energy prices and detect possible bubbles. Bubbles are generally defined as high-volume trading of a given category of assets at prices that are far above their intrinsic values [9]. According to Kraussl et al. [9], there are two constraints for the detection of bubbles: (1) high volumes must be traded; (2) prices must be above their fundamental values. The analysis of energy price bubbles is suitable for understanding the energy price sensitivity, see Liu and Lee [4]. Identifying bubbles in energy prices is essential for appropriate policies to be formulated to manage the consequences when the bubbles burst, see Li et al. [10]; they also reported that price bubbles of the energy market may have an impact on the economy. Several studies examined the behavior of energy prices and reported that there exist bubble components in the prices due to several reasons [11,12]. These studies employed new bubble tests developed by Phillips et al. [13], and Phillips et al. [14] that can detect bubbles by determining whether prices become explosive.
It is crucial to examine the existence of bubbles in energy prices due to the fluctuation of energy prices experienced in the last three decades. Recently, Su et al. [5] found that oil prices were shown to have multiple explosive bubbles; further, Fantazzini [15] reported five episodes of oil prices: 1985–1986, 1990–1991, 1997–1998, 2001, 2008, and a negative bubble in 2014–2015. Baumeister and Kilian [16] reported that the oil price decline in the last months of 2014 could not be explained using supply and demand; therefore, Fantazzini [15] suggested that there was a negative financial bubble that decreased oil prices beyond the level justified by economic fundamentals.
Accordingly, “the price slide in 1985–1986 has some similarities with the fall in 2014/2015, because it followed a period of strong expansion of oil supply from non-OPEC countries and Saudi-Arabia decided to increase production and to stop defending prices”, see Fantazzini [15].
Between 2001 and mid-2008, the nominal spot price of West Texas Intermediate (WTI) crude oil rose from 20 US $/bbl to 147 US $/bbl, but then collapsed to 30 US $/bbl in late 2008, and finally increased to 100 US $/bbl in late 2011 [6]. Further, the Brent and WTI prices of crude oil fell by 60% between June 2014 and January 2015 [15]. This shows that energy prices fluctuate over time, and hence, possible bubbles can be detected.
The contribution of our paper is that we consider a long dataset (1987–2020) of both Brent crude oil price and WTI crude oil price but also the Commodity (fuel) energy index (CEI). Most studies use data from Brent and WTI crude oil prices; we also consider CEI for comparison reasons. CEI includes Crude oil (petroleum), Natural Gas, and Coal Price Indices. In addition, we have a clear picture of energy price bubbles as our dataset considers all periods (booms and crashes) for a long period. To the best of our knowledge, this is the first empirical study that tests for energy bubbles and compares results from WTI and Brent with CEI. We prove that the CEI follows Brent crude oil in the way that they provide similar bubble periods and that Brent is recognized as a crude oil benchmark. The results of this research can lead to useful energy policy conclusions; investors and financial analysts should incorporate it into their analysis and strategy.
The structure of the work is as follows: The next section (Section 2) presents the literature on the subject of the research. The following (Section 3) is a description of the market and data used, while Section 4 describes the research methodology. Section 5 presents the empirical results and concludes the paper.
2. Literature Review
Numerous studies underline the importance of crude oil for the global economy. It becomes clear that oil is a commodity that requires a synthetic analysis that cannot be understood unless one looks through a multi-dimensional field of view.
The relationship between oil prices and economic activity has been investigated by a number of researchers [17,18,19]. Apart from the general conclusion that oil prices influence the economy, a part of the literature has been shaping around the concept that the relationship between oil prices and the economy changed after the 1980s [20]. Sornette et al. [11] analyzed oil prices before and after the July 2008 peak, concluding that geopolitical events have participated in raising the level of uncertainty and speculation, leading to oil prices increasingly decoupled from the fundamental valuation (the hallmark of a bubble). Specifically, they distinguished a period before and after the peak of 3 July 2008, supporting the hypothesis that oil price run-up, when expressed in any of the major currencies, has been amplified by speculative behavior. A pre-crash analysis illustrates a distinct change in the oil price dynamics in USD occurring between the last quarter of 2005 and the first quarter of 2006, beyond which we can observe a net acceleration. A post-crash analysis does not support the causal impact of geopolitical uncertainty on oil prices.
Many authors, motivated by repeated price spikes and crashes after 1995, investigate whether the heavily financialized market of crude oil has been driven by speculative bubbles [21]. Financialization means integration between commodity markets and financial markets in terms of correlation, the convergence of risk-adjusted returns, and spillover volatility between markets [22,23]. Recent papers show evidence of how financialization has contributed to commodities and equities increased cross-market correlations during market downturns (see [22] for more details). The financialization of the commodity market has led to an unprecedented increase in commodity investment [23].
Although there are no satisfactory definitions for bubbles accepted by finance communities, Brunnermeier [24] defines bubbles as an economic phenomenon with dramatic asset price increases, followed by a collapse. In the same line, the term “bubble” refers to a situation in which excessive expectations of future price increases cause prices to be temporarily elevated without justification from fundamentals [11].
Research on the effect of higher oil prices and their contribution to the global economic recession has been influenced by Hamilton’s [25] connection of oil price shocks with the recession in the US. Spiking oil prices in 1990, 2007, and 2015 cannot be explained according to the microeconomic fundamentals. Zhang and Wang [26] find that the supply and demand fundamentals in the crude oil market are difficult to explain the price movement of crude oil prices. Numerous empirical studies end at the same conclusion [6,10].
Su et al. [5] investigate the existence of multiple bubbles in the crude oil price. In order to do that, they used WTI crude oil spot prices, obtained from the US Energy Information Administration database, for a period from January 1986 to April 2016 by employing two methods of sup Augmented Dickey–Fuller (ADF), and generalized sup ADF [13,14] to locate the possible presence of bubbles in WTI crude oil. Results indicate explosive bubbles during 1986–2016 in the WTI oil market in 1990, 2005, 2006, 2008, and 2015.
Fantazzini [15] found a negative bubble in crude oil prices in 2014–2015, which decreased them beyond the level justified by economic fundamentals. He employed two sets of bubble detection strategies—test for financial bubbles and log-periodic power law models (LPPL) for negative financial bubble detection—analyzing the daily nominal and real WTI and Brent oil prices from January 2013 to April 2015. He concluded that the oil price experienced a statistically significant negative financial bubble in the last months of 2014 and the beginning of 2015.
Zhang and Yao [3] used data of crude oil, diesel, and gasoline markets for the period November 2001 to December 2015 to examine dynamic bubbles of oil prices and predict their crash time. They found that oil price bubbles existed from November 2001 to July 2008. They argued that crude oil and diesel prices were significantly driven by bubbles, whereas gasoline prices were mainly driven by fundamentals.
Lammerding et al. [6] introduced two Marcov-regimes into the state-space representation in order to distinguish between two distinct phases in the bubbles process. Two main reference types of oil were analyzed, spot prices of WTI from 1983 to 2011, and spot prices of Brent crude oil from 1989 to 2011. Results indicated robust evidence for the existence of speculative bubbles in oil price dynamics. They reported at least two bubble periods in the oil market between the end of 2004 and mid-2008 and between mid-2008 and April 2011.
Furthermore, Galyfianakis et al. [27] indicated the existence of a tranquil and crisis regime in the energy market. They employed a two Markov-regimes switching model in order to distinguish between stable and explosive phases by analyzing monthly spot prices for WTI crude oil and four refining products, i.e., unleaded gasoline, diesel, jet kerosene, and heating oil, for the period 2005–2015. Conclusions implied that two distinct regimes of both stages were quite persistent, with two maim recession episodes in regime 1 (crisis regime), with the first episode taking place in the second half of 2014 and the second in the second half of 2018.
Narayan and Narayan [28] showed, using a time-series regression model, that the time-varying bubble existence in energy prices helped explain the speed of energy price adjustments. For this, they used data such as energy prices (spot and futures prices of Brent, Natural Gas and Coal), and macroeconomic variables (MSCI world price index, Moody’s Commodity price index, 3-month T-bill rate, and the US-British Pound exchange rate), for the period from September 1989 to August 2012.
Further, Li et al. [10] detected possible speculative bubbles in natural gas of three key regional markets, the European Union, Asia, and the United States, taking monthly data from January 1996 to June 2017 driven to the conclusion that Europe has relatively fewer bubbles compared with the other two regions, but the bubble exists for a long time. Note that the dynamics of the natural gas market may affect economic activity [29].
Liu and Lee [4] applied a newly nonlinear bubble detection method to examine energy price bubbles using data from 1970–2014. They considered monthly and weekly prices from oil, gasoline, and coal and found that the last bubble of the coal and oil price markets ended in 2008, whereas the last bubble of the gasoline markets ended in 2011 during this period [4]. They suggested that the market speculation crisis could be caused by energy-price bubbles.
Zhang et al. [8] showed that more explosive bubbles existed in Japan and European gas prices than in the US prices over the period 1982–2017. They argued that “hub-based pricing mechanism can better reflect fundamental values in the gas markets and thus is less subject to speculations.”
Caspi et al. [30] used monthly WTI crude oil price series for the period 1876–2014. They suggested the presence of multiple periods of explosivity in both the real price and the price supply ratio of oil. In particular, the supply ratio indicated that prices were significantly above their past stationary levels with respect to supply even well before then, between 2005 and 2006 [30].
Pavlidis et al. [7] employed market expectations of future oil prices to detect bubbles in the crude oil market for the period 1990–2013. Using two alternative measures of expectations, they did not find any evidence of speculative bubbles. They concluded that fundamental factors were the key drivers of the price of crude oil.
Sharma and Escobari [1] tested for price bubbles in three energy sector indices (crude oil, heating oil, and natural gas) and five energy sector spot prices (West Texas Intermediate (WTI), Brent, heating oil, natural gas, and jet fuel. They found explosive behavior in all of the energy series.
Further, Perifanis [31] detected several WTI prices’ bubble periods using both the PWY and PSY tests. He found that the PWY detected the period of explosion in 2008 and none after 2005. Perifanis [31] suggested the following recent bubble periods, among others: May 2008–July 2008 (PWY test); July 1979–July 198, August 2005–September 2005, April 2006–August 2006, October 2007–August 2008 (PSY test).
3. Market and Data Description
During the 1980s, oil prices remained relatively low and generally stable. They were strongly established by imposed price and production targets, mainly by OPEC. The year 1983 marks the introduction by the NYMEX of crude oil futures contract trading [32]. The financialization of the oil future markets allowed speculation to become a major determinant in the spot price of crude oil [18]. Since then, oil prices became more erratic and volatile [33].
In the mid-1990s, Iraq invaded Kuwait. Crude oil prices rose, and price volatility was increasing. The Gulf war increased the perceived price uncertainty for the global economy. Additionally, the Asian financial crisis of 1997 and the sub-prime crisis of 2008 lead to furious price fluctuations and bubbles [5,10].
Since the 2000′s, oil has become a more significant indicator in the economic and financial domain and has experienced drastic fluctuations. Therefore, we can observe a rise in oil prices from 2001 to the mid-2008 and from 2009 to 2011, while a sharp drop occurred between June 2014 and January 2015. Brent and WTI prices of crude oil fell 60%, but only a part could be accounted for as a result of lower demand [16,34].
From 2001 to 2008, we can diagnose three major episodes, recognized as “bubbles.” First, the new ICT economy (internet-communication-technology), second, the real estate surge peaking in the US in the mid-2006, and third, the subprime NIV (new instrument vehicle) boom by 2007 [11]. All of them contributed to an economic expansion and a rising demand for oil. Hamilton [21] noted that the 2007–2008 increase in oil prices was caused by demand factors rather than by supply disruption. At the same time, reductions in supply accounted for only a small change in oil prices [19].
From 2009 to 2011, a strong recovery to global oil demand combined with the slower growth in supply pushed oil prices above 100 USD per barrel again in 2010. From mid-2010 to mid-2014, oil prices were broadly stable. Geopolitical tensions in Libya in 2011, the western embargo imposed on Iranian oil exports from 2012, the ISIS invasion of northern Iraq, and, lastly, the Ukraine-Russia conflict in February 2014 keep oil prices above 100 USD.
Between mid-2014 and early-2016, oil prices faced one of the largest declines since WWII. Both WTI and Brent calculated a cumulative decrease of more than 70%. Oil demand shocks and slowing demand for commodities seemed to play a more important role rather than both shale revolution with large increases in US oil production and increasing crude oil production of OPEC. Hamilton [35] argues that only two-fifths of the fall in oil prices during 2014 was due to weak global demand, while Kim [35] concludes that for the first period of oil price decline, 2008–2009, real demand production seemed to play the most prominent role while for the period 2014–2016 some supply factors, like US shale oil production, combined with real and speculative demand played the most important role.
The coronavirus pandemic, started in Asia at the end of 2019 and spread rapidly all over the world, has major implications for global economies and commodity markets. Energy demand in Q1 2020 experienced an average of 25% decline for countries in full lockdown because of the covid-19 pandemic. Oil demand was hit, falling down nearly 5% in the first quarter of 2020; see the International Energy Agency (IEA). Additionally, the disagreement between Russia and Saudi Arabia in early March 2020 led crude oil prices to hit a major slump. Oil prices dropped from 60 USD to 30 USD [36].
Data Description
Our data cover a long period, from 1987 to 2020 for crude oil prices, and from 1990 to 2020 for the CEI. The data include the 1990 Iraq’s invasion of Kuwait and its aftermath, the Iraq war of 2002–2003, the financialization of oil futures markets since 2003, the Libyan crisis in 2011, the Arab spring, the oil embargo to Iran in 2012, the financial crisis of 2008, as well as the price fluctuations of 2020 associated with the pandemic COVID-19 crisis. The sources of our data were the Federal Reserve Economic Data (FRED) and the IMF. Figure 1, Figure 2 and Figure 3 show that the prices (Figure 1 and Figure 2) and index (Figure 3) are very close. Brent is produced in the North Sea and WTI in the US. However, they generally move together or very closely; Caro et al. [37] show that the Brent-WTI market is strongly globalized. Note that price movements over time for crudes are broadly consistent with changes in demand and supply. Price differences are possible (e.g., in 2011) due to several reasons such as the geography of where the oil is produced, political and economic conditions in the regions where the oil is sold, among others. Caro et al. [37] give more details on how Brent is driving the oil price formation. They mention several factors, which differentiate Brent from other crude oils, including its representative quality standard, the proximity of the North Sea to an important region of oil consumption, and the main refining centers of Europe and the USA, stable and favorable fiscal regulation, a solid legal regime and relatively low political risk in the United Kingdom, as well as the status of Brent crude, which has been driven by the diverse ownership of production, see [37]. Nonlinear dynamics of crude oil markets are examined by Uddin et al. [38]; also, the issue of oil price stability is further discussed by Bekiros et al. [39].
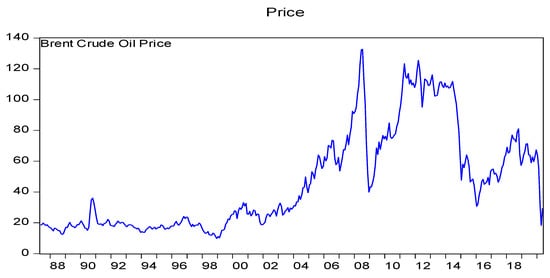
Figure 1.
Plot of Brent crude oil price per barrel.
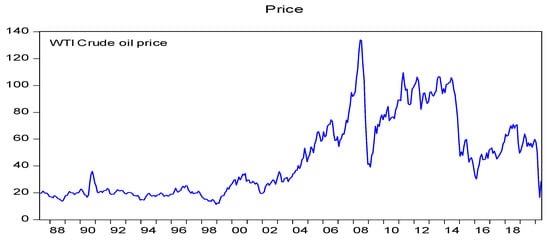
Figure 2.
Plot of West Texas Intermediate (WTI) Crude oil price per barrel.
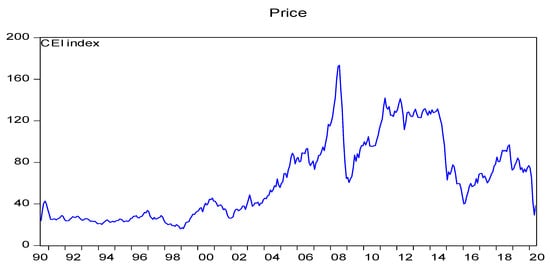
Figure 3.
Plot of commodity (fuel) energy index (CEI).
4. Methodology
Following Phillips et al. [13], hereafter PWY, Phillips et al. [14], hereafter PSY, and Caspi et al. [30], we test for bubbles in energy prices using the more recent methodology. We followed recent papers, which employed similar approaches to detect evidence of explosiveness in the data.
Accordingly, PWY and PSY tests use a right-tail variation of the augmented Dickey-Fuller unit root test; the null hypothesis is of a unit root and the alternative is of a mildly explosive process. PWY and PSY show that using recursive and rolling tests results in higher power in the detection of bubbles, compared to standard tests on the whole sample. In this study, we reported the more recent PWY supremum ADF (SADF) test; the results from PSY generalized SADF (GSADF) test were also available from the authors (GSADF results are not reported here).
Bubble detection tests were proposed by Phillips et al. [13] and Phillips et al. [14]. They were based on recursive and rolling ADF unit root tests (see Appendix A); they used a right-tail variation of the augmented Dickey–Fuller unit root test under the null hypothesis of a unit root and the alternative of a mildly explosive process. In this study, we tested for the existence of bubbles by applying the PWY supremum ADF (SADF) test using the Rtadf (right-tail augmented Dickey-Fuller) add-in of EViews 10 (IHS Global Inc., Irvine CA, USA) under a Monte Carlo simulation; we performed a Monte Carlo simulation under the assumption of Gaussian innovations [30,40,41].
The SADF test, suggested by PWY, was based on recursive calculations of the ADF statistics with a fixed starting point and an expanding window [30,42]. Caspi [42] explained the estimation procedure as follows: The first observation in the sample was set as the starting point of the estimation window, r1, i.e., r1 = 0. Next, the endpoint of the initial estimation window, r2, was set according to some choice of minimal window size, r0, such that the initial window size was rw = r2. Finally, the regression was recursively estimated while incrementing the window size, r2 ꞓ [r0, 1], one observation at a time. Each estimation yielded an ADF statistic denoted as ADFr2. Note that in the last step, the estimation will be based on the whole sample (i.e., r2 = 1 and the statistic will be ADF1). The SADF statistic was defined as the supremum value of the ADFr2 sequence for r2 ꞓ [r0, 1]: SADF(r0) = sup r2 ꞓ [r0, 1]{ADFr2}. For more details on the SADF test, see Perifanis [31]. He reported that “The SADF test is conducted by the repeated application of the ADF test for each r2 ꞓ [r0, 1]” [30,31,42].
5. Results and Conclusion
Table 1 and Table 2 present the SADF results for the Brent crude oil price and WTI crude oil price, respectively. In addition, Table 3 presents the SADF results for the CEI. Figure 4, Figure 5 and Figure 6 are the SADF outputs for Brent, WTI, and CEI, respectively. These figures include the price series (in green), the ADFr2 statistic sequence (in blue), and the corresponding 95% critical values sequence (in red).

Table 1.
Supremum Augmented Dickey–Fuller (SADF) results for Brent Crude oil price.
Table 2.
Supremum Augmented Dickey–Fuller (SADF) results for WTI Crude Oil price.
Table 3.
Supremum Augmented Dickey–Fuller (SADF) results for CEI.
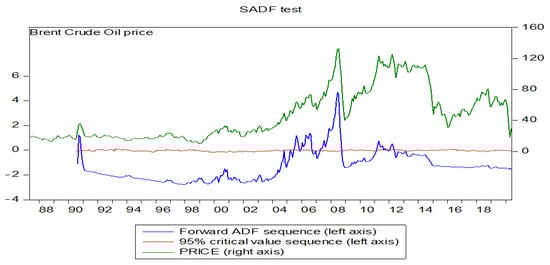
Figure 4.
SADF output for Brent crude oil price.
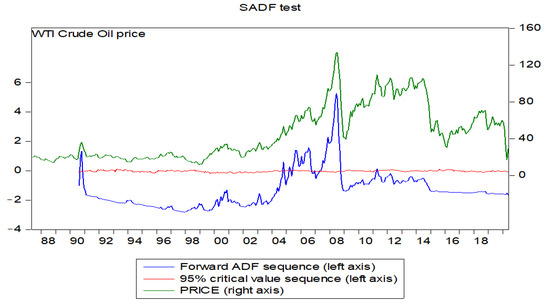
Figure 5.
SADF output for WTI crude oil price.
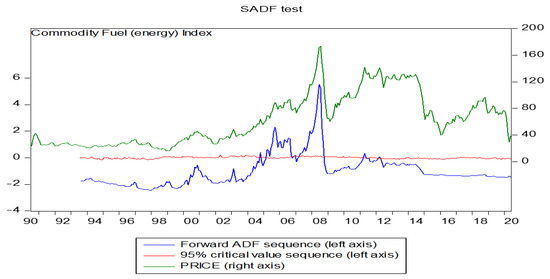
Figure 6.
SADF output for CEI.
First, we reported and compared the SDF results for crude oil prices, as in Table 1:
The test identified four bubble periods for Brent crude oil price: 1990:09–1990:10, 2005:03–2006:08, 2007:04–2008:09, 2011:03–2012:04.
The test identified three bubble periods for WTI crude oil price: 1990:09–1990:10, 2005:03–2006:09, 2007:06–2008:09.
Therefore, when we compared the SADF results for the crudes, we found that Brent showed more bubble periods compared to WTI. These results were in line with similar papers such as Gronwald [43], Fantazzini [15], and Perifanis [31].
Finally, for a robustness check, we applied the SADF test to identify possible bubble periods in CEI (Table 3). We reported the following periods for CEI (our sample covers the period 1990–2020): 2005:03–2006:09, 2007:03–2008:09, 2011:03–2011:04, 2012:03. Hence, the CEI follows Brent crude oil, i.e., our analysis suggested that they provided similar bubble periods. This is a very important result for policymakers. Even though both WTI and Brent are two globally recognized oil benchmarks, we proved that Brent is the main benchmark as given by the OPEC. The OPEC also considers Brent as the oil price benchmark due to the fact that Brent accounts for around two-thirds of internationally traded crude oil. Our results are in line with the findings of Caro et al. [37], who suggested that Brent drives the Brent-WTI price structure. They show that the Brent–WTI price spread follows a long memory process. The results of this research can lead to useful energy policy conclusions; investors should choose appropriate long-term investments in the energy market. They should consider Brent as the benchmark price; also, financial managers should incorporate it into their analysis and forecasts. Finally, increased market volatility underlines the importance of risk management using derivatives. Further research should focus on energy financialization in order to avoid future bubbles. This is highly important due to the fact that the structure of the energy market itself and market players has significantly changed during recent years.
Author Contributions
C.F. contributed to the idea of the paper, designed the econometric models, analyzed the data, drafted and revised the article. G.G. contributed to the idea of the paper, collected the data, and revised the manuscript. All authors have read and agreed to the published version of the manuscript.
Funding
This research received no external funding.
Conflicts of Interest
The authors declare no conflict of interest.
Appendix A. The ADF Test
We can test for the existence of bubbles by applying the well-known ADF test. Following Kurozumi [40] and Monschang and Wilfling [41], the SADF test for explosiveness is following the ADF statistics, for a time series , of the form:
where k is the transient lag-order, Δ denotes the first-difference operator, and . We test the unit-root null hypothesis, i.e., θ = 1, against the alternative of explosiveness, i.e., θ > 1.
References
- Sharma, S.; Escobari, D. Identifying price bubble periods in the energy sector. Energy Econ. 2018, 69, 418–429. [Google Scholar]
- Ahmad, W.; Prakash, R.; Uddin, G.S.; Chahal, R.J.K.; Rahman, L.; Dutta, A. On the intraday dynamics of oil price and exchange rate: What can we learn from China and India? Energy Econ. 2020, 91, 104871. [Google Scholar] [CrossRef]
- Zhang, Y.J.; Yao, T. Interpreting the movement of oil prices: Driven by fundamentals or bubbles? Econ. Model. 2016, 55, 226–240. [Google Scholar]
- Liu, T.-Y.; Lee, C.-C. Will the energy price bubble burst? Energy 2018, 150, 276–288. [Google Scholar] [CrossRef]
- Su, C.-W.; Li, Z.-Z.; Chang, H.-L.; Lobonţ, O.-R. When Will Occur the Crude Oil Bubbles? Energy Policy 2017, 102, 1–6. [Google Scholar] [CrossRef]
- Lammerding, M.; Stephan, P.M.; Trede, M.; Wilfling, B. Speculative bubbles in recent oil price dynamics: Evidence from a Bayesian Markov-switching state-space approach. Energy Econ. 2013, 36, 491–502. [Google Scholar] [CrossRef]
- Pavlidis, E.; Paya, I.; Peel, D.A. Using Market Expectations to Test for Speculative Bubbles in the Crude Oil Market. J. Money Crédit. Bank. 2018, 50, 833–856. [Google Scholar] [CrossRef]
- Zhang, D.; Wang, T.; Shi, X.; Lui, J. Is hub-based pricing a better choice than oil indexation for natural gas? Evidence from a multiple bubble test. Energy Econ. 2018, 76, 495–503. [Google Scholar]
- Kraussl, R.L.; Tussl, R.; Lehnert, T.; Martelin, N. Is there a bubble in the art market? J. Empir. Financ. 2016, 35, 99–109. [Google Scholar]
- Li, Y.; Chevallier, J.; Wei, Y.; Li, J. Identifying price bubbles in the US, European and Asia natural gas market. Evidence from a GSADF test approach. Energy Econ. 2020, 87, 104740. [Google Scholar]
- Sornette, D.; Woodard, R.; Zhou, W.-X. The 2006–2008 oil bubble: Evidence of speculation, and prediction. Phys. A Stat. Mech. Appl. 2009, 388, 1571–1576. [Google Scholar] [CrossRef]
- Wu, G.; Zhang, Y.J. Does China factor matter? An econometric analysis of international crude oil prices. Energy Policy 2014, 72, 78–86. [Google Scholar] [CrossRef]
- Philips, P.C.B.; Shi, S.; Yu, J. Testing for Multiple Bubbles; Singapore Management University: Singapore, 2011; Unpublished manuscript. [Google Scholar]
- Philips, P.C.B.; Shi, S.; Yu, J. Testing for multiple bubbles: Historical episodes of exuberance and collapse in the S & P 500, Singapore Management University: Singapore, 2013; Unpublished manuscript.
- Fantazzini, D. The oil price crash in the 2014/15: Was there a (negative) financial bubble? Energy Policy 2016, 96, 383–396. [Google Scholar] [CrossRef]
- Baumeister, C.; Kilian, L. Understanding the Decline in the Price of Oil Since June 2014. SSRN Electron. J. 2015, 3, 121–158. [Google Scholar] [CrossRef]
- Hamilton, J.D. Understanding crude oil prices. Natl. Bur. Econ. Res. 2008, 30, 179–206. [Google Scholar]
- Kilian, L.; Fattouh, B.; Mahadeva, L. The Role of Speculation in Oil Markets: What Have We Learned So Far? Energy J. 2013, 34. [Google Scholar] [CrossRef]
- Kilian, L. Exogenous Oil Supply Shocks: How Big Are They and How Much Do They Matter for the U.S. Economy? Rev. Econ. Stat. 2008, 90, 216–240. [Google Scholar] [CrossRef]
- Lescaroux, F.; Mignon, V. On the influence of oil prices on economic activity and other macroeconomic and financial variables. OPEC Energy Rev. 2008, 32, 343–380. [Google Scholar] [CrossRef]
- Hamilton, J.D. Causes and consequences of the oil stock of 2007–2008. Brook. Pap. Econ. Act. 2009, 40, 215–261. [Google Scholar]
- Boako, G.; Alagidede, I.P.; Sjo, B.; Uddin, G.S. Commodities price cycles and their interdependence with equity markets. Energy Econ. 2020, 91, 104884. [Google Scholar] [CrossRef]
- Uddin, G.S.; Rahman, L.; Hedström, A.; Ahmed, A. Cross-quantilogram-based correlation and dependence between renewable energy stock and other asset classes. Energy Econ. 2019, 80, 743–759. [Google Scholar] [CrossRef]
- Brunnermeier, M.K. Bubbles Banking Crisis Palgrave; Macmillan: Basingstoke, UK, 2016; pp. 28–36. [Google Scholar]
- Hamilton, J.D. Oil and the Macroeconomy since World War II. J. Political Econ. 1983, 91, 228–248. [Google Scholar] [CrossRef]
- Zhang, Y.J.; Wang, J. Exploring the WTI crude oil price bubble process using a Markov regime switching model. Physica A: Statistical Mechanics and its Applications. Elsevier 2015, 421, 377–387. [Google Scholar]
- Galyfianakis, G.; Drimbetas, E.; Sariannidis, N. Modeling Energy Prices with a Markov–Switching dynamic regression model. Bull. Appl. Econ. 2016, 31, 11–28. [Google Scholar]
- Narayan, S.; Narayan, P.K. Estimating the speed of adjustment to target levels: The case of energy prices. Energy Econ. 2017, 62, 419–427. [Google Scholar] [CrossRef]
- Rubaszek, M.; Uddin, G.S. The role of underground storage in the dynamics of the US natural gas market: A threshold model analysis. Energy Econ. 2020, 87, 104713. [Google Scholar] [CrossRef]
- Caspi, I.; Katzke, N.; Cupta, R. Date stamping historical periods of the oil price explosivity: 1876–2014. Energy Econ. 2018, 70, 582–587. [Google Scholar] [CrossRef]
- Perifanis, T. Detecting West Texas Intermediate (WTI) Prices’ Bubble Periods. Energies 2019, 12, 2649. [Google Scholar] [CrossRef]
- Plourde, A.; Watkins, G. Crude oil prices between 1985 and 1994: How volatile in relation to other commodities? Resour. Energy Econ. 1998, 20, 245–262. [Google Scholar] [CrossRef]
- Sariannidis, N.; Galyfianakis, G.; Drimpetas, E. The Effect of Financial and Macroeconomic Factors on the Oil Market. Int. J. Energy Econ. Policy 2015, 5, 1084–1091. [Google Scholar]
- Hamilton, J.D. Oil Prices as an Indicator of Global Economic Conditions Econbrowser. December 2014. Available online: https://econbrowser.com/archives/2014/12/oil-prices-as-an-indicator-of-global-economic-conditions (accessed on 1 July 2020).
- Kim, M.S. Impacts of supply and demand factors on declining oil prices. Energy 2018, 155, 1059–1065. [Google Scholar] [CrossRef]
- Naifar, N.; Shahzad, S.J.H.; Hammoudeh, S. Dynamic nonlinear impacts of oil price returns and financial uncertainties on credit risks of oil-exporting countries. Energy Econ. 2020, 88, 104747. [Google Scholar] [CrossRef]
- Caro, J.; Golpe, A.A.; Iglesias, J.; Vides, J.C.; Golpe, A.A. A new way of measuring the WTI-Brent spread. Globalization, shock persistence and common trends. Energy Econ. 2020, 85, 104546. [Google Scholar] [CrossRef]
- Uddin, G.S.; Gençay, R.; Bekiros, S.; Sahamkhadam, M. Enhancing the predictability of crude oil markets with hybrid wavelet approaches. Econ. Lett. 2019, 182, 50–54. [Google Scholar] [CrossRef]
- Bekiros, S.; Hernandez, J.A.; Uddin, G.S.; Muzaffar, A.T. On the Predictability of Crude Oil Market: A Hybrid Multi-scale wavelet approach. J. Forecast. 2020, 39, 599–614. [Google Scholar] [CrossRef]
- Kurozumi, E. Asymptotic properties of bubble monitoring tests. Econ. Rev. 2019, 39, 510–538. [Google Scholar] [CrossRef]
- Monschang, V.; Wilfling, B. Sup-ADF-style bubble-detection methods under test. Empir. Econ. 2020, 1–28. [Google Scholar] [CrossRef]
- Caspi, I. Rtadf: Testing for Bubbles with EViews. J. Stat. Softw. 2017, 81, 1–16. [Google Scholar] [CrossRef]
- Gronwald, M. Explosive oil prices. Energy Econ. 2016, 60, 1–5. [Google Scholar] [CrossRef]
Publisher’s Note: MDPI stays neutral with regard to jurisdictional claims in published maps and institutional affiliations. |
© 2020 by the authors. Licensee MDPI, Basel, Switzerland. This article is an open access article distributed under the terms and conditions of the Creative Commons Attribution (CC BY) license (http://creativecommons.org/licenses/by/4.0/).