Article

Femtosecond Laser-Induced Surface Modification of the Electrolyte in Solid Oxide Electrolysis Cells

1
Institute of Thermodynamics, Leibniz University Hannover, Welfengarten 1, 30167 Hannover, Germany
2
Research Center Energy Storage Technologies, Clausthal University of Technology, Am Stollen 19A, 38640 Goslar, Germany
3
Fraunhofer Heinrich Hertz Institute, Am Stollen 19H, 38640 Goslar, Germany
*
Author to whom correspondence should be addressed.
Energies 2020, 13(24), 6562; https://doi.org/10.3390/en13246562
Submission received: 4 November 2020 / Revised: 27 November 2020 / Accepted: 9 December 2020 / Published: 12 December 2020
(This article belongs to the Section A5: Hydrogen Energy)

Abstract

:
Electrolyte-supported solid oxide cells are often used for steam electrolysis. Advantages are high mechanical stability and a low degradation rate. The aim of this proof of concept study was to use a femtosecond laser to process the electrolyte of an electrolyte-supported solid oxide cell and evaluate the effect of this laser treatment on the electrochemical performance. The femtosecond laser treatment induces a macroscopic and a superimposed microscopic structure. It can be proven that the electrolyte remains gas tight and the electrochemical performance increases independently of the laser parameters. The initial area-specific resistance degradation during a constant current measurement of 200 h was reduced from 7.9% for a non-treated reference cell to 3.2% for one of the laser-treated cells. Based on electrochemical impedance measurements, it was found that the high frequency resistance of the laser-treated cells was reduced by up to 20% with respect to the reference cell. The impedance spectra were evaluated by calculating the distribution of relaxation times, and in advance, a novel approach was used to approximate the gas concentration resistance, which was related to the test setup and not to the cell. It was found that the low frequency polarization resistance was increased for the laser-treated cells. In total, the area-specific resistance of the laser-treated cells was reduced by up to 14%.

1. Introduction

The worldwide hydrogen demand is continuously growing. In the last centuries, the increasing demand was mainly caused by the chemical and petrochemical industry [1]. In more recent years, hydrogen has been discussed as a key element for the transition to a more sustainable energy system [2]. Hydrogen could be used as an energy carrier to provide electricity, heat or kinetic energy in transport. Further applications are the use as chemical energy storage for renewable energy sources or as feedstock to transform industrial processes to reduce the greenhouse gas emissions (GHG), e.g., in steel production [3].
Hydrogen can be produced without direct GHG emissions by water electrolysis using renewable electric energy. In comparison with conventional hydrogen production processes such as steam methane reforming (SMR), the total GHG emissions can be reduced by more than 90% [4]. The most relevant electrolysis technologies are alkaline water electrolysis (AEL), proton exchange membrane water electrolysis (PEMEL) and solid oxide water electrolysis (SOEL). AEL and PEMEL are already available in the megawatt class. The capital costs for AEL are the lowest, but PEMEL has advantages in flexibility and efficiency [5]. SOEL is still in the stage of early commercialization. Large-scale availability and long-term durability need further proof. The potential high system efficiency, the ability of reverse operation and the possibility of direct syngas production are main advantages of SOEL.
The benefits in performance are mainly due to the high operating temperature, which leads to fast reaction kinetics. Additionally, the reaction Gibbs energy of the water splitting reaction decreases with increasing temperature, and above the evaporation temperature of water, more enthalpy can be provided by heat due to the increased reaction entropy. The reaction Gibbs energy correlates with the reversible cell voltage, which is given by the Nernst equation.
If no heat needs to be supplied or removed from the cell, the cell voltage is referred to as the thermoneutral cell voltage U th . At lower cell voltages, heat at temperatures above the desired cell temperature needs to be supplied, and at larger cell voltages heat must be removed, typically by the supplied gases. Due to low availability of heat at high temperatures and the low, sensible heat of the supplied gases, the thermoneutral operation (or slightly above) of SOEL is very common at least at the system scale [6]. In this sense, a characteristic comparison parameter is the electric current density at the thermoneutral point j th . The lower the area-specific resistance (ASR) of the cell, the higher the current density j th . The ASR depends on the operation conditions, the cell type and its composition.
Solid oxide electrolysis cells can be classified by the type of ions in the electrolyte and by the support layer of the cell. The most developed and commercially available electrolytes are oxygen ion conductors. Proton conductors and mixed ion conductors are still in the stage of basic research and are only available on a small scale (laboratory produced) [7].
One layer of the cell needs to be functionalized as a supporting layer to maintain mechanical stability. Therefore, the thickness of a single layer is increased, although this leads to a reduced electrochemical performance. The electrolyte or the fuel electrode is typically used as a supporting layer. Fuel electrode-supported cells achieve higher current densities in thermoneutral operation. Current densities of up to 6 A / cm 2 are reported [8], but long-term operation with a sufficiently low degradation rate is mostly reported for current densities below 1 A / cm 2 . At higher current densities the degradation rate increases significantly [9,10]. Mechanisms of degradation are, for example, the depletion of Ni at the fuel electrode/electrolyte interface, parasitic reactions related to the oxygen partial pressure and pore formation in the electrolyte due to the oxidizing atmosphere at the oxygen electrode [11]. Schefold et al. [12] reports 23,000 h operation of an electrolyte-supported cell at a constant current density of 0.9 A / cm 2 with an ASR degradation of 8 m Ω cm 2 / 1000 h . The same authors [13] also report a low degradation rate for a cyclic operation between the thermoneutral voltage and a current density of 0.07 A / cm 2 . The aim is to have a negligible change in the heat balance to maintain the temperature profile in the stack. Thus, the flexibility of a system can be improved by switching off single stacks in the system. In the study of Schefold et al. [13], they used an electrolyte-supported cell with 3 mol% yttrium stabilized zirconia (3YSZ) as the electrolyte, lanthanum strontium cobaltite ferrite (LSCF) as the oxygen electrode (anode) and nickel oxide/gadolinia-doped ceria (NiO/CGO) as the fuel electrode.
To improve the performance of electrolyte-supported cells in particular, the thickness of the electrolyte can be reduced [14], or other electrolyte materials such as scandia/ceria doped zirconia can be used [15]. Besides the continuous development of new electrode materials, an improved structure of the electrode/electrolyte interface is another optimization parameter. A few studies concerning pulsed laser treatment of YSZ electrolytes to increase the cell performance can be found in the literature. Larrea et al. [16] prepared a honeycomb structure on a commercial 8YSZ electrolyte by pulsed nanosecond laser processing and reduced the thickness from originally 150 μ m to 10 μ m at the thinnest positions. The structured electrolyte is prepared as a membrane electrode assembly and characterized in fuel cell mode. Due to the reduced average thickness of the electrolyte, the ASR at a temperature of 750 ° C was reduced by up to 26% compared to the reference cell. In a study of Cebollero et al. [17] the interface of an YSZ electrolyte and an LSM oxygen electrode was patterned by a pulsed nanosecond laser. Additionally, the ceramic suspension of the electrode material was optimized to ensure good contact between the structured electrolyte and the electrode. A comparison between a symmetrical cell with a patterned and flat interface showed a decrease of the polarization resistance of the structured interface by 20%.
Heiroth et al. [18] investigated the ablation characteristics due to pulsed laser treatment for several dopant levels of YSZ substrates in detail. The experiments were performed in the nanosecond and femtosecond pulse duration regimes. For ultra short pulse durations (femtosecond regime) a fundamentally different ablation characteristic was observed. Instead of an exfoliation of micrometer-sized particles, submicrometer particles were ejected from the electrolyte surface.
In this study, two 3YSZ electrolytes were treated by a pulsed femtosecond laser with two sets of laser parameters, and then both of them were prepared as solid oxide cells with NiO/CGO and LSCF electrodes. In comparison to the literature mentioned above, where the aim was to induce macroscopic geometrical changes by laser treatment, this study aimed at structural changes on a smaller scale. Thus, the influences of microscopic surface modifications on the electrochemical performance and initial degradation behavior shall be analyzed. As presented in Figure 1, the electrolyte was treated on the fuel electrode side below a CGO adhesion layer. Femtosecond laser-induced surface modifications have already been used for alkaline water electrolysis [19,20,21] and proton exchange membrane water electrolysis [22]. To the authors’ best knowledge, there is no other publication available describing using this technique to structure an electrochemically active layer of a solid oxide cell (SOC).
The cells were characterized in electrolysis mode under various operation parameters. For comparison, a commercially available Keracell III/3YSZ cell (manufacturer KERAFOL Keramische Folien GmbH and Co. KG (Eschenbach in der Oberpfalz, Germany) from the same material batch was characterized as well. The electrochemical performance was evaluated by constant current measurements, voltage current characteristics and electrochemical impedance spectroscopy (EIS). EIS was evaluated by calculating the distribution of relaxation time.

2. Experimental

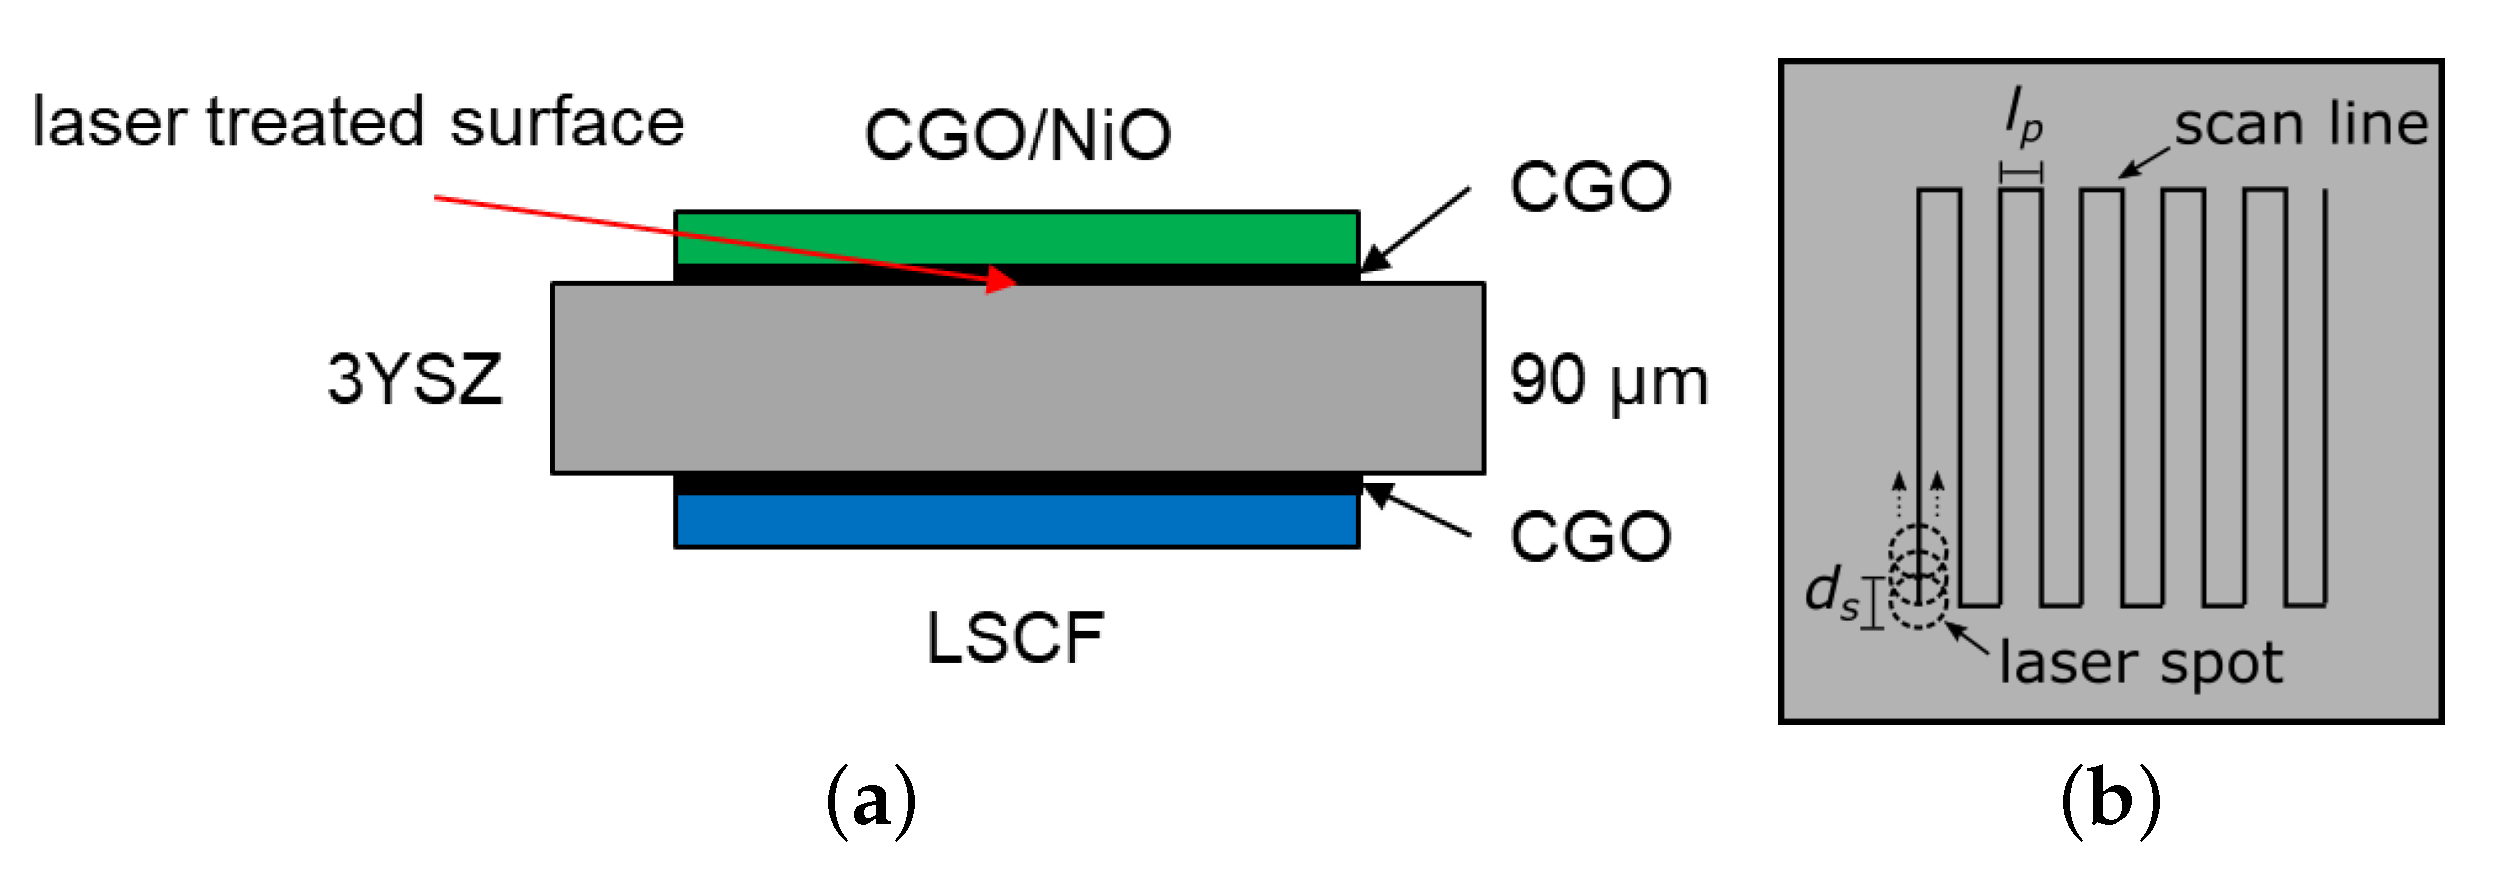
2.1. Femtosecond Laser Treatment

Commercial 50 × 50 mm 2 3YSZ electrolytes with a nominal electrolyte thickness of 90 μ m , supplied by KERAFOL Keramische Folien GmbH and Co. KG (Germany), were used as the base substrate. One substrate was used as the reference and two substrates from the same material batch were treated by the femtosecond laser. The processed area for both substrates waws slightly larger than the area of the subsequently added electrode layer, to ensure that the area below the electrode was entirely processed (see Section 2.3). The boundaries of the substrates were not processed, as they are not relevant for the electrochemical performance. The laser processing was performed with a Mantis seed laser from Coherent Lasersystems and a Spitfire regenerative amplifier from Spectra Physics at a wavelength of 800 nm , a repetition rate of 10 kHz and a pulse length of about 60 fs . The laser beam was focused through a 500 mm lens into a process chamber under continuous air process gas flow at pressures of about 800 mbar . The measured laser spot diameter was about 80 μ m (intensity 1 / e 2 ). Area processing occurs by a meandering scan with a linear scan velocity of 26.7 mm / s corresponding to about 30 pulses per spot on the sample. A schematic illustration of the meandering scan line is presented in Figure 1b. The laser fluency was set to 3.3 J / cm 2 , which was found to be suitable to induce a microscopic structure without producing a visible damage of the thin electrolytes. Two line pitches ( l p ), 20 μ m and 35 μ m , between the parallel meandering lines, were chosen in order to realize different ablation rates and compare the levels of the parameter. The other laser parameters, for example, the process gas and the laser polarization, were not optimized at this point, as the aim of this study was a proof of concept.

2.2. Physical Characterization

In advance of the electrochemical characterization, the effect of femtosecond laser treatment on the electrolyte surface at a microstructural level was investigated using a scanning electron microscope (SEM), Zeiss (EVO 50, MA10). For this purpose, an additional electrolyte sample was treated by the femtosecond laser and sputtered with a 10 nm thick Pt-layer. Furthermore, laser scanning microscopy (LSM) measurements were done using a Keyence VK-X150K/X160K digital microscope and analyzed with the Multi-File-Analyzer software VK-H1XMD. For each measurement, 10×, 20× and 50× objective lenses were used.

2.3. Electrochemical Characterization

KERAFOL Keramische Folien GmbH and Co. KG processed the reference and the femtosecond laser-structured electrolytes to a solid oxide cell. On the structured side of the electrolyte, a NiO/CGO fuel electrode with a screen printed CGO adhesion layer was applied. LSCF was used as an oxygen electrode and CGO as the diffusion barrier layer. The structured cells are from here on called FS20 and FS35 with regard to the applied line pitch, whereas the commercially available reference cell (“Keracell III”) is called REF. The electrode area of all investigated cells was 35 × 35 mm 2 , so this value is used in the following as the active area of the cells.
Electrochemical characterization was carried out in a commercial high temperature solid oxide cell (SOC) test rig (FuelCon Evaluator C1000HT). The cells were mounted in a ceramic cell housing (FuelCon TrueXessory-HT) with a closed fuel and oxygen electrode. Gases were supplied in parallel flow. A nickel (Ni) mesh was used to contact the fuel electrode and a platinum (Pt) mesh contacted the oxygen electrode. Separate platinum wires measured the cell voltage. The cell temperature was measured in the ceramic housing, four millimeters below the oxygen electrode. An electrochemical test system (Solartron Analytical Modulab XM ECS) was used to perform galvanostatic electrochemical impedance spectroscopy. In advance of the characterization, short circuit EIS measurements were conducted to obtain the external high frequency noise in the test rig. The obtained short circuit EIS data were used to correct the collected EIS data. Thus, the presented data were attributed solely to the cells and its electrical contact to the Pt and Ni meshes. The current amplitude was chosen to maintain a maximum voltage amplitude of ± 10 mV . The integration time for each frequency was set to one second or six cycles, and thirteen points per decade were measured. Hydrogen, oxygen and nitrogen were supplied by Linde with a purity level of 5.0. Deionized water was produced by a commercial water treatment system (Merck Millipore Elix Advantage 3) with a conductivity below 0.1 μ S / cm and a silica content below 40 ppb . Steam is generated with an internal electrically heated evaporator.
In advance of the electrochemical characterization, each cell was heated up identically and chemically reduced at 800 ° C . During the heating process, the fuel electrode was flushed with dry nitrogen and the oxygen electrode with synthetic air (21% oxygen/79% nitrogen). After the temperature was equilibrated, the hydrogen concentration at the fuel electrode was gradually increased to reduce nickel oxide to metallic nickel. Every hydrogen concentration step was held constant for several hours until a constant cell voltage was measured. After the hydrogen concentration reached 100%, the characterization was started.
The complete characterization procedure is given in Table 1. At first, each cell was operated under constant current (CC) for 200 h to complete initial structural processes and to stabilize the cell voltage under load. Additionally, this minimizes the degradation-related change of the cell performance during an extended parameter variation. Rapid degradation during the first hundreds of hours of steam electrolysis has been reported elsewhere [14]. The CC operation point was chosen to obtain an average water concentration of 56%, which is equal to the average concentration in an electrolysis cell operating at a water utilization rate of 75% and an initial water concentration of 90%. Before and after the initial CC measurement, an EIS measurement was conducted in open circuit conditions. After this, the operation point was changed and parameter variations of each hydrogen, water and oxygen concentration were conducted. During the parameter variations, only one parameter was changed at a time; therefore, nitrogen was used as the balance gas. At every variation step, an impedance measurement in open circuit conditions was performed. Additionally, EIS was done at different current densities for a designated constant gas composition and a constant water utilization. Finally, the aforementioned parameter variations were repeated for 750 ° C and 850 ° C . Between each operation point, a hold time of at least one hour was implemented to obtain steady state conditions. In total, the characterization procedure of each cell extended over a time period of 520 h.
The quality of the recorded impedance spectra may have been compromised for low frequencies by unsteady behavior of the test rig, especially due to fluctuations in the water supply and evaporation unit. To ensure physically reasonable measurement data for evaluation and post-processing, the recorded EIS were evaluated and checked using the Kramers-Kronig validity test Lin-KK provided by Schönleber et al. [23]. Subsequently, the spectra were evaluated by calculating their distribution of relaxation times (DRT). The main idea of DRT is to distinguish processes which overlap in the frequency-dependent part of an EIS. DRT analysis is used in the literature to investigate different electrochemical systems, such as SOCs [24,25], PEMFCs [26] and batteries [27].
In this study, the open source software of Wan et al. [28] was used to calculate the distribution function γ τ , where τ is the relaxation time. The determination of γ is an intrinsically ill-posed problem, and in the software of Wan et al. γ is calculated by a ridge regression (Tikhonov regularization). Therefore, a regularization parameter λ needs to be given. A proper selection of λ is crucial to avoiding misinterpretation of the DRT results. If the regularization parameter is too large, the resolution in the time domain is too low and the physical processes cannot be separated. On the other hand, a very small regularization parameter leads to oscillations, and nonphysical processes are identified. In the literature, different methods are used to obtain a suitable regularization parameter. In this study, the cross-validation test from Saccoccio et al. [29] in combination with the variance test of Schlüter et al. [30,31] was used to optimize the regularization parameter. This combination is presented and tested for synthetic and measured EIS for batteries [31].

3. Results and Discussion

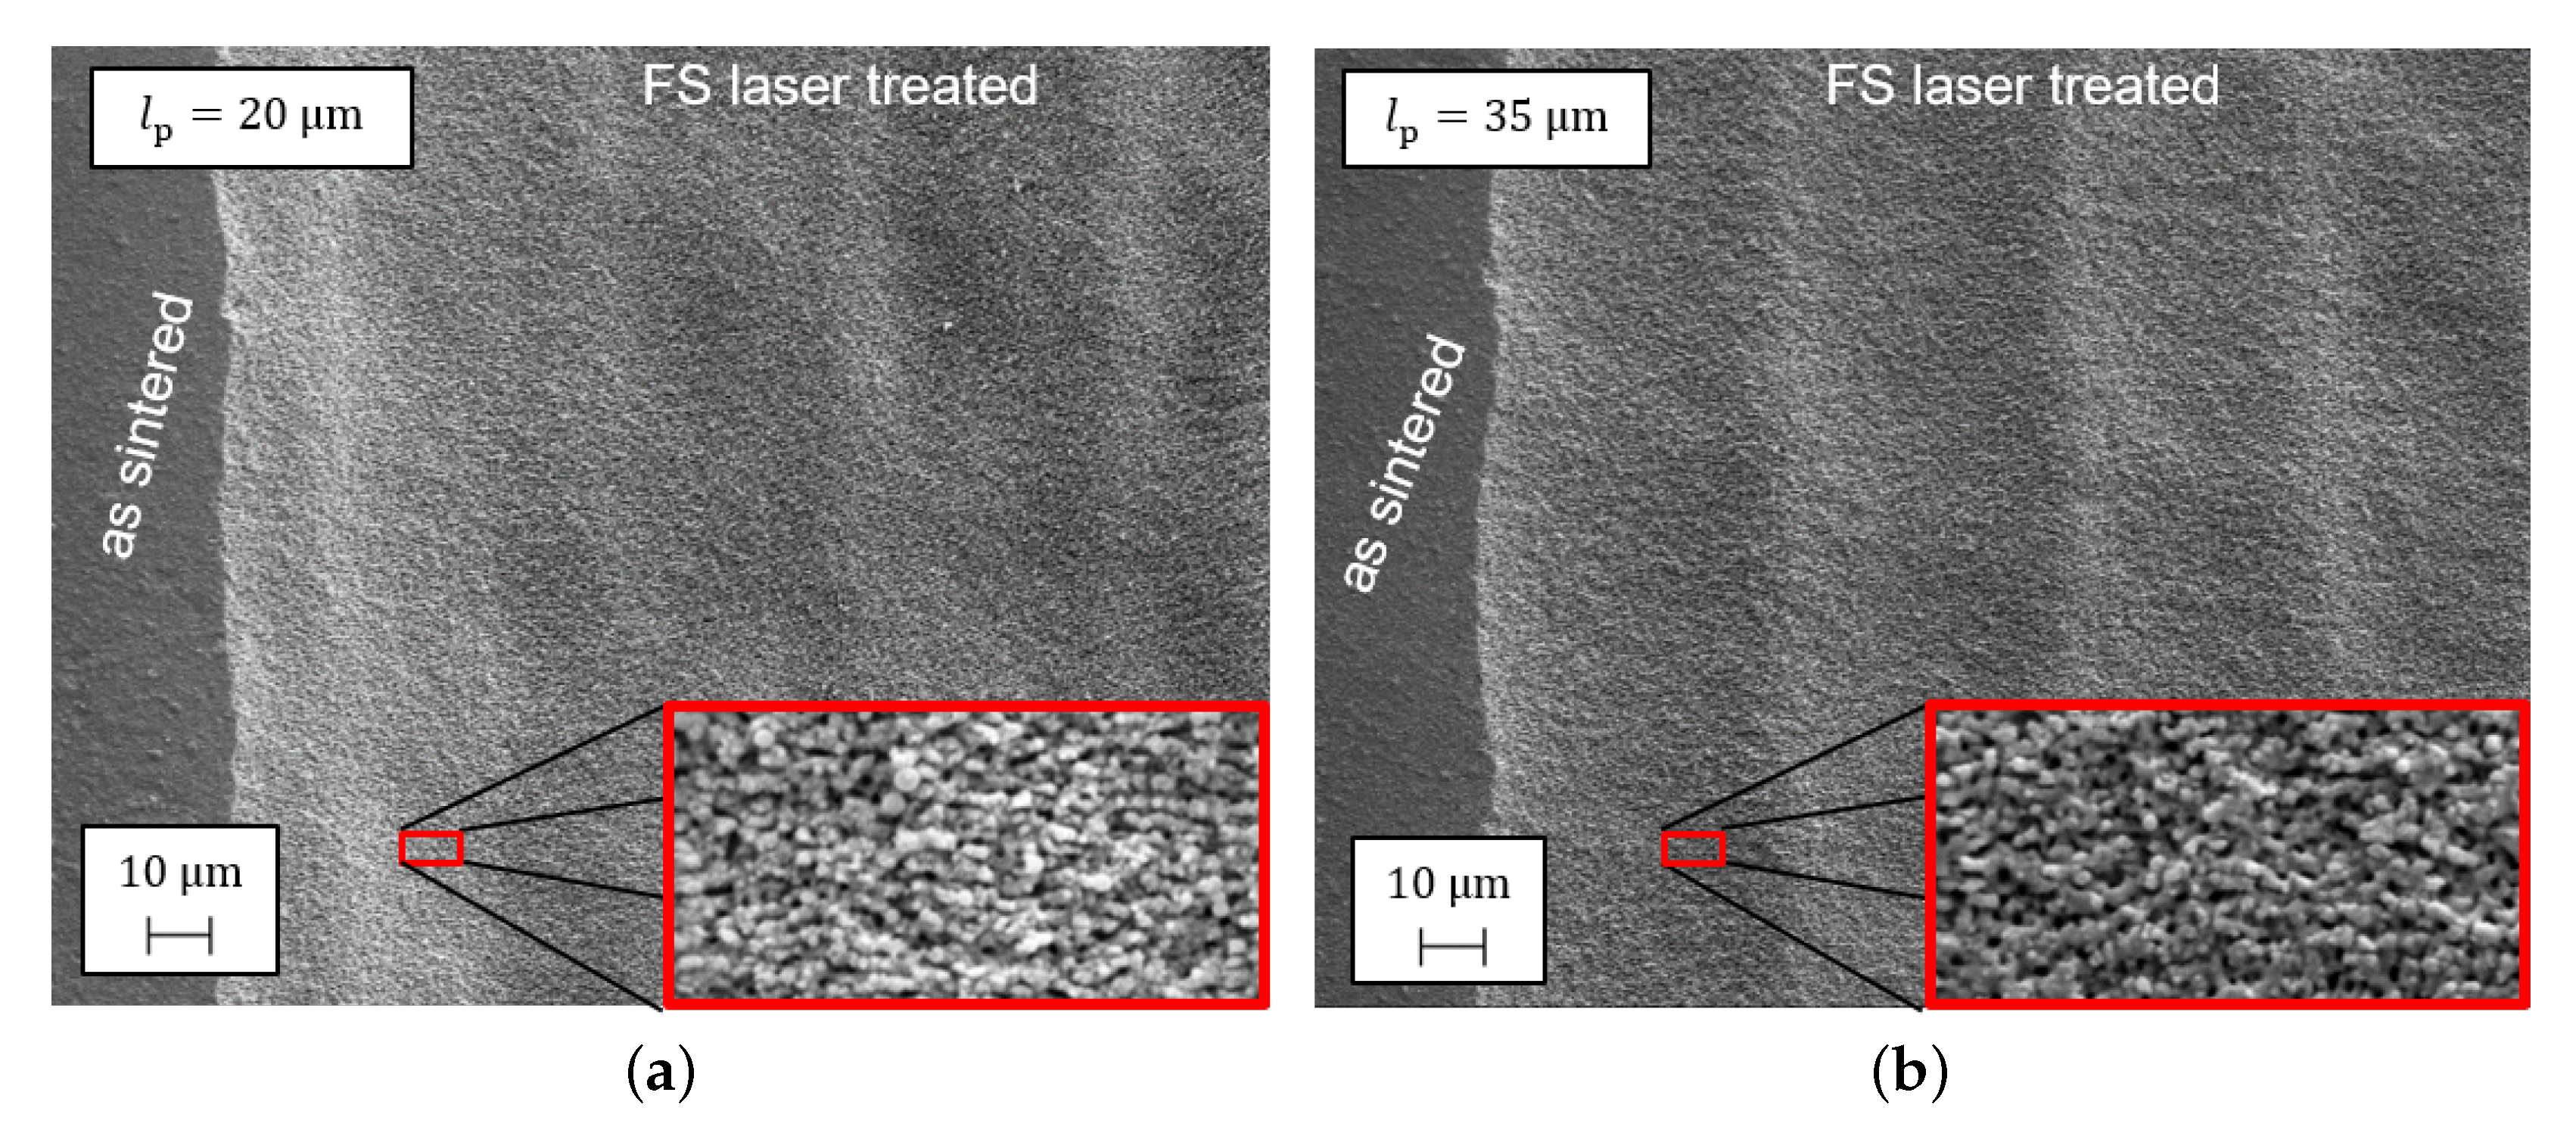
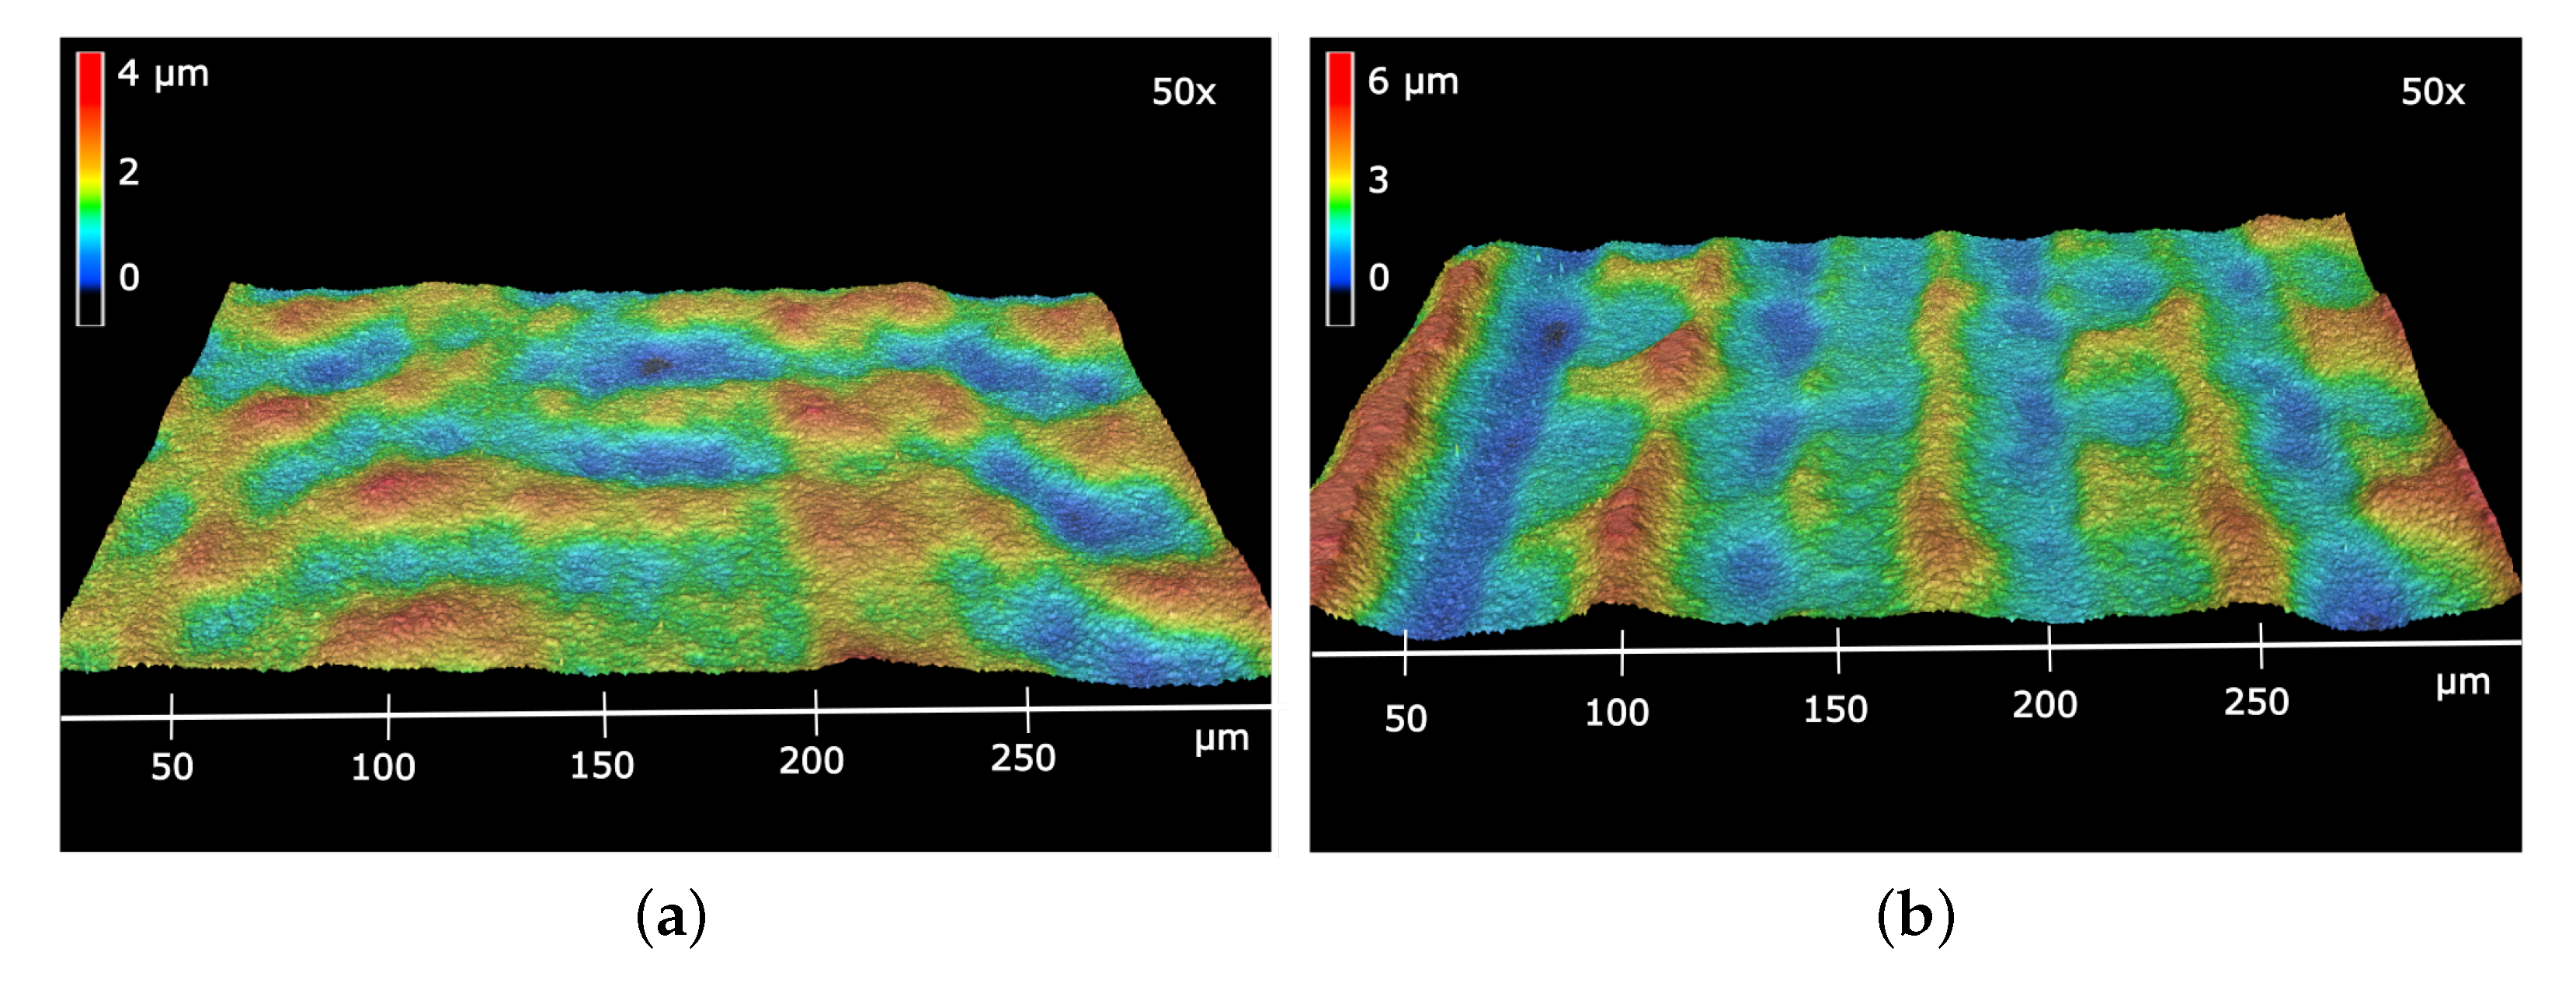
3.1. Physical Characterization

The laser processing of the two modified cells differs by the line pitch of the parallel meandering lines. The more narrow the line pitch is, the more homogeneous the intensity distribution in the laser process and the higher the accumulated intensity per area. In order to evaluate the quality of the laser processing, the SEM images for both line pitches are shown in Figure 2. The SEM image was taken at the boundary of the treated surface. It can be seen that a macroscopic structure was induced due to the laser treatment. By comparing both line pitches (Figure 2a,b), it becomes apparent that the more narrow the line pitch, the less pronounced the macroscopic structure. Additionally, a significant increase in the submicrometer surface roughness is visible due to the ablation of single particles. This microstructure is visible for both line pitches.
A first approximation of the topological height differences due to the laser processing can be obtained by the evaluation of the laser scanning microscopy (LSM) measurements. In Figure 3 the LSM measurements of the structured electrolytes are presented with 50× objective lenses. Differences in height are indicated by a change in color. In case of the more narrow line pitch of 20 μ m (Figure 3a), a height difference of up to 4 μ m was obtained, and the height distribution shows no regular pattern. In Figure 3b the meandering scan lines and the line pitch of 35 μ m are clearly visible as wave-like changes in altitude perpendicular to the laser scan. A height difference of up to 6 μ m was obtained.
The irregular pattern in Figure 3a and the inhomogeneous shape of the scan lines in Figure 3b could be due to small micro-vibrations from the scanning translation axis and its transmission to the mounted lens. Considering the 1 / e 2 intensity profile and the fact that a material ablation needs a critical ablation energy [18], even slight uncertainties of the laser-scanning path can have a significant impact on the material ablation. The narrower the line pitch is, the more laser pulses are overlapped at an individual spot, and the irregularities are more pronounced.
Additional LSM measurements taken at the outer border region of laser treatment reveal that the base level of the macroscopic pattern is lower than the level of the untreated region. The step height was found to be approximately 10.5 μ m for the line pitch of 20 μ m and 6.5 μ m for the line pitch of 35 μ m . The overall thickness for both electrolytes was reduced due to the overlapping laser spots (spot diameter 80 μ m ) of the meandering lines, and thus a material ablation on the entire surface. Assuming a constant height offset of the baseline and by balancing peaks and troughs, a decrease of the average electrolyte thickness of 11.7% (FS20) and 7.2% (FS35) can be roughly estimated.

3.2. Electrochemical Characterization

After the heating up process and the initial reduction of the fuel electrode, the gas tightness of each cell was checked by measuring the open circuit voltage (OCV) for dry hydrogen at the fuel electrode and dry synthetic air at the oxygen electrode ( 0.5 Nl / min ). The obtained OCV for all cells was slightly above 1.2 V ; thus, the gas tightness was sufficient and not affected by the femtosecond laser treatment.

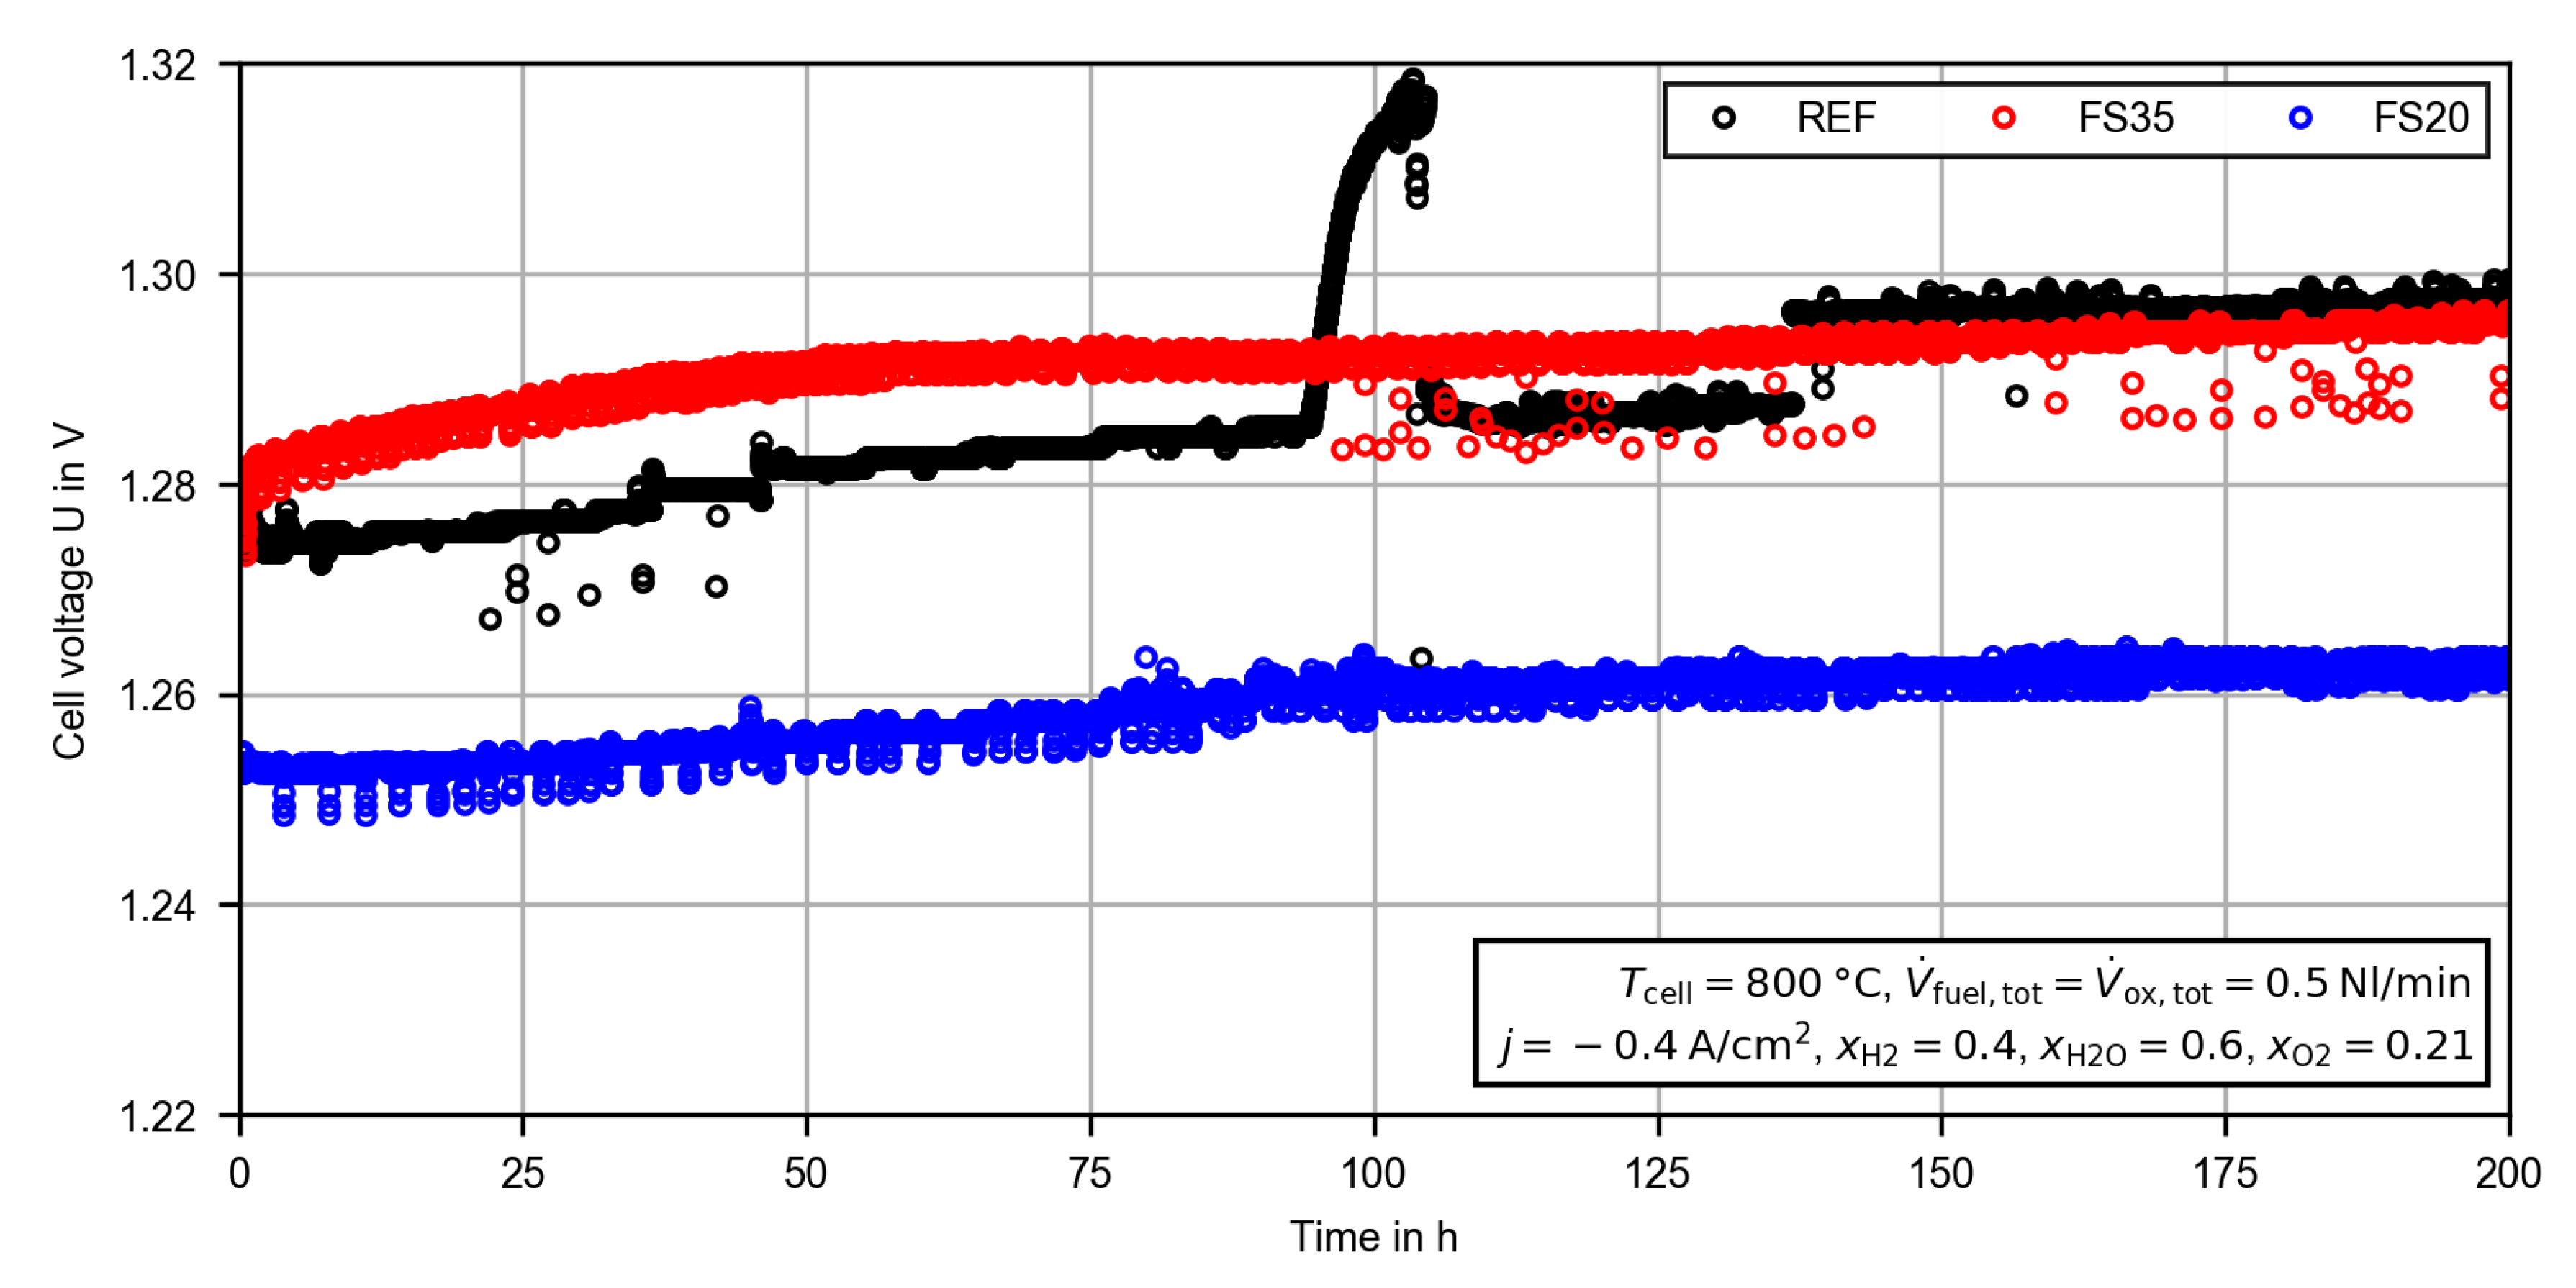
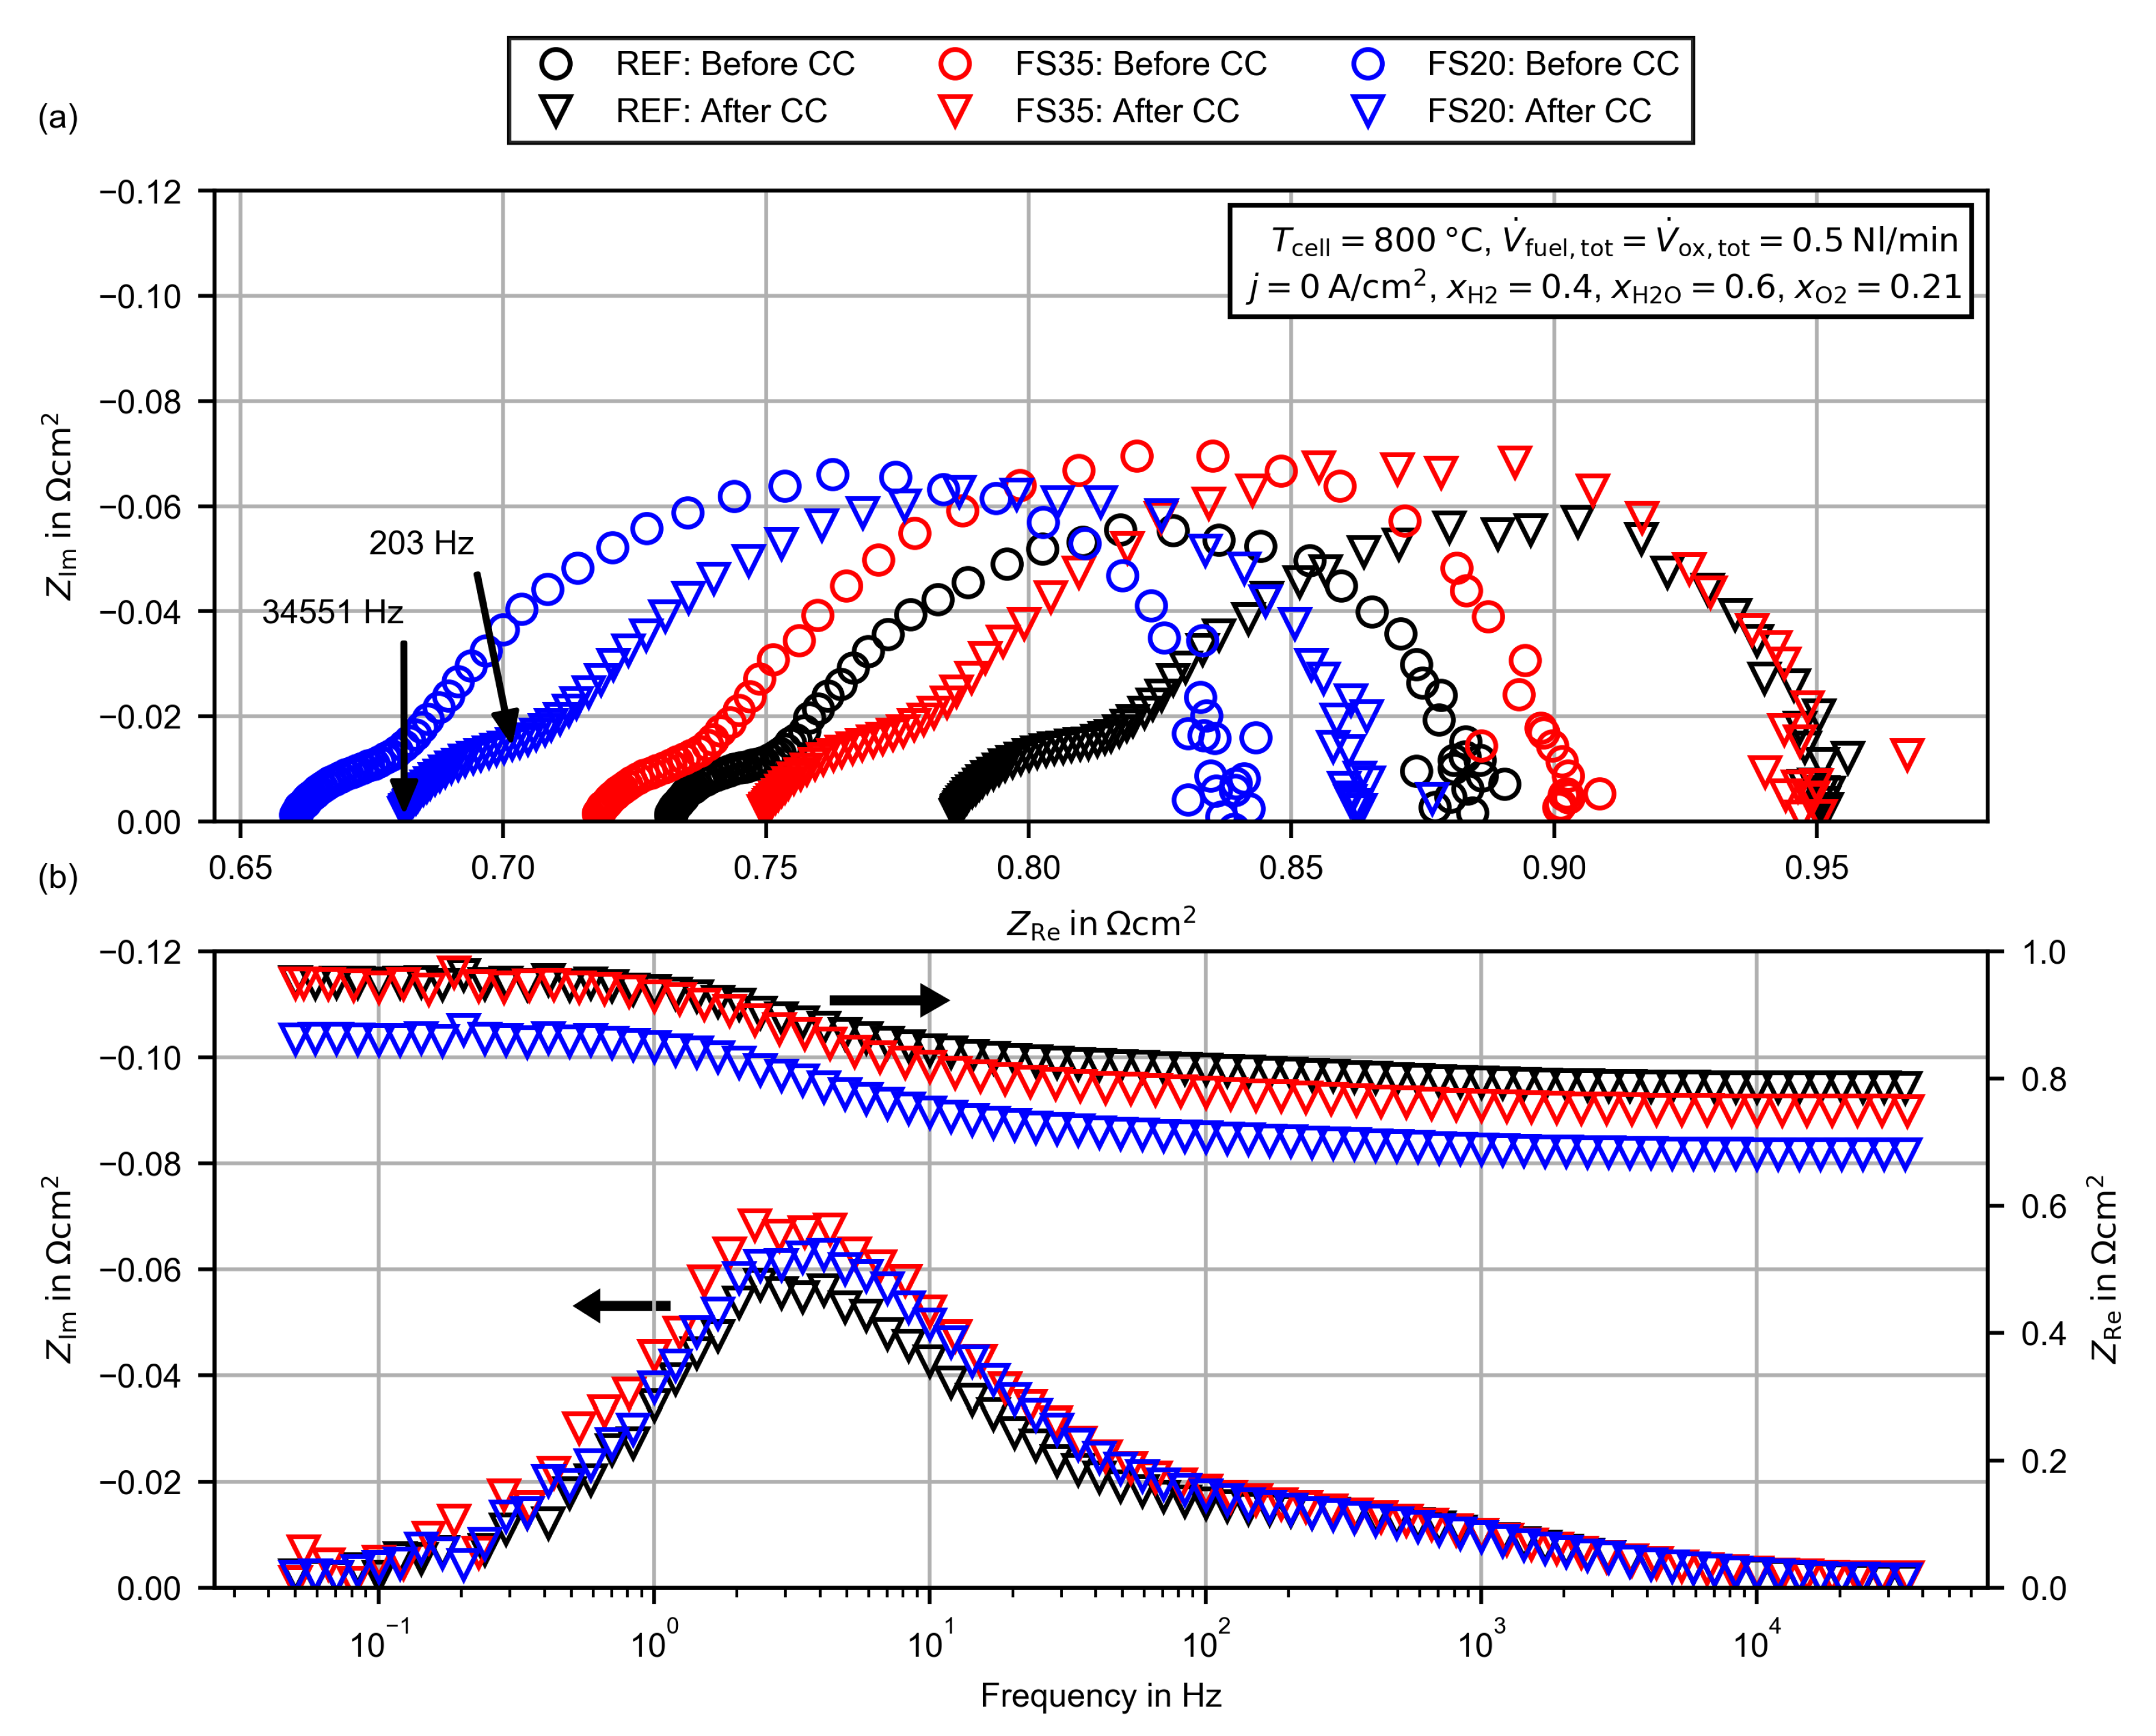
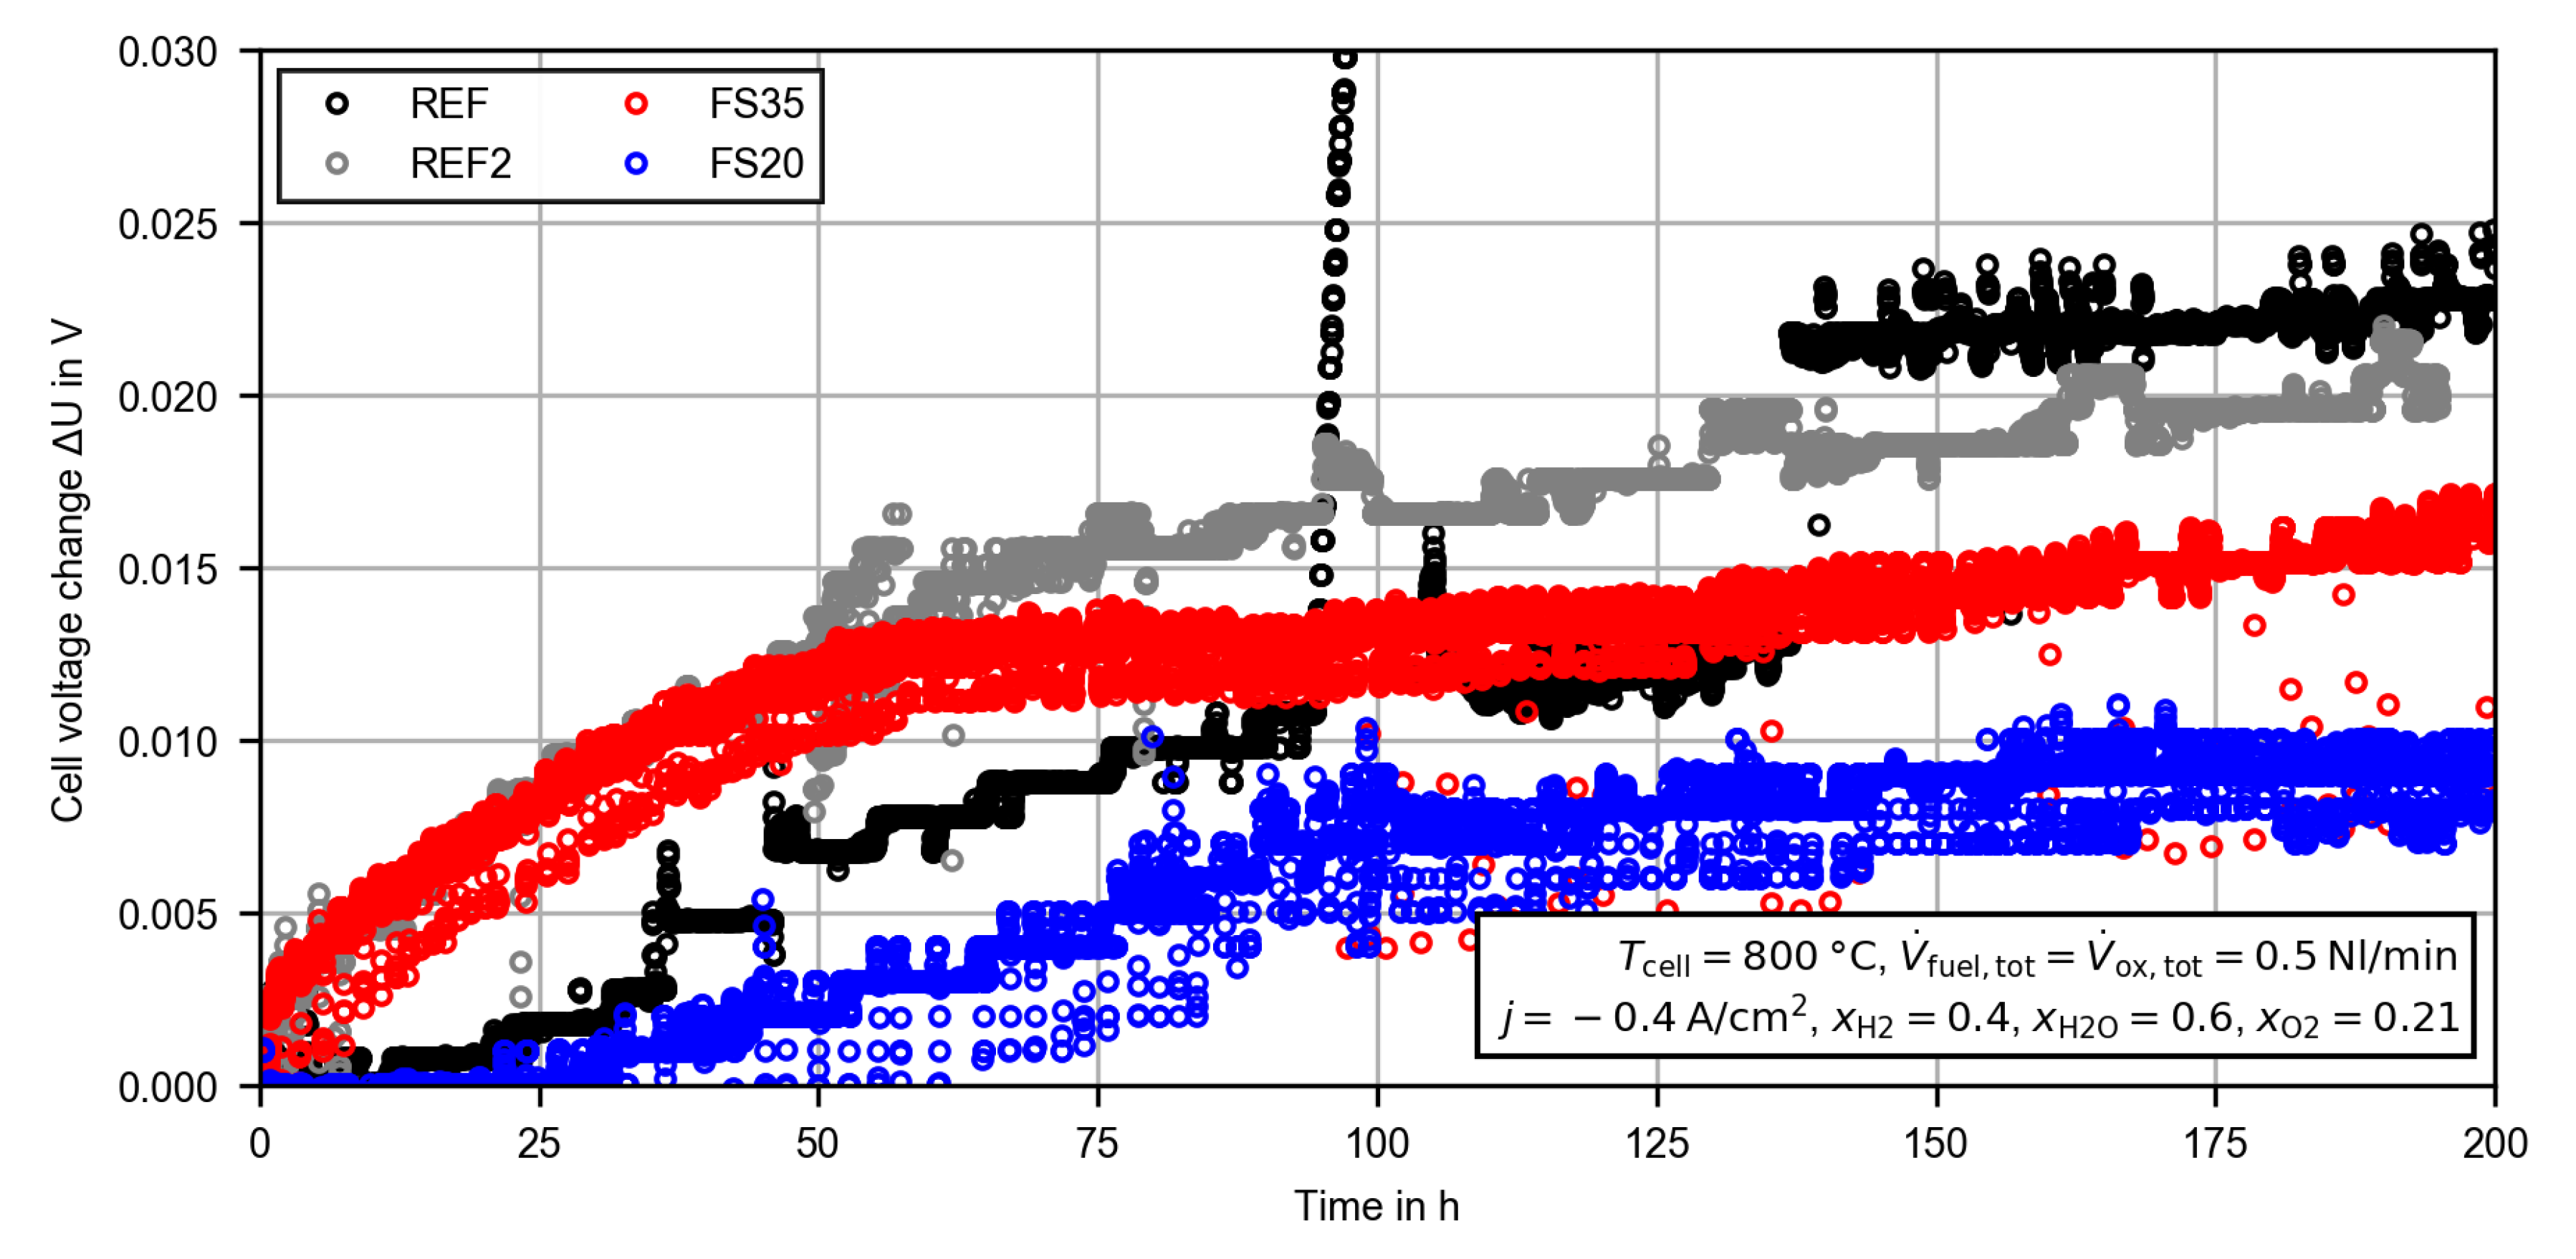
3.2.1. Constant Current Measurement

During the CC measurements, the voltage of all cells increased continuously (see Figure 4). The observed noise in the measured cell voltage was due to small fluctuations in the fuel electrode steam supply. With the exception of some voltage drops of up to 10 mV , the noise was below ±1.5 mV. The steep rise in the cell voltage of the reference cell (REF) at approximately 100 h was due to a failure in the oxygen electrode nitrogen supply. For a period of 10 h the cell was operated with an increased oxygen partial pressure (up to x O 2 = 1 ), which led to a rising reversible cell voltage. After the error had been fixed, the cell voltage returned to the previous value. Thus, the performance of the cell was not affected. At 137 h another steep rise in the cell voltage of the reference cell was observed. During this very steep rise, no external process parameters, such as the gas pressures, the temperatures, the gas flows and the current density, were changing. As is explained in the following, the deviation between the cells before and after the constant current measurement are also confirmed by electrochemical impedance spectroscopy. Thus, an error in the voltage measurement or data acquisition was also not very likely. The most reasonable explanation is a spontaneous increase in a resistance within the cell or in the contact to the current collector meshes ( + 1.7 m Ω ). In order to prove the validity and repeatability, the initial voltage degradation of the reference cell was compared with previous measurements given the same operating conditions and the same test setup. The cell used here (called REF2) was completely equal to the reference cell, but from another production/material batch. The voltage degradation during the first 200 h of operation is presented in the appendix (see Figure A1). Despite the different course of the voltage increase, the overall voltage change during the measurement is very similar ( + 23 mV to + 21 mV ). Thus, the jump of the voltage is probably related to a sudden local increasing resistance within the cell, but after the initial voltage stabilization phase it is still suitable to compare the different cells.
During the entire measurement process, the cell voltage of the FS20 cell was the lowest. As the largest decrease in the average thickness of the electrolyte was observed for cell FS20, the reduced cell voltage was comprehensible (see Section 3.1). However, despite the observed reduced average electrolyte thickness of cell FS35, the cell voltage was very similar to the reference cell, especially at the end of the CC measurement. Thus, multiple effects seem to be superimposed. In order to quantify these effects, the EIS measurements were evaluated.
Figure 5 presents the measured EIS (at open circuit conditions) before and after the CC measurement for all cells. The operating conditions are given in the figure and in Table 1. For all EIS measurements, the high frequency resistance (HFR), in the following interpreted as the ohmic resistance of the cell and its electrical contact to the meshes, is given at approximately 35 kHz . The low frequency resistance, interpreted as the area-specific resistance (ASR) at the measured operating point, is given at 0.05 Hz . To ensure the measurement quality, the Kramers–Kronig validity test was carried out for all presented spectra. In Figure A2 in the appendix, the residual between a representative EIS measurement of the reference cell before CC operation and the corresponding Kramers–Kronig-ideal fitted spectrum is shown. Apart from several low frequency outliers with absolute values smaller than 1.0%, presumably caused by a fluctuation in fuel electrode steam supply, the residuals remained sufficiently low for interpretation and post-processing.
As can be seen in Figure 5a and Table 2, before the CC measurements, the lowest ASR was observed for the femtosecond laser-treated cell FS20 and the highest for the femtosecond laser-treated cell FS35. After the CC measurement, the ASR of cell FS20 was 10% below the ASR of the cell REF which is almost equal to the ASR of cell FS35. During the 200 h CC measurement, the ASR of cell REF waws increased by 7.9%, of cell FS35 by 5.5% and of cell FS20 by 3.2%. For both treated cells, the ASR degradation was reduced in comparison to the reference cell. Thus, the laser processing seems to have a positive impact on the initial voltage stabilization phase. This is also visible in the voltage change during the constant current measurement (see Figure A1 in the Appendix A). In order to evaluate the long-term degradation behavior, measurements of at least 1000 h are necessary, but these are, unfortunately, not in the scope of this proof of concept study.
The HFR of both femtosecond laser-treated cells was reduced in comparison to the reference cell. After the CC measurement, the HFR of cell FS20 was reduced by 13.4% and that of cell FS35 by 4.7%. The polarization resistances of cell FS20 (+10.1%) and FS35 (+21.1%) were increased in comparison to the reference cell. This was unexpected, as the laser treatment was below the adhesion layer, and thus the active area of the cells was influenced only slightly by the macroscopic structure. As can be seen in Figure 5b, the imaginary part of the impedance begins to deviate between the cells below a frequency of approximately 200 Hz . As presented in Figure 5a, the impedance at 200 Hz is located at the transition between the high and low frequency arcs in the Nyquist plot. A more detailed discussion of the deviations and a possible explanation for the increased polarization resistance of the laser-treated cells are given in Section 3.2.4.

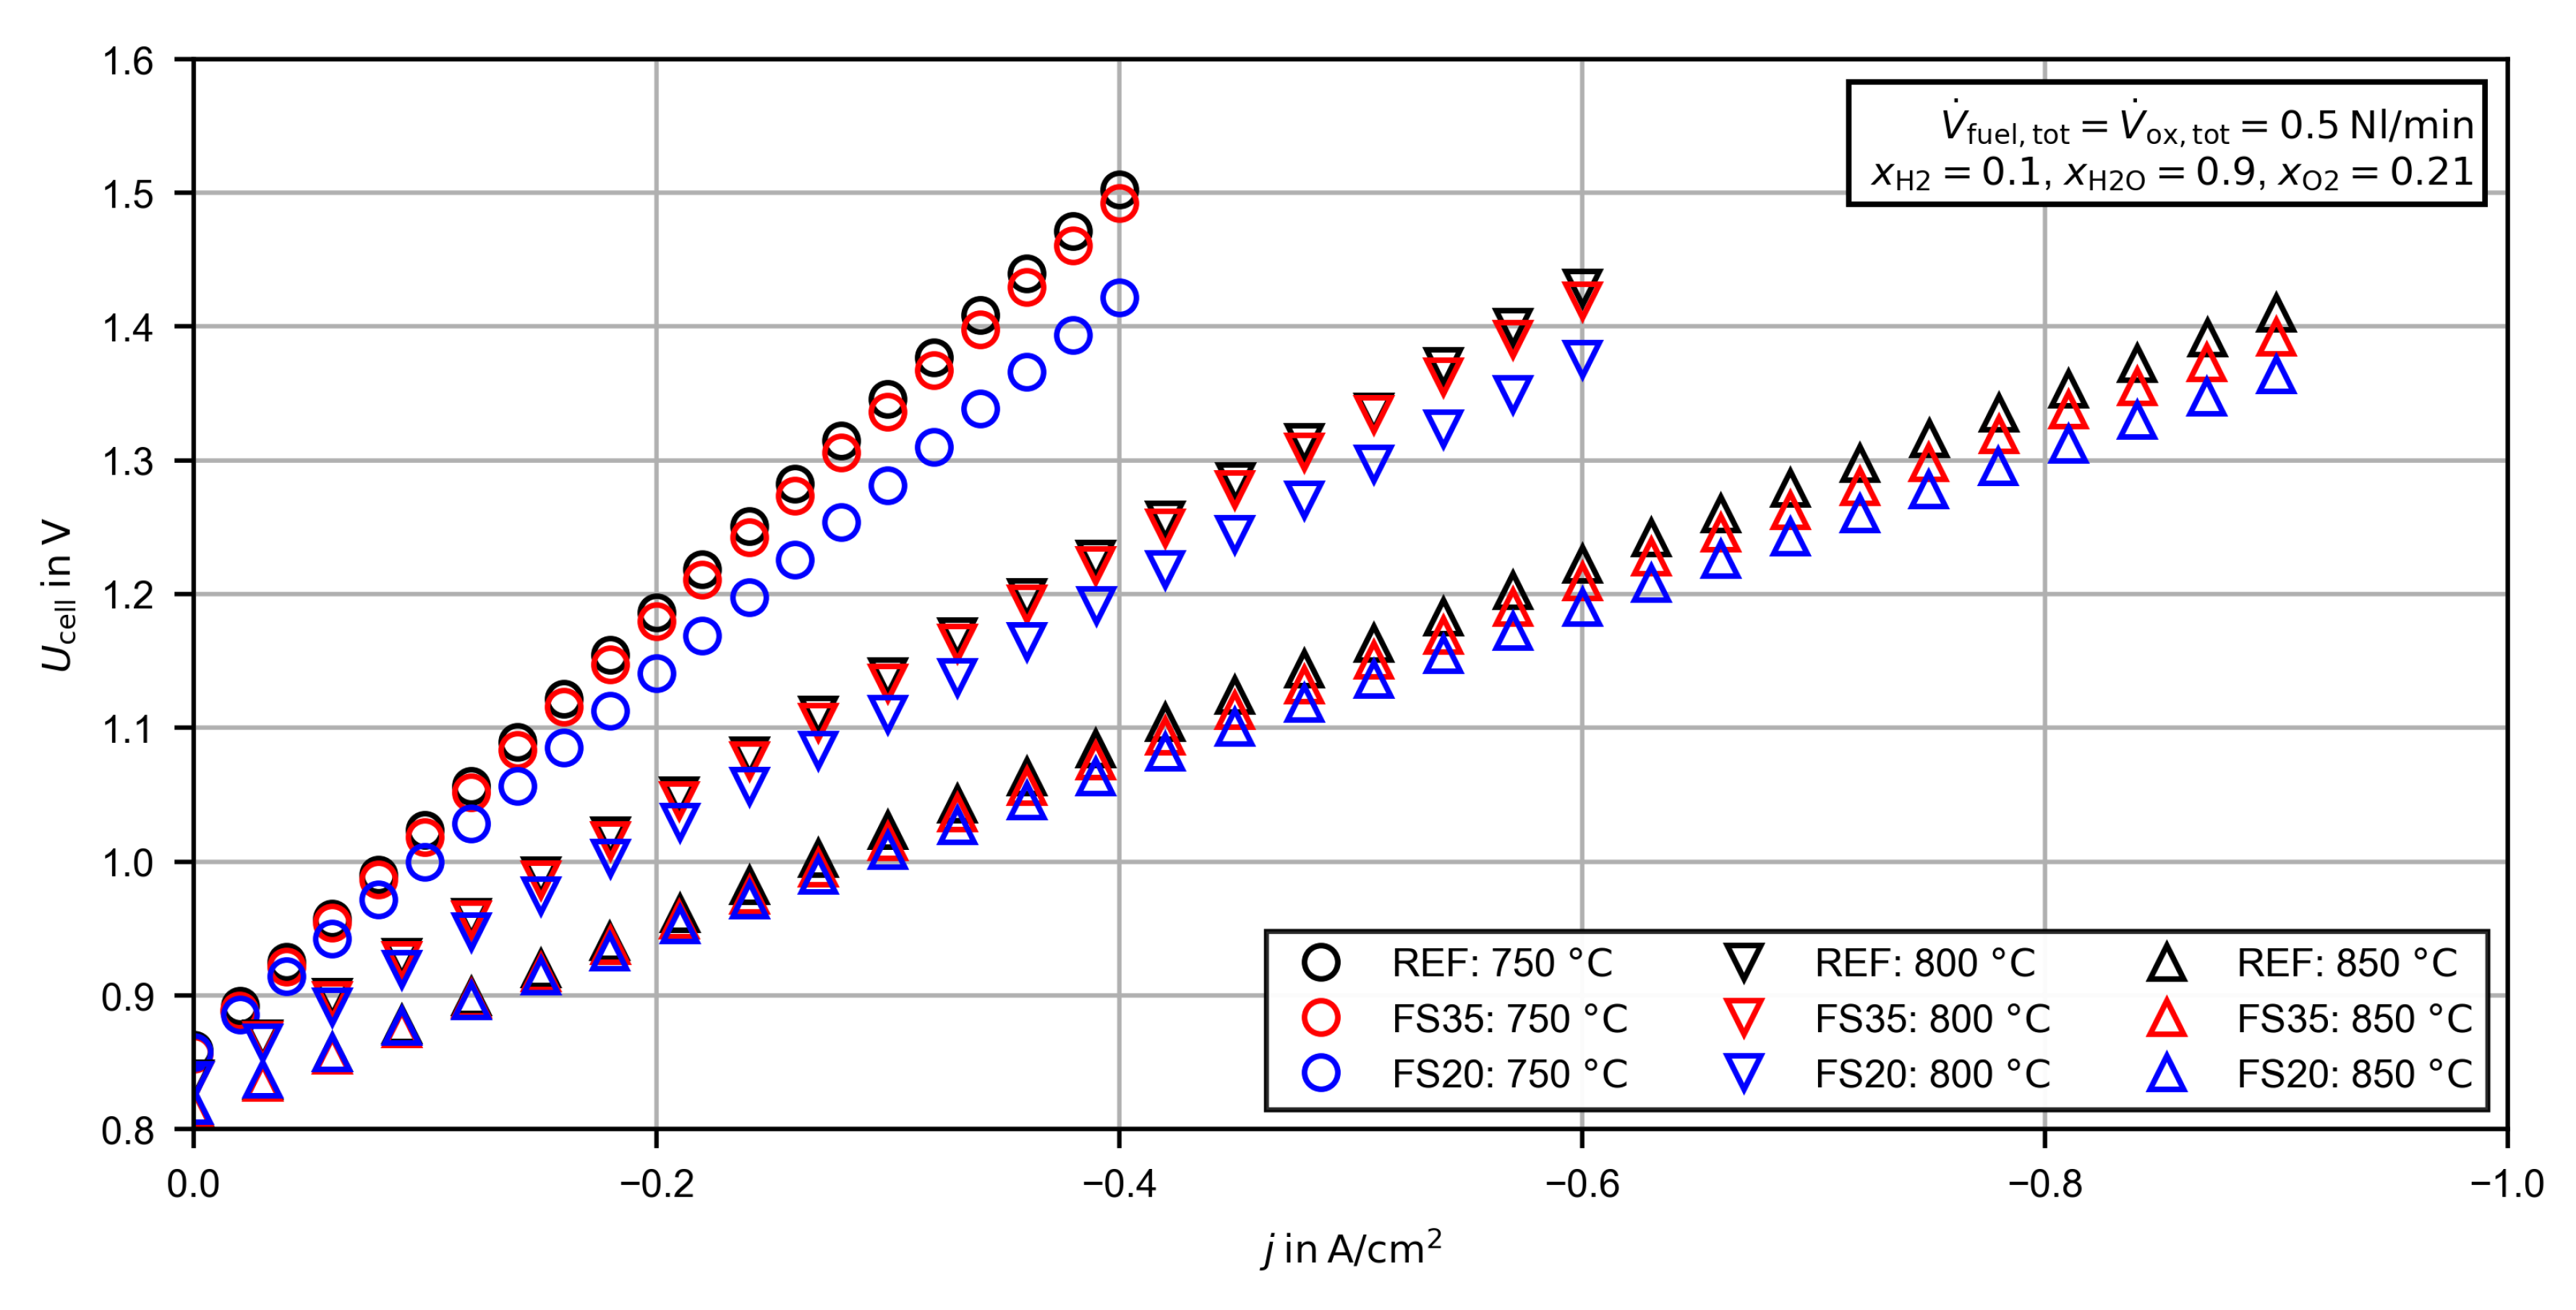
3.2.2. Voltage/Current Density Characteristic

Figure 6 presents the U,j-characteristics of all cells for 750, 800 and 850 ° C . All U,j-characteristics have more or less linear behavior, as is typical for SOCs. For all three temperatures, the current-dependent voltages of cell FS20 were the lowest, followed by cell FS35. At 850 ° C the current density at the thermoneutral point j th became 0.689 A / cm 2 for cell REF, 0.717 A / cm 2 for cell FS35 and 0.751 A / cm 2 for cell FS20. For cell FS20, the relative increase of the current density at the thermoneutral point, with respect to cell REF, became even larger for lower cell temperatures. In contrast, the deviation between cell FS35 and cell REF decreased with decreasing temperature and the performance became very close, as is also recognizable in the already presented CC and EIS measurements at 800 ° C . A more in-depth analysis of the performance deviation dependent on the operating conditions was performed by a separate analysis of the HFR and the polarization resistance.

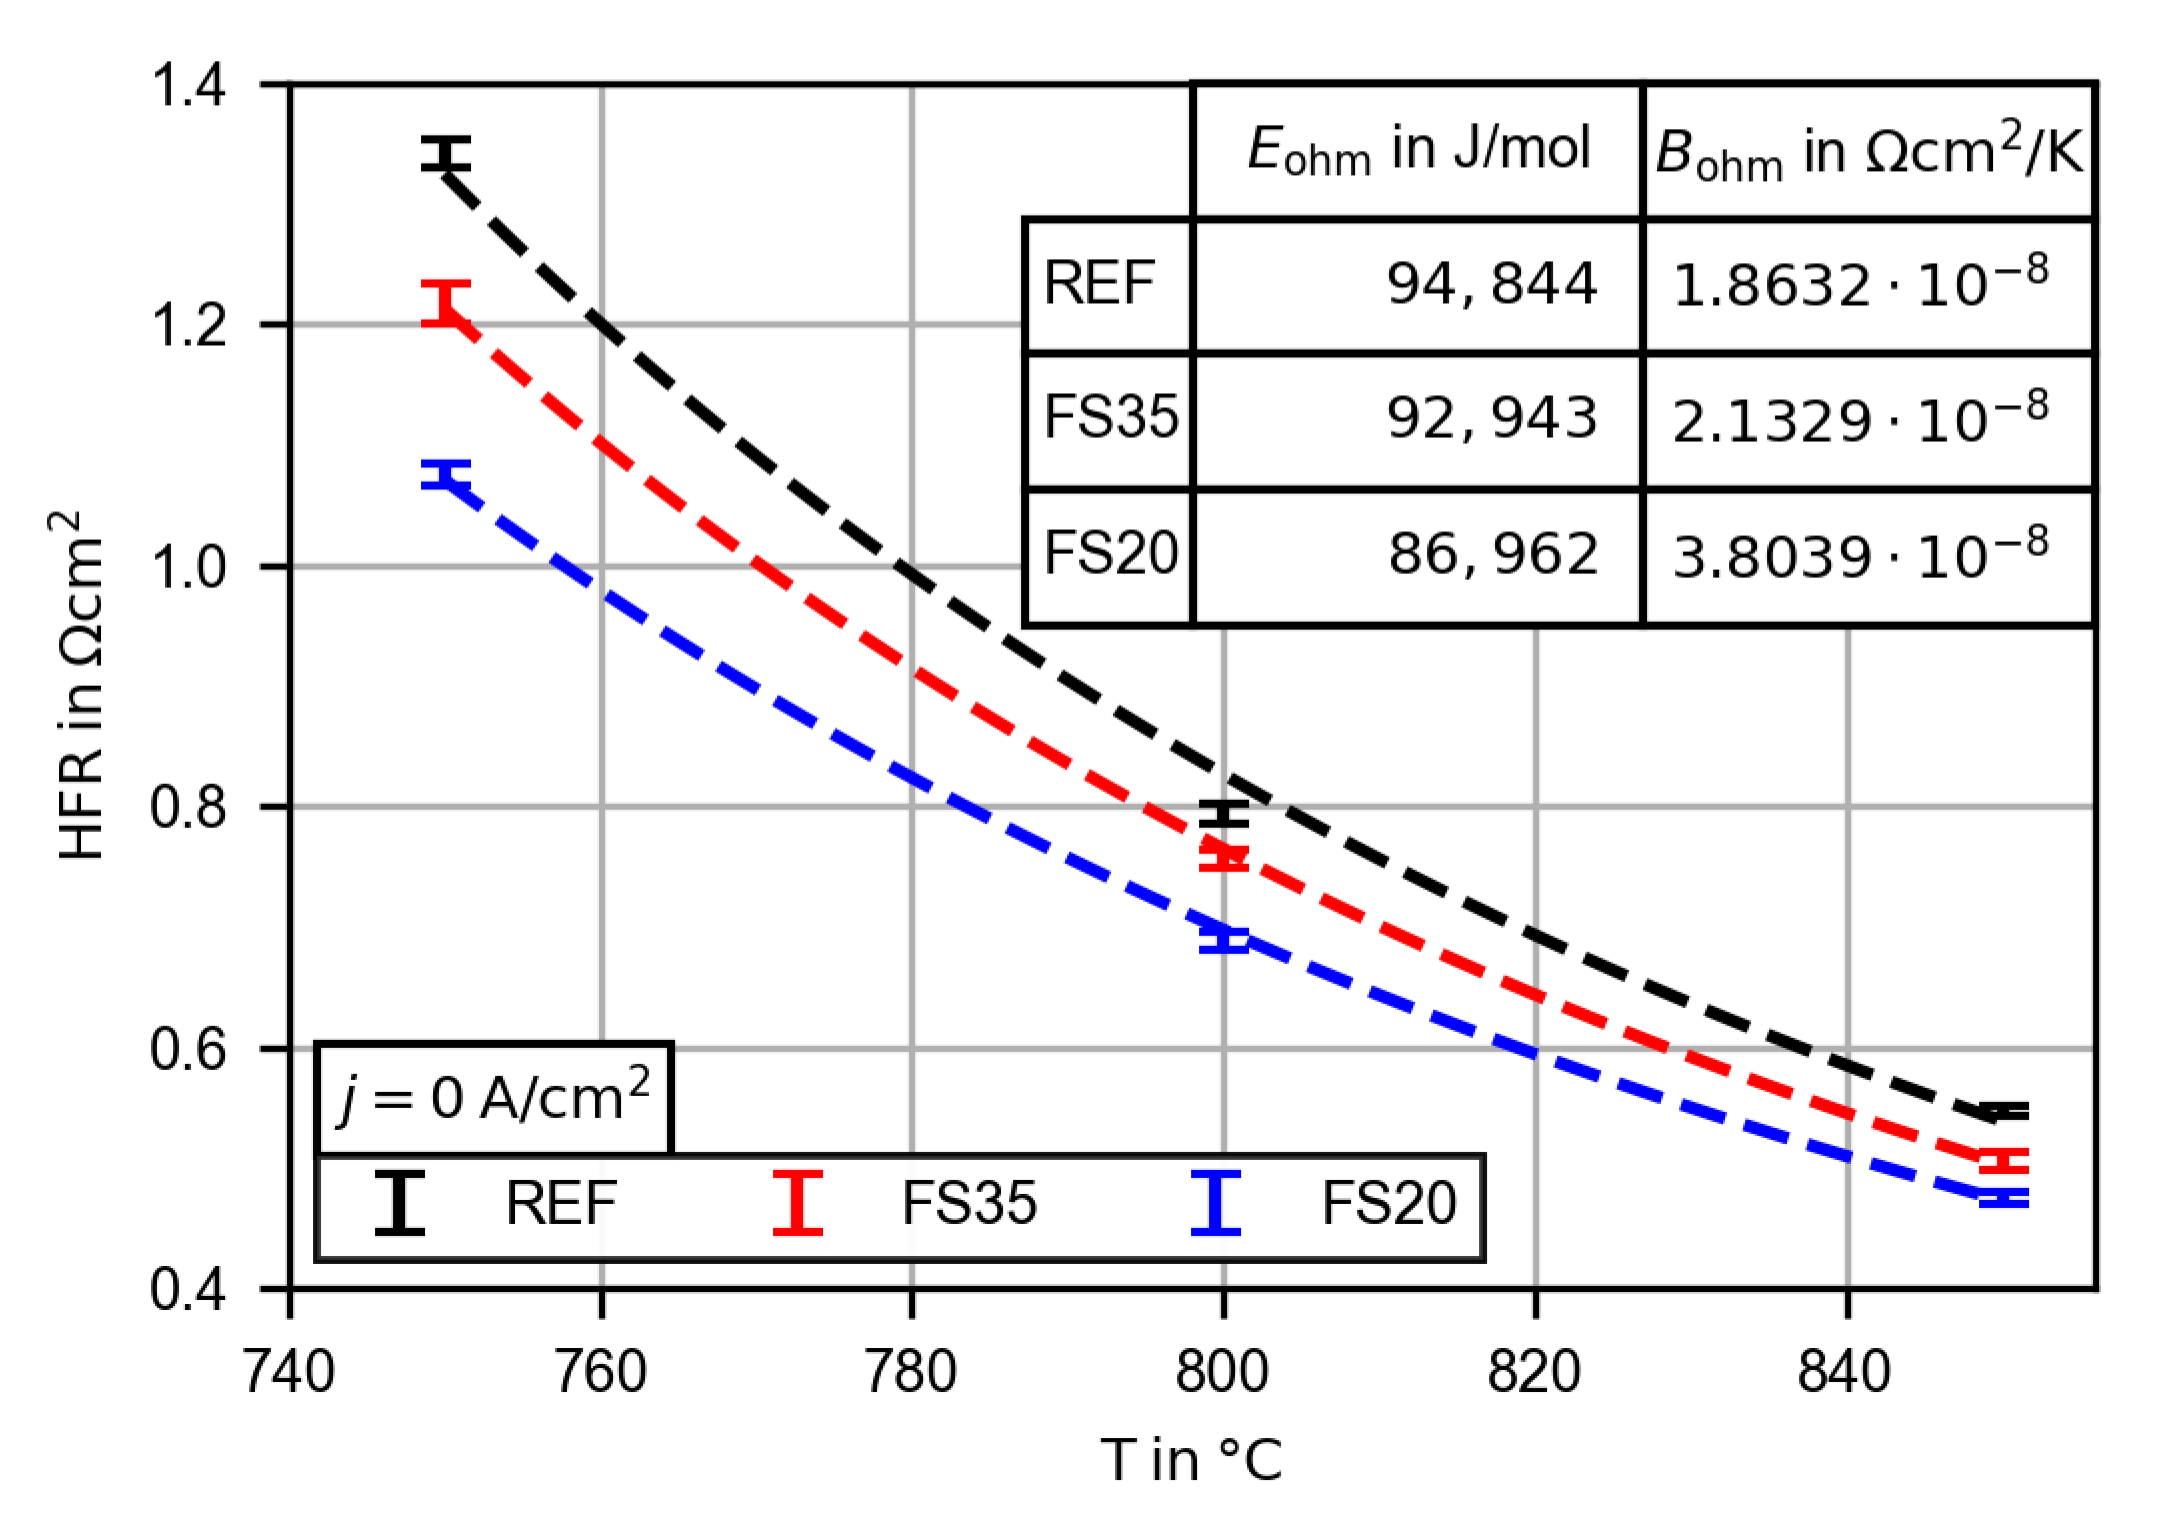
3.2.3. Evaluation of the High Frequency Resistance

Figure 7 shows the HFR for each cell dependent on the temperature. The given HFR was calculated by averaging the HFR of all open circuit impedance spectra ( j = 0 A / cm 2 ) after the CC measurement. The standard deviation is given as the uncertainty interval. Slight changes in the HFR were due to temperature changes dependent on the gas supply and a low but continuous cell degradation during the characterization. Based on the experimental data, the Arrhenius equation (see Equation (1)) was fitted for all three cells and plotted as a dotted line:
H F R T = B ohm T exp E ohm R T ,
with R as the molar gas constant. The activation energy E ohm and the pre-exponential factor B ohm are given in Figure 7. Except for the HFR of cell REF at 800 ° C , the fitted Arrhenius equation is within the uncertainty interval of the experimental data. This deviation might be a result of further degradation. The measurements were done first at 800 ° C , afterwards at 750 ° C and finally at 850 ° C .
As can be seen in Figure 7 the HFR of the femtosecond laser-treated cells are below the HFR of the reference cell for all three measured temperatures. As shown in Section 3.1, the femtosecond laser treatment leads to a decrease in average electrolyte thickness. Thus, the lower HFR of the femtosecond laser-treated cells meets the expectation. The deviation increases with decreasing temperature, as can be seen by the lowered calculated activation energies (see Figure 7). At 850 ° C the HFR of cell FS35 is reduced by 9.3% and that of cell FS20 by 13.1% with respect to the reference cell. Using the given ionic conductivity of the 3YSZ electrolyte at 850 ° C ( 0.22 S / cm [32]) and the approximated thickness reduction of the electrolyte, the HFR can be separated in the pure electrolyte resistance and other ohmic resistances. Additional contributions to the ohmic resistance are, for example, contact resistances due to degradation mechanisms such as the formation of interlayers or delamination [12]. Furthermore, the contact resistance between the cell and the contact meshes and the ohmic resistance of the CGO barrier and adhesion layers increase the HFR. The additional ohmic resistance of the reference cell at 850 ° C was 138 m Ω cm 2 and was reduced by 8.8% for cell FS35 and by 17.2% for cell FS20. The femtosecond laser treatment seems to affect the contact resistance between the electrolyte and the CGO adhesion layer, and the thickness of the adhesion layer as well.

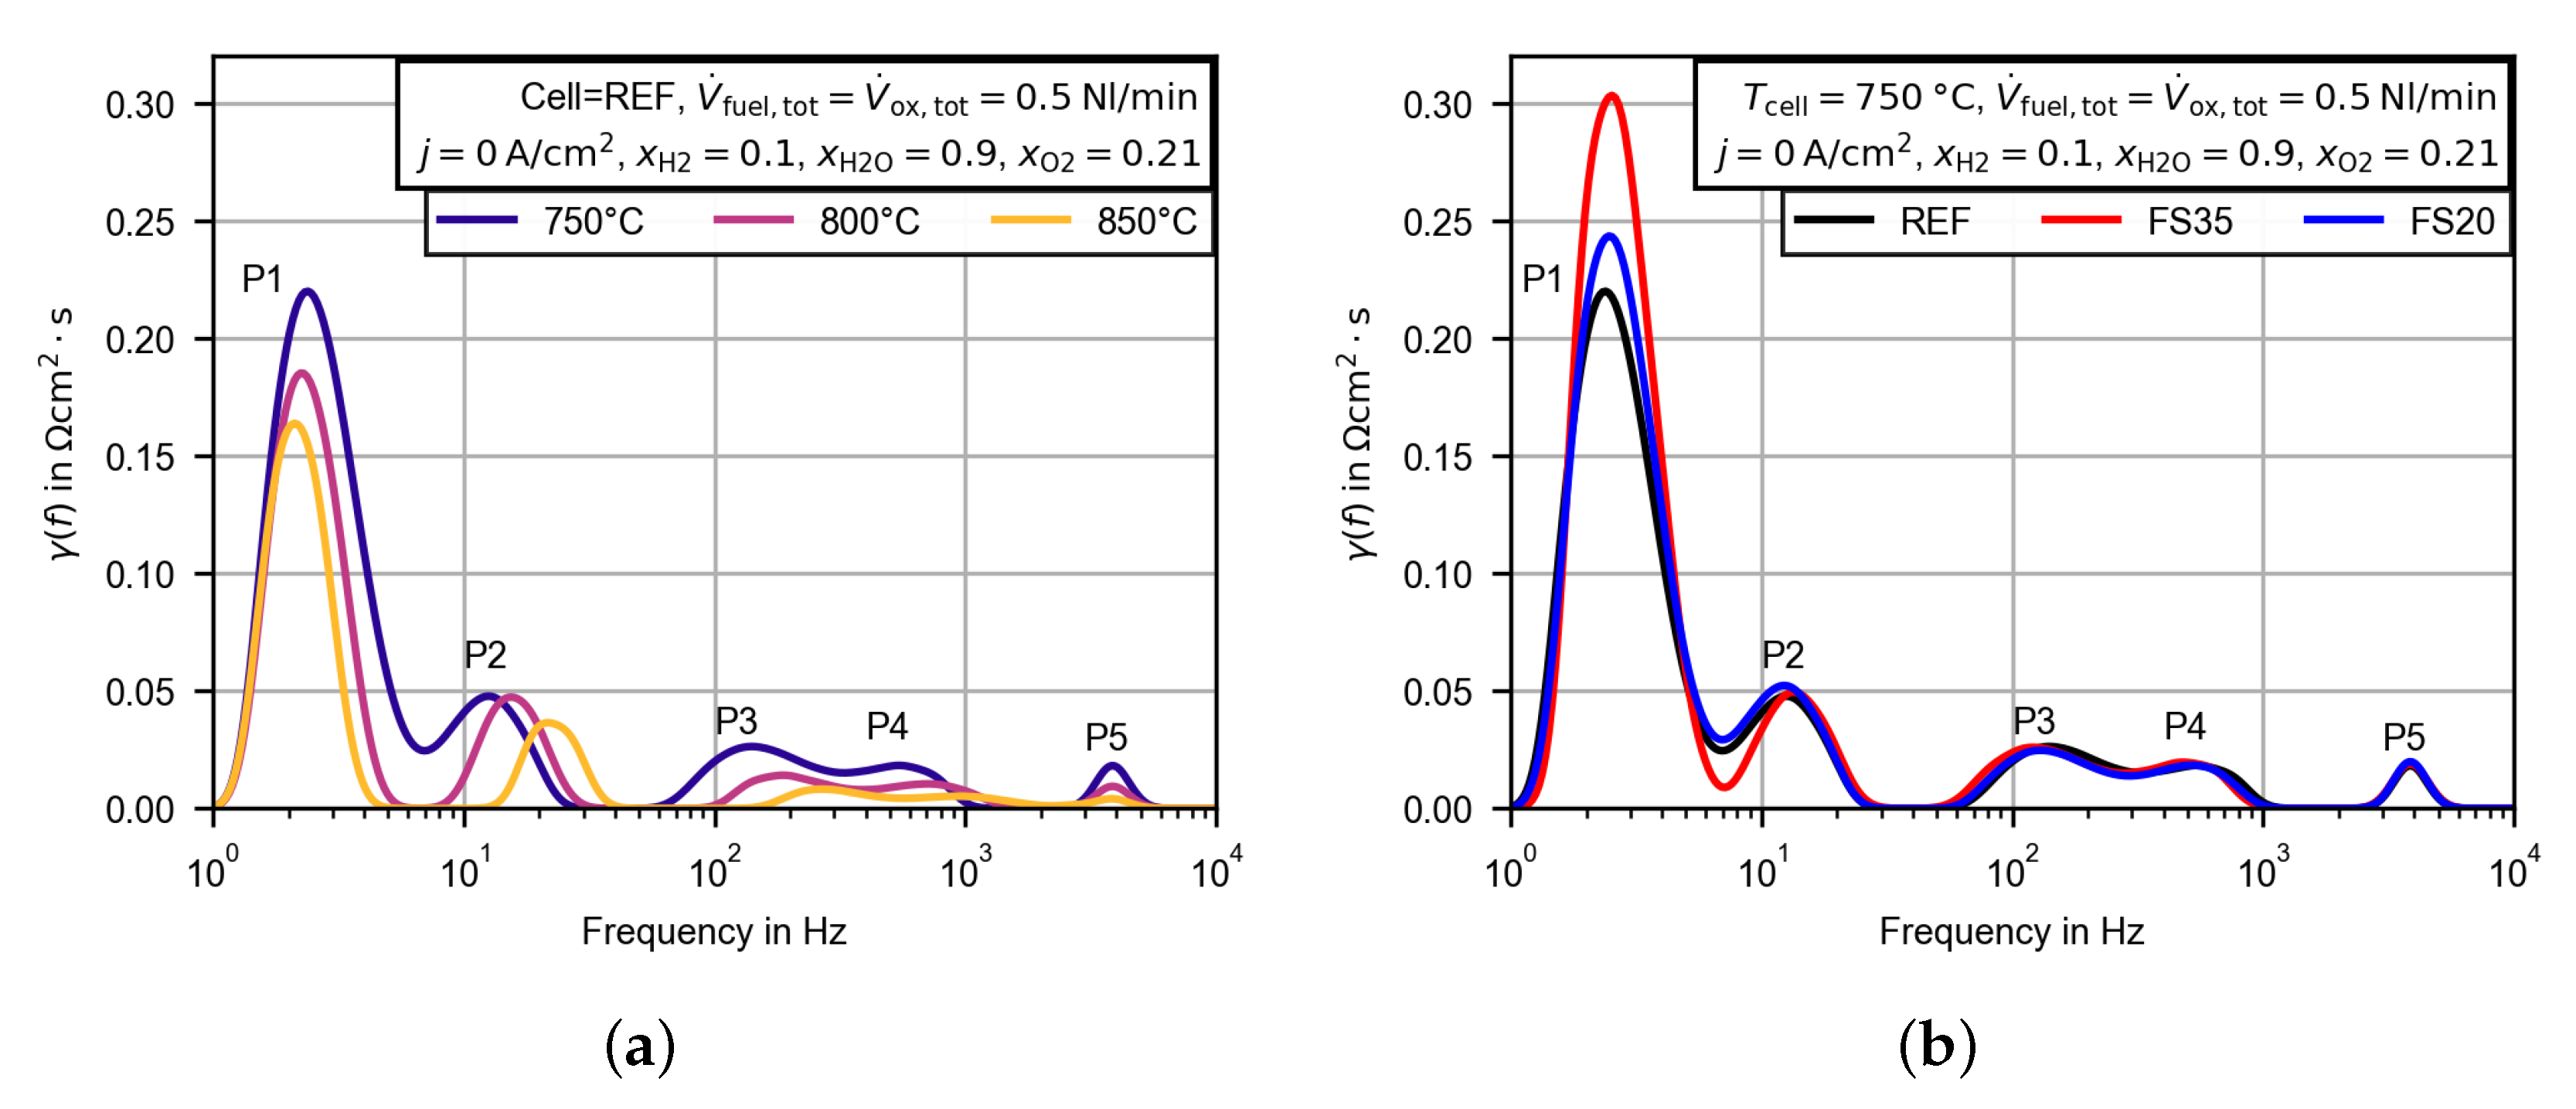
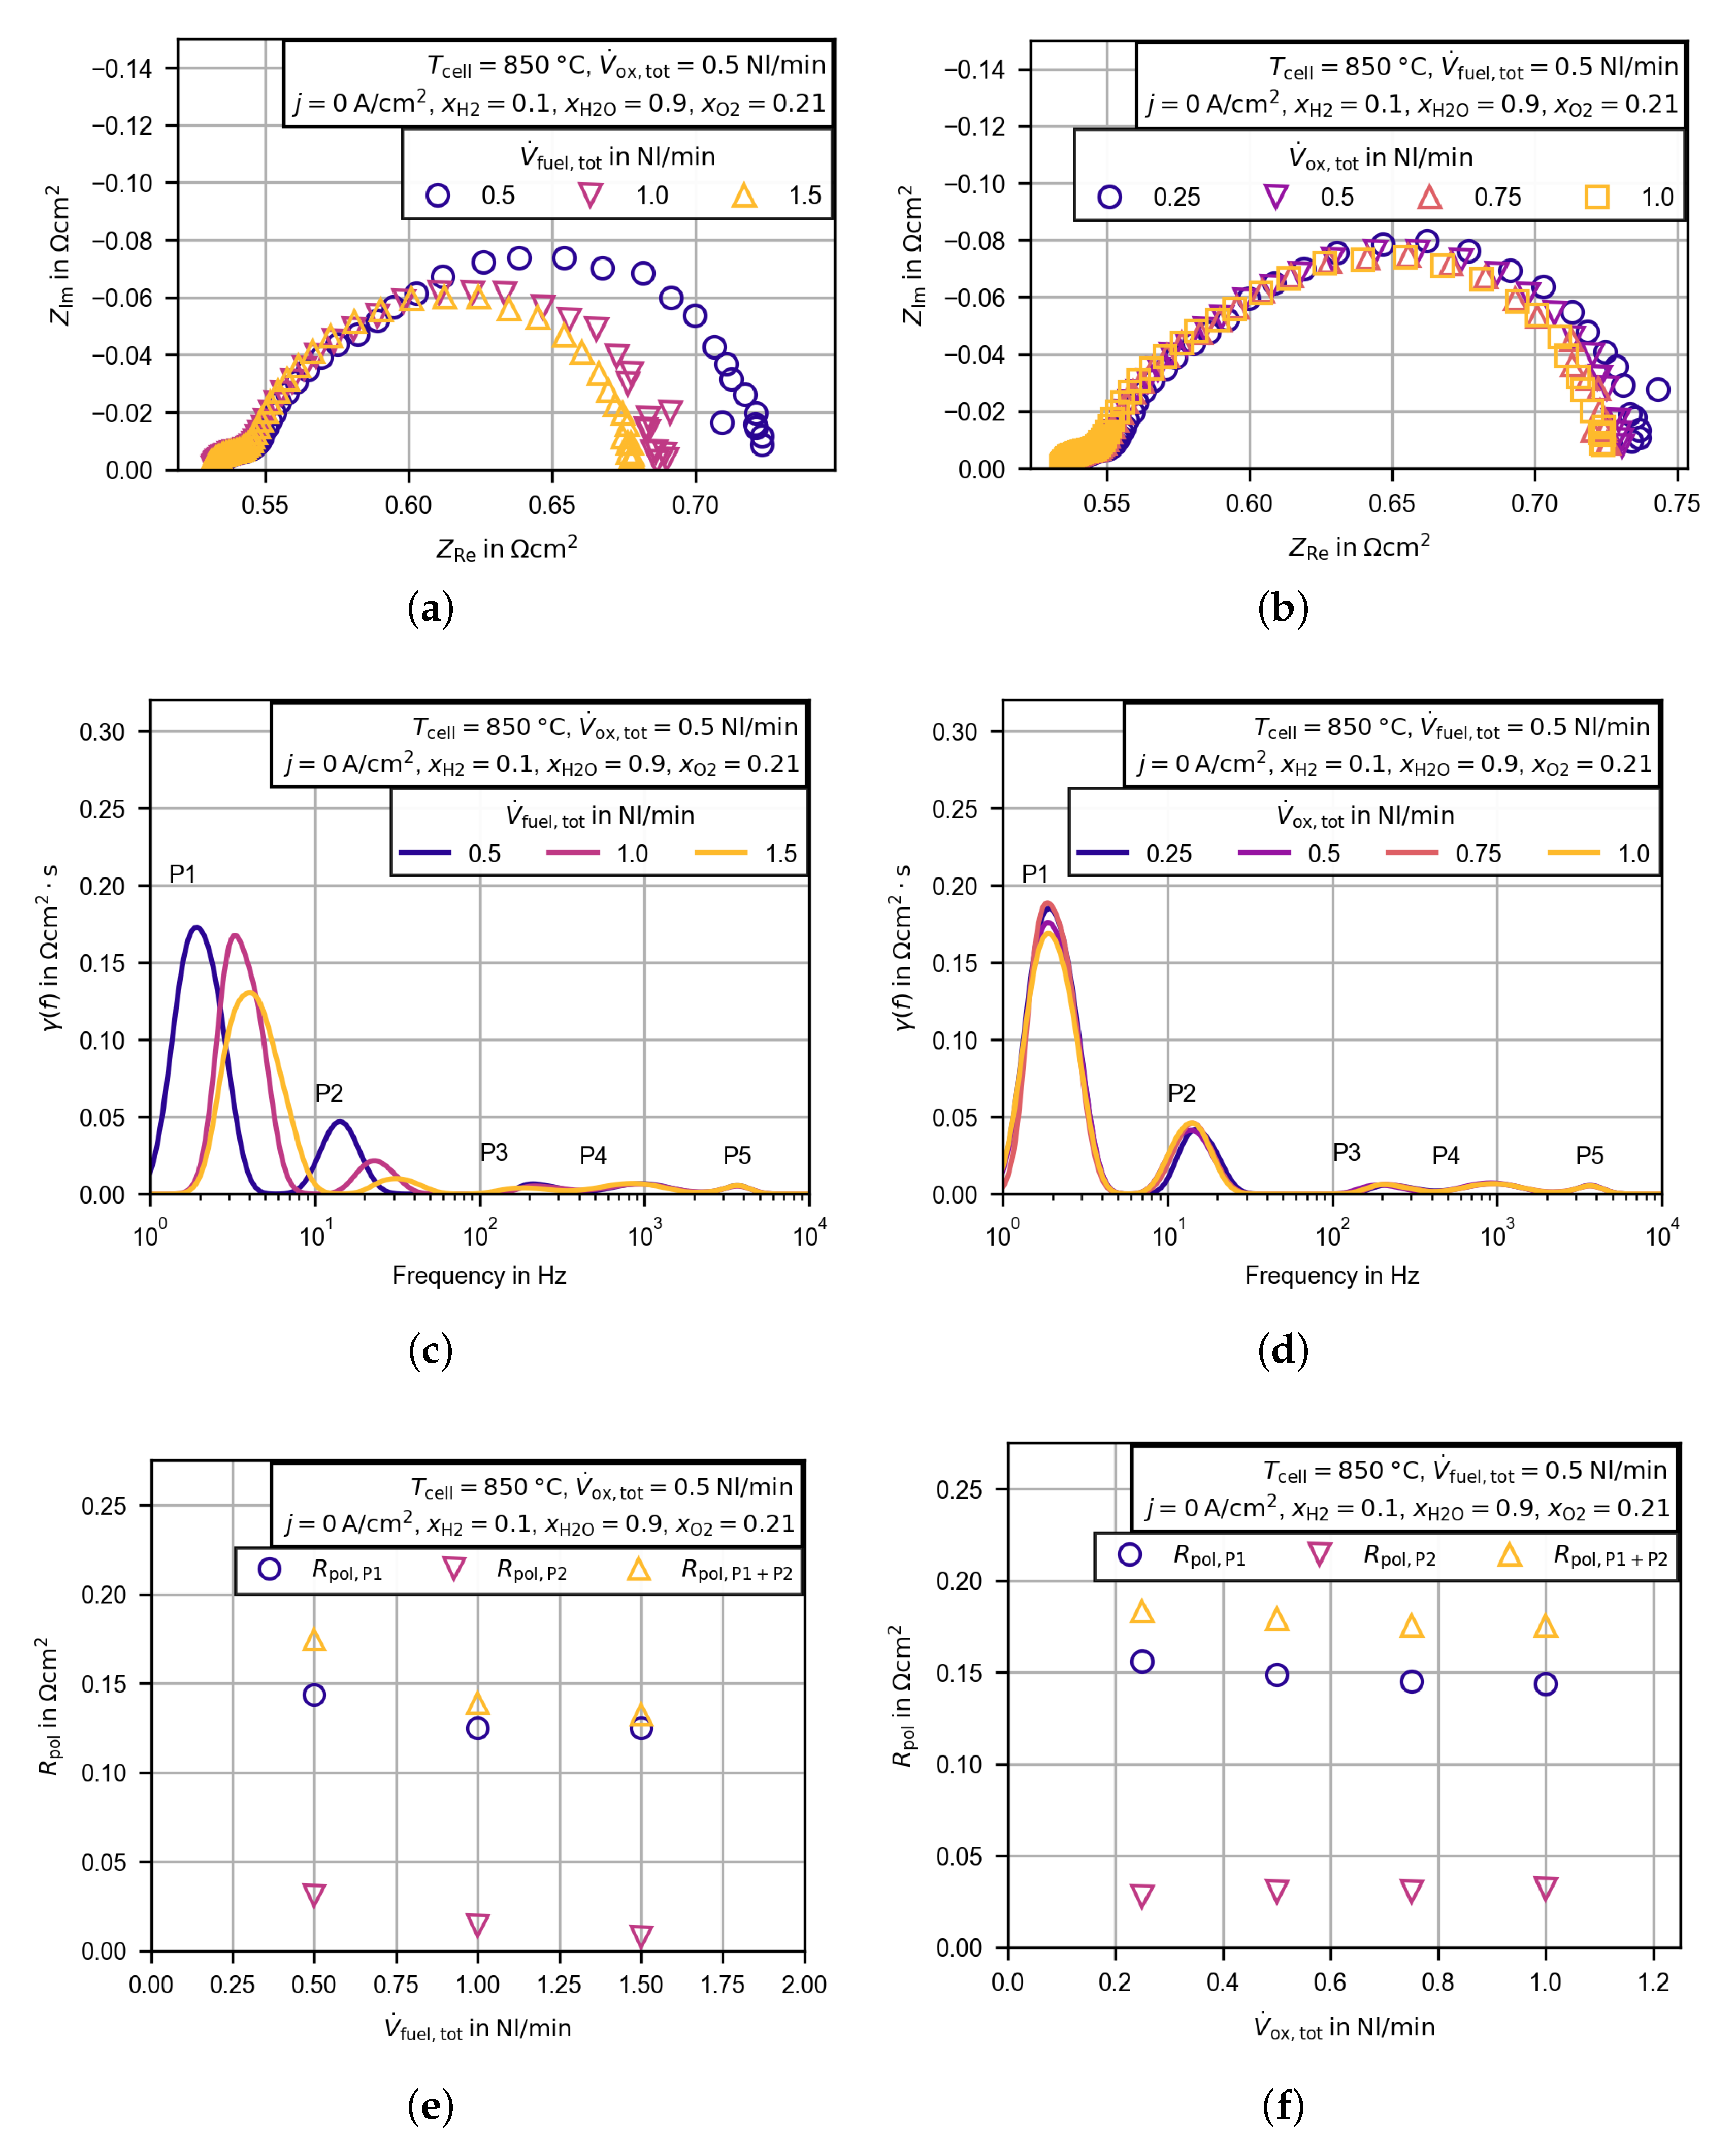
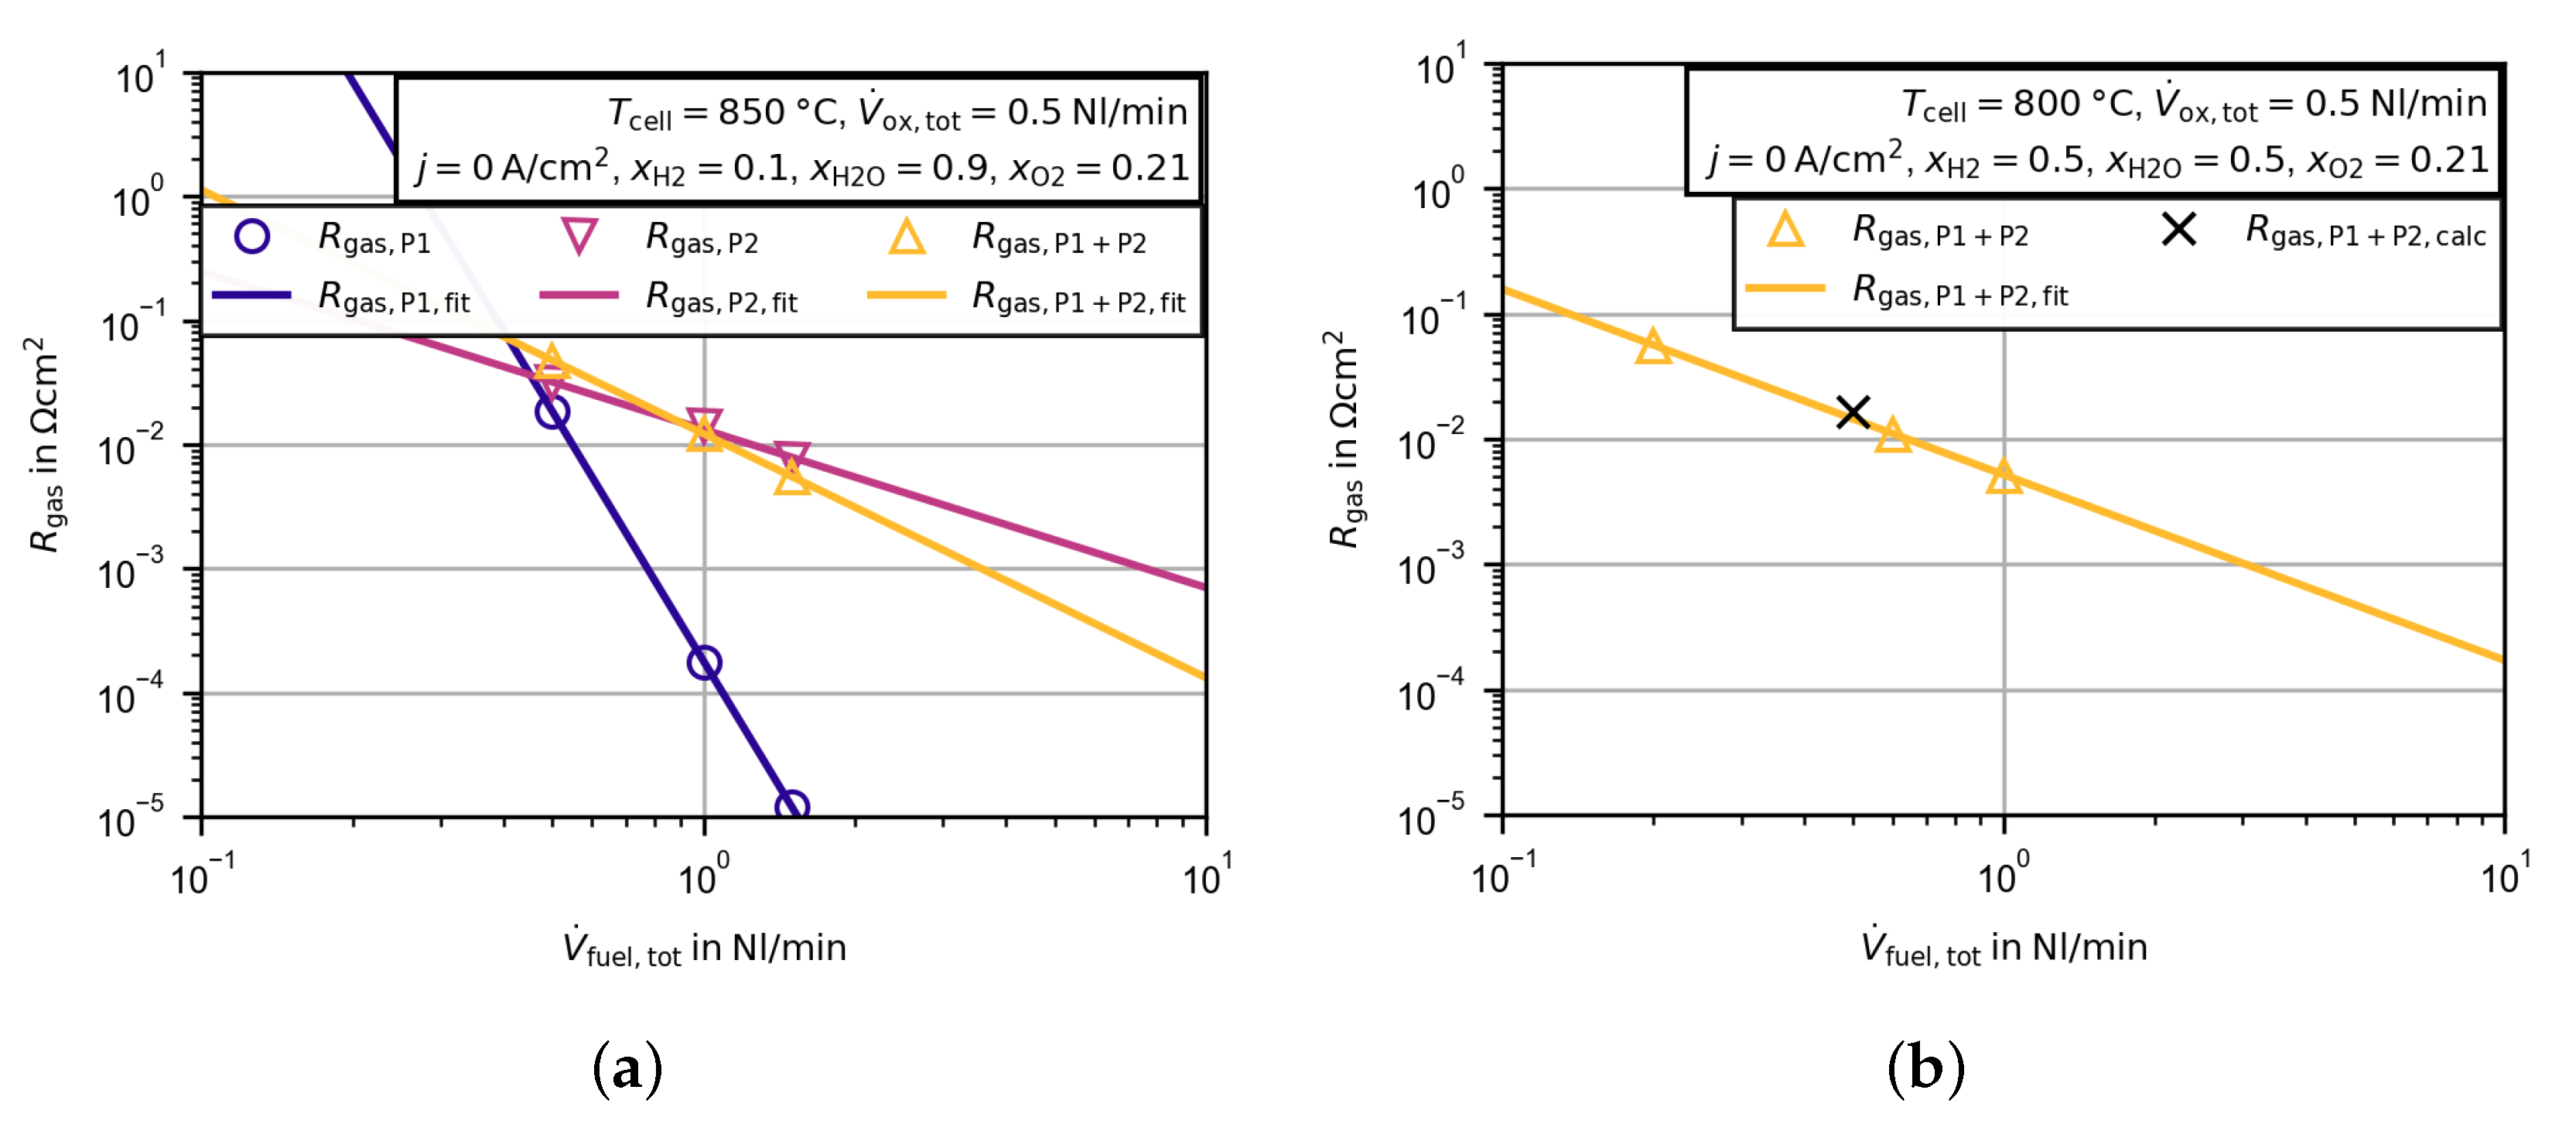
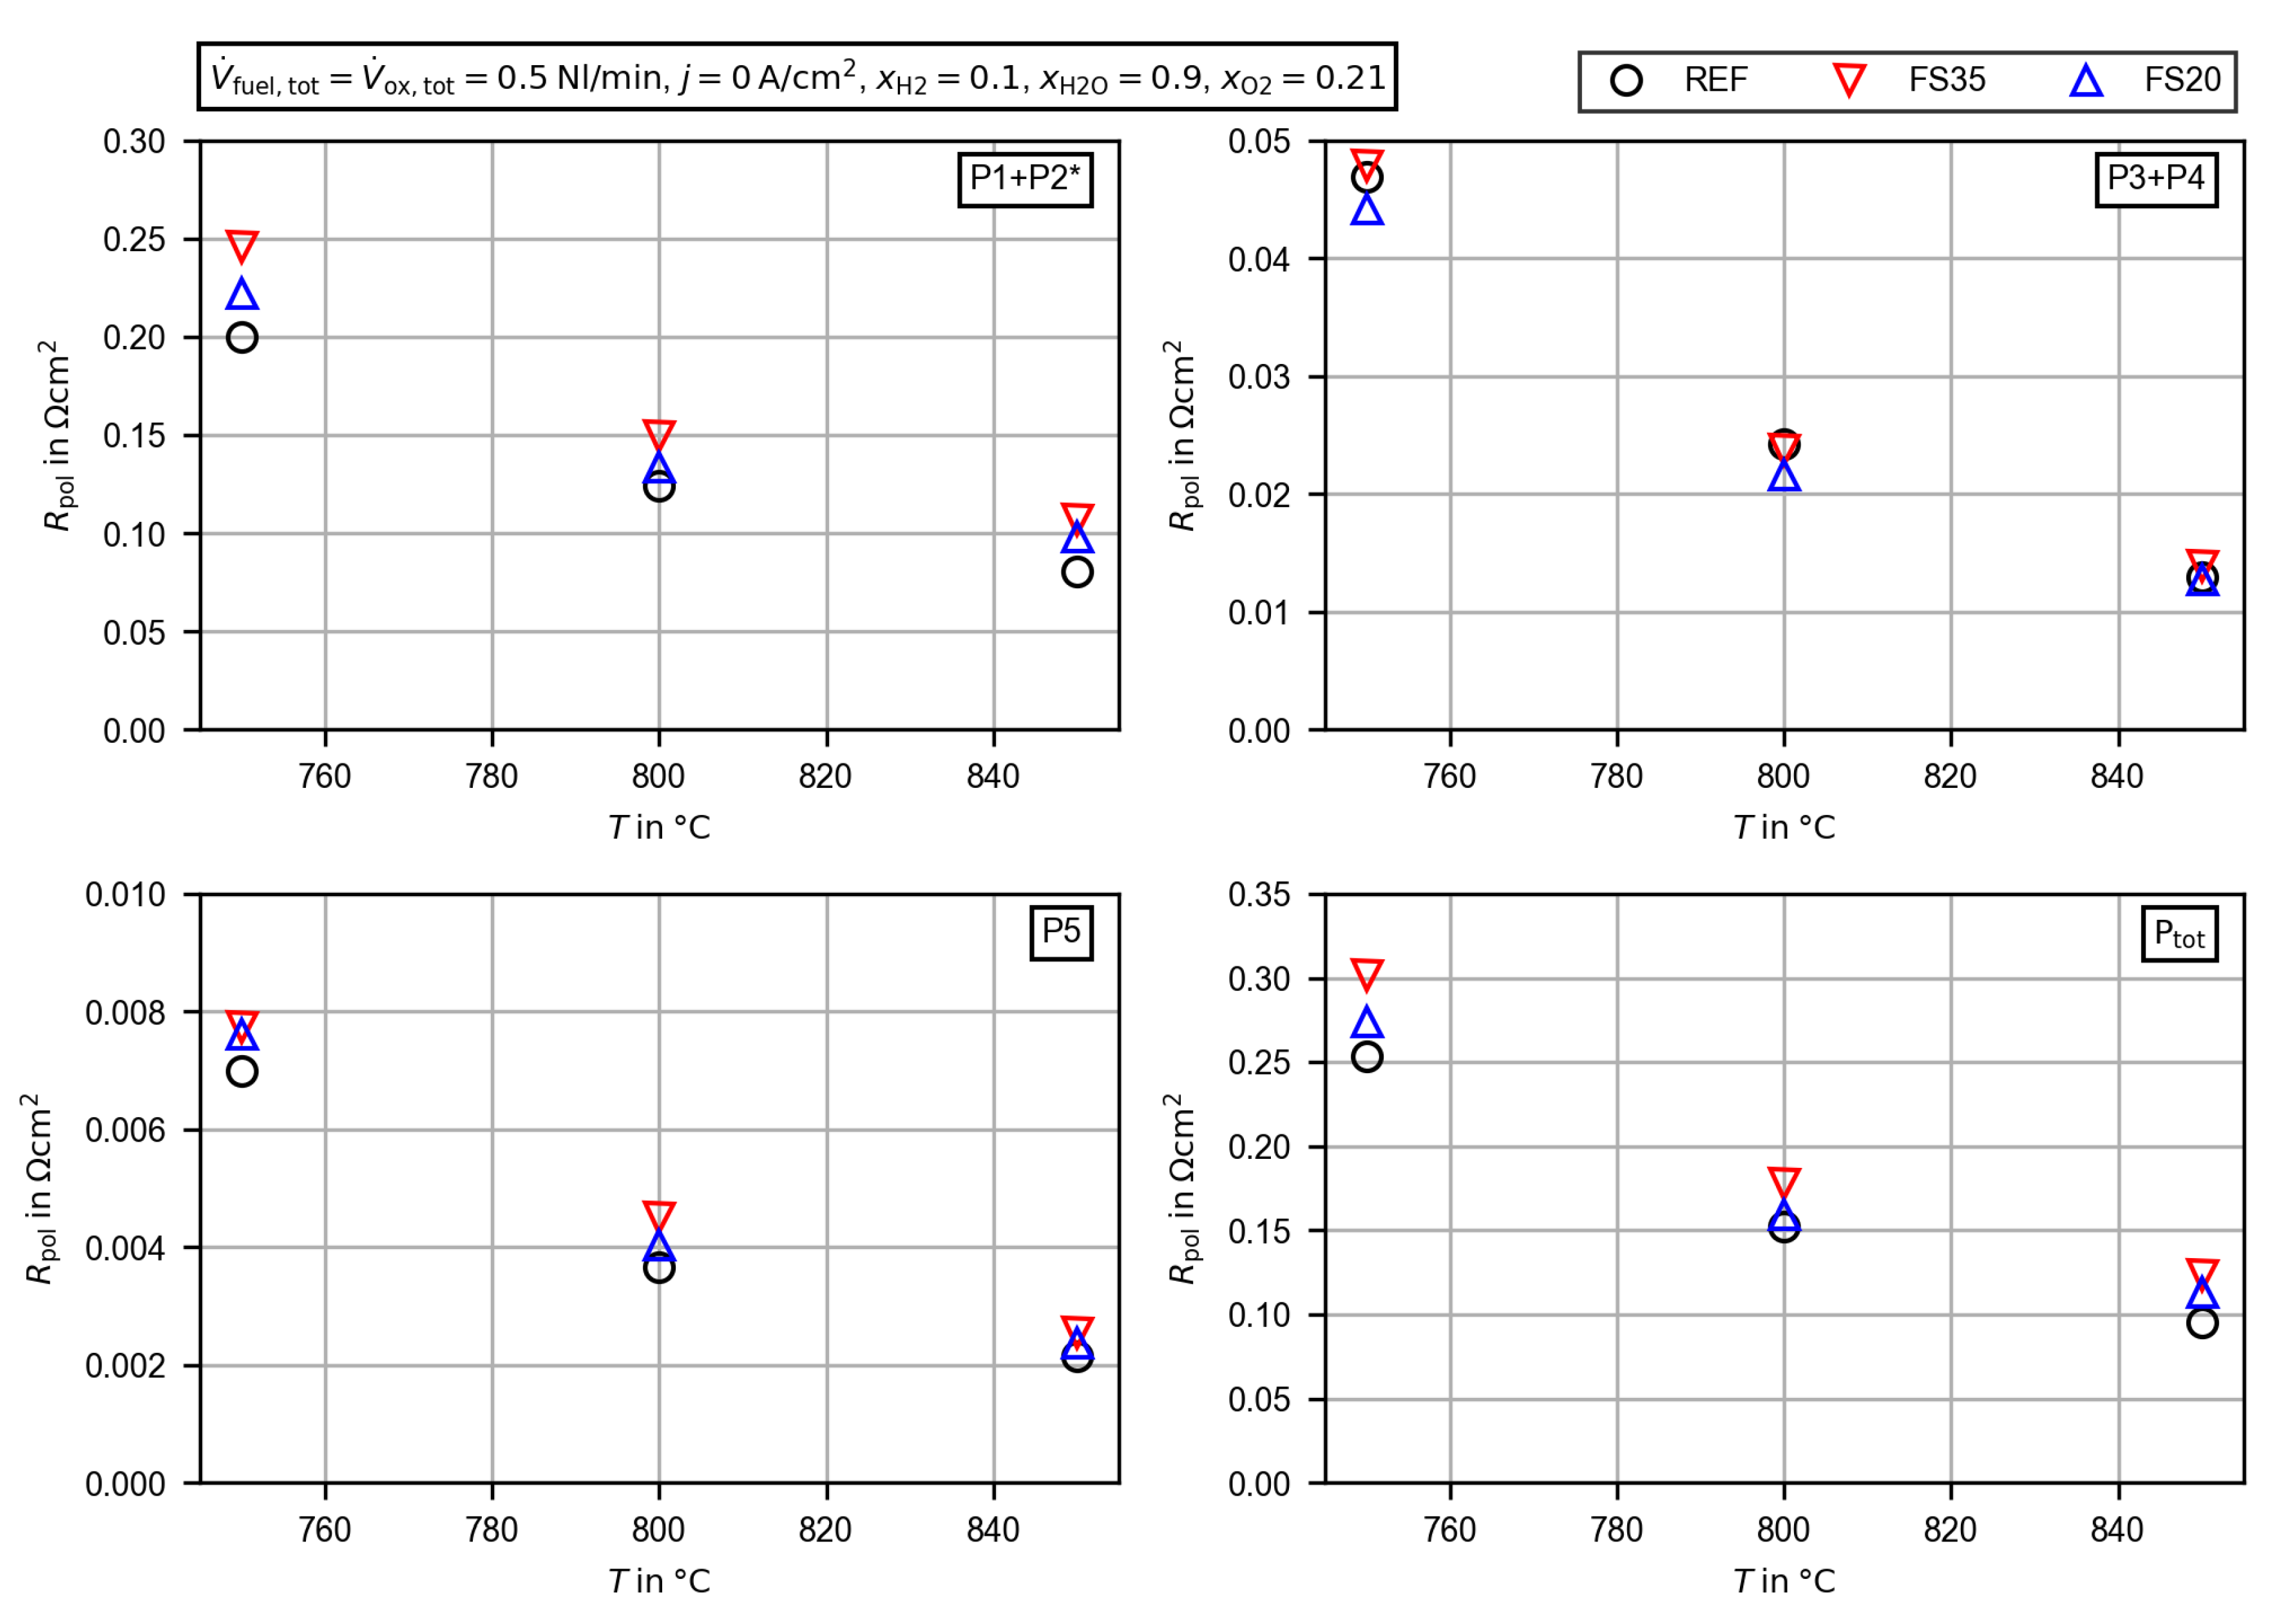
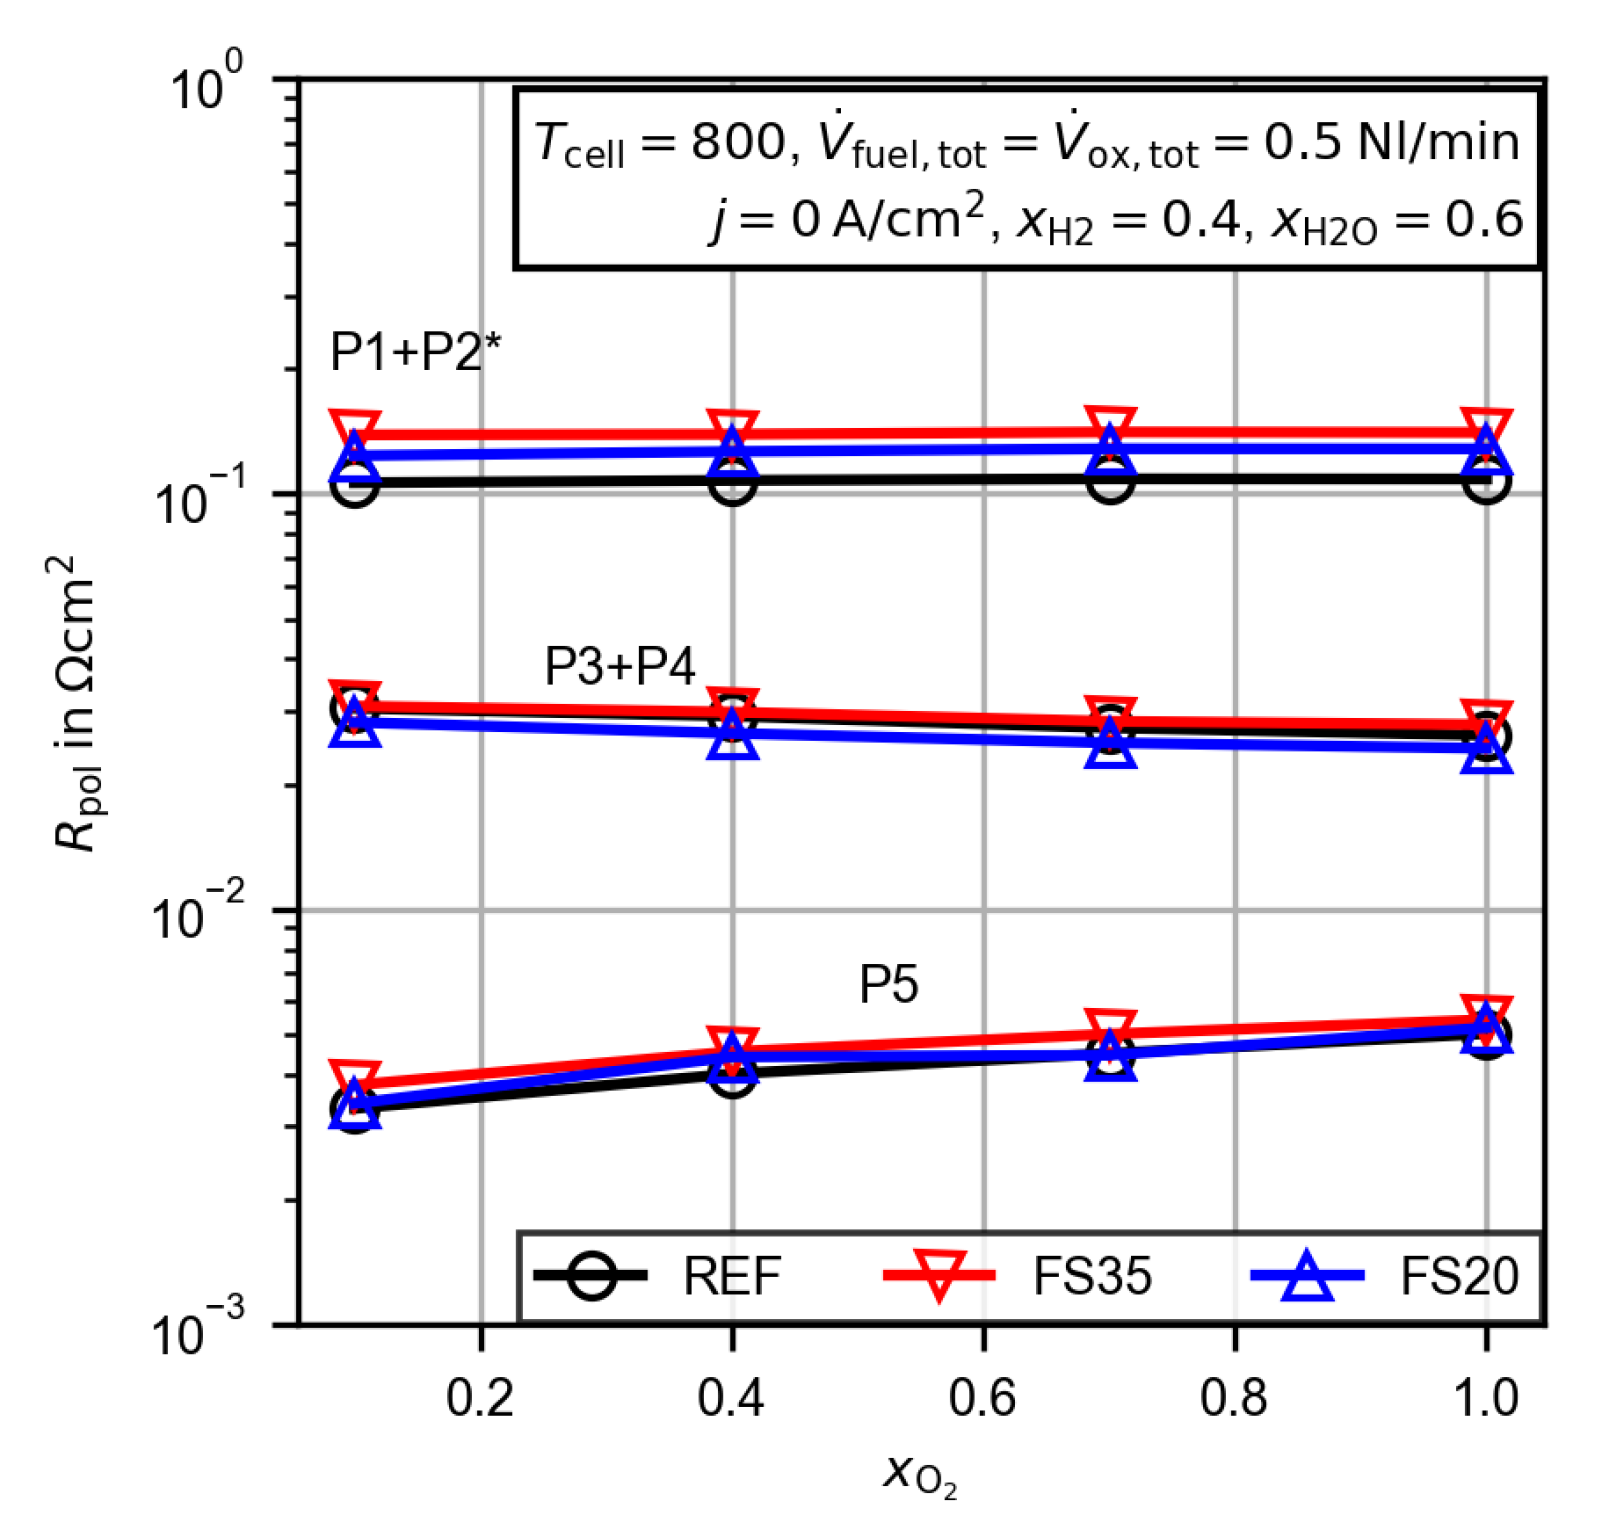
3.2.4. Evaluation of the Polarization Resistance

The polarization resistances of each cell dependent on the fuel composition and temperature were evaluated using the distribution function of the DRT analysis. An optimal regularization parameter was chosen based on the results of the EIS evaluation procedure from Schlüter et al. [31]. The cross-validation and variance tests were applied to the three EIS after the CC measurement (see Figure 5). For each EIS the normalized results dependent on the regularization parameter λ are presented in Figure A3 in the Appendix A. The threshold values for an increased error in the cross-validation test ( C V ) or in the variance test ( σ tot 2 ) are almost equal for all three cells. At regularization parameters below 10 4 , σ tot 2 increases significantly and at values above 10 2 C V increases. Following this, all distribution functions were calculated with a regularization parameter of λ = 10 4 .
In Figure 8a the distribution functions of the reference cell at the three operating temperatures are presented as functions of the relaxation frequency (inverse of the relaxation time). The underlying impedance spectra were measured at open circuit conditions and at the same operating conditions as in the U,j-characteristics in Figure 6. For all obtained spectra, five peaks, labeled P1 to P5 from low to high relaxation frequency, can be observed. With the chosen regularization parameter, the peaks P3 and P4 are not clearly separable from each other and are therefore evaluated as one. At 750 ° C the peaks P1 and P2 begin to merge as well. The peaks P2, P3 and P4 are shifted to higher relaxation frequencies with increasing temperature. The relaxation frequencies of the peaks P1 and P5 remain almost constant. The size of every peak seems to be reduced with increased temperature. In Figure 8b, the distribution function of the reference cell at 750 ° C is compared to the corresponding functions of the femtosecond laser-treated cells FS35 and FS20. It becomes apparent that the major differences in the polarization resistances occur in the low frequency peak P1, whereas the peaks P3, P4 and P5 appear to be almost identical. Due to the merging peaks P1 and P2m a clear statement for the peak P2 is not possible.
Before performing a quantitative analysis, the peak resistances need to be corrected. As shown in previous modeling studies [33,34,35] and experimental studies for symmetrical cells [36,37], the low frequency polarization resistance is increased by a gas diffusion and gas conversion resistance, even for open circuit measurements. The sum of both resistances is also named gas concentration resistance R gas [38]. This gas concentration resistance is related to the test environment and not to the cell itself [33]. For thin porous electrode layers, as used in this study, the gas diffusion resistance of the cell is typically negligible [33]. The gas concentration resistance and its main origin (conversion or diffusion resistance in the gas channel) depend especially on the measurement setup and the gas supply. Unfortunately, R gas cannot be separated by a single peak in the DRT due to an overlapped electrode process for Ni/CGO electrodes [37]. A possible approach to approximate R gas would be the characterization of a cell with a Ni/YSZ fuel electrode, which has no characteristic overlapping process at the relevant relaxation frequency. This approach is used by Riegraf et al. [37], to correct the low frequency polarization resistance of a symmetrical Ni/CGO cell by R gas of a single chamber test environment. Due to high flow rates, small electrodes and the single chamber setup R gas are mainly related to the gas diffusion in the channel. As is shown in a modeling study of Geisler et al. [35], in the case of convective transport in the fuel channel of a solid oxide fuel cell, the gas concentration in the gas channel perpendicular to the gas flow direction remains almost constant. Thus, the gas concentration resistance is mainly attributed to the gas conversion resistance, and an increasing gas flow rate decreases R gas significantly, and it becomes zero for an infinite gas flow rate. It should be noted that the use of contact meshes can increase the gas diffusion resistance and lead to more complex flow conditions, which is not accounted for in the aforementioned modeling approaches.
In this study, a new approach to approximate the gas concentration resistance R gas , which in this setup mainly is related to a gas conversion resistance, is presented. This approach is also applicable when electrode processes overlap the gas concentration resistance. Therefore, additional measurements with varying gas flow rates at the fuel and oxygen electrode were performed. The experiments were done with the same commercial cell type (Keracell III, 3YSZ) as the reference cell. In Figure 9a,b the Nyquist plots of the measured EIS dependent on the total flow rate at the fuel and oxygen electrode are presented. It should be mentioned that the operating conditions chosen here represent a borderline case due to the high temperature of 850 ° C and the low hydrogen amount of 10%. Thus, the gas concentration resistance at the fuel electrode reaches its maximum value with respect to the operating conditions in this study. As can be seen in Figure 9a, the polarization resistance increases significantly for a total flow rate of 0.5 Nl / min . In comparison, the oxygen flow rate has a minor influence on the polarization resistance (see Figure 9b). As can be seen in the distribution functions presented in Figure 9c,d, the gas concentration resistance at the fuel electrode R gas , fuel affects the sizes and the relaxation frequencies of the peaks P1 and P2. The gas concentration resistance at the oxygen electrode R gas , ox affects the size of peak P1 only. As the area below each peak is equal to its corresponding single polarization resistance R pol , i , the results can be evaluated quantitatively. In Figure 9e,f the polarization resistances of the peaks P1 and P2 are presented as functions of the flow rate at each electrode. For the fuel electrode, the variation of the gas flow rate decreases the polarization resistance of P1 significantly at first, but becomes nearly constant for a gas flow rate above 1 Nl / min . As can be seen in Figure 9c, this behavior is not directly visible due to the simultaneous change of height and width of the peak P1 in the distribution function. The changed shape of the distribution function shall not be discussed in detail, as the integral values are relevant for the correction of the polarization resistance. The peak resistance of peak P2 decreases continuously. An increasing flow rate at the oxygen electrode decreases the peak resistance of peak P1 only slightly (Figure 9f) and peak P2 remains constant. As it can be seen in the modeling results of Bessler et al. [34], the gas concentration resistance as a function of the gas flow rate can be described by a power law over a wide flow rate range. In order to approximate the gas concentration resistance, the single peak resistances and the sum of the peak resistances P1 and P2 are fitted by the following approach:
R pol , i V ˙ = R gas , j V ˙ + R pol , i * ,
R gas , j V ˙ = m · V ˙ j c . ,
where R pol , i * is the “true” polarization resistance corrected by the gas concentration resistance R gas , j V ˙ .
In Figure 10a the results of the fitted Equation (3) are compared to the measured polarization resistances of the peaks minus R pol , i * , denoted as R gas , i . R pol , 2 * is calculated to be zero, so the entire polarization resistance of peak P2 is related to the gas concentration resistance. The approximated gas concentration resistance is nearly equal for the separate calculated gas concentration resistance of the single peaks or by using the sum of both peak resistances. At a temperature of 850 ° C , a gas flow rate of V ˙ fuel , tot = 0.5 Nl / min , x H 2 = 0.1 and x H 2 O = 0.9 ; the approximated gas concentration resistance R gas , fuel at the fuel electrode is 47.6 m Ω cm 2 . The same approach is used at the oxygen electrode, and the gas concentration resistance R gas , ox is approximated to be 11.9 m Ω cm 2 ( T = 850 ° C , V ˙ ox , tot = 0.5 Nl / min , x O 2 = 0.21 ).
The temperature and gas composition dependencies of the gas concentration resistances at open circuit conditions are calculated in a similar way as given in the approach of Primdahl et al. [33]:
R gas , fuel T , x i = k fuel · T · 1 x H 2 + 1 x H 2 O ,
R gas , ox T , x i = k ox · T · 1 x O 2 .
The parameters k i are used as fitting parameters and are valid only for a single gas flow rate and the specific test environment ( k fuel = 3.814 × 10 6 Ω cm 2 / K , k ox = 2.224 × 10 6 Ω cm 2 / K at 0.5 Nl / min ). In order to validate the approach, another experiment with varying gas flow rate at the fuel electrode was conducted. In this case the temperature was lowered to T = 800 ° C and the gas composition was changed to an equimolar amount of hydrogen and water. The same fitting procedure was performed and the approximated gas concentration resistance is presented in Figure 10b. Additionally, the calculated gas concentration resistance, using Equation (4), is shown in the figure. Good agreement between the approximated gas concentration resistance and the calculated value at V ˙ fuel , tot = 0.5 Nl / min was obtained.
In the following, the peaks P1 and P2 are summarized for a low frequency polarization resistance and the peaks P3 and P4 for a middle frequency resistance. P5 is evaluated separately, as it is distinguishable for all operating conditions. The low frequency polarization resistance P1 + P2 is corrected by the gas concentration resistance using Equations (4) and (5).
The peak integrals of all cells are displayed separately as functions of temperature in Figure 11. The low frequency polarization resistance P1 + P2 is by far the most dominant process of all cells. It accounts for 78–87% of the overall polarization resistance. As the temperature decreases, the peak resistances R pol , P 1 + P 2 increase. The values for the femtosecond laser-treated cells are generally higher, and cell FS35 with the wider line pitch has the highest polarization resistance. This suggests that the more pronounced macroscopic structure is not favorable. One possible explanation for the increased resistances could be a debonding of the electrode at the valleys of the macroscopic structure due to mechanical stresses during the sintering process. This was observed by Cebellero et al. [39] at the interface of a wavy structured electrolyte and the oxygen electrode. In order to explain the increased resistance in more detail, an extended optical characterization of the contact between the different layers would be necessary.
The evaluation of the joint peak integrals of P3 and P4 in the upper right part of Figure 11 reveals that the deviations between the cells are small. In general the polarization resistance of cell FS35 is slightly above that of the reference cell (1.6–7.9%) and that of cell FS20 is slightly below that of the reference cell ( 1.2 7.4 %). In the lower left part of Figure 11 the peak resistance of P5 is presented. P5 has the smallest impact on the overall polarization resistance with a share of up to 2.8%. The differences between the cells are lower than 1 m Ω cm 2 . Compared with the deviation of the larger low frequency peak, this difference may be neglected. Finally, the overall polarization resistance dependent on the temperature is shown in the lower right part of Figure 11. Due to the large impact of the low frequency polarization resistance, the values for the femtosecond laser-treated cells are generally higher. The percentage deviation with respect to the reference cell increases from 19.2% at 750 ° C to 29.1% at 850 ° C for cell FS35 and from 8.1% at 750 ° C to 19.1% at 850 ° C for cell FS20. All in all, the area-specific resistance, as the sum of the HFR and the corrected overall polarization resistance, is reduced by up to 14% for cell FS20.
In order to assign the obtained peaks from the DRT analysis to the electrodes, the gas composition at the fuel and oxygen electrode was varied. Figure 12 presents the peak integrals for the variation of the water (a) and hydrogen (b) mole fractions. For better visualization in the logarithmic plots, the markers are connected by straight lines. The low frequency peak P1 + P2 decreases for increased water and hydrogen mole fractions. A variation of the oxygen mole fraction at the oxygen electrode does not affect the low frequency peak resistance (see Figure 13). Additionally, a comparison with measurements of a symmetrical cell from the literature with the same fuel electrode as used in this study [37] shows good agreement for the size and the relaxation frequency of the low frequency polarization resistance. Thus, the peak can be assigned to a process, eventually the charge transfer process [37], at the fuel electrode. The middle frequency peak P3 + P4 behaves differently and decreases with an increased water mole fraction, but increases for an increased hydrogen mole fraction. An increasing oxygen mole fraction decreases the peak resistance slightly. It therefore appears that the electrode processes are overlapping, and a clear assignment to the fuel or oxygen electrode is not possible. Finally, the high frequency peak P5 is only affected by the variation of the oxygen mole fraction. Thus, the process is assigned to the oxygen electrode. The general behavior is very similar for all three cells and the aforementioned deviations in the discussion of Figure 11 also apply.

4. Conclusions

A femtosecond laser was used to structure the electrolyte surface assigned to the fuel electrode sides of two yttrium-stabilized zirconium samples (3YSZ). The femtosecond laser treatment enabled the ejection of submicrometer particles. Femtosecond laser treatment was used for the first time for structuring the electrochemically active layers in solid oxide cells. The objectives of the study were to investigate (i) the micro- and macrostructure of the treated surface and (ii) the impact on the electrochemical cell performance. Area processing was done by a meandering laser scan, and two different line pitches were chosen in order to evaluate different ablation rates. The treated electrolytes were analyzed by optical laser scanning microcopy (LSM) and scanning electron microscopy (SEM). In the LSM images, the macroscopic material ablation is visualized. The average electrolyte thickness was reduced by 6.5 μ m (−7.2%) for a line pitch of 35 μ m and 10.5 μ m (−11.7%) for a line pitch of 20 μ m . The more narrow line pitch induced an irregular change in altitude of up to 4 μ m , and the larger line pitch induced a wave-like change in altitude with a height difference of up to 6 μ m . Additionally, the SEM images reveal that this macroscopic structure is superimposed with significantly increased submicrometer surface roughness.
The treated electrolytes were used to build a solid oxide cell with a LSCF oxygen electrode and a Ni/CGO fuel electrode. CGO was used as a barrier and adhesion layer. Additionally, an untreated commercial cell from the same batch was used as a reference. All three cells were characterized extensively in electrolysis mode. The characterization procedure consisted of a constant current measurement and extended parameter variations of temperature and gas composition. The electrochemical performance was analyzed by measuring U,j characteristics and electrochemical impedance spectra (EIS). During the electrochemical characterization, no influence on gas tightness due to the femtosecond laser treatment was observed.
A comparison of the EIS in open circuit conditions before and after the 200 h constant current measurement revealed that the initial degradation of the treated cells was reduced. The area-specific resistance increased by 7.9% for the reference cell and by 3.2% for the laser-treated cell with a line pitch of 20 μ m . Additionally, it was found that after the constant current measurement, the area-specific resistance was reduced by up to 14% with respect to the reference cell. This was mainly attributed to decreased high frequency resistance due to the reduced thickness of the electrolyte and the probably improved contact between the structured electrolyte and the adhesion layer. The polarization resistance of all cells was further evaluated by calculating the distribution of relaxation times. The necessary regularization parameter was found by using a novel optimization method from the literature. In total, five peaks were found for each cell, and only the low frequency peaks below a frequency of 200 Hz were affected by the laser treatment.
In advance of a quantitative evaluation, an approach for the approximation of the gas concentration resistance, which was attributed to the experimental setup and not the cell itself, was presented. Based on the variation of the gas flow rate and the calculation of the peak polarization resistances, a model approach for the calculation of the gas concentration resistance from literature was fitted. The low frequency polarization resistances were then corrected by the gas concentration resistance obtained.
For both laser-treated cells, the low frequency polarization resistance increased. The highest increase of up to 29.1% was obtained for the cell with the wider line pitch. This suggests that the more pronounced macroscopic surface structure is not favorable. A possible explanation could be the debonding of the electrode in the valleys of the wave-like structure, which was observed in the literature.
In this “proof of concept” study a single laser parameter was changed. In order to detect electrochemically favorable laser processing settings, more extensive parameter variation is necessary. Additionally, the mechanical strength of the treated electrolyte should be tested in comparison to the untreated electrolytes. In order to gain more information about the long term degradation behavior, longer measurements of at least 1000 h are mandatory.

Author Contributions

Conceptualization, T.M. and T.G.; methodology, T.M. and T.G.; software, T.M.; formal analysis, T.M. and J.H.; investigation, T.M., J.H. and T.G.; writing—original draft preparation, T.M. and J.H.; writing—review and editing, T.G. and S.K.; visualization, T.M.; supervision, W.S. and S.K. All authors have read and agreed to the published version of the manuscript.

Funding

This research received no external funding.

Acknowledgments

The authors gratefully acknowledge the Energy Research Centre of Lower Saxony (EFZN) for the establishment of a discussion platform within the framework of the Competence Network for Water Electrolysis of Lower Saxony, from which this cooperation emerged. We also thank Kerafol Keramische Folien GmbH for preparing the cells and providing sample electrolytes for preliminary tests. We thank Nicolas Schlüter for providing a calculation tool to optimize the regularization parameter and Nele Geesmann for supporting the performed measurements. The Deutsche Forschungsgemeinschaft (DFG) provided the experimental setup for the electrochemical characterization as part of the major research instrumentation program with contract number INST 187/630-1 FUGG. The publication of this article was funded by the Open Access Fund of the Leibniz Universität Hannover.

Conflicts of Interest

The authors declare no conflict of interest.

Abbreviations

The following abbreviations are used in this manuscript:
ASRArea-specific resistance
CCConstant current
DRTDistribution of relaxation time
EISElectrochemical impedance spectroscopy
FS20Femtosecond laser-treated cell with 20 μ m line pitch
FS35Femtosecond laser-treated cell with 35 μ m line pitch
HFRHigh frequency resistance
LSMLaser scanning microscopy
REFReference cell
SEMScanning electron microscopy
SOCSolid oxide cell
SOELSolid oxide water electrolysis

Appendix A

Figure A1. Time evolution of the voltage change with respect to the starting voltage during a constant current (CC) measurement. For the calculation, the average cell voltage of the first hour of operation is used as the starting voltage. Results are presented for the reference cell (REF), an equal cell from another material/production batch (REF2) and the femtosecond laser-treated cells (FS35, FS20).
Energies 13 06562 g0a1
Figure A2. Residual between the measured electrochemical impedance spectra of the reference cell before CC (as shown in Figure 5) and the according Kramers-Kronig-ideal fitted spectrum provided by Lin-KK software.
Energies 13 06562 g0a2
Figure A3. Normalized results of the cross-validation test and the variance test dependent on the regularization parameter λ . The calculations are based on the electrochemical impedance spectra after the CC measurement of each cell (as shown in Figure 5).
Energies 13 06562 g0a3

References

  1. IEA. The Future of Hydrogen. Available online: https://www.iea.org/reports/the-future-of-hydrogen (accessed on 18 August 2020).
  2. Da Silva Veras, T.; Mozer, T.S.; da Costa Rubim Messeder dos Santos, D.; da Silva César, A. Hydrogen: Trends, production and characterization of the main process worldwide. Int. J. Hydrogen Energy 2017, 42, 2018–2033. [Google Scholar] [CrossRef]
  3. Arens, M.; Worrell, E.; Eichhammer, W.; Hasanbeigi, A.; Zhang, Q. Pathways to a low-carbon iron and steel industry in the medium-term—The case of Germany. J. Clean. Prod. 2017, 163, 84–98. [Google Scholar] [CrossRef]
  4. Timmerberg, S.; Kaltschmitt, M.; Finkbeiner, M. Hydrogen and hydrogen-derived fuels through methane decomposition of natural gas—GHG emissions and costs. Energy Convers. Manag. X 2020, 7, 100043. [Google Scholar]
  5. Buttler, A.; Spliethoff, H. Current status of water electrolysis for energy storage, grid balancing and sector coupling via power-to-gas and power-to-liquids: A review. Renew. Sustain. Energy Rev. 2018, 82, 2440–2454. [Google Scholar] [CrossRef]
  6. Brisse, A.; Zeller, M.; Ludwig, B.; Brabandt, J. Solid Oxide Electrolyzer System Operational at the H2 Refueling Station of Karlsruhe. Fuel Cells 2019, 19, 408–416. [Google Scholar]
  7. Lei, L.; Zhang, J.; Yuan, Z.; Liu, J.; Ni, M.; Chen, F. Progress Report on Proton Conducting Solid Oxide Electrolysis Cells. Adv. Funct. Mater. 2019, 29, 1903805. [Google Scholar] [CrossRef]
  8. Wood, A.; He, H.; Joia, T.; Krivy, M.; Steedman, D. Communication-Electrolysis at high efficiency with remarkable hydrogen production rates. J. Electrochem. Soc. 2016, 163, F327–F329. [Google Scholar] [CrossRef]
  9. Sun, X.; Hendriksen, P.; Mogensen, M.; Chen, M. Degradation in Solid Oxide Electrolysis Cells During Long Term Testing. Fuel Cells 2019, 19, 740–747. [Google Scholar] [CrossRef]
  10. Knibbe, R.; Traulsen, M.; Hauch, A.; Ebbesen, S.; Mogensen, M. Solid oxide electrolysis cells: Degradation at high current densities. J. Electrochem. Soc. 2010, 157, B1209–B1217. [Google Scholar] [CrossRef]
  11. Wang, Y.; Li, W.; Ma, L.; Li, W.; Liu, X. Degradation of solid oxide electrolysis cells: Phenomena, mechanisms, and emerging mitigation strategies—A review. J. Mater. Sci. Technol. 2020, 55, 35–55. [Google Scholar] [CrossRef]
  12. Schefold, J.; Brisse, A.; Poepke, H. 23,000 h steam electrolysis with an electrolyte supported solid oxide cell. Int. J. Hydrogen Energy 2017, 42, 13415–13426. [Google Scholar] [CrossRef]
  13. Schefold, J.; Brisse, A.; Surrey, A.; Walter, C. 80,000 current on/off cycles in a one year long steam electrolysis test with a solid oxide cell. Int. J. Hydrogen Energy 2020, 45, 5143–5154. [Google Scholar] [CrossRef]
  14. Kusnezoff, M.; Trofimenko, N.; Müller, M.; Michaelis, A. Influence of electrode design and contacting layers on performance of electrolyte supported SOFC/SOEC single cells. Materials 2016, 9, 906. [Google Scholar] [CrossRef] [PubMed] [Green Version]
  15. Laguna-Bercero, M. Recent advances in high temperature electrolysis using solid oxide fuel cells: A review. J. Power Sources 2012, 203, 4–16. [Google Scholar] [CrossRef] [Green Version]
  16. Larrea, A.; Sola, D.; Laguna-Bercero, M.; Pea, J.; Merino, R.; Orera, V. Self-supporting thin yttria-stabilised zirconia electrolytes for solid oxide fuel cells prepared by laser machining. J. Electrochem. Soc. 2011, 158, B1193–B1197. [Google Scholar] [CrossRef] [Green Version]
  17. Cebollero, J.; Laguna-Bercero, M.; Lahoz, R.; Silva, J.; Moreno, R.; Larrea, A. Optimization of laser-patterned YSZ-LSM composite cathode-electrolyte interfaces for solid oxide fuel cells. J. Eur. Ceram. Soc. 2019, 39, 3466–3474. [Google Scholar] [CrossRef] [Green Version]
  18. Heiroth, S.; Koch, J.; Lippert, T.; Wokaun, A.; Günther, D.; Garrelie, F.; Guillermin, M. Laser ablation characteristics of yttria-doped zirconia in the nanosecond and femtosecond regimes. J. Appl. Phys. 2010, 107, 014908. [Google Scholar] [CrossRef] [Green Version]
  19. Gabler, A.; Müller, C.; Rauscher, T.; Gimpel, T.; Hahn, R.; Köhring, M.; Kieback, B.; Röntzsch, L.; Schade, W. Ultrashort-pulse laser structured titanium surfaces with sputter-coated platinum catalyst as hydrogen evolution electrodes for alkaline water electrolysis. Int. J. Hydrogen Energy 2018, 43, 7216–7226. [Google Scholar] [CrossRef]
  20. Koj, M.; Gimpel, T.; Schade, W.; Turek, T. Laser structured nickel-iron electrodes for oxygen evolution in alkaline water electrolysis. Int. J. Hydrogen Energy 2019, 44, 12671–12684. [Google Scholar] [CrossRef]
  21. Rauscher, T.; Müller, C.; Gabler, A.; Gimpel, T.; Köhring, M.; Kieback, B.; Schade, W.; Röntzsch, L. Femtosecond-laser structuring of Ni electrodes for highly active hydrogen evolution. Electrochim. Acta 2017, 247, 1130–1139. [Google Scholar] [CrossRef]
  22. Suermann, M.; Gimpel, T.; Bühre, L.; Schade, W.; Bensmann, B.; Hanke-Rauschenbach, R. Femtosecond laser-induced surface structuring of the porous transport layers in proton exchange membrane water electrolysis. J. Mater. Chem. A 2020, 8, 4898–4910. [Google Scholar] [CrossRef]
  23. Schönleber, M.; Klotz, D.; Ivers-Tiffée, E. A Method for Improving the Robustness of linear Kramers-Kronig Validity Tests. Electrochim. Acta 2014, 131, 20–27. [Google Scholar] [CrossRef]
  24. Leonide, A.; Sonn, V.; Weber, A.; Ivers-Tiffe, E. Evaluation and modeling of the cell resistance in anode-supported solid oxide fuel cells. J. Electrochem. Soc. 2008, 155, B36–B41. [Google Scholar] [CrossRef]
  25. Subotić, V.; Königshofer, B.; Juričić, D.; Kusnezoff, M.; Schröttner, H.; Hochenauer, C.; Boškoski, P. Detailed insight into processes of reversible solid oxide cells and stacks using DRT analysis. Energy Convers. Manag. 2020, 226, 113509. [Google Scholar] [CrossRef]
  26. Weiß, A.; Schindler, S.; Galbiati, S.; Danzer, M.; Zeis, R. Distribution of Relaxation Times Analysis of High-Temperature PEM Fuel Cell Impedance Spectra. Electrochim. Acta 2017, 230, 391–398. [Google Scholar] [CrossRef]
  27. Hahn, M.; Rosenbach, D.; Krimalowski, A.; Nazarenus, T.; Moos, R.; Thelakkat, M.; Danzer, M. Investigating solid polymer and ceramic electrolytes for lithium-ion batteries by means of an extended Distribution of Relaxation Times analysis. Electrochim. Acta 2020, 344, 136060. [Google Scholar] [CrossRef]
  28. Wan, T.; Saccoccio, M.; Chen, C.; Ciucci, F. Influence of the Discretization Methods on the Distribution of Relaxation Times Deconvolution: Implementing Radial Basis Functions with DRTtools. Electrochim. Acta 2015, 184, 483–499. [Google Scholar] [CrossRef]
  29. Saccoccio, M.; Wan, T.; Chen, C.; Ciucci, F. Optimal regularization in distribution of relaxation times applied to electrochemical impedance spectroscopy: Ridge and Lasso regression methods—A theoretical and experimental Study. Electrochim. Acta 2014, 147, 470–482. [Google Scholar] [CrossRef]
  30. Schlüter, N.; Ernst, S.; Schroeder, U. Finding the Optimal Regularization Parameter in Distribution of Relaxation Times Analysis. ChemElectroChem 2019, 6, 6027–6037. [Google Scholar] [CrossRef] [Green Version]
  31. Schlüter, N.; Ernst, S.; Schröder, U. Direct Access to the Optimal Regularization Parameter in Distribution of Relaxation Times Analysis. ChemElectroChem 2020, 7, 3445–3458. [Google Scholar] [CrossRef]
  32. Kerafol Keramische Folien GmbH. Manufacturer Data Sheet. Available online: https://www.kerafol.com/sofc/komponenten-fuer-brennstoffzellentechnologie/elektrolytsubstrate (accessed on 20 October 2020).
  33. Primdahl, S.; Mogensen, M. Gas diffusion impedance in characterization of solid oxide fuel cell anodes. J. Electrochem. Soc. 1999, 146, 2827–2833. [Google Scholar] [CrossRef]
  34. Bessler, W.G.; Gewies, S. Gas Concentration Impedance of Solid Oxide Fuel Cell Anodes. J. Electrochem. Soc. 2007, 154, B548. [Google Scholar] [CrossRef]
  35. Geisler, H.; Kromp, A.; Hirn, S.; Weber, A.; Ivers-Tiffée, E. Model based interpretation of coupled gas conversion and diffusion in SOFC-Anodes. ECS Trans. 2013, 57, 2691–2704. [Google Scholar] [CrossRef]
  36. Sonn, V.; Leonide, A.; Ivers-Tiffe, E. Combined deconvolution and CNLS fitting approach applied on the impedance response of technical Ni8YSZ cermet electrodes. J. Electrochem. Soc. 2008, 155, B675–B679. [Google Scholar] [CrossRef]
  37. Riegraf, M.; Costa, R.; Schiller, G.; Friedrich, K.A.; Dierickx, S.; Weber, A. Electrochemical impedance analysis of symmetrical Ni/gadolinium-doped ceria (CGO10) electrodes in electrolyte-supported solid oxide cells. J. Electrochem. Soc. 2019, 166, F865–F872. [Google Scholar] [CrossRef]
  38. Bessler, W.G. Gas concentration impedance of solid oxide fuel cell anodes: I. Stagnation point flow geometry. J. Electrochem. Soc. 2006, 153, A1492–A1504. [Google Scholar] [CrossRef]
  39. Cebollero, J.; Lahoz, R.; Laguna-Bercero, M.; Larrea, A. Tailoring the electrode-electrolyte interface of Solid Oxide Fuel Cells (SOFC) by laser micro-patterning to improve their electrochemical performance. J. Power Sources 2017, 360, 336–344. [Google Scholar] [CrossRef]
Figure 1. (a) Schematic illustration of the cell type used and the position of the laser-treated surface. (b) Top view of the electrolyte and a schematic illustration of the meandering scan.
Energies 13 06562 g001
Figure 2. Scanning electron microscopy (SEM) images at the boundary of the femtosecond laser-treated area of the electrolyte with line pitches l p = 20 μ m (a) and l p = 35 μ m (b).
Energies 13 06562 g002
Figure 3. Laser scanning microscopy (LSM) images of the electrolyte with line pitches l p = 20 μ m (a) and l p = 35 μ m (b) with 50× objective lenses and 200% vertical exaggeration.
Energies 13 06562 g003
Figure 4. Time evolution of the cell voltage during the constant current (CC) measurement for the reference cell (REF) and the femtosecond laser-treated cells (FS35, FS20).
Energies 13 06562 g004
Figure 5. Electrochemical impedance spectra for the reference cell (REF) and the femtosecond laser-treated cells (FS35, FS20) before and after the 200 h constant current (CC) measurement: (a) Nyquist plot including the frequency of the HFR and the frequency at which the imaginary part of the impedance begins to deviate between the cells. (b) Bode-plot for the spectra after the CC measurement.
Energies 13 06562 g005
Figure 6. Voltage/current density characteristics for the reference cell (REF) and femtosecond laser-treated cells (FS35 and FS20) at different cell temperatures.
Energies 13 06562 g006
Figure 7. High frequency resistance (HFR) at approximately 35 kHz and open circuit conditions dependent on the cell and temperature. The given HFR is the average of all measurements at 750, 800 and 850 ° C . The curves are calculated by fitting an Arrhenius equation (Equation (1)).
Energies 13 06562 g007
Figure 8. Calculated DRT plots for the EIS measured in open circuit conditions and at the the beginning of the voltage/current density characteristics presented in Figure 4. (a) Temperature dependence of the distribution function for the reference cell. (b) Distribution function for the reference cell in comparison to the femtosecond laser-treated cells at 750 ° C .
Energies 13 06562 g008
Figure 9. Variation of the total flow rate at the fuel and oxygen electrode to reduce the gas concentration resistance of the test environment. Measurements were conducted with an additional commercial cell (Keracell III, 3YSZ), which was equal to the reference cell. Results are presented as Nyquist plots dependent on the total flow rate at the fuel electrode (a) and dependent on the total flow rate at the oxygen electrode (b). Additionally, the distribution functions for the electrochemical impedance spectra in (a) and (b) were calculated ((c) and (d)) and the peak integrals of the peaks P1 and P2 were evaluated ((e) and (f)).
Energies 13 06562 g009
Figure 10. Approximated gas concentration resistance dependent on the flow rate at the fuel electrode. R gas , i presents the measured peak resistance minus the corrected polarization resistance of the peak R pol , i * . R gas , i , fit represents the fitted function of Equation (3)). (a) Gas concentration resistance of the single peaks P1 and P2 and the total gas concentration resistance found for the sum of both peaks. (b) Approximated gas concentration resistance for another operating point compared to the gas concentration resistance calculated with Equation (4).
Energies 13 06562 g010
Figure 11. Peak integrals from the calculated distribution of relaxation times for the untreated cell (REF) and the femtosecond laser-treated cells (FS35 and FS20) dependent on the cell temperature. The peaks are labeled P1–P5, as shown in Figure 8. * The low frequency polarization resistance P1 + P2 is corrected by the gas concentration resistance (Equations (4) and (5)).
Energies 13 06562 g011
Figure 12. Peak integrals from the calculated distribution of relaxation times for the untreated cell (REF) and the femtosecond laser-treated cells (FS35 and FS20) dependent on the gas composition at the fuel electrode. The peaks are labeled P1–P5, as shown in Figure 8. (a) Variation of the water mole fraction, (b) variation of the hydrogen mole fraction. * The low frequency polarization resistance P1 + P2 is corrected by the gas concentration resistance (Equations (4) and (5)).
Energies 13 06562 g012
Figure 13. Peak integrals from the calculated distribution of relaxation times for the untreated cell (REF) and the femtosecond laser-treated cells (FS35 and FS20) dependent on the oxygen mole fraction. The peaks are labeled P1–P5, as shown in Figure 8. * The low frequency polarization resistance P1 + P2 is corrected by the gas concentration resistance (Equations (4) and (5)).
Energies 13 06562 g013
Table 1. Characterization procedure used for each cell. Temperature was changed after every parameter variation was completed.
Characterization Procedure
T in C j in A / cm 2 Fuel Electrode Oxygen Electrode
V ˙ fuel , tot in Nl / min x H 2 , x H 2 O 1 V ˙ ox , tot in Nl / min x O 2 1
CC (200 h)800 0.4 0.5 0.4 , 0.6 0.5 0.21
H 2 -variation
(5 steps)
800,
750,
850
0 0.5 0.1–0.9,
0.1
0.5 0.21
H 2 O-variation
(4 steps)
800,
750,
850
0 0.5 0.1,
0.3–0.9
0.5 0.21
O 2 -variation
(4 steps)
800,
750,
850
0 0.5 0.4 , 0.6 0.5 0.1–1
j-variation
( 0.1 A / cm 2 steps)
800,
750,
850
0 ( ) 0.5 ,
0 ( ) 0.4 ,
0 ( ) 0.6
0.2–0.8 0.4 , 0.6 0.2–0.8 0.21
U , j -characterisitc
(3 steps)
800,
750,
850
0 ( ) 0.6 ,
0 ( ) 0.4 ,
0 ( ) 0.9
0.5 0.1–0.7,
0.9–0.3
0.5 0.21
Overload850 2.5 0.5 0.1 , 0.9 0.5 0.21
1 Balanced with nitrogen.
Table 2. Summary of the high frequency resistance (HFR) and the area-specific resistance (ASR) for the reference cell (REF) and the femtosecond laser-treated cells (FS35, FS20) before and after the 200 h constant current (CC) measurement.
ParameterREFFS35FS20
Before CCAfter CCBefore CCAfter CCBefore CCAfter CC
HFR in Ω cm 2 0.7320.7860.7180.7490.6600.681
ASR in Ω cm 2 0.8850.9520.9030.9500.8370.864
Publisher’s Note: MDPI stays neutral with regard to jurisdictional claims in published maps and institutional affiliations.

