Article

A Coalitional Model Predictive Control for the Energy Efficiency of Next-Generation Cellular Networks

1
Department of Systems and Automation Engineering, Escuela Técnica Superior de Ingeniería, Universidad de Sevilla, 41092 Seville, Spain
2
Department of Electronic Engineering and Telecommunications, Facultad de Ingeniería, Universidad de Antioquia, 050010 Medellín, Colombia
*
Author to whom correspondence should be addressed.
Energies 2020, 13(24), 6546; https://doi.org/10.3390/en13246546
Submission received: 11 November 2020 / Revised: 6 December 2020 / Accepted: 9 December 2020 / Published: 11 December 2020
(This article belongs to the Special Issue Model Predictive Control System Design and Implementation)

Abstract

:
Next-generation cellular networks are large-scale systems composed of numerous base stations interacting with many diverse users. One of the main challenges with these networks is their high energy consumption due to the expected number of connected devices. We handle this issue with a coalitional Model Predictive Control (MPC) technique for the case of next-generation cellular networks powered by renewable energy sources. The proposed coalitional MPC approach is applied to two simulated scenarios and compared with other control methods: the traditional best-signal level mechanism, a heuristic algorithm, and decentralized and centralized MPC schemes. The success of the coalitional strategy is considered from an energy efficiency perspective, which means reducing on-grid consumption and improving network performance (e.g., number of users served and transmission rates).

1. Introduction

Large-scale systems such as telecommunication networks and power systems are comprised of numerous lower-dimensional subsystems that inter-operate to achieve a common goal. The subsystems are usually distributed over a wide geographical area, and it is necessary to develop control strategies to guarantee optimal system performance. From the control viewpoint, the main challenges of large-scale systems are to collect information from geographically distributed elements, coordinate control actions taken by different types of agents, and handle the coupling between subsystems.
Mobile cellular networks are large-scale systems that are expecting exponential growth in 5G and 6G systems due to the increasing number of subscribers and mobile devices. Concerning [1], over 70% of the global population will have mobile connectivity by 2023, and 5G devices and connections will be over 10% of global mobile devices and connections by 2023. The consequences of such growth in the demand for network capacity are also very well known. For the telecommunications industry, this implies a need to increase infrastructure deployment for the core and Radio Access Network (RAN), which means higher capital and operational expenditures. Note that the energy consumption costs are crucial in the operational expenditures.
In the 5G roadmap, environmentally friendliness is a mandatory characteristic defined by the International Telecommunication Union (ITU). In this sense, different alternatives have been studied to increase energy efficiency in the network segments. For example, the Study Group 5 of ITU Telecommunication Standardization Sector (ITU-T) is responsible for the environment and circular economy recommendations, and it is developing a standard called "L.1380: Smart energy solution for telecom sites" [2]. The ITU L.1380 objective is to describe techniques for the automated control of power feeding from multiple energy sources, to improve energy efficiency and reduce operating costs, e.g., using schemes that prioritize the intake of power from renewable energy sources.
Another critical issue is related to the energy consumption of the multi-functional user equipment in 5G and beyond. In this scenario, the multiband, high processing, and ultra-reliability capacities demand novel hardware solutions that facilitate cost-effective and energy-efficient user equipment design [3]. Although this paper focuses on the user-BS association process, it is essential to note that 5G is an ecosystem where each element and process plays a significant role.
Previous studies have shown that cellular networks consume about 0.5 % of the global energy supply [4,5]. This phenomenon has motivated several kinds of research focused on reducing on-grid consumption, e.g., Artificial Intelligence for Green Networks (AI4GREEN) [6] and Sustainable Cellular Networks Harvesting Ambient Energy (SCAVENGE) [7]. A common conclusion is that Base Stations (BSs) cause most on-grid consumption in cellular networks. Moreover, this consumption has a direct relationship with the traffic load [8]. From the energy efficiency perspective, mobile networks can be optimized by (i) redesigning the system to reduce energy consumption while achieving the same goals [9], (ii) reducing the energy losses [10], and (iii) changing the energy source to one with lower environmental impact [11,12]. In this paper, we focus on the energy sources and the optimization of the energy management policy to reduce consumption.
In the last few years, renewable energies have been promoted as the energy source for BSs. Various studies show that using renewable energy sources in Heterogeneous cellular Networks (HetNets) reduces network costs [13,14,15] and improves environmental factors [16]. Another appealing aspect is deploying infrastructure in off-grid and connection limited scenarios such as developing countries and disaster zones. Therefore, Next-Generation Cellular Networks (NGCNs) can become self-sustainable systems thanks to renewable energy sources [17].
The design of policies to reduce grid consumption in NGCNs is deeply connected with the user-BS association algorithms [18] since it determines how the network uses its resources to serve users. In the literature, it can be found several strategies to solve the load-balancing problem in HetNets. For example, Andrews et  al. [19] presented a survey of approaches for load-balancing in HetNets. There is a need for exploring new load-balancing mechanisms because the problem of associating users with BSs is Non-deterministic Polynomial-time hard (NP-hard) and may not be tractable even for small-sized HetNets. From the energy efficiency perspective, Zhou et al. [20] proposed a heuristic algorithm for target-cell selection combined with a power control algorithm for coverage optimization to guide users towards BSs with renewable energy supply in the handover process. Likewise, Han and Ansari proposed to optimize the use of renewable energy by cell-size optimization [21]. To this end, they divided the problem into two parts: a multi-stage energy allocation problem, and a multi-BS energy balancing problem. In [22], an off-line algorithm to optimize the renewable energy allocation across different time instants was proposed to minimize the on-grid energy consumption of a base station. In [23], the classic optimal-transportation approach to study the mobile association problem in cellular networks was employed. In [24], a profit-driven user association scheme by jointly considering the traffic delivery latency and renewable energy application was proposed to maximize the benefits of network providers in HetNets. These approaches differ from our proposal, which considers that the network structure can be dynamically clustered in sets of cooperating BSs (also known as coalitions) to optimize consumption and coordination overheads with energy and traffic forecast information.
In the control field, Model Predictive Control (MPC) stands for a family of control methods based on the receding horizon principle and can deal with multiple variables systems and complex issues such as delay times, constraints, and uncertainties [25]. A system model is used to predict its behavior, and the controller optimizes its evolution according to a specific cost function and the given constraints. For example, in [26], an MPC was implemented to handle the power signal in base stations and decrease the unfavorable influence of disturbances in the transmission process. Moreover, co-channel interference via distributed power adaptation with MPC was reduced in [27]. Nevertheless, the significant computation burden required to solve a centralized MPC can make it impossible or greatly difficult to implement in real time. For that reason, the divide-and-rule policy of distributed MPC techniques has been widely established over the last few decades to deal with large-scale problems [28]. A halfway approach is the coalitional MPC [29,30], which considers a dynamic system partition to find a trade-off between local performance and coordination overheads.
Relevant challenges such as network and energy management appear when renewable energy is used in NGCNs [31]. In this context, coalitional MPC becomes a suitable control strategy. The motivation of this work is to provide an efficient controller that holds the quality of service while reducing on-grid consumption. Moreover, the scalability of the method is also important to deal with the large spatial distribution of cellular networks. Hence, the main contribution of the article is to assess how Long-Term Evolution (LTE) systems powered by hybrid energy sources can be more sustainable in a scalable manner by using coalitional MPC. Likewise, unlike other studies such as [9,32,33], we propose a more realistic internal model for the controller that considers that the transfer of users between base stations is limited to neighboring base stations.
Furthermore, the proposed coalitional approach is compared with the traditional best-signal-level strategy, a reactive control scheme based on an energy-aware user-BS association mechanism [33] and decentralized and centralized MPC methods. These strategies are tested in two simulated scenarios: (i) an academic example with 9 BSs, and (ii) a complex scenario with 37 BSs. Results show that the proposed control scheme becomes a suitable option to reduce on-grid consumption while maintaining proper service levels to users.
Finally, a much earlier and shortened version of the proposed method was accepted for a conference presentation [34]. There are significant differences between the current article and the conference paper: (i) the conference version does not include the large scenario with 37 BSs, which represents the complexity of real problems; (ii) we present here new, improved methods for the selection of topology; (iii) a more realistic internal model for the controller is used that only considers user transfer between neighboring base stations; (iv) several refinements in the main algorithm are introduced in the current version; and (v) the experiments here performed are new and include the previously mentioned novelties.
The outline of the rest of the article is as follows. The problem statement is described in Section 2. The coalitional MPC algorithm and other assessed user-BS association techniques are detailed in Section 3. The control schemes are assessed in two simulated scenarios in Section 4. Finally, the authors discuss the results and give concluding remarks in Section 5.
Notation: N 0 + and R > 0 are, respectively, the sets of non-negative integers and positive real numbers. R n represents an n-dimensional set of real numbers. For set X { 1 , , X } R n , its cardinality is | X | = X , and the subtraction of an element i X from X is denoted as X \ { i } . The modulo operation is mod ( a , b ) , with a , b being positive integers. Given a set C M , the generalized union of sets is represented as  C M C .

2. Problem Description

Let us define a two-tier downlink HetNet as depicted in Figure 1, which is divided into B = { 1 , 2 , , B } base stations: a high-power Macro-cell Base Station (MBS) and numerous low-power Small-Cell Base Stations (SCBSs). In particular, the MBS is full-time available and connected to the electricity grid, while each SCBS is locally fed by renewable energy and equipped with a storage battery. Although primary coverage is provided by the MBS, the implementation of SCBSs broadens the network capacity since they receive data traffic from the MBS.
For simplicity, we follow the setting of [35,36] so that the inter-BS interference is modeled as a static value that includes the influence of other BSs in the network. This value varies depending on the activities in the interfering BSs, which can be coordinated via time-domain, frequency-domain, and power-control techniques [37]. Additionally, this simplification allows us to model the network as an MBS and multiple SCBSs without lacking generality.

2.1. Base Station Dynamics

The discrete-time dynamics of each base station i B is:
x i ( k + 1 ) = A i x i ( k ) + j C i ( k ) B i j u i j ( k ) + w i ( k ) ,
where k N 0 + is the time instant; x i = [ x i z , x i b ] is the state vector comprised by x i z , which represents the users served by i, and  x i b , which is the energy stored in the battery of i. Input u i j is user flow, i.e., the amount of users exchanged between i and j, which belongs to the set of subsystems cooperating with i, namely C i . Hence, it is satisfied that u i j = u j i for i , j C i , and  u i j = 0 for all j C i . Moreover, A i is the state matrix, and  B i j is the input-to-state matrix from neighbors j C i . The disturbance vector w i R 2 consists of the traffic generated by the incoming and outgoing users and the atmospheric conditions that influence the production of renewable energy.

2.2. Coalition Dynamics

Each subsystem i B is governed by a local controller with partial information regarding the overall system state. The set of controllers can cooperate in a topology network described by an undirected graph ( B , L ) , where L is the set of links or edges L L B = { i , j } | { i , j } B , i j . Each link provides a bidirectional information flow between BSs i and j that can be enabled or disabled by the control scheme. Each enabled link involves a fixed cooperation cost c link R > 0 , which will be selected large enough to stimulate cooperation, considering that a small value and a huge value will always lead to a centralized and a decentralized network, respectively. The active links L | L | define the network topology Λ T at time instant k. The set of all possible topologies is T { Λ 0 , Λ 1 , , Λ 2 | L | 1 } , where the decentralized topology is Λ dec = Λ 0 and the centralized one is Λ dec = Λ 2 | L | 1 . Should there be a substantial number of links, a subset of topologies can be considered to avoid combinatorial explosion issues.
Thanks to the capacity of the MBS to deal with all incoming users (at the cost of reducing its quality of service), coalition problems can be decoupled. Given topology Λ , the disjoint set of coalitions is represented as B / Λ with C B / Λ C = B . The discrete-time dynamics of each coalition C is:
x C ( k + 1 ) = A C x C ( k ) + j C ( k ) B C u C ( k ) + w C ( k ) ,
where x C = ( x i ) i C and u C = ( u i j ) i , j C are, respectively, the aggregated state and input vectors of all base stations in C , and disturbance w C represents disturbances caused by the effect of the weather and the coupling with neighboring coalitions.

2.3. Energy Consumption Model

The energy consumption model here employed was proposed by project EARTH and has been widely used in studies related to energy efficiency in cellular networks [35,38,39]. According to EARTH, the energy consumed by base station i B is given by dynamic and static energy consumption as in [8]:
E i ( k ) = Δ i δ i ( k ) T i + E i S , i B ,
where Δ i is the slope of the load-dependent energy consumption; δ i denotes the traffic load; T i is the transmission power; and E i S is the static energy consumption, which is relevant to the amount demanded for the appropriate operation of a base station. Note that the dynamic energy consumption is the additional energy required to cope with the traffic load.
Since the total consumption is the sum of the on-grid consumption of the MBS ( i = 1 ) and the renewable energy consumption of all SCBSs i B \ { 1 } , the reduction of grid consumption is crucial to increase energy efficiency. Finally, the available renewable energy E i G in SCBS i at time instant k is:
E i G ( k ) = E i G ( k 1 ) E i ( k 1 ) + φ ( k ) ,
where E i G ( k 1 ) and E i ( k 1 ) are, respectively, the stored and consumed renewable energy at time instant k 1 , and  φ ( k ) is the renewable energy generation rate at time instant k.
One of the main issues of renewable energy is the management of the stored energy, especially how to maintain appropriate quality of service levels according to renewable energy availability. In this sense, it is crucial to design a mechanism that guarantees the continuity of the service in periods without renewable energy arrival.

2.4. Data Traffic Model

Let us define the geographical area A where BSs are spatially distributed at positions p A and a set of available base stations B z ( k ) B that provides service to user z Z { 1 , 2 , , Z } at time instant k. The spatial variability of traffic requests is considered and modeled as a Non-Homogeneous Poisson Process (NHPP) as in [36]. The traffic size, the arrival rate per area λ p , and the average traffic size μ p for all p are independently distributed.
The transmission rate r z i p of a mobile user z Z can be generally calculated according to the Shannon–Hartley theorem [36] as:
r z i p ( k ) = B W i log 2 1 + ψ z i p ( k ) , z Z , i B z ( k ) , p A ,
with B W i being the working bandwidth for all i B z ( k ) ; and ψ z i p being the received signal at location p from i, which is given by the Signal-to-Interference-plus-Noise Ratio (SINR) as:
ψ z i p = T i g i p σ 2 + j B z \ { i } T j g j p , i , j B z ( k ) ,
where T i is the transmission power of i; the channel gain between BS i and the user at position p is g i p , which captures the slow fading signal containing path loss and shadowing; and finally, σ 2 is the noise power level. Notice that the denominator depicts the interfering BSs transmission towards user z at location p as Gaussian noise. Moreover, ψ z i p must be higher than a threshold ψ min so that user z has enough signal level and can be associated with i. For simplicity, the location indicator p will be omitted when referring to user z.
Each SCBS i B z \ { 1 } is assumed to serve a fixed number z i max of users simultaneously. Conversely, the service is full-time guaranteed because the MBS offers an unlimited user service. Considering users uniformly distributed in A , the traffic load δ i is:   
δ i ( k ) = { z Z y z i ( k ) z i max , i B z ( k ) \ { 1 } z Z y z i ( k ) | Z | , otherwise
where y z i represents the user association indicator, i.e.,  y z i = 1 when user z is attended by i and  y z i = 0 otherwise. Additionally, the traffic load is bounded by 0 δ i ( k ) 1 for all i B z ( k ) .

2.5. On-Grid Energy Consumption Optimization Problem

Reducing on-grid consumption is a design requirement in NGCNs. Regarding Equation (3), the energy consumption of i B depends on traffic load δ i , i.e., the number of active users connected to a base station. Let us define the vector of MBS-user association indicators as Y z 1 ( k ) [ y 11 ( k ) , , y Z 1 ( k ) ] . The objective is to minimize the number of users connected to the MBS as:
Y z 1 ( k ) * = arg min Y z 1 ( k ) k = 1 N z Z y z 1 ( k ) ,
subject to
z Z y z i ( k ) z i max , i B \ { 1 } ,
y z i ( k ) · ψ z i ( k ) p ψ min , z Z , i B z ( k ) ,
i B y z i ( k ) 1 , z Z ,
y z i ( k ) { 0 , 1 } , z Z , i B ,
where k [ 1 , N ] N 0 + with N being the simulation length, Equation (8a) is the cost function to minimize, and inequality Equations (8b)–(8e) are the problem constraints: Equation (8b) establishes that SCBSs can serve a maximum of z i max users simultaneously; Equation (8c) is the user’s received signal level constraint; Equation (8d) requires that a user is served only by one BS in a time instant; and finally, Equation (8e) establishes that y z i is a binary variable. Note that the optimization problem is solved according to the specific network characteristics at each time instant k. This fact allows considering the variability of renewable energy sources in the solution.
The optimization problem Equation (8a) is a Mixed-Integer Linear Problem (MILP), a well-known NP -hard problem [40]. The coalitional MPC control strategy proposed in this paper relaxes this problem to provide a suitable alternative to achieve a sub-optimal solution with reduced computation and cooperation burden. The next section shows how user-BS association decisions are made by a supervisory controller, which relates the number of users at the BS with the corresponding battery level. Thus, users will be initially associated with their closest base station. Later on, sets of cooperating BSs will decide whether to exchange users to obtain a trade-off between energy efficiency and service levels.

3. Control Methods

This section details the proposed coalitional MPC algorithm and other assessed methods: (i) centralized and decentralized MPC, which provide, respectively, an upper and lower bound of the performance; (ii) an energy-aware heuristic method; and (iii) the best-signal-level technique, which is a well-known user BS-association strategy. Unlike other studies such as [9,32,33], we here propose a more realistic internal model for the controller that considers that the transfer of users between base stations is limited to neighboring base stations.

3.1. Coalitional MPC

This strategy promotes dynamic cooperation between local controllers to improve coordination, giving rise to the so-called coalitions, which implement an MPC controller to calculate the most appropriate control actions at the coalition level and optimize the overall system performance. At each time instant, optimal inputs are calculated for a prediction horizon of N p time steps according to a cost function. The first component of the optimal input sequence is applied, and the remaining elements are then discarded. This procedure can be depicted as a sliding window optimization process over time because it is repeated at each time instant [28].
For the centralized control, the problem is solved by a single agent with full information. Nevertheless, this setup scales very poorly due to the increase of the computational burden with the problem size. By contrast, non-centralized architectures are often preferred due to to their inherent redundancy in the decision making process. One possible solution is to solve the centralized problem in a distributed fashion using distributed algorithms, but this can only be done at the expense of increasing the cooperation effort, which can be measured in terms of computation and communication burden. In general, the more agents involved in a negotiation, the more iterations required to attain an agreement. Hence, one may be willing to pay a cost in terms of performance if the cooperation burden can be decreased. To this end, we introduce a communication cost penalty in the problem setup.
Each communication link l L , which involves a cost c link R > 0 , can be either enabled or disabled. Note that the role played by this cost is crucial in this context. Otherwise, there would be no incentive to disable links, and full communication would be used because it provides the best control performance. However, this latter fact may cause the overall control problem to be significantly large to be solved in real-time, and the use of specific links is restricted due to the energy consumption constraints.
The objective of coalition C is to optimize the cost function J C ( · ) , which is the sum of a stage cost function l C x 1 z ( k ) and a penalty function, at each time instant k:
J C x 1 z ( k ) , δ C ( k ) = t = 0 N p 1 x 1 z ( k + t ) Q x 1 z ( k + t ) l C x 1 z ( k ) + δ C ( k + t ) α C δ C ( k + t ) ,
where x 1 z ( k + t ) is the amount of users served by the MBS at the corresponding time slot t of the prediction horizon; Q > 0 is a constant weighting parameter that penalizes the number of users at the MBS; α C R + is a weighting parameter; and δ C ( k + t ) is a slack variable used as a soft constraint.
The proposed coalitional MPC algorithm presents a hierarchical control architecture [29], where an upper layer computes the best new topology every T up instants, considering the current disturbances. Specifically, it explores the set of potential successor topologies T new T with a search strategy to select the new topology. The set T new is formed by those topologies Λ T that only differ one link with respect to the current topology Λ cur , i.e., those whose Hamming distance is one, as follows:
T new { Λ Λ cur : | Λ | = | Λ cur | 1 } { Λ cur Λ : | Λ | = | Λ cur | + 1 } .
Once the topology Λ new T new is selected, it is sent to the lower control layer where coalitions must be formed in accordance with this topology.
Let us define the vector of user flow of coalition C B / Λ as:
U C ( k ) [ u C ( k ) , u C ( k + 1 ) , , u C ( k + N p 1 ) ] .
The objective is to minimize the user flow from coalition C to the MBS at each time instant k:
{ U C ( k ) * , δ C ( k ) * } = arg min U C ( k ) , δ C ( k ) J C x 1 z ( k ) , δ C ( k ) ,
subject to Equation (2) and:   
i , j C u i , j ( k + t ) F i , j ( k + t ) , t = 0 , , N p 1 ,
j C u i , j ( k + t ) = x i z ( k + t ) , i B , t = 0 , , N p 1 ,
u i , j ( k + t ) 0 , i , j B , t = 0 , , N p 1 ,
δ C ( k + t ) 0 , i C , t = 0 , , N p 1 ,
x C ( k + t ) + δ C ( k + t ) 0 , t = 1 , , N p ,
G x C x C ( k + t ) + δ C ( k + t ) g x C , t = 1 , , N p ,
where Equation (11b) indicates that the sum of user flows between two BSs cannot pass an upper limit; Equation (11c) imposes flow conservation, that is that the sum of user flows must be equal to the served users x i z ; Equation (11d) and Equation (11e) define, respectively, that user flows and the slack variable must be positive; Equation (11f) imposes that the sum of the state vector and slack variable must be positive; and finally, limits G x C and g x C define a convex set containing the origin in its interior, i.e., Equation (11g) constrains the number of users served and the battery level of SCBSs as 0 x i z z i max and 0 x i b b i max , respectively.
Finally, the proposed Algorithm 1 is summarized as follows.
Algorithm 1: Coalitional MPC.
Initial data: N , T up , Q , F i , j , z i max , b i max , c link , α C .
Starting point: k = 0 , Λ = Λ cen , x i = x i ( 0 ) .
Main program:
for k N 1 do
  if mod ( k , T up ) = 0 then
   1: The upper control layer measures states x C ( k ) and disturbances w C ( k ) , C B / Λ .
   2: The upper layer computes the set T new (Equation (10)) and solves Equation (11) subject
   to Equation (2) for each T new T . Afterwards, the topology Λ T new with the lowest cost
   is selected.
   3: Send the new topology Λ to the lower control layer.
   4: Apply the first element of U C * ( k ) to coalition system (Equation (2)), for all C B / Λ .
  else
   5: In the lower layer, each coalition C solves Equation (11) subject to its dynamics and
   constraints.
   6: Apply the first element of U C * ( k ) to coalition system (Equation (2)), and obtain x C ( k + 1 ) ,
    C B / Λ .
  end if
  7: Set k k + 1 .
end for

3.2. Centralized and Decentralized MPC

In centralized MPC, full communication is enabled, and hence, there is only one cooperation component C = B . The discrete-time dynamics of the overall system is:
x B ( k + 1 ) = A B x B ( k ) + j B B B u B + w B ( k ) .
Therefore, Equation (11) is computed each k for the great coalition C = B . Since there is full system information, the sheer performance is better than coalitional control. However, this technique needs full cooperation each time instant, leading to a higher computation burden and cooperation costs, which may hinder its implementation.
Conversely, when there is no cooperation between agents, Equation (11) is solved for C = { i } , i B at each time instant k. This fact occurs in decentralized MPC, where each coalition is formed by a single local controller that manages each base station (Equation (1)). A lack of full information leads to worse performance than a coalitional strategy at the expense of reducing the computation burden.

3.3. Energy-Aware Heuristic

In [33], the authors proposed a renewable energy-aware user equipment-BS association (named green association) to reduce the on-grid energy consumption in HetNets supplied with hybrid (grid and renewable) energy sources.
Given the impact of active users on the overall energy consumption, the proposal focuses on minimizing the on-grid consumption by balancing the downlink traffic loads among BSs with an appropriate user-BS association scheme. The reactive control scheme modifies the BS-selection procedure by prioritizing renewable-powered BSs over a grid-powered MBS.

3.4. Best-Signal-Level Policy

Traditional cellular networks employ the best-signal-level policy, which consists of mobile users connecting to the BS with the best SINR. Issues such as power transmission, path loss, and interference with other BSs can influence the SINR of a base station. Conversely, the best-signal-level mechanism (referred to as the traditional scheme) is not fully suitable for hybrid-energy HetNets because available SCBSs can be ignored by users who receive a stronger signal from the MBS [41]. The traditional scheme will be used as the baseline to assess the proposed coalitional MPC algorithm and other MPC-based schemes.

4. Illustrative Examples
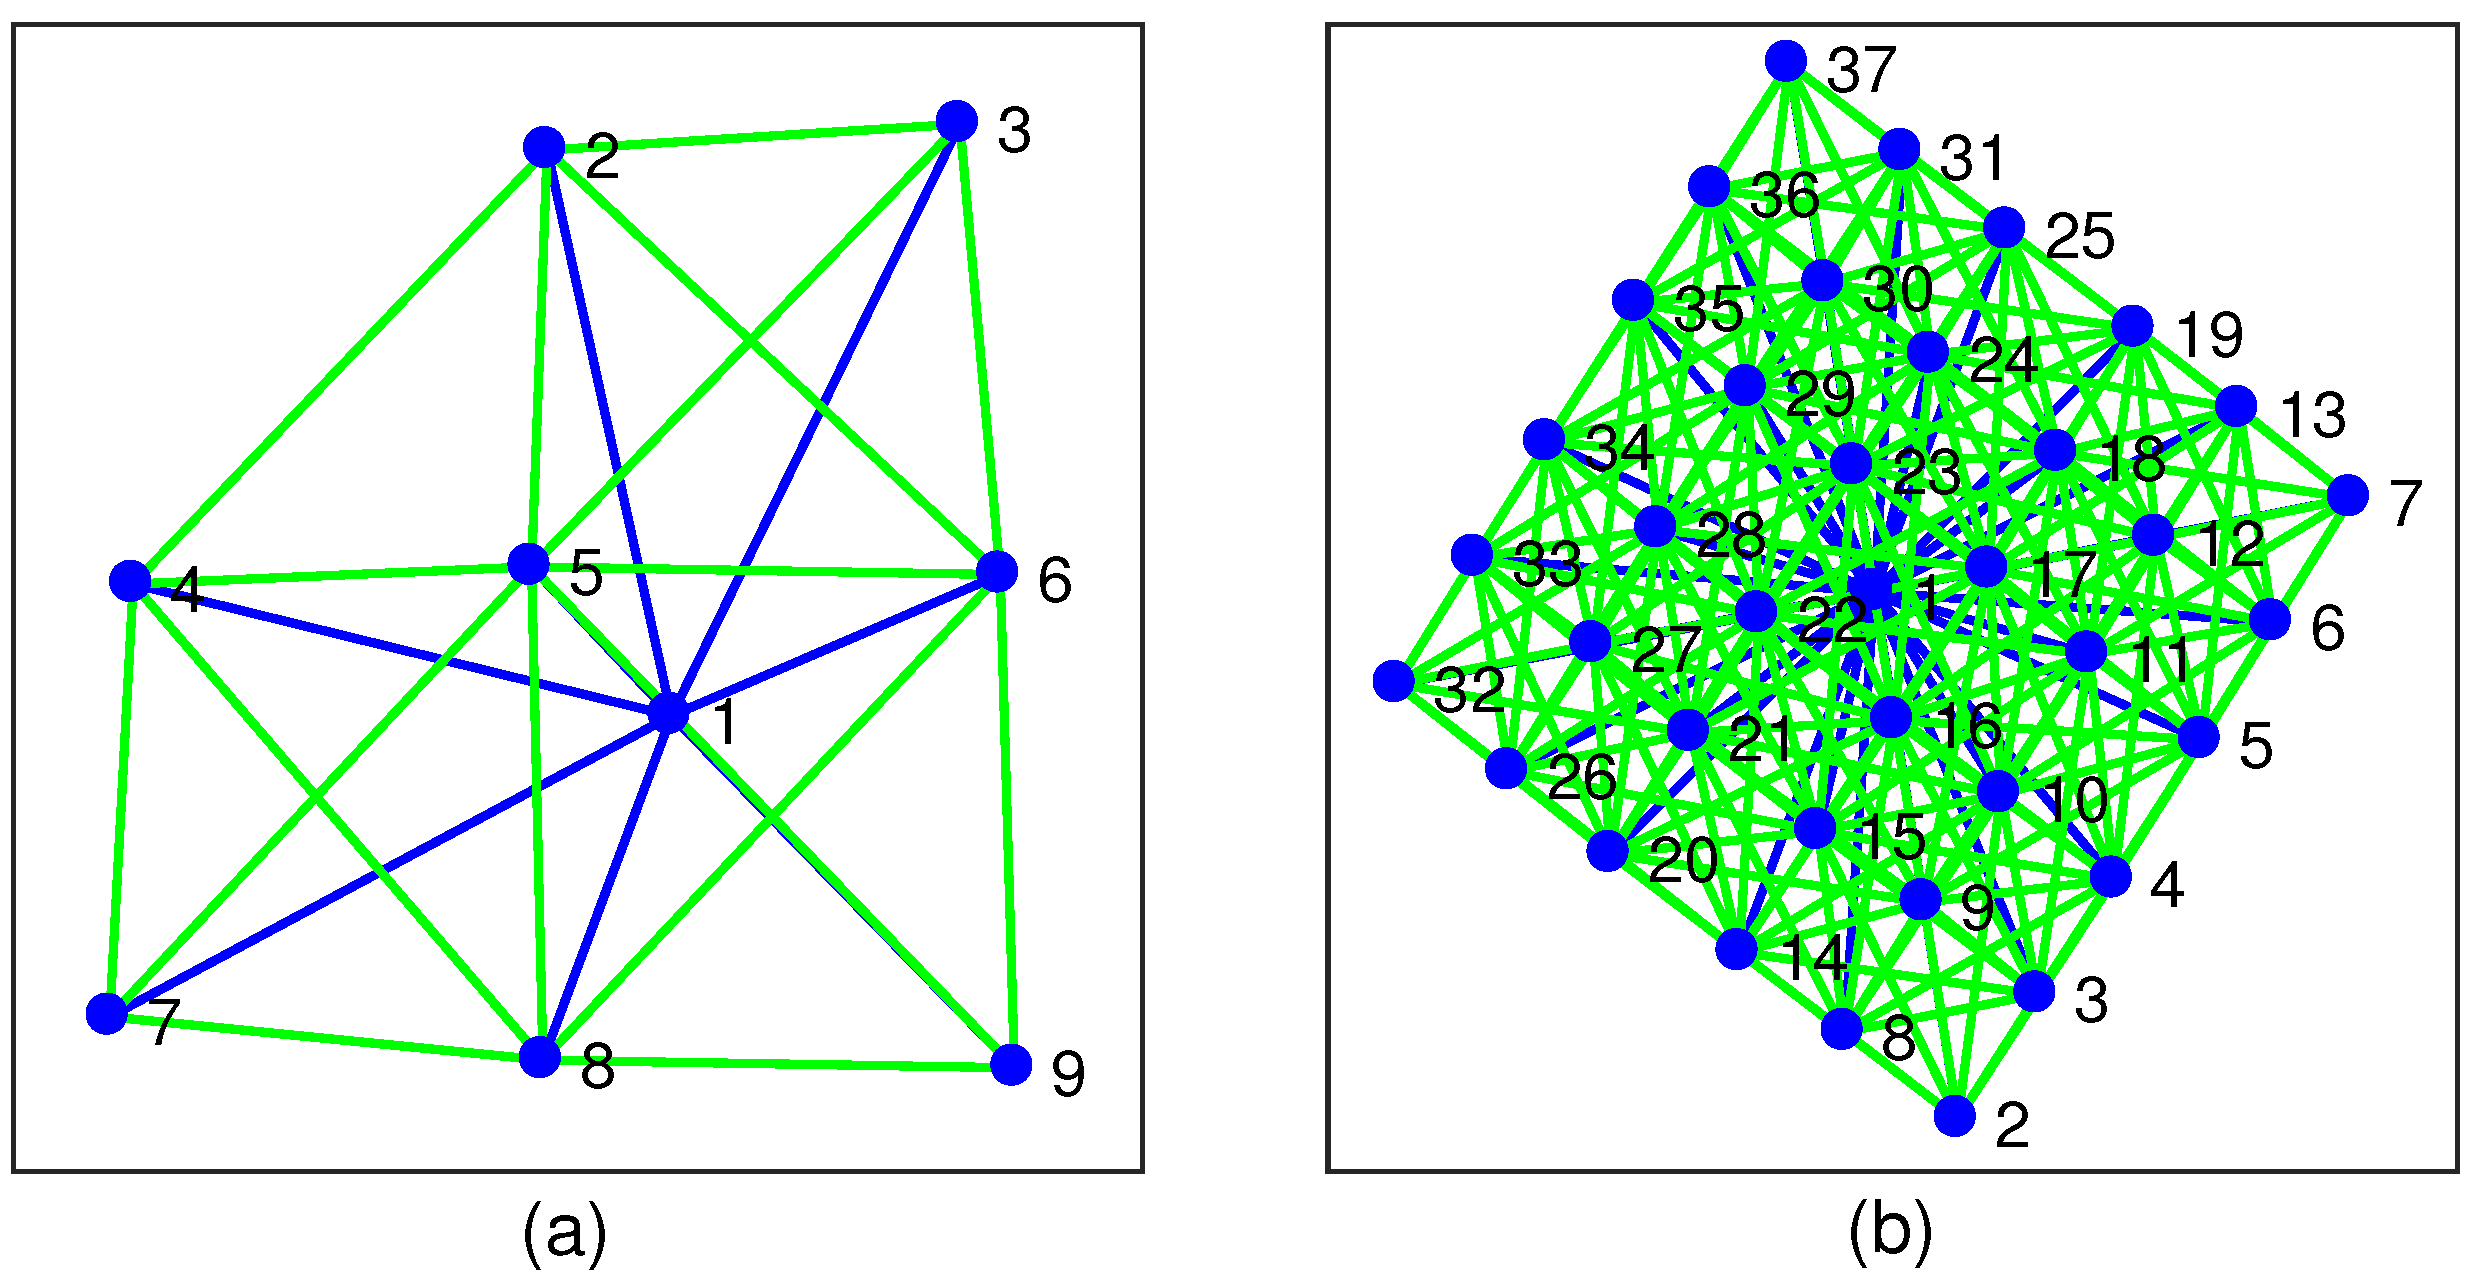
Controllers are assessed in the MATLAB environment. To this end, two case studies that consist of a two-tiered downlink HetNet composed of an MBS and multiple SCBSs are considered. Mainly, it is the impact on grid energy consumption and stored energy management that we want to analyze.

4.1. Case Studies

The following two simulated HetNets are proposed to test the proposed coalitional MPC algorithm:
  • An academic scenario with a set of B = { 1 , , 9 } base stations (one MBS and eight SCBSs), which is sophisticated enough to show the potential of the proposed method (see Figure 2a). The complexity of the association process is caused by the number of BSs and active users.
  • A large scenario with a set of B = { 1 , , 37 } base stations (one MBS and 36 SCBSs), which represents the complexity of real problems (see Figure 2b). In this case, it is only possible to compare the proposed method with a heuristic approach.
In both cases, the MBS is fed by on-grid energy to ensure coverage over the area. On the other hand, SCBSs are locally fed by renewable energy and equipped with storage batteries. Only path losses between users and BSs are considered. Furthermore, user requests follow a Homogeneous Poisson Process (HPP) with λ p = λ for simplicity.

4.2. Simulation Parameters
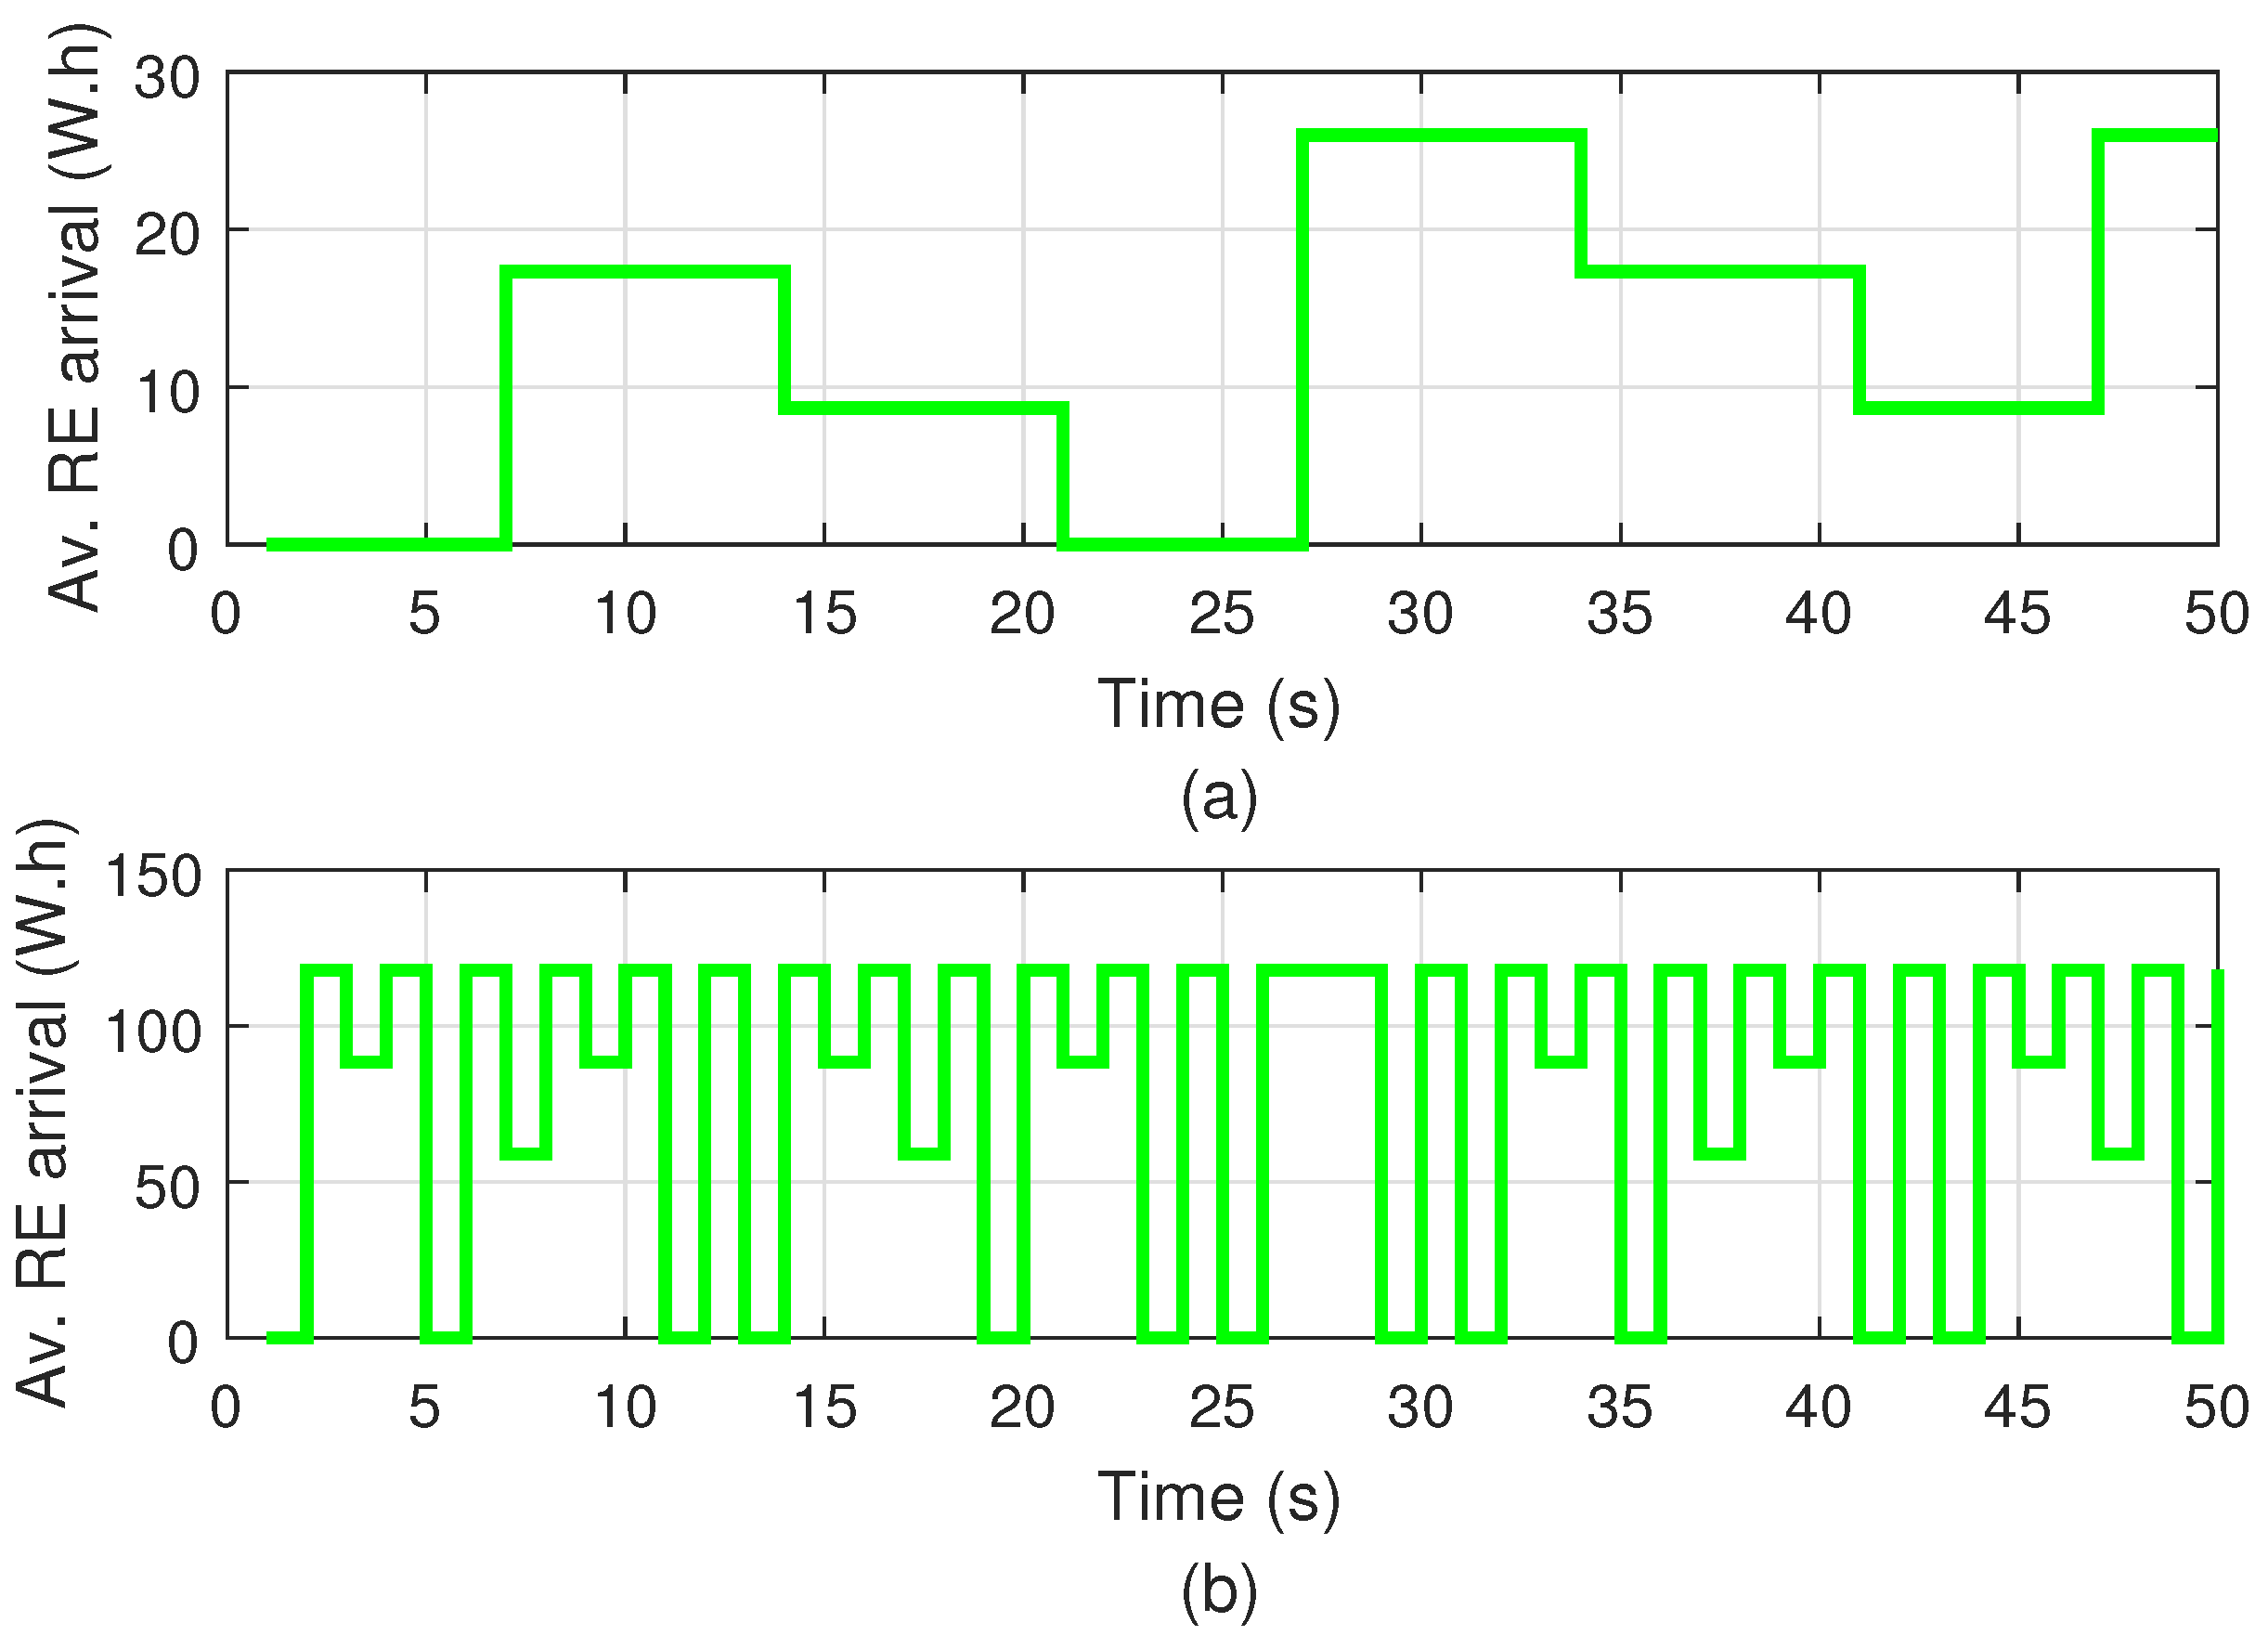
The implementation of user-BS association controllers is assumed to be faster than the dynamics of user traffic. When new information is available, the calculations are updated accordingly. Moreover, changes in renewable energy arrival and the spatial variability in the behavior of active users are considered in a simulation of N = 50 time instants. According to [8], a summary of the simulation parameters is displayed in Table 1. The impact of tuning parameters in coalitional control has been explored in other references such as [29,42,43]. In this case, we keep the parameters constant so as to focus on the difference of performance between the centralized optimization and the proposed method, which is the main goal of the article.
Furthermore, 5G defines three general bands for the deployment of its services, named low band (<1 GHz), mid-band (between 1 GHz and 6 GHz), and high band (<6 GHz). In this work, we consider the scenarios in mid-band frequencies, based on the fact that these frequencies were thought to improve simultaneously capacity and coverage.

4.3. Disturbances

In addition to the input and output of users, base stations are affected by disturbances such as weather, which determines renewable energy generation. The renewable energy arrival, which determines clusters of SCBSs during specific periods, can be estimated with sensor measurements. In this way, active BSs change according to a pre-defined sequence while users are moving. In Figure 3, the average renewable energy arrival is represented, and Figure 4 depicts the users’ balance for the BS # 9 in both scenarios. Notice that outgoing users are also taken into account over the simulation. The MPC controller uses this information to reduce on-grid consumption.

4.4. Key Performance Indicators

Furthermore, the following Key Performance Indicators (KPIs) are proposed to compare the control schemes presented in Section 3:
  • Grid consumption (kWatts-hour).
  • Reduction of grid consumption (%) in comparison with the best-signal level mechanism.
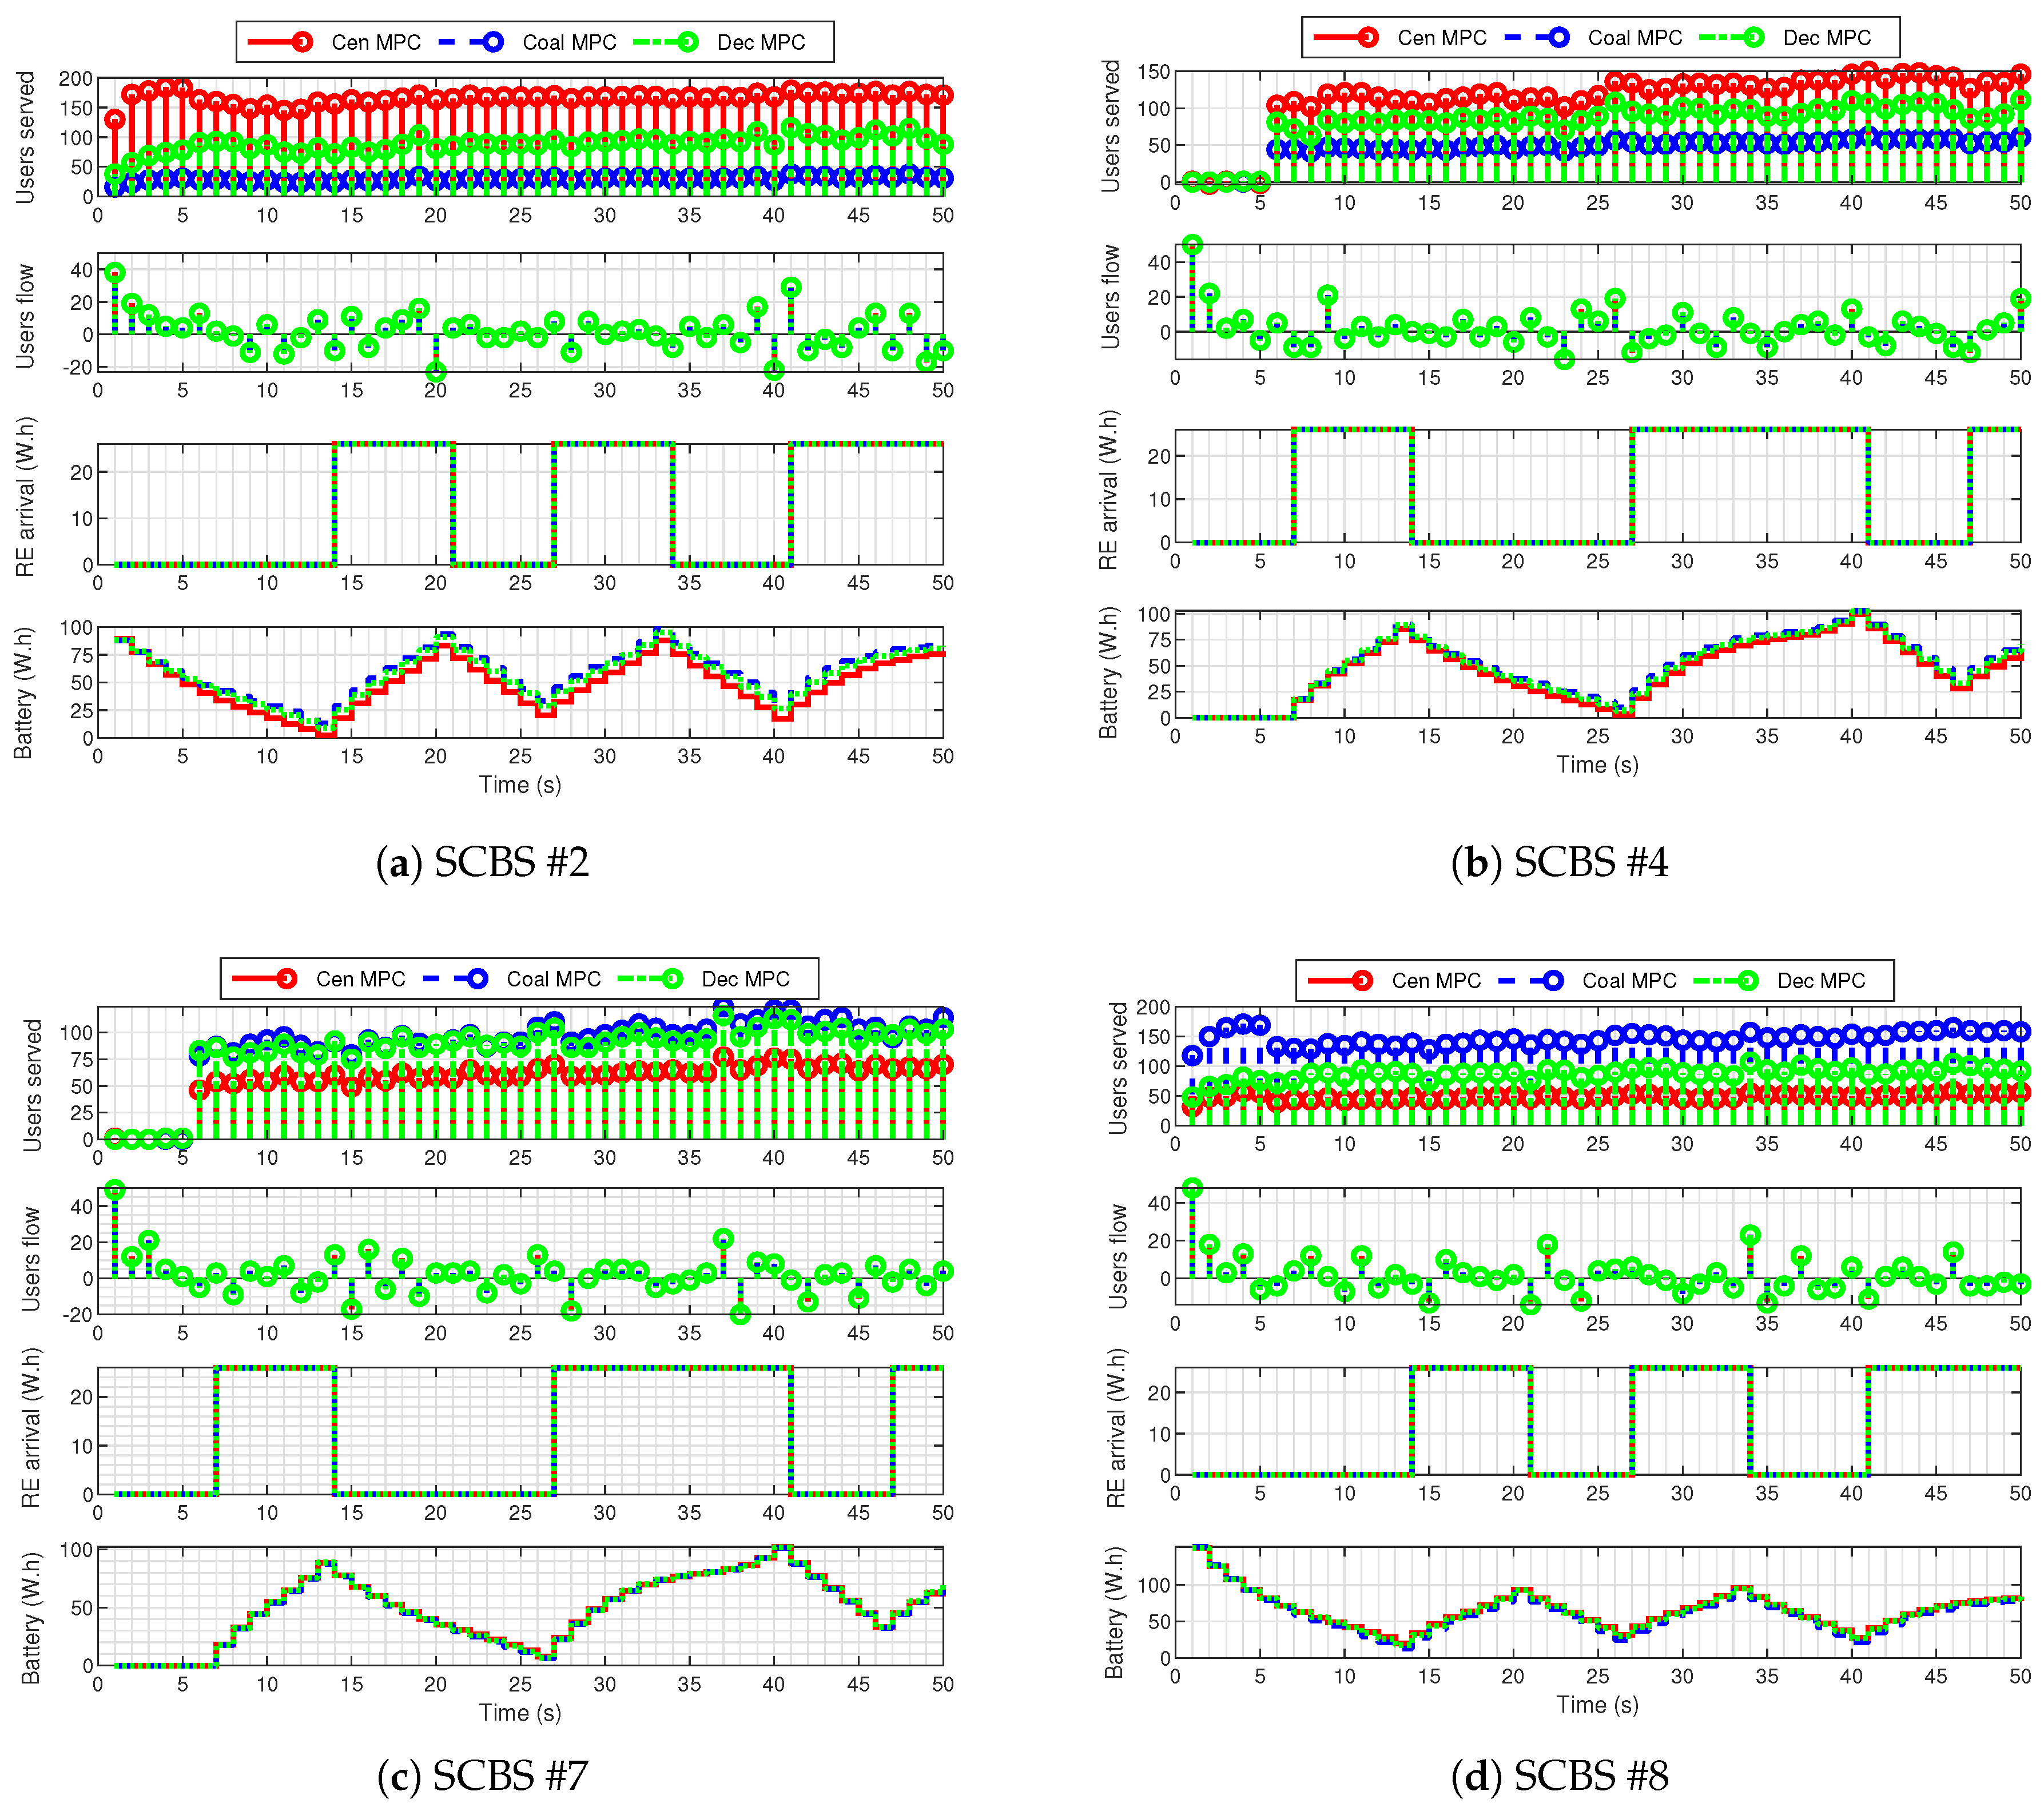
  • Average stored energy (Watts-hour).
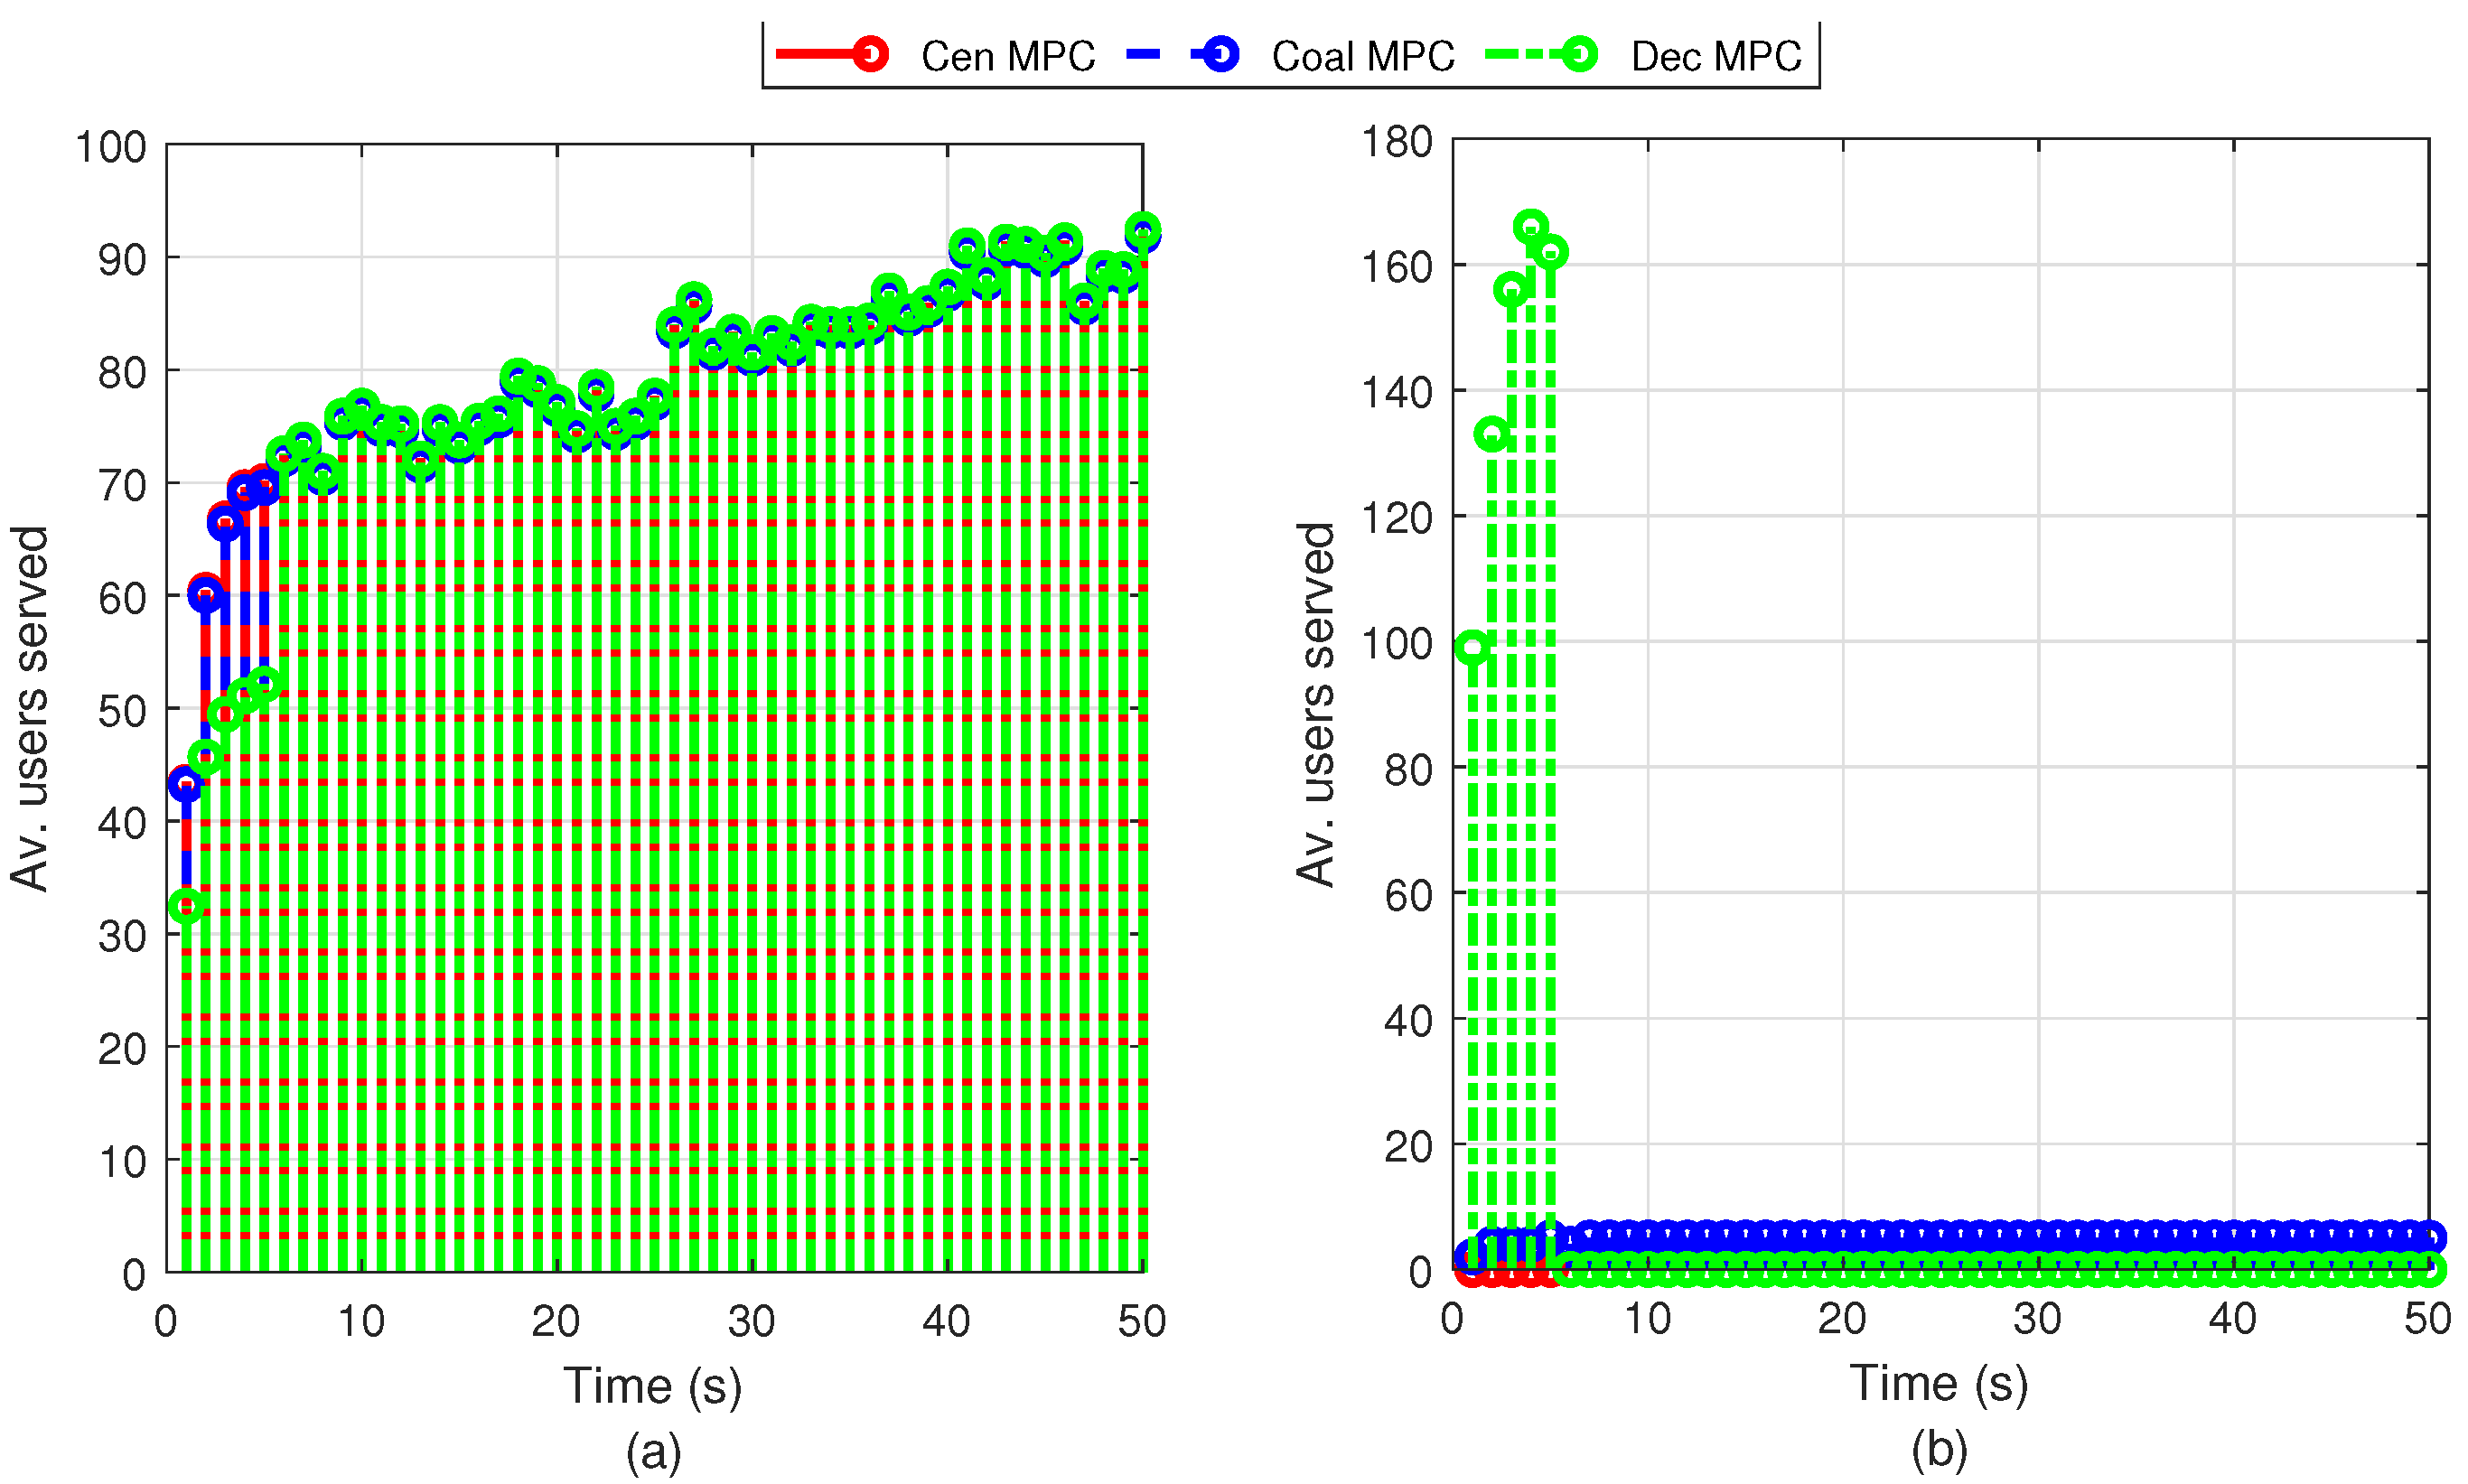
  • Users served (%).
  • Average transmission rate (%) in comparison with the best-signal level mechanism.
  • Performance cost, which is defined as the sum of the accumulated stage cost over the simulation:
    J perf = k = 1 N C B / Λ l C x 1 z ( k ) .
  • Cooperation cost, which is defined as the sum of the cooperation cost over the simulation:
    J coop = k = 1 N C B / Λ g C L Λ ( k ) ,
    with g C L Λ ( k ) = c link L Λ ( k ) , where we recall that c link R > 0 is the cost per active link, and L Λ ( k ) denotes the number of enabled links in topology Λ at time instant k.

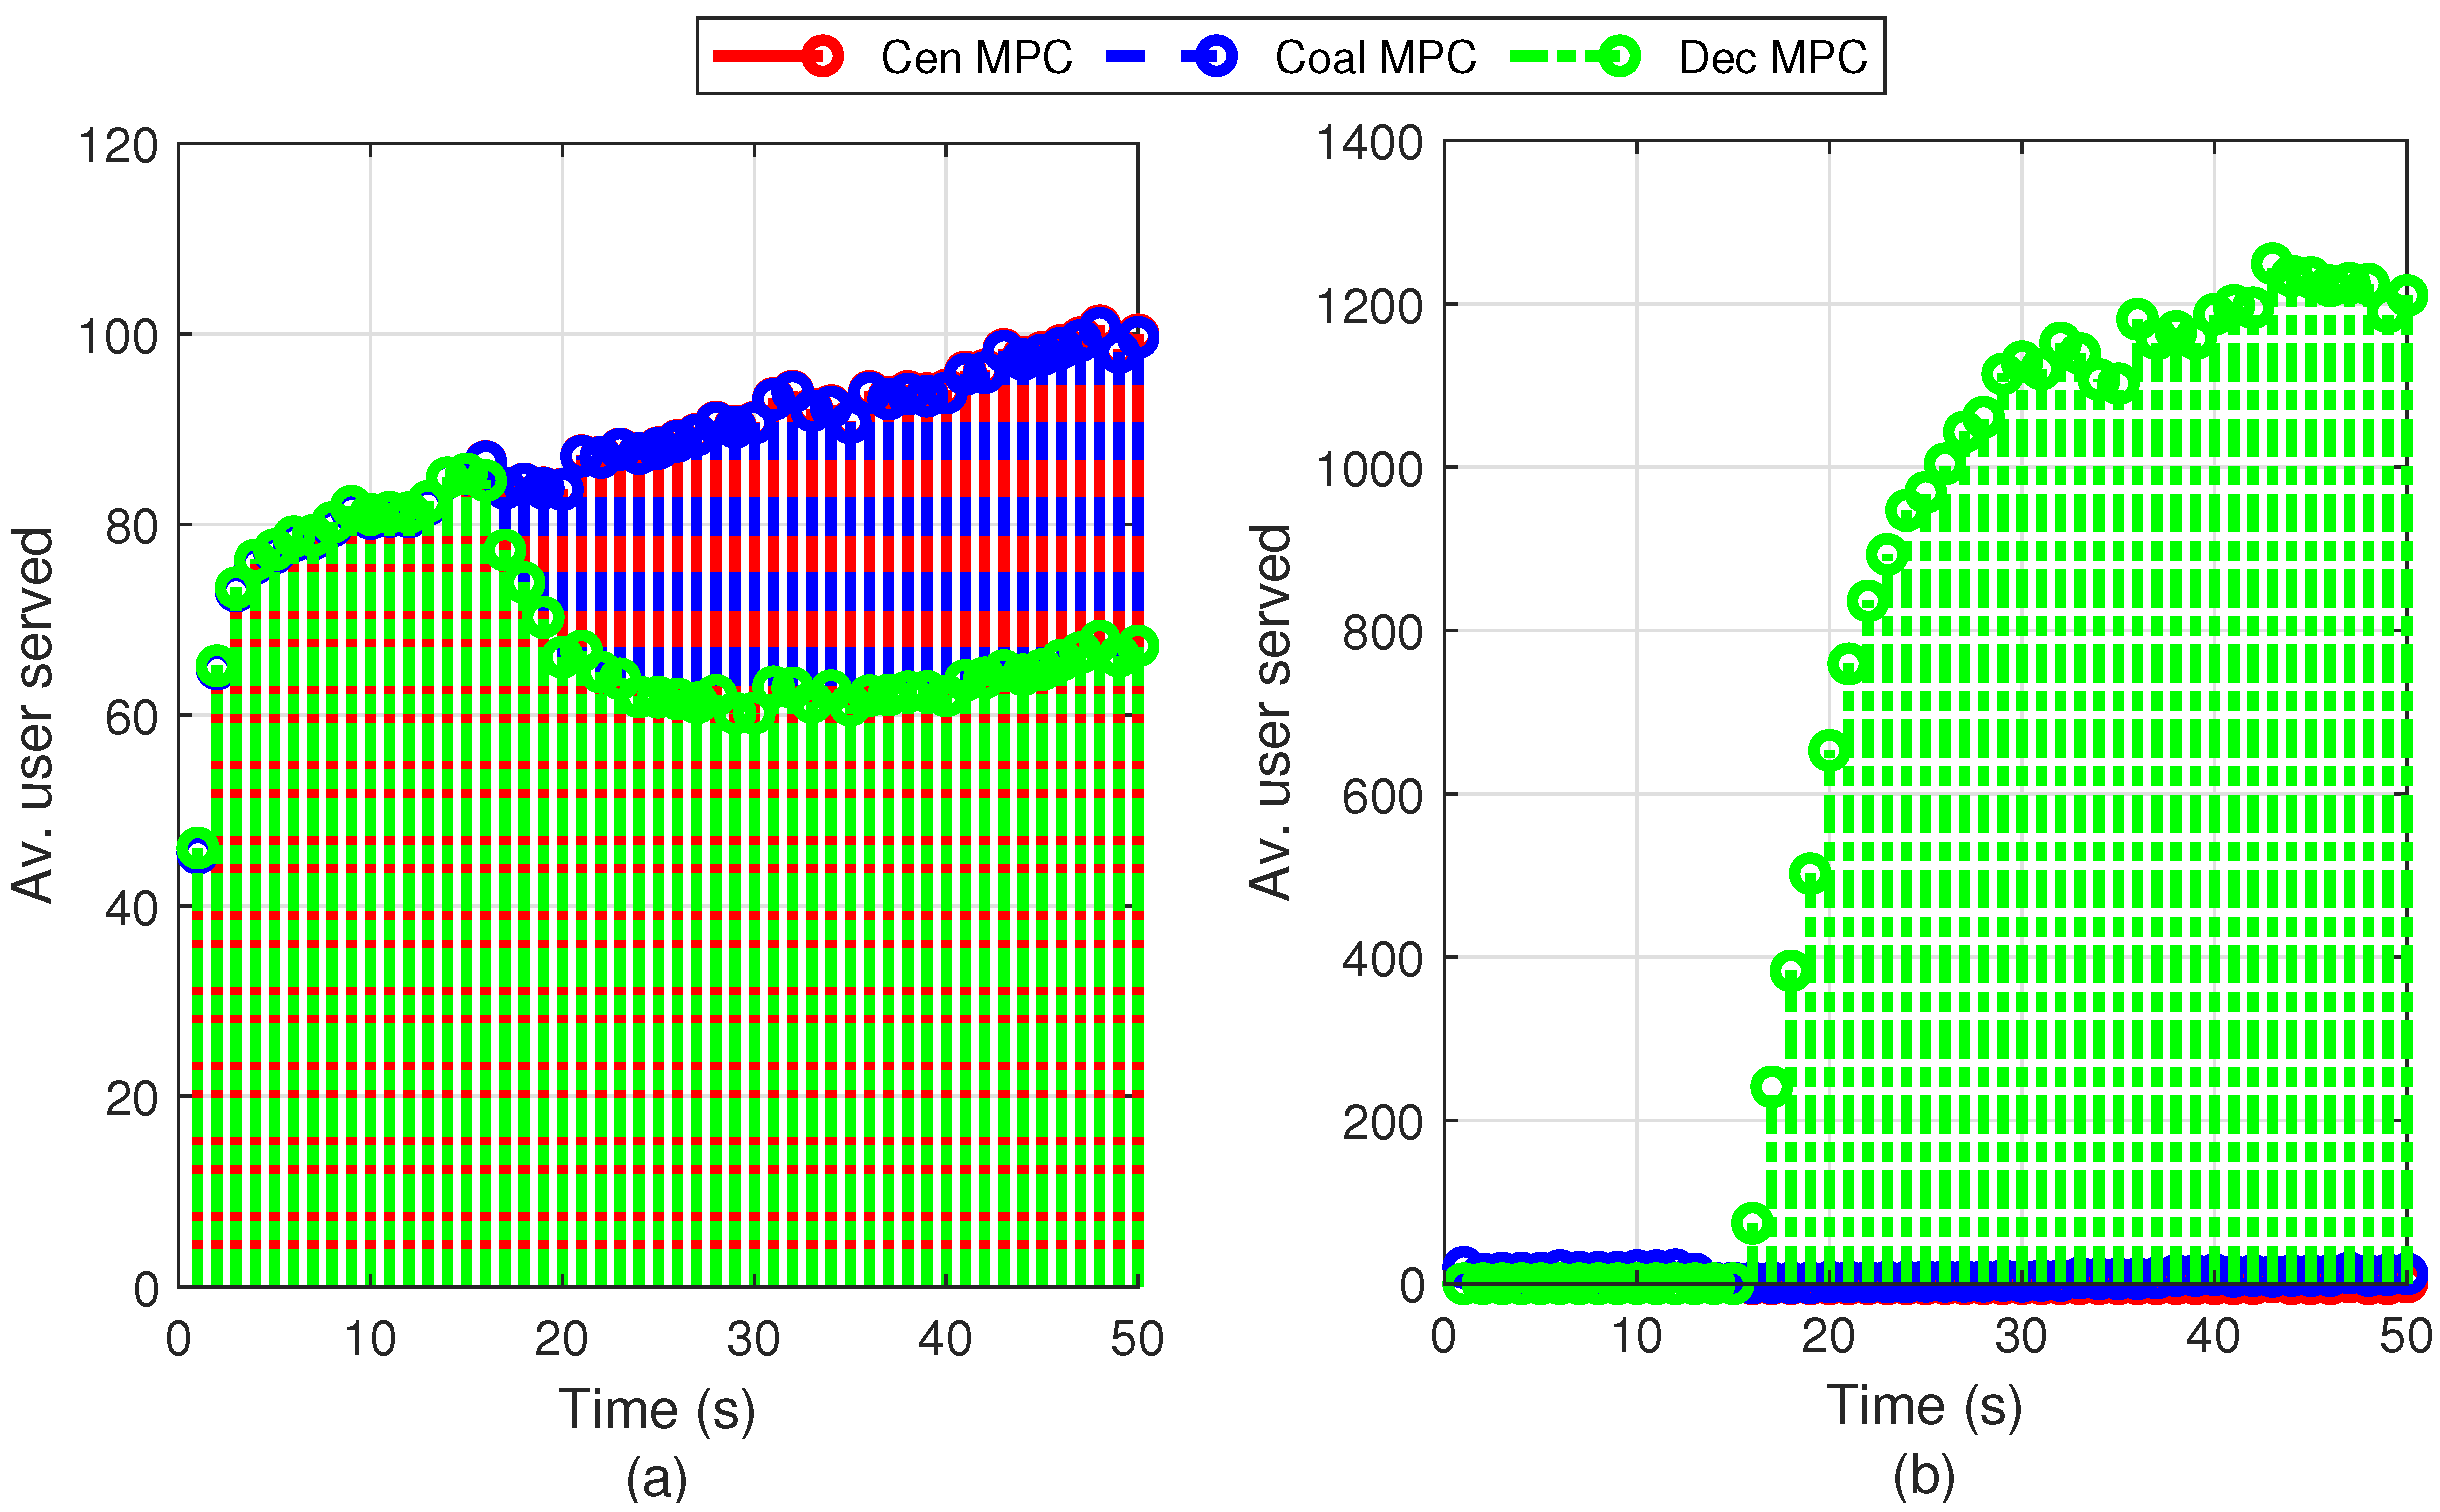
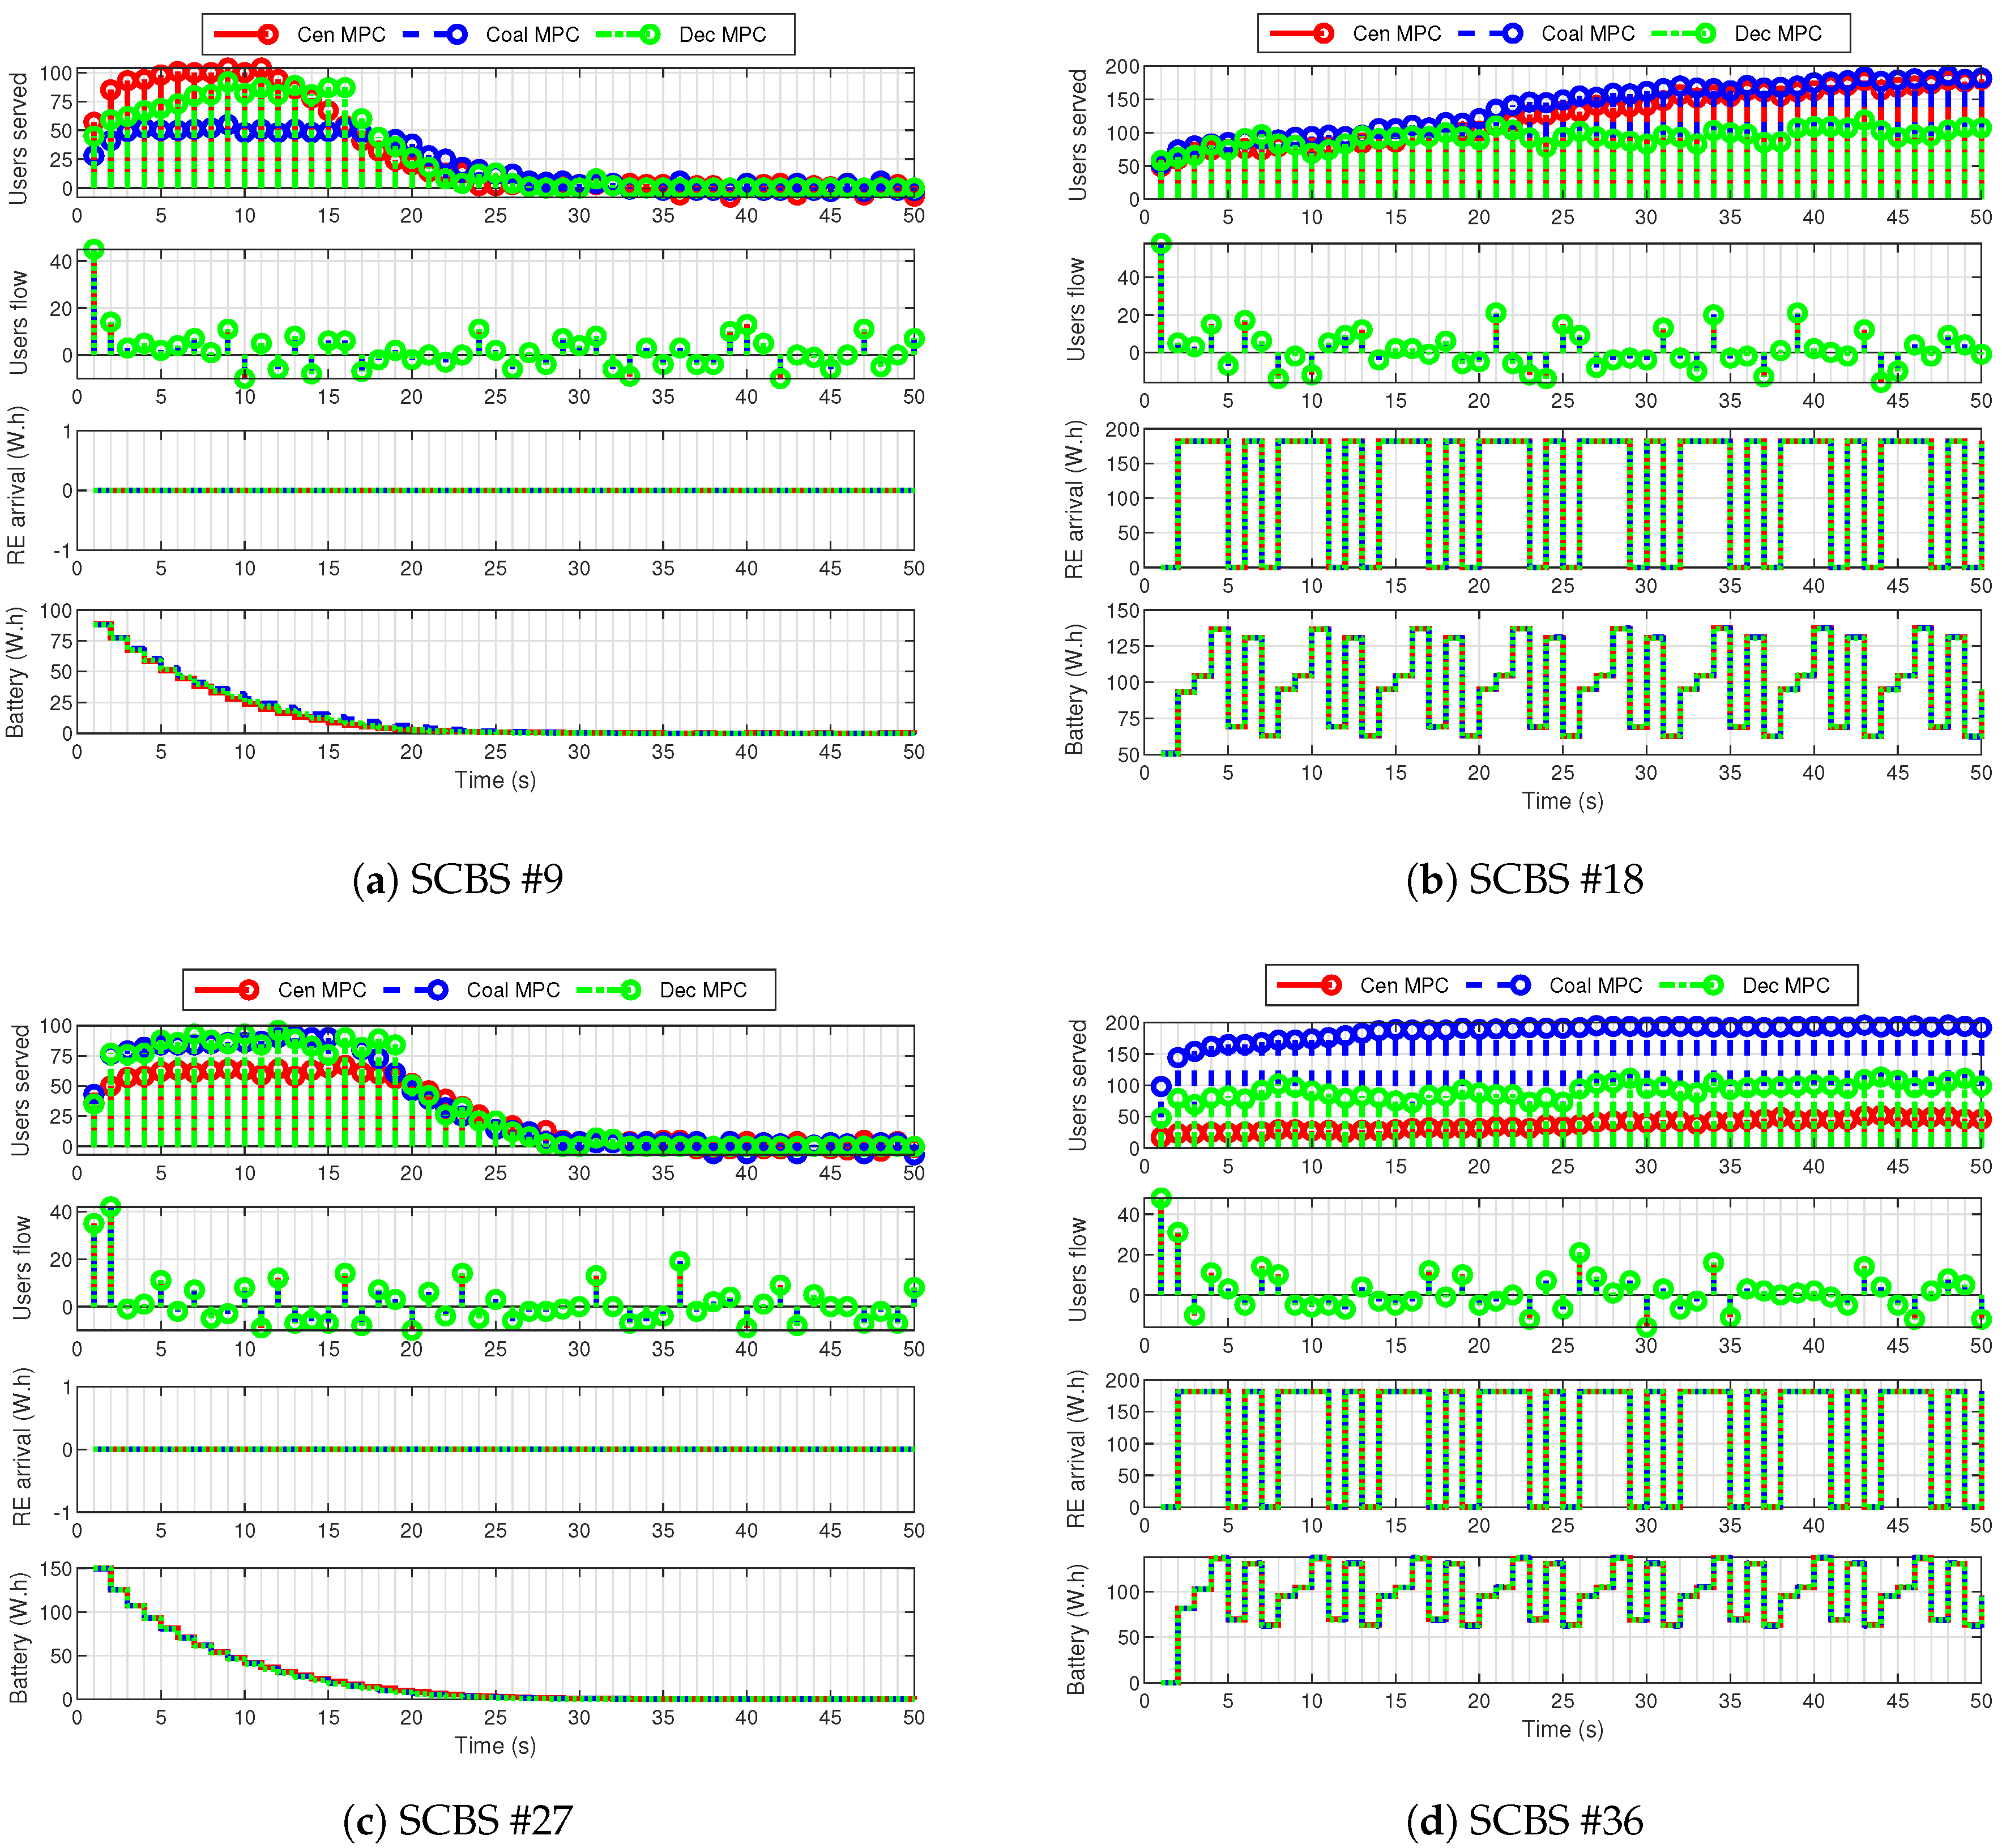
4.5. Results and Discussion

In this section, the results and their interpretation are discussed for the proposed simulated systems: the academic, and the large scenario. In particular, the results are discussed from the perspectives of the energy management, user experience, and MPC performance.

4.5.1. Academic Scenario

On evaluating the on-grid consumption, it is shown how schemes based on MPC balance their traffic load to reduce the use of the MBS (Figure 5b) and increase the number of users served by the SCBSs (Figure 5a). Furthermore, Table 2 displays that centralized and coalitional MPC have, respectively, an 86.1 % and 70.9 % of reduction in grid consumption with respect to the traditional scheme. Similarly, decentralized MPC has a 41.3 % reduction, being a suitable option to solve the energy consumption problem, but with less efficiency than the centralized and coalitional schemes. The obtained results show the efficiency of MPC-based methods to decrease grid consumption.
Regarding stored energy management, centralized MPC attains 56.6 W.h as the average stored energy; coalitional MPC stores an average energy of 57.9 W.h; and decentralized MPC achieves an average of 56.6 W.h. Compared to the result obtained with the traditional scheme ( 65.5 W.h), an improvement close to 15% is obtained regarding the use of renewable energy. Generally, the MPC methods have similar behavior in terms of energy management. However, the reduction of the grid consumption and traffic load of SCBSs is better with the centralized and coalitional schemes. Nevertheless, the coalitional strategy is more suitable for non-centralized architectures.
The MPC-based schemes are compared in Figure 6, where the evolution of the four SCBSs is depicted. The first top row shows the number of users served by the SCBS. The second and third ones represent, respectively, the expected users flow over the simulation and the renewable energy arrival for the SCBSs. They are disturbances for controllers, which compute appropriate control inputs to reduce on-grid consumption and efficiently manage the stored energy. The fourth row depicts the energy stored in the battery. Thus, the response of the controller in periods without renewable energy arrival can be analyzed. For example, in the time interval 0–5 s, the users served by SCBS i = 7 are zero because there is no renewable energy arrival nor energy stored in its battery. Notice the result consistency regarding the users served by the MBS between 0 s and 5 s, as presented in Figure 5b.
Centralized MPC achieves the best performance at the expense of using full cooperation between subsystems. Conversely, the coalitional MPC technique adapts the topology every T up instants considering changes in user traffic and weather conditions. Note that centralized MPC has 72.92 % better performance cost than coalitional MPC. Even so, the latter method presents a cost reduction of 7.2 % regarding centralized MPC when cooperation costs are also considered.
The percentage of users served and the average transmission rate are the KPIs used to assess user experience. In MPC schemes, the former KPI is higher than in the best-signal-level strategy, as shown in Table 2. Regarding average transmission rates, MPC mechanisms have reductions close to 4% compared to the traditional scheme. In the energy-aware heuristic case, the percentage of users served is lower than the MPC schemes because it prioritizes the energy criterion over the signal level received. As stated previously, these results stem from the relationship between the signal level and the user rate, being an expected outcome. However, the percentage of users served in the MPC-based schemes remains fairly steady ( 96 % ). All this, combined with the improvements previously presented, makes coalitional control an efficient strategy to deal with energy management in the next-generation cellular networks.

4.5.2. Large Scenario

Numerical results for the 37-BS network are displayed in Table 3. As shown, the centralized and coalitional MPC schemes have, respectively, a 48.3 % and 27.9 % of grid consumption improvement. Moreover, both methods do the best management of stored energy with 71.1 W.h in centralized MPC and 70.5 W.h in coalitional MPC. Hence, these methods serve more users in the SCBSs with lower consumption of stored energy. Conversely, decentralized MPC cannot manage the user flows between SCBSs when the stored energy is spent. Thus, the number of users served by the MBS is increased, and higher on-grid energy is consumed than other methods.
Figure 7 presents the distribution of users between base stations for the MPC schemes. The centralized and coalitional MPC strategies have better user management over the simulation time, while decentralized MPC can only transfer users to the MBS when the SCBSs do not have stored energy in their batteries. Thus, decentralized MPC is not an appropriate scheme to deal with consumption problems in NGCNs.
Additionally, Figure 8 presents the behavior of several SCBSs with different renewable energy arrival profiles. First, it is observed how the SCBSs without renewable energy arrival use the energy stored in their batteries to guarantee the user service. However, in the centralized and coalitional MPC schemes, users are transferred to other BSs when there is no stored energy. When renewable energy arrives, the batteries maintain a reserve level to serve users and balance the consumed energy according to the arrival forecast. This behavior shows a desirable energy management scheme because the average energy stored in batteries is a 35% of its capacity, the percentage of load in SCBSs is 55%, and the average occupation of the MBS is 8.35 %, as depicted in Figure 7.

5. Conclusions

The broad spatial distribution of cellular networks and the exponential growth of 5G mobile devices promote distributed control methods and alternative sources such as solar, hydro, and wind energy. This article proposes a hierarchical coalitional MPC algorithm to dynamically manage the user-BS association in two simulated hybrid-energy HetNets of different scales. Its assessment regarding the best-signal-level and energy-aware heuristic methods has shown an efficient way to hold the quality of service while reducing on-grid consumption.
Furthermore, the coalitional strategy has been compared with centralized and decentralized MPC. As is known, centralized MPC always has the best performance at the expense of full communication between base stations. Since the viewpoint is to find a trade-off between performance and communication costs, coalitional MPC becomes a suitable method to adapt the network topology dynamically. It mainly evaluates whether a communication link between two base stations contributes to enhancing the overall performance, and otherwise, the link is disabled to save battery storage. Finally, scalability is also achieved for large-scale cellular networks.
Open research lines from this work are a fully distributed implementation of coalitional MPC and its application to the network resource management in 5G systems. The network resource management approach can be studied not only from the energy efficiency perspective, but also from the quality of service approach to accomplish the 5G characteristics. Additionally, we will explore new linear models and stochastic formulations for the problem dynamics.

6. Materials and Methods

Simulated examples were performed using MATLAB® R2017a on Windows 10 with a PC Intel® Core™ i7-8700 CPU at 3.20 GHz and 16 GB RAM.

Author Contributions

Conceptualization, J.M.M., L.A.F., and E.M.; methodology, J.M.M. and E.M.; software, J.M.M., E.M., and L.A.F.; validation, L.A.F. and E.M.; formal analysis, J.M.M.; investigation, E.M.; resources, L.A.F.; data curation, E.M. and L.A.F.; writing, original draft preparation, L.A.F. and E.M.; writing, review and editing, E.M., L.A.F., and J.M.M.; visualization, E.M. and L.A.F.; supervision, J.M.M.; project administration, J.M.M.; funding acquisition, J.M.M., L.A.F., and E.M. All authors read and agreed to the published version of the manuscript.

Funding

This work was supported by the European Union by means of H2020 (Project DENiM, with ID 958339) and the European Research Council (Advanced Grant OCONTSOLAR, reference number 789051); the Spanish Ministry of Science, Innovation, and Universities (FPU 18 / 04476 ); the Colombian Ministry of Science, Technology and Innovation-MINCIENCIAS (Ph.D. Scholarship 6172 and project number 65797 / 825 2018 ); the Spanish Ministry of Economy (Project C3PO, with reference DPI2017-86918-R); and the Junta de Andalucía (Project GESVIP, with reference number US-1265917).

Conflicts of Interest

The authors declare no conflict of interest.

Abbreviations

The following abbreviations are used in this manuscript:
BSBase Station
SCBSSmall-cell Base Station
MBSMacro-cell Base Station
LTELong-Term Evolution
MPCModel Predictive Control
MILPMixed-Integer Linear Problem
NGCNNext-Generation Cellular Network
HetNetHeterogeneous Cellular Network
NHPPNon-Homogeneous Poisson Process
HPPHomogeneous Poisson Process
SINRSignal-to-Interference-plus-Noise Ratio
RANRadio Access Network
ITUInternational Telecommunication Union

References

  1. CISCO. Cisco Annual Internet Report (2018–2023). Available online: https://www.cisco.com/c/en/us/solutions/collateral/executive-perspectives/annual-internet-report/white-paper-c11-741490.pdf (accessed on 11 September 2020).
  2. ITU. Recommendation ITU-T L.1380: Smart Energy Solution for Telecom Sites. Available online: https://www.itu.int/rec/T-REC-L.1380-201911-I/en (accessed on 1 December 2020).
  3. Huo, Y.; Dong, X.; Wei, X.; Yuen, M. Enabling Multi-Functional 5G and Beyond UserEquipment: A Survey and Tutorial. IEEE Access 2019, 7, 116975–117008. [Google Scholar] [CrossRef]
  4. Lubritto, C.; Petraglia, A.; Vetromile, C.; Curcuruto, S.; Logorelli, M.; Marsico, G.; D’Onofrio, A. Energy and environmental aspects of mobile communication systems. Energy 2011, 36, 1109–1114. [Google Scholar] [CrossRef] [Green Version]
  5. Hasan, Z.; Boostanimehr, H.; BhargavaGhazzai, V. Green Cellular Networks: A Survey, Some Research Issues and Challenges. IEEE Commun. Surv. Tutor. 2011, 13, 524–540. [Google Scholar] [CrossRef] [Green Version]
  6. CELTIC-NEXT. Artificial Intelligence for Green Networks (AI4GREEN). 2020. Available online: https://ai4green.celfinet.com/ (accessed on 11 September 2020).
  7. SCAVENGE. Sustainable Cellular Networks Harvesting Ambient Energy (SCAVENGE). 2019. Available online: http://www.scavenge.eu/ (accessed on 11 September 2020).
  8. Auer, G.; Giannini, V.; Desset, C.; Gódor, I.; Skillermark, P.; Olsson, M.; Imran, M.; Sabella, D.; Gonzalez, M.; Blume, O.; et al. How much energy is needed to run a wireless network? IEEE Wirel. Commun. 2011, 18, 40–49. [Google Scholar] [CrossRef]
  9. Fletscher, L.A.; Maestre, J.M.; Peroni, C.V. Coalitional Planning for Energy Efficiency of HetNets Powered by Hybrid Energy Sources. IEEE Trans. Veh. Technol. 2018, 1–13. [Google Scholar] [CrossRef]
  10. Suarez, L.; Nuaymi, L.; Bonnin, J. An overview and classification of research approaches in green wireless networks. EURASIP J. Wirel. Commun. Netw. 2012, 2012, 142. [Google Scholar] [CrossRef]
  11. Dhillon, H.; Li, Y.; Nuggehalli, P.; Pi, Z.; Andrews, J. Fundamentals of Heterogeneous Cellular Networks with Energy Harvesting. IEEE Trans. Wirel. Commun. 2014, 13, 2782–2797. [Google Scholar] [CrossRef]
  12. Gandotra, P.; Kumar, R.; Jain, S. Green Communication in Next Generation Cellular Networks: A Survey. IEEE Access 2017. [Google Scholar] [CrossRef]
  13. Morea, F.; Viciguerra, G.; Cucchi, D.; Valencia, C. Life cycle cost evaluation of off-grid PV-wind hybrid power systems. In Proceedings of the 29th International Telecommunications Energy Conference, Rome, Italy, 30 September–4 October 2007; IEEE: Piscataway, NJ, USA, 2007; pp. 439–441. [Google Scholar] [CrossRef]
  14. Marsan, M.; Bucalo, G.; Di Caro, A.; Meo, M.; Zhang, Y. Towards zero grid electricity networking: Powering BSs with renewable energy sources. In Proceedings of the 2013 IEEE International Conference on Communications Workshops (ICC), Budapest, Hungary, 9–13 June 2013; pp. 596–601. [Google Scholar] [CrossRef]
  15. Alsharif, M.; Nordin, R.; Ismail, M. Energy optimization of hybrid off-grid system for remote telecommunication base station deployment in Malasya. EURASIP J. Wirel. Commun. Netw. 2015, 2015, 64–79. [Google Scholar] [CrossRef] [Green Version]
  16. Piro, G.; Miozzo, M.; Forte, G.; Baldo, N.; Grieco, L.; Boggia, G.; Dini, P. HetNets Powered by Renewable Energy Sources: Sustainable Next-Generation Cellular Networks. Internet Comput. IEEE 2013, 17, 32–39. [Google Scholar] [CrossRef]
  17. Guruacharya, S.; Hossain, E. Self-Sustainability of Energy Harvesting Systems: Concept, Analysis, and Design. IEEE Trans. Green Commun. Netw. 2017, 2, 175–192. [Google Scholar] [CrossRef] [Green Version]
  18. Trabelsi, N.; Chen, S.; El-Azouzi, R.; Roullet, L.; Altman, E. User Association and Resource Allocation Optimization in LTE Cellular Networks. IEEE Trans. Netw. Serv. Manag. 2017, 14, 429–440. [Google Scholar] [CrossRef]
  19. Andrews, J.; Singh, S.; Ye, Q.; Lin, X.; Dhillon, H. An overview of load balancing in Hetnets: Old myths and open problems. IEEE Wirel. Commun. 2014, 21, 18–25. [Google Scholar] [CrossRef] [Green Version]
  20. Zhou, J.; Li, M.; Liu, L.; She, X.; Chen, L. Energy source aware target cell selection and coverage optimization for power saving in cellular networks. In Proceedings of the 2010 IEEE/ACM Int’l Conference on Green Computing and Communications & Int’l Conference on Cyber, Physical and Social Computing, Hangzhou, China, 18–20 December 2010; pp. 1–8. [Google Scholar] [CrossRef]
  21. Han, T.; Ansari, N. On Optimizing Green Energy Utilization for Cellular Networks with Hybrid Energy Supplies. IEEE Trans. Wirel. Commun. 2013, 12, 3872–3882. [Google Scholar] [CrossRef]
  22. Dantong, L.; Yue, C.; Kok, C.; Tiankui, Z.; Chengkang, P. Adaptive user association in HetNets with renewable energy powered base stations. In Proceedings of the 21st International Conference on Telecommunications (ICT), Lisbon, Portugal, 4–7 May 2014; pp. 93–97. [Google Scholar] [CrossRef]
  23. Silva, A.; Tembine, H.; Altman, E.; Debbah, M. Optimum and Equilibrium in Assignment Problems With Congestion: Mobile Terminals Association to Base Stations. IEEE Trans. Autom. Control 2013, 58, 2018–2031. [Google Scholar] [CrossRef] [Green Version]
  24. Liu, X.; Ansari, N. Dual-Battery Enabled Profit Driven User Association in Green Heterogeneous Cellular Networks. IEEE Trans. Green Commun. Netw. 2018, 2, 1002–1011. [Google Scholar] [CrossRef]
  25. Camacho, E.F.; Bordons, C. Model Predictive Control. Springer-Verlag: London, UK, 2007. [Google Scholar]
  26. Cea, M.; Goodwin, G.; Wigren, T. Model predictive zooming power control in future cellular systems under coarse quantization. In Proceedings of the IEEE Vehicular Technology Conference (VTC Fall)), Quebec City, QC, Canada, 3–6 September 2012. [Google Scholar] [CrossRef]
  27. Garcia, V.; Lebedev, N.; Gorce, J.M. Model predictive control for smooth distributed power adaptation. In Proceedings of the IEEE Wireless Communications and Networking Conference (WCNC), Paris, France, 1–4 April 2012. [Google Scholar] [CrossRef] [Green Version]
  28. Distributed Model Predictive Control Made Easy; Maestre, J.M.; Negenborn, R.R. (Eds.) Springer: Berlin/Heidelberg, Germany, 2014; Volume 69. [Google Scholar]
  29. Fele, F.; Maestre, J.M.; Camacho, E.F. Coalitional Control: Cooperative Game Theory and Control. IEEE Control Syst. 2017, 37, 53–69. [Google Scholar] [CrossRef]
  30. Fele, F.; Debada, E.; Maestre, J.M.; Camacho, E.F. Coalitional Control for Self-Organizing Agents. IEEE Trans. Autom. Control 2018. [Google Scholar] [CrossRef]
  31. Hassan, H.; Nuaymi, L.; Pelov, A. Classification of renewable energy scenarios and objectives for cellular networks. In Proceedings of the IEEE International Symposium on Personal, Indoor and Mobile Radio Communications, PIMRC, London, UK, 8–11 September 2013; pp. 2967–2972. [Google Scholar] [CrossRef]
  32. Fletscher, L.A.; Peroni, C.V.; Maestre, J.M. An assessment of different user–BS association policies for green HetNets in off-grid environments. Trans. Emerg. Telecommun. Technol. 2017, 28, 1–15. [Google Scholar] [CrossRef]
  33. Fletscher, L.A.; Suárez, L.A.; Grace, D.; Peroni, C.V.; Maestre, J.M. Energy-aware resource management in heterogeneous cellular networks with hybrid energy sources. IEEE Trans. Netw. Serv. Manag. 2018, 16, 279–293. [Google Scholar] [CrossRef]
  34. Masero, E.; Fletscher, L.A.; Maestre, J.M. A coalitional model predictive control approach for heterogeneous cellular networks. In Proceedings of the IEEE European Control Conference (ECC), Saint Petersburg, Russia, 12–15 May 2020; pp. 448–453. [Google Scholar]
  35. Han, T.; Ansari, N. A traffic load balancing framework for software-defined radio access networks powered by hybrid energy sources. IEEE/ACM Trans. Netw. 2016, 24, 1038–1051. [Google Scholar] [CrossRef] [Green Version]
  36. Kim, H.; de Veciana, G.; Yang, X.; Venkatachalam, M. Distributed α-Optimal User Association and Cell Load Balancing in Wireless Networks. IEEE/ACM Trans. Netw. 2012, 20, 177–190. [Google Scholar] [CrossRef]
  37. Lopez-Perez, D.; Guvenc, I.; Roche, G.; Kountouris, M.; Quek, T.; Zhang, J. Enhanced intercell interference coordination challenges in heterogeneous networks. IEEE Wirel. Commun. 2011, 18, 22–30. [Google Scholar] [CrossRef] [Green Version]
  38. Liu, D.; Chen, Y.; Chai, K.; Zhang, T.; Elkashlan, M. Two Dimensional Optimization on User Association and Green Energy Allocation for HetNets with Hybrid Energy Sources. IEEE Trans. Commun. 2015, 63, 4111–4124. [Google Scholar] [CrossRef]
  39. Yang, H.; Geraci, G.; Quek, T. Energy-Efficient Design of MIMO Heterogeneous Networks with Wireless Backhaul. IEEE Trans. Wirel. Commun. 2016, 15, 4914–4927. [Google Scholar] [CrossRef] [Green Version]
  40. Johnson, D.; Garey, M. Computers and Intractability: A Guide to the Theory of NP-Completeness, 1st ed.; Bell Telephone Laboratories, Incorporated: Murray Hill, NJ, USA, 1979. [Google Scholar]
  41. Andrews, J. Seven ways that Hetnets are a cellular paradigm shift. IEEE Commun. Mag. 2013, 51, 136–144. [Google Scholar] [CrossRef]
  42. Muros, F.J.; Maestre, J.M.; Algaba, E.; Alamo, T.; Camacho, E.F. Networked control design for coalitional schemes using game-theoretic methods. Automatica 2017, 78, 320–332. [Google Scholar] [CrossRef]
  43. Maestre, J.M.; Ishii, H. A PageRank based coalitional control scheme. Int. J. Control. Autom. Syst. 2017, 15, 1983–1990. [Google Scholar] [CrossRef]
Figure 1. Scheme of a hybrid-energy heterogeneous cellular network.
Energies 13 06546 g001
Figure 2. Simulated scenarios: (a) 9-BS network, and (b) 37-BS network. Blue lines refer fixed communication links between the SCBSs and the MBS; and green lines refer to dynamic cooperation links between the SCBSs.
Energies 13 06546 g002
Figure 3. Average Renewable Energy (RE) arrival: (a) 9-BS network, and (b) 37-BS network.
Energies 13 06546 g003
Figure 4. Users forecast for BS # 9 in the (a) 9-BS network, and (b) 37-BS network.
Energies 13 06546 g004
Figure 5. Average users served for the MPC-based methods in the 9-BS network: (a) SCBSs, and (b) MBS.
Energies 13 06546 g005
Figure 6. Comparison of four SCBSs from the 9-BS network. In each subfigure, the first row represents the user served by the SCBS; the second one is the user flow expected; the third row depicts the renewable energy arrival; and the fourth one shows the energy stored in the battery.
Energies 13 06546 g006
Figure 7. Average users served for the MPC-based methods in the 37-BS network: (a) SCBSs, and (b) MBS.
Energies 13 06546 g007
Figure 8. Comparison of several SCBSs from the 37-BS network. In each subfigure, the first row represents the user served by the SCBS; the second one is the user flow expected; the third row depicts the renewable energy arrival; and the fourth one show the energy stored in the battery.
Energies 13 06546 g008
Table 1. Summary of the main parameters.
DescriptionValueUnits
A Coverage area 3.5 km 2
B W Bandwidth of the LTE system20MHz
d i , j Inter-site distance500m
T 1 Transmission power of the MBS43dBm
T i Transmission power of the SCBSs22dBm
E 1 S Static power consumption of the MBS130W.h
E i S Static power consumption of the SCBSs 6.8 W.h
Δ 1 Consumption slope of the MBS 4.7
Δ i Consumption slope of the SCBSs 4.0
F i , j Max. users flow between the BSs100
z i max Max. users served by the SCBSs200
b i max Max. battery capacity of the SCBSs200W.h
N p Prediction horizon5
T up Upper layer execution10
QWeighting parameter100
α i Weighting factor 10 7
c link Cost per cooperation link 10 4
-Path loss between the MBS and zCost 231 model
-Mobility modelRandom walk
-Mobility speed4km/h
Table 2. Numerical results in the 9-BS network.
Energy ManagementUser ExperienceMPC Costs
Control SchemeGrid Consumption
(kW.h)
Grid Consumption
Improvement (%)
Average Stored
Energy (W.h)
Users Served
(%)
Transmission
Rate (Mbps)
J perf J coop J total = J perf + J coop
Best-signal-level 938.1 65.5 95.2 4.2
Energy-aware heuristic 830.3 11.5 61.2 94.7 3.9
Centralized MPC130 86.1 56.6 96.1 4.0 4.44 · 10 4 1.25 · 10 7 1.25 · 10 7
Decentralized MPC 550.7 41.3 58.5 96.5 3.8 5.34 · 10 6 4.00 · 10 6 9.34 · 10 6
Coalitional MPC 272.8 70.9 57.9 96.3 4.0 1.64 · 10 5 1.14 · 10 7 1.16 · 10 7
Table 3. Numerical results in the 37-BS network.
Energy ManagementUser ExperienceMPC Costs
Control SchemeGrid Consumption
(kW.h)
Grid Consumption
Improvement (%)
Average Stored
Energy (W.h)
Users Served
(%)
Transmission
Rate (Mbps)
J perf J coop J total = J perf + J coop
Best-signal-level 252.8 63.5 95.3 3.3
Energy-aware heuristic 227.5 10.1 60.2 94.3 2.8
Centralized MPC 130.8 48.3 71.1 95.1 3.1 4.5 × 10 4 1.37 × 10 8 1.3705 × 10 8
Decentralized MPC 4732.8 1772 70.8 95.5 2.9 3.24 × 10 8 1.8 × 10 7 3.42 × 10 8
Coalitional MPC 182.2 27.9 70.5 95.1 3.1 5.02 × 10 5 1.36 × 10 8 1.365 × 10 8
Publisher’s Note: MDPI stays neutral with regard to jurisdictional claims in published maps and institutional affiliations.

