Abstract
Na3Ni2BiO6 with Honeycomb structure suffers from poor cycle stability when applied as cathode material for sodium-ion batteries. Herein, the strategy to improve the stability is to substitute Ni and Bi with inactive Ti. Monoclinic Na3Ni2-xBi1-yTix+yO6 powders with different Ti content were successfully synthesized via sol gel method, and 0.3 mol of Ti was determined as a maximum concentration to obtain a phase-pure compound. A solid-solution in the system of O3-NaNi0.5Ti0.5O2 and O3-Na3Ni2BiO6 is obtained when this critical concentration is not exceeded. The capacity of the first desodiation process at 0.1 C of Na3Ni2BiO6 (~93 mAh g−1) decreases with the increasing Ti concentration to ~77 mAh g−1 for Na3Ni2Bi0.9Ti0.1O6 and to ~82 mAh g−1 for Na3Ni0.9Bi0.8Ti0.3O6, respectively. After 100 cycles at 1 C, a better electrochemical kinetics is obtained for the Ti-containing structures, where a fast diffusion effect of Na+-ions is more pronounced. As a result of in operando synchrotron radiation diffraction, during the first sodiation (O1-P3-O’3-O3) the O’3 phase, which is formed in the Na3Ni2BiO6 is fully or partly replaced by P’3 phase in the Ti substituted compounds. This leads to an improvement in the kinetics of the electrochemical process. The pathway through prismatic sites of Na+-ions in the P’3 phase seems to be more favourable than through octahedral sites of O’3 phase. Additionally, at high potential, a partial suppression of the reversible phase transition P3-O1-P3 is revealed.
1. Introduction
Research on post-lithium energy-storage devices is indispensable, as the high need for lithium will continuously increase throughout the period of 2025 to 2050 [1]. Therefore, alternative storage devices, based on more abundant elements, are crucial for the progressing electrification. Sodium could be a suitable option, showing similar chemical properties as lithium [2]. Among many candidates for positive electrode materials, the most studied ones are layered sodium transition metal oxides [3]. Those layered transition metal oxides with the general formula NaTMO2 (TM = Cr, Co, Fe, Mn, Ni, Ti, V) are characterized by their basic structure, facile synthesis and high charge storage capacity [4]. For example, NaNiO2 shows an excellent initial desodiation capacity of 147 mAh g−1 [4]. However, it has low cycling stability and multiple phase transformations, which is presented as a series of five plateaus between 2.0 V and 4.5 V vs. Na+/Na during desodiation [5]. These features make it unsuitable for battery applications. Improvements of the cycling stability and rate capability [4,5] of NaNiO2 were achieved by substitution of 50% nickel with inactive Ti that led to phase transition suppression and only one remaining transformation (O3-P3) upon cycling [6]. These phases are distinguished according to the classification for layered oxides [7,8], primarily in terms of the oxygen coordination of sodium-ions, which is prismatic (P3) or octahedral (O3). The digit “3” indicates the number of transition metal layers with different type of O stacking in a single cell unit (Figure 1). The structure can be stabilized and phase transformations can be suppressed by the addition of another suitable element to the transition metal layers [7]. This strategy was transferred to the promising Na3Ni2BiO6 positive electrode material. Na3Ni2BiO6 forms a honeycomb-type superstructure with a high degree of order due to the difference in the charge and size of the ions [9]. Each pentavalent Bi5+ (0.76 Å) forms a BiO6 octahedron and is surrounded by six edge-sharing NiO6 octahedra with divalent Ni2+ (0.69 Å) [9]. Na3Ni2BiO6 can achieve a theoretical capacity of 109 mAh g−1 [9], corresponding to the oxidation of nickel from Ni2+ to Ni3+, while Bi5+ is inactive during cycling. Nevertheless, it suffers from multiple phase transformations of O3-P3-O1 during desodiation (Figure 1).
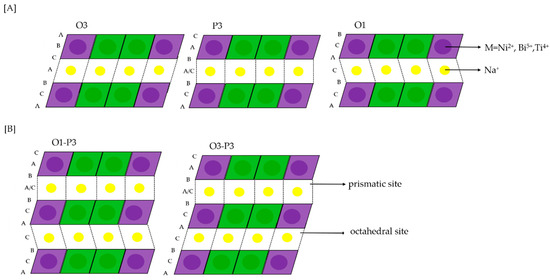
Figure 1.
Stackings of O3 (AB CA BC-type), P3(AB BC CA-type) and O1 (AB-type) structures [A] and corresponding hydrids of O1-P3 and O3-P3 [B] [10].
The first sodiation step of Na3Ni2BiO6 leads to an additional O’3 phase, which results in the O3-O’3-P3-O1 transformation [9,11,12,13]. The multistep phase transformation causes a lattice structure reorganization, which results in low cycling stability [5,6]. There are two ways to suppress the phase transition of the honeycomb layered Na3Ni2BiO6 structure: firstly, nickel-ion substitution, secondly—inactive bismuth substitution. Wang et al. suppressed some phase transformations of Na3Ni2BiO6 by substituting nickel with copper (Cu2+ 0.73 Å), magnesium (Mg2+ 0.72 Å) and zinc (Zn2+ 0.74 Å) [13]. The suppression of the high-potential P3-O1 phase transition was successfully achieved, but the electrochemical reaction became more irreversible, probably through the breakage of charge balance and huge structure strain in this ordered structure. Despite the fact that the presence of Ti on the 3d metal positions in the structure of layered oxides is beneficial for the cycling stability [7], there is no information in the literature about the influence of a Ti additive on the properties of the honeycomb structure. Therefore, our work is based on mixing two state-of-the-art systems: O3-NaNi0.5Ti0.5O2 and O3-Na3Ni2BiO6 with honeycomb structure [6,9]. The present work includes the synthesis of several compositions obtained by the replacement of Bi5+ (0.76 Å) and Ni2+ (0.69 Å) by the appropriate stoichiometric amount of Ti4+ (0.61 Å). It is revealed the formation of a region with solid-solution in the two-component system NaNi0.5Ti0.5O2 (R-3m)-Na3Ni2BiO6 (C2/m), where only the Na3Ni2BiO6 structure with the space group C2/m can be recognized. By inserting Ti into the honeycomb structure, the capacity at high currents is enhanced and the kinetics is improved because of two effects: the suppression of a P3-O1 phase transition during desodation and the exchange of an intermediate O’3 phase by a P’3 phase during the first sodiation. The P’3 phase is more favourable for the Na+-ion diffusion, caused by a better diffusion ability of Na+-ions through prismatic sites in comparison to the octahedral ones [14].
2. Materials and Methods
2.1. Synthesis of Active Materials
The powder of Na3Ni2-xBi1-yTix+yO6 (x1 = 0; y1 = 0, x2 = 0; y2 = 0.1, x3 = 0.1; y3 = 0.2, x4 = 0.167; y4 = 0.333) was obtained using a sol-gel synthesis with a 5 % excess of sodium acetate (NaCH3COO, VWR, 100 %) to compensate a possible volatilization at high temperatures[15]. In the respective stoichimetric ratio to synthesize 1 g product, Nickel acetate (Ni(CH3COO)2 × 4 H2O, Fluka, >99.0%), bismuth nitrate pentahydrate (Bi(NO3)3 × 5 H2O, Sigma Aldrich, ≥98.0%) and titanyl acetylacetonate (C10H14O5Ti, Merck, ≥95.0%) were dissolved in 20 Eq. ethylene glycol (C2H6O2, Sigma Aldrich, 99.8%). Afterwards, 5 Eq. of citric acid monohydrate (C6H8O7, Sigma Aldrich, ≥99.0%) was added to obtain a sol. After stirring for 12 h, the solution was heated for 5 h at 80 °C. Afterward, the temperature was raised to 120 °C and the solution was left for an additional 12 h at this temperature under stirring. The resulted gel was heated in a muffle oven for 4 h at 400 °C. The obtained powder was ground and pressed to pellets and then heated in alumina boats for 12 h at 720 °C and oxygen flow. After that, the material was further ground and pressed; the resulting pellets were heated for further 24 h at 720 °C, under the flow of oxygen. Na3Ni2BiO6 is an olive-green powder; the Ti-containing compounds have a colour like mustard-yellow. For the sake of simplicity, in this paper, all products are abbreviated:
Na3Ni2BiO6 (NNB)
2.8NaNi2/3Bi1/3O2 + 0.2NaNi0.5Ti0.5O2 = Na3Ni1.97Bi0.93Ti0.1O6 (NNBT0.1)
2.4NaNi2/3Bi1/3O2 + 0.6NaNi0.5Ti0.5O2 = Na3Ni1.9Bi0.8Ti0.3O6 (NNBT0.3)
2NaNi2/3Bi1/3O2 + NaNi0.5Ti0.5O2 = Na3Ni1.833Bi0.67Ti0.5O6 (NNBT0.5)
2.2. Electrodes Preparation
The working electrodes were prepared with 80 mass % Na3Ni2-xBi1-yTix+yO6, 10 mass % carbon black (C65, TIMCAL C-NERGY™) and 10 mass % of a 10% polyvinylidene fluoride (PVdF, Solvay) dispersed in dimethyl sulfoxide (DMSO, Merck, ≥99% purity).The components were mixed by using a DAC150.1 FVZ speed mixer from Hauschild. The Na3Ni2-xBi1-yTix+yO6 and carbon powders were first dry-mixed at 1000 rpm for 5 min. Then, 0.45 g DMSO was added to obtain a thick paste. This paste was further mixed for 10 min at 1500 rpm and then for other 10 min at 2500 rpm. The paste was then sonicated for 10 min and then mixed for additional 10 min at 2500 rpm. After that, the binder solution (10 mass % PVdF in DMSO) was added. The slurry was further mixed for 10 min at 800 rpm and finally coated on an aluminium foil with a wet thickness of 200 µm via a Doctor Balde technique. The coated electrodes were dried 12 h at ambient conditions (25 °C and 1 atm) and afterwards at 80 °C in an oven. The electrodes were punched out with 12 mm diameter and subjected to a vacuum drying step at 120 °C for 12 h (in a Büchi oven). The dried electrodes were inserted into an Ar-filled glovebox. The average mass of the active materials was: NNB = 8.22 mg/cm2, NNBT0.1 = 9.11 mg/cm2 and NNBT0.3 = 7.41 mg/cm2.
2.3. Cell Assembly and Electrochemical Characterization
Three-electrode cells based on polyether ether ketone (PEEK) with spring-loaded titanium pistons were used for electrochemical tests. The cells are already described by Weingarth et al. [16]. The cells parts were dried at 120 °C and assembled in an Ar-filled glovebox. As proposed by Conder et al. [17], the oxide layer on the Na metal (used as reference and counter electrode) was carefully removed from the surface. The Na counter electrodes were pressed in order to obtain to a thickness of 1 mm and placed on a Cu foil current collector. A vacuum dried glass fibre disc (Whatman GF/D) was used as separator. The Na-reference was placed on a compressed glass fibre separator (Whatman GF/D) in a cavity close to the working electrode/counter electrode stack and contacted by a titanium wire. 1 M NaClO4 in EC/DMC (1:1 mass ratio) + FEC (5% w/w) was used as electrolyte, which was prepared by following the procedure described in our previous publication [18], and injected in the cell with an aid of a syringe. The cell were placed in a climate chamber at 25 °C. The electrochemical measurements were performed with a multi-channel potentiostat/galvanostat (VMP3, from Bio-logic Science Instrument GmbH, Germany), equipped with the EC-Lab software. Galvanostatic desodiation/sodiation cycling with potential limitation (GCPL) experiments was performed in a voltage window of 2.5 V–3.8 V vs. Na+/Na with a desodiation/sodiation current of 10.9 mA g−1 and 109 mA g−1 which corresponds to 0.1 C and 1 C with respect to the theoretical capacity of NNB. 100 continuous cycles were performed at the currents of 0.1 C and 1 C. The cyclic voltammetry measurements were conducted with scan rates of 1 mV s−1, 0.5 mV s−1, 0.1 mV s−1 and 0.025 mV s−1.
2.4. Materials Characterization
X-ray diffraction (XRD) measurements were performed with a STOE STADI P diffractometer (Mo–Kα-radiation, λ = 0.7093 Å) in the transmission mode. Scanning electron microscopy (SEM) measurements were conducted by a thermal field emission scanning electron microscope (FESEM, Carl Zeiss SMT AG) at an acceleration voltage of 5 kV. The samples were fixed on a steel sample holder by using sticky carbon tape. Synchrotron in operando investigation was carried out at the P02.1 beamline (Hamburg, PETRA III), which operates at a fixed energy of 60 keV (λ = 0.20695 Å) and exhibits low divergence, small energy bandwidth and relatively high flux. The diffraction patterns were collected using 2D detector “Varex XRD 4343CT” with 150 × 150 µm2 pixel size, 2880 × 2880 pixel area and consists of a CsI scintillator directly deposited on the amorphous Si photodiodes. All diffraction patterns were analysed by full-profile Rietveld refinements, using the software package WinPLOTR [19]. For the in operando experiment, the coated electrodes vs. metallic sodium were closed inside in CR2025 coin cells with glass windows. ICP-OES was performed by OPTIMA 4300DV (Perkin-Elmer) with inductively coupled plasma, an Echelle polychromator and a solid-state detector (custom, two-dimensional CCD array).
3. Results
Diffraction patterns of NNB, NNBT0.1, NNBT0.3 and NNBT0.5 are presented in Figure 2A–D and the corresponding structural information are listed in Table S1. Based on the Rietveld refined structure parameters, NNB, NNBT0.1 and NNBT0.3 can be indexed in the monoclinic structure with the space group C2/m (Rp: 8.45, Rwp: 13.6 for NNB; Rp: 6.37, Rwp: 9.56 for NNBT0.1; Rp: 5.72 Rwp: 8.07 for NNBT0.3). All samples contain 3–14% NiO (marked with a dot) as an impurity. The presence of such NiO impurities seems unavoidable, which is consistent with the available literature [11,20]. The (Bragg) reflections shift to a higher scattering angle 2θ with increasing Ti content. This indicates a decrease of the cell volume with increasing Ti content. The calculated lattice parameters, shown in Figure S1, support the assumption of an almost linear volume reduction versus Ti content. In the solid solution system of Na3Ni2BiO6—NaNi0.5Ti0.5O2 with the morphotropic boundary, around 0.3 mol Ti (Na3Ni1.9Bi0.8Ti0.3O6, NNBT0.3), the Vegard`s law is still fulfilled [21]. However, NNBT0.5 consists of four-phases, which is caused by the exceeded Ti concentration for the formation of a solid-solution. According to the report of Seibel et al. [15] and Wang et al. [13], the area of superstructure reflections (marked with asterisks) is located at 2.5°–4.0° 2θ and arise due to a high order degree of Ni2+ and Bi5+ cations inside the slab of the honeycomb structure. The monoclinic C2/m space group is the most appropriate one to fit these superstructure reflections, consistent with prior single-crystal and powder diffraction investigations [9,15]. The superstructure reflections for the synthesized materials are nearly vanished and the Warren-type diffraction peak with an extended high-angle tail at 2.54° 2θ is found for NNB, NNBT0.1 and NNBT0.3, which is caused by the occurrence of stacking faults [9,13,14,15,22,23]. Asymmetrical peaks, which characterize such defects, are also present in the ordered phase, indicating that the ordering is not completely developed in all samples. The ordering in the 3d metal layers still exist when the high-level stacking faults along the c axis are present. As shown in Figure 2A, six NiO6 octahedra with common edge-sharing octahedra surround one BiO6 octahedron, forming the superstructure lattice. The electrochemical performance of NNBT0.5 cannot be compared to the other materials as it has lost the single-phase honeycomb structure. The morphologies of all compounds were characterized by scanning electron microscopy (SEM) and are displayed in Figure S2. The pristine material NNB is composed of plate-like 200 nm–800 nm particles. With increasing Ti content, the diameter of grains becomes smaller and the particles have irregular shapes in NNBT0.1 and NNBT0.3. The morphology does not change when further increasing the amount of Ti.
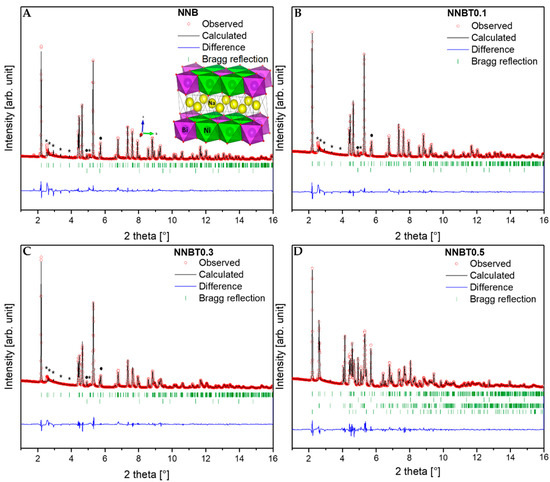
Figure 2.
X-ray diffraction (XRD) patterns of the synthesized (A) NNB, (B) NNBT0.1, (C) NNBT0.3 (with honeycomb superstructure, marked with an asterisk) and (D) NNBT0.5 compounds. Red circles represent the measured intensity; the black lines indicate the calculated pattern and the difference between both is shown in blue. The upper row of green bars in A–C indicate Bragg positions of the products and the lower row is related to NiO (marked with a dot). In D, the third row is related to NaBiO2 and the last one is related to NaNi0.5Ti0.5O2.
After the structure elucidation, electrochemical measurements were performed. Galvanostatic profiles of the 1st, 2nd, 3rd, and 100th cycle of NNB, NNBT0.1 and NNBT0.3 are illustrated in Figure 3 at 0.1 C and in Figure 4 at 1 C. The associated cycling stability curves and corresponding coulombic efficiency values at 0.1 C and 1 C are shown in Figure 5.
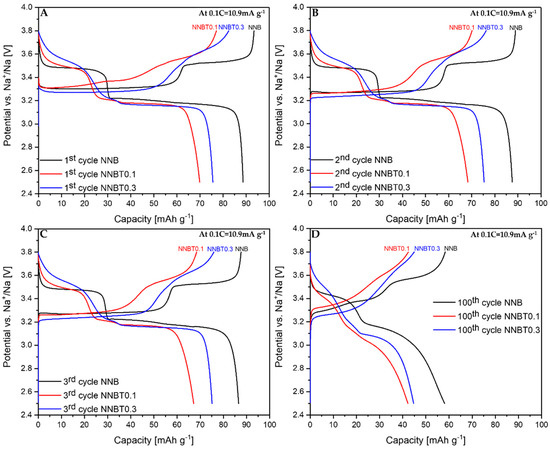
Figure 3.
Galvanostatic desodiation/sodiation profiles at 0.1 C for 1st (A), 2nd (B), 3rd (C) and 100th (D) cycles of NNB, NNBT0.1 and NNBT0.3.
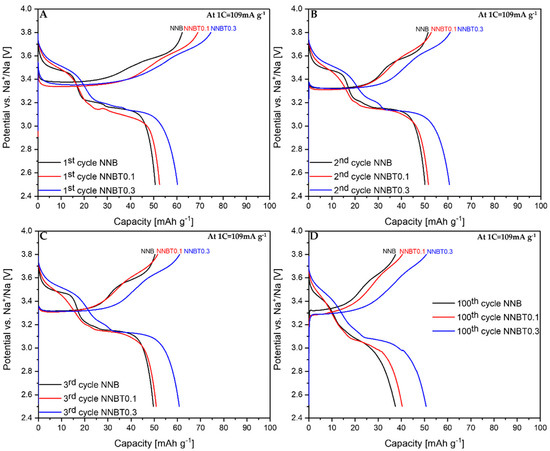
Figure 4.
Galvanostatic desodiation/sodiation profiles at 1 C for 1st (A), 2nd (B), 3rd (C) and 100th (D) cycles of NNB, NNBT0.1 and NNBT0.3.
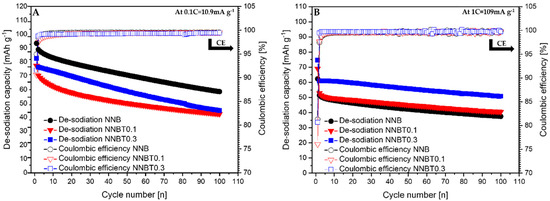
Figure 5.
De-sodiation curves of NNB, NNBT0.1 and NNBR0.3 with their corresponding coulombic efficiency at 0.1 C (A) and 1 C (B).
During the first desodiation at 0.1 C, NNB delivers a capacity value of ~93 mAh g−1 (Figure 3A), which corresponds to the state-of-the-art literature values [9,13]. The Ti-substituted materials deliver ~77 mAh g−1 (NNBT0.1) and ~82 mAh g−1 (NNBT0.3) (Figure 3A). NNB is characterized by two flat plateaus during the first desodiation at 3.33 V and 3.55 V. These redox potential plateaus are typical for sodium nickelate layered systems [13]. The presence of plateaus indicates phase transformations occurring during the sodium extraction/insertion [24]. The two Ti-substituted materials also show two plateaus during the first charging process. However, the plateaus of the Ti-containing materials are less pronounced than those of the NNB. During the following sodiation, all materials exhibit three plateaus, corresponding to the reduction of nickel from Ni3+ to Ni2+ [9,13]. The sodiation process in NNB is accompanied by more phase transitions in comparison to the desodiation step and it will be discussed in the further part of this work. NNB shows a capacity of ~89 mAh g−1 during the first sodiation. The coulombic efficiency values increase from~95% (1st cycle) to ~99.5% (20th cycle). The first sodiation capacity of NNBT0.1 is ~70 mA g−1 with a coulombic efficiency (at the first cycle) of ~91%, which increases to ~99.4% during further cycling. The coulombic efficiency of NNBT0.3 is initially ~92% and raises after 20 cycles to ~99.2%. During the first desodiation, an overpotential can be seen for all electrodes (Figure 3A and Figure 4A). The reason for this polarization could be a low intrinsic conductivity, which could be electronic or ionic [20]. At a low current rate (0.1 C), the polarization decreases after the first cycle, whereas at 1 C the polarization remains upon cycling. However, it is evident that at 1C the polarization of the Ti-substituted samples is lower compared to the NNB reference. After 100 cycles at 0.1 C, the loss of capacity for all samples is ~40%. The desodiation capacity of NNBT0.1 after 20 cycles drops from ~77 mAh g−1 to ~59 mAh g−1, but slightly stabilizes in the further cycles. The desodiation capacity of NNBT0.3 drops linearly from ~82 mAh g−1 to ~70 mAh g−1 after 20 cycles. The electrode materials perform differently at 1 C. NNB has the lowest capacity with ~62 mAh g−1 whereas NNBT0.1 delivers an initial capacity of~69 mAh g−1 and NNBT0.3 of ~74 mAh g−1. However, all cells significantly suffer from the first irreversible capacity loss. This high drop of capacity is also reflected in a low coulombic efficiency at the first cycle. The coulombic efficiency of all cells increases from ~80% to >99%. In total, all observed plateaus are nearly in the same potential range as measured at low current. Nevertheless, the cycle stability is improved in comparison to the low-rate performance. While at 0.1 C all materials lose about 40% of their capacity after 100 cycles, the loss at 1 C is ~27% for NNB, ~24% for NNBT0.1 and ~16% for NNBT0.3. The cycling stability is higher at high rates compared to the low rate. Among the three electrodes, NNB shows the highest capacity at 0.1 C and the lowest one at 1 C, which can be attributed to a lower electrical conductivity. We, therefore, highlight that the rate capability can be optimized via Ti substitution.
The cyclic voltammograms (CV) shown in Figure 6A–D confirm the results obtained from GCPL experiments. The reduction process has a more complex reaction mechanism. The CV of NNB (Figure 6A) shows two distinct oxidation peaks at 3.33 V and 3.55 V and the corresponding reduction peaks at 3.47 V and 3.21 V. There is a broad peak at 3.1 V (Figure 6A), which is situated near the peak at 3.21 V and it is in agreement with the appearing of the phase transition O’3–O3 during sodiation. An additional formed phase can prevent attainability of the thermodynamic equilibrium. The sequence of several successive phase transitions is typical for NaMO2 layered cathode materials and can be a reason for the huge potential drop during the sodiation process [12]. The mentioned broad peak at 3.1 V in NNB becomes sharp and distinct by Ti substitution, which suggests better kinetics. However, NNBT0.1 and NNBT0.3 have a broader peak at 3.55 V as well as an additional peak at 3.5 V, which is not present in NNB. The peak area ratios and peak shift between oxidation and reductions for NNB and NNBT0.1 are quite similar, whereas for NNBT0.3 each CV curve is perfectly overlapped without any shift in the voltage range between 2.5 V and 3.8 V [25]. The broad oxidation peak at 3.55 V in NNBT0.1 has also become wider in NNBT0.3, which indicates a phase transition suppression with a higher amount of Ti. To better understand the associated phase transformation, in operando synchrotron radiation diffraction was performed.
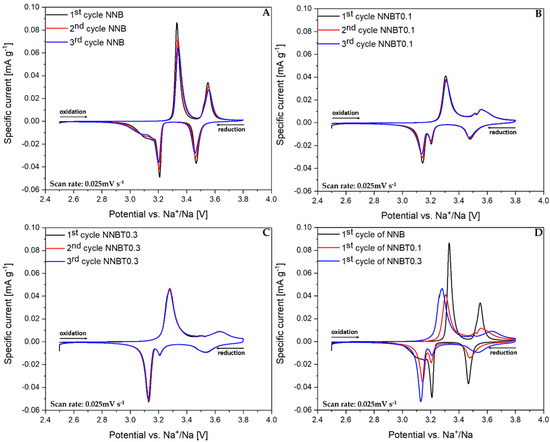
Figure 6.
Normalized cyclic voltammograms (CV) of NNB, NNBT0.1 and NNBT0.3 at a scan rate of 0.025 mV s−1 (A–C) three cycles of each material and (D) the 1st cycle of all cathodes.
In all compounds, the desodiation of the O3 phase starts with a solid solution mechanism (single phase), which is marked by a blue region in the diagram for the NNB (A), NNBT0.1 (B) and NNBT0.3 (C) compounds (Figure 7A–C). In these regions, the a and b parameters are decreasing and the c parameter is increasing. The solid solution regions are followed by two-phase regions (coloured in orange), where the O3 phase is exchanged by P3. In the two-phase O3-P3 region, the parameters a, b and c of both phases are slightly changing. This is an indication for a non-equilibrium state, that allows describing this region with both mechanisms: solid-solution reaction and two-phase reaction, which are observed concurrently. The O3-P3 two-phase reaction at 3.31 V is caused by the TMO2 slabs gliding without breaking the TM-O bonds during the desodiation process. At the same time, the oxygen packing of the TM layers changes from “AB CA BC” to “AB BC CA” [26]. This means that the phase transition is a reconstructive one, therefore necessarily of 1st order and prone to coexisting phases. This phenomenon demonstrates that the coexistence of the two phases is the main reason for the voltage plateau at 3.31 V (Figure 3 and Figure 4). The trend of parameters change in the O3-P3 two-phase region (Figure 8) demonstrates that this transition happens through several states. In the NNB compound, the a, b, c and β parameters slowly decrease until the tipping point—60%w/w P3 (Figure 8A–D). Thereafter, the a and c parameters keep on decreasing, while b starts to increase (Figure 8A–C). Figure 8E illustrates the mirror-like character of the unit cell volume change of the O3 NNBT0.3 phase in comparison to NNB. For NNBT0.1 and NNBT03, parameters a and c are increasing, while b is decreasing. The Ti substituted compounds have a bigger fluctuation of parameters after tipping points, which move to the 70%w/w P3 for NNBT0.1 and 75%w/w P3 for NNBT0.3 (Figure 8A–D). It can be proposed as the inception of intermediate P’3 phase. At the same time, the tipping point 60%w/w P3 in the NNB indicates that the O3 layered structure starts to strain and then transforms to the O’3-type structure, which occurs during the sodiation process. Simultaneously, the a, b, and c parameters of the rhombohedral P3 phase are monotonically decreasing in the O3-P3 two-phase region (Figure S3). The lattice parameter c also has a tipping point at 60%w/w P3 (Figure S3B). Furthermore, at the higher potential (3.52 V), the materials undergo another two-phase transition from the P3 phase to the O1 phase. The presence of Ti in the NNBT0.1 and NNBT0.3 structures can partly suppress the P3-O1-P3 transformation. In this case, the broadening of the O1 phase reflection can be observed in the diffraction pattern (Figure 9). This phase transition for the NNBT0.3 composition is accompanied by the appearance of a structural disorder O1 phase on the alternating TMO2 and Na-octahedral layers called “stacking faults”. As a result of the stacking faults, the 11-l reflections become broader or disappear. When the NNB sample is sodiated to 2.5 V, it transforms back to the O3 phase, recovering the initial structure. In operando investigation shows that different ratios of integrated Ti-cations on the metal layer can have an influence on the phase transitions upon electrochemical reaction. Although the desodiation process is quite similar for all compositions, a difference in the phase transition mechanism appears during the sodiation process. For the Ti-free structure NNB, the transformation during sodiation follows the sequence O1-P3-O’3-O3 (Figure 7A). Both O’3 and O3 phases are monoclinic C 2/m with slightly different unit cell parameters. During the second cycle, in the desodiation process, it is possible to recognize the coexistence of 3 phases (the yellow region in the diagram) (Figure 7A): O3, O’3 and P3. The thermodynamic equilibrium is not reached due to slow Na+-ion diffusion and it can be the reason for the poor cycle stability. For NNBT0.1, the sodiation mechanism is different and the transformation follows O1-P’3-O’3-O3 (Figure 7B). NNBT0.1 shows the relatively poorest coulombic efficiency. The reason is a not wholly transformed O’3 intermediate phase to the new intermediate P`3 phase. This causes, that the active material do not return to the initial state after one cycle and it is composed by multiple phases. The new appeared P’3 phase (a = 3.0277(3), c = 16.821(4)) crystallizes in the same rhombohedral R-3m space group, like P3 (a = 3.0188(3), c = 16.943(3)). Difference in the parameters can be explained by less Na+ content in the P3 phase compared to the P’3 one. The presence of a small amount of O’3 structure leads to the formation of a three-phase region (P’3, O’3, O3) during the first sodiation process. The presence of the three-phases can be correlated to the lowest value of specific capacity. For the composition with the highest Ti content NNBT0.3, the absence of the O’3 phase (Figure 7C) in the sodiation mechanism improves the kinetics of the electrochemical reaction and the thermodynamic equilibrium can be reached during phase transformations O1-P3-P’3-O3. The phase transition P3-P’3 starts at 3.2 V during the sodiation process and corresponds to the appearance of a new reduction peak on the CV (Figure 6C). Both phases create the small two-phase region, where first-order phase transitions exhibit a discontinuity in the first derivative of the free energy with respect to some thermodynamic variable. The phase P’3 is an intermediate state between the P3 and O3 structure. The appearance of the P’3 phase was also previously reported for the Na3Ni2RuO6 composition [26]. Li et al. [26] suggest that the O3 to P3 phase transition occurs as a gradual change process, where various intermediate phases such as O′3 and O′′3 or P’3 phases can exchange each other or coexist. In the case of the Ti-containing material compositions, the exchange of the O’3 intermediate phase by the P’3 phase is observed. Predictably, the Na+-ion diffusion in the material with P’3 intermediate is facilitated. The sodium ions are expected to have a better diffusion ability through prismatic sites in comparison to the octahedral ones [14]. Another factor, which improves the cycling stability is the suppression of phase transitions at high potentials. Zhao et al. [27] demonstrated that such a phase transition can be suppressed by doping another O3-type Ni2+-based cathode with 3d metals (Cu, Zn, Co, Mn). The addition of Ti to the NNB honeycomb structure partially suppresses the P3-O1-P3 phase transition. Thereby, the Ti substituted honeycomb structure improves the kinetics due to the presence of a P’3 intermediate phase with Na-prismatic layers resulting in superior better capacity retention at higher current and absence of three phase regions in the electrochemical mechanism of the NNBT0.3 material.
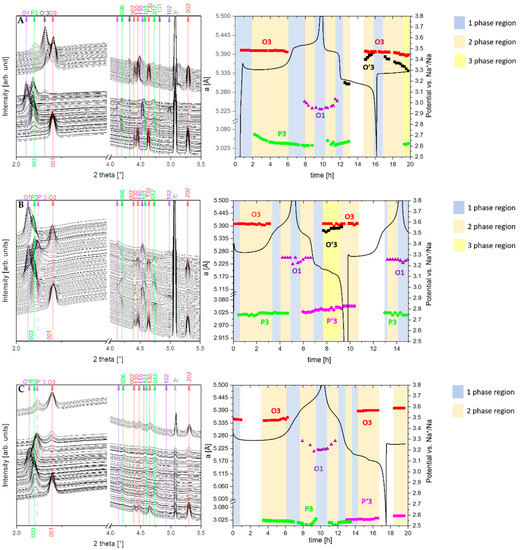
Figure 7.
In operando synchrotron radiation diffraction patterns, collected during the first charge/discharge of NNB (A), NNBT0.1 (B) and NNBT0.3 (C) cells under a current rate of 0.1 C at a potential range between 2.5 V and 3.8 V vs Na+/Na. The white coloured parts represent beam-lost, where diffraction patterns are not recorded.
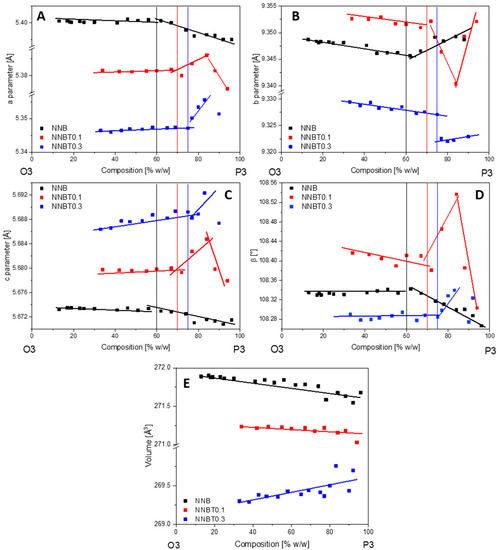
Figure 8.
Changes of lattice parameters a, b, c and β (A–D) and unit cell volume (E) of the O3 phase for the compositions NNB, NNBT0.1 and NNBT0.3 in the two-phase region O3-P3.
Figure 9.
The reflections of O1 phase, with the space group P-31m, on the powder diffraction patterns at the high potential 3.8V. The broadening of the 11-l reflections by the appearance of stacking faults are observed in the raw of compounds: NNB, NNBT0.1 and NNBT0.3.
4. Conclusions
Na3Ni2-xBi1-yTix+yO6 was synthesized using a conventional sol-gel method and its electrochemical results were compared to the NNB pristine material, which has an initial desodiation capacity of ~93 mAh g−1 at 0.1 C and 62mAh g−1 at 1 C. The substitution of electrochemically active Ni2+ and inactive Bi5+ with inactive Ti4+ enhances the cycling stability and improves the kinetics. At 0.1 C, NNBT0.1 (~77 mAh g−1) and NNBT0.3 (~82 mAh g−1) have a smaller capacity than NNB, but the capacity loss after 100 cycles is similar for all three electrodes (~40%). However, at 1 C NNB shows the smallest capacity (~62 mAh g−1) compared to NNBT0.1 (~69 mAh g−1) and NNBT0.3 (~74 mAh g−1). Nevertheless, the loss of capacity after 100 cycles is reduced via Ti-substituion up to ~16% for NNBT0.3. According to in operando synchrotron diffraction data, the NNB turns through O3-P3-O1 phases during the first desodiation, while O1-P3-O’3-O3 forms during the first sodiation. A possible reason for the improvement in kinetics is that the additional O’3 phase is exchanged by a kinetically more favourable P’3 phase when increasing the Ti concentration in NNB. The amount of Ti = 0.3 mol was found as the maximum Ti concentration to form a solid-solution region in the NaNi0.5Ti0.5O2-Na3Ni2BiO6 system. For the NNBT0.3 composition with maximum Ti content, a transition of O1-P3-P’3-O3 during the electrochemical process is observed. The partly suppression of the P3-O1-P3 phase transition has been demonstrated. We propose that this phase suppression and the associated appearance of the P’3 phase results in improved kinetics and the enhancement of the rate performance. For further work, the focus should be on achieving even higher cycling stability for the honeycomb structure cathode material. Moreover, a long term in operando synchrotron radiation diffraction should be done to investigate how phase transitions occur during long term cycling.
Supplementary Materials
The following are available online at https://www.mdpi.com/1996-1073/13/24/6498/s1, Figure S1: Linear dependence of lattice parameter a, b, c, β and their corresponding change in unit cell volume., Figure S2: Scanning electron microscopy (SEM) images for the morphological characterization of pristine NNB [A], NNBT0.1 [B], NNBT0.3 [C] and NNBT0.5 [D]., Figure S3: Changes of lattice parameters a, c (A, B) and unit cell volume (C) of the P3 phase for the compositions NNB, NNBT0.1 and NNBT0.3 in the two-phase region O3-P3, Table S1: Structural information of all synthesized compounds.
Author Contributions
Conceptualization, A.S.; investigation, E.Z.; data curation, E.Z. and A.S.; writing—original draft preparation, E.Z.; writing—review and editing, S.D., H.E., A.S., K.P. and E.Z.; in operando measurements: M.E., A.S. and K.P.; XRD: A.S. and K.P., SEM: K.P.; material synthesis: E.Z.; electrochemical characterization: E.Z.; All authors have read and agreed to the published version of the manuscript.
Funding
This research was funded by the German Research Foundation (DFG) under Project ID 390874152 (POLiS Cluster of Excellence).
Acknowledgments
This work contributes to the research performed at CELEST (Center for Electrochemical Energy Storage Ulm-Karlsruhe). We would acknowledge Thomas Bergfeldt (IAM-AWP) for the chemical analysis.
Conflicts of Interest
The authors declare no conflict of interest.
References
- Crabtree, G. The coming electric vehicle transformation. Science 2019, 366, 422–424. [Google Scholar] [CrossRef] [PubMed]
- Kim, S.W.; Seo, D.H.; Ma, X.; Ceder, G.; Kang, K. Electrode Materials for Rechargeable Sodium-Ion Batteries: Potential Alternatives to Current Lithium-Ion Batteries. Adv. Energy Mater. 2012, 2, 710–721. [Google Scholar] [CrossRef]
- Hwang, J.Y.; Myung, S.T.; Sun, Y.K. Sodium-ion batteries: Present and future. Chem. Soc. Rev. 2017, 46, 3529. [Google Scholar] [CrossRef] [PubMed]
- Han, M.H.; Gonzalo, E.; Singh, G.; Rojo, T. A comprehensive review of sodium layered oxides: Powerful cathodes for Na-ion batteries. Energy Environ. Sci. 2015, 8, 81–102. [Google Scholar] [CrossRef]
- Wang, L.; Wang, J.; Zhang, X.; Ren, Y.; Zuo, P.; Yin, G.; Wang, J. Unravelling the origin of irreversible capacity loss in NaNiO2 for high voltage sodium ion batteries. Nano Energy 2017, 34, 215–223. [Google Scholar] [CrossRef]
- Maletti, S.; Sarapulova, A.; Schökel, A.; Mikhailova, D. Operando Studies on the NaNi0.5Ti0.5O2 Cathode for Na-Ion Batteries: Elucidating Titanium as a Structure Stabilizer. ACS Appl. Mater. Interfaces 2019, 11, 33923–33930. [Google Scholar] [CrossRef] [PubMed]
- Sun, Y.; Guo, S.; Zhou, H. Exploration of Advanced Electrode Materials for Rechargeable Sodium-Ion Batteries. Adv. Energy Mater. 2019, 9, 1800212. [Google Scholar] [CrossRef]
- Delmas, C.; Fouassier, C.; Hagenmuller, P. Structural classification and properties of the layered oxides. Physica 1980, 99, 81–85. [Google Scholar] [CrossRef]
- Bhange, D.S.; Ali, G.; Kim, D.H.; Anang, D.A.; Shin, T.J.; Kim, M.G.; Kang, Y.M.; Chung, K.Y.; Nam, K.W. Honeycomb-layer structured Na3Ni2BiO6 as a high voltage and long life cathode material for sodium-ion batteries. J. Mater. Chem. A 2017, 5, 1300–1310. [Google Scholar] [CrossRef]
- Vinckevičiūtė, J.; Radin, M.D.; Van der Ven, A. Stacking-Sequence Changes and Na Ordering in Layered Intercalation Materials. Chem. Mater. 2016, 28, 8640–8650. [Google Scholar] [CrossRef]
- Zheng, L.; Obrovac, M.N. Investigation of O3-type Na0.9Ni0.45MnxTi0.55-xO2 (0 ≤ x ≤ 0.55) as positive electrode materials for sodium-ion batteries. Electrochim. Acta 2017, 233, 284–291. [Google Scholar] [CrossRef]
- Yuan, D.; Liang, X.; Wu, L.; Cao, Y.; Ai, X.; Feng, J.; Yang, H. A honeycomb-layered Na3Ni2SbO6: A high-rate and cycle-stable cathode for sodium-ion batteries. Adv. Mater. 2014, 26, 6301–6306. [Google Scholar] [CrossRef] [PubMed]
- Wang, P.F.; Guo, Y.J.; Duan, H.; Zuo, T.T.; Hu, E.; Attenkofer, K.; Li, H.; Zhao, X.S.; Yin, Y.X.; Yu, X.; et al. Honeycomb-Ordered Na3Ni1.5M0.5BiO6 (M = Ni, Cu, Mg, Zn) as High-Voltage Layered Cathodes for Sodium-Ion Batteries. ACS Energy Lett. 2017, 2, 2715–2722. [Google Scholar] [CrossRef]
- Yabuuchi, N.; Komaba, S. Recent research progress on iron- and manganese-based positive electrode materials for rechargeable sodium batteries. Sci. Technol. Adv. Mater. 2014, 15, 1–29. [Google Scholar] [CrossRef] [PubMed]
- Seibel, E.M.; Roudebush, J.H.; Wu, H.; Huang, Q.; Ali, M.N.; Ji, H.; Cava, R.J. Structure and Magnetic Properties of the α-NaFeO2-Type Honeycomb Compound Na3Ni2BiO6. Inorg. Chem. 2013, 52, 13605–13611. [Google Scholar] [CrossRef] [PubMed]
- Weingarth, D.; Zeiger, M.; Jäckel, N.; Aslan, M.; Feng, G.; Presser, V. Graphitization as a Universal Tool to Tailor the Potential-Dependent Capacitance of Carbon Supercapacitors. Adv. Energy Mater. 2014, 4, 1400316. [Google Scholar] [CrossRef]
- Conder, J.; Villevieille, C. How reliable is the Na metal as a counter electrode in Na-ion half cells? Chem. Commun. 2019, 55, 1275–1278. [Google Scholar] [CrossRef]
- Pfeifer, K.; Arnold, S.; Becherer, J.; Das, C.; Maibach, J.; Ehrenberg, H.; Dsoke, S. Can Metallic Sodium Electrodes Affect the Electrochemistry of Sodium-Ion Batteries? Reactivity Issues and Perspectives. ChemSusChem 2019, 12, 3312–3319. [Google Scholar] [CrossRef]
- Roisnel, T.; Rodriguez-Carvajal, J. WinPLOTR: A Windows tool for powder diffraction patterns analysis. Mater. Sci. Forum. 2001, 378−381, 118–123. [Google Scholar]
- Yu, H.; Guo, S.; Zhu, Y.; Ishida, M.; Zhou, H. Novel titanium-based O3-type NaTi0.5Ni0.5O2 as a cathode material for sodium ion batteries. Chem. Commun. 2014, 50, 457–459. [Google Scholar] [CrossRef]
- Vegard, L. Die Konstitution der Mischkristalle und die Raumfüllung der Atome. Z. Phys. 1921, 5, 17–26. [Google Scholar] [CrossRef]
- Liu, J.; Yin, L.; Wu, L.; Bai, J.; Bak, S.M.; Yu, X.; Zhu, Y.; Yang, X.Q.; Khalifah, P.G. Quantification of Honeycomb Number-Type Stacking Faults: Application to Na3Ni2BiO6 Cathodes for Na-Ion Batteries. Inorg. Chem. 2016, 55, 8478–8492. [Google Scholar] [CrossRef] [PubMed]
- Seibel, E.M.; Roundebush, J.H.; Ali, M.N.; Ross, K.A.; Cava, R.J. Structure and Magnetic Properties of the Spin-1/2-Based Honeycomb NaNi2BiO6-δ and Its Hydrate NaNi2BiO6-δ.1.7H2O. Inorg. Chem. 2014, 53, 10989–10995. [Google Scholar] [CrossRef] [PubMed]
- Lu, Z.; Dahn, J.R. In Situ X-ray Diffraction Study of P2 Na2/3[Ni1/3Mn2/3]O2. J. Electrochem. Soc. 2001, 148, A1225. [Google Scholar] [CrossRef]
- Wang, H.; Yang, B.; Liao, X.Z.; Xu, J.; Yang, D.; He, Y.S.; Ma, Z.F. Electrochemical properties of P2-Na2/3[Ni1/3Mn2/3]O2 cathode material for sodium ion batteries when cycled in different voltage ranges. Electrochim. Acta 2013, 113, 200–204. [Google Scholar] [CrossRef]
- Li, Q.; Xu, S.; Guo, S.; Jiang, K.; Li, X.; Jia, M.; Wang, P.; Zhou, H. A Superlattice-Stabilized Layered Oxide Cathode for Sodium-Ion Batteries. Adv. Mater. 2020, 32, 1907936. [Google Scholar] [CrossRef]
- Zhao, C.; Lu, Y.; Chen, L.; Hu, Y.S. Ni-based cathode materials for Na-ion batteries. Nano Res. 2019, 12, 2018–2030. [Google Scholar] [CrossRef]


Publisher’s Note: MDPI stays neutral with regard to jurisdictional claims in published maps and institutional affiliations. |
© 2020 by the authors. Licensee MDPI, Basel, Switzerland. This article is an open access article distributed under the terms and conditions of the Creative Commons Attribution (CC BY) license (http://creativecommons.org/licenses/by/4.0/).