Abstract
The article presents issues related to the possibility of using electric and hybrid systems to drive Small Waterplane Area Twin Hull (SWATH) vessels. Ships of this type have significantly less sway and heave compared to monohull crafts and catamarans. Thanks to the synergistic combination of the hydrodynamic properties of SWATH hull and electric drive systems, they can be an interesting proposition for use in transport of passengers and offshore wind farms service crews. The paper presents comparative test results of an electric drive system powered by Hybrid Energy Storage System, which are a combination of systems consisting of batteries (BAT), hydrogen fuel cells (FC) and diesel generators (D). For the presented configurations of propulsion systems, mathematical models taking into account the hydrodynamic resistance of the hull of the vessel have been developed and implemented in the Modelica simulation environment. The tests carried out for various configurations of the drive system have shown reduced energy consumption by the DIESEL-ELECTRIC drive system (by approx. 62%), as well as the reduction of harmful greenhouse gas emissions to the atmosphere (by approx. 62%) compared to the conventional DIESEL drive.
1. Introduction
The restrictions related to the emission of harmful gases to the atmosphere related to transport [1,2,3,4] contribute to the development of environmentally friendly technologies. In order to achieve this task, an effort related to the use of ecological drive systems [5], including electric and hybrid [6,7], is undertaken. Thanks to the use of low-emission drive systems, the level of energy consumption is reduced, as well as the amount of poisonous exhaust gases emitted to the natural environment [8,9]. The exhaust gases emitted by the internal combustion engine include those that can be classified as harmless to the health of living organisms (oxygen O2, nitrogen N2, hydrogen H2); poisonous to living organisms (carbon monoxide CO, HC hydrocarbons and their derivatives, nitrous oxides (monoxide and dioxide), sulphur oxides (monoxide, dioxide, trioxide), soot and smoke (PM), ashes, heavy metals, other solid substances and heavy organic compounds) harmful to the environment and favouring the development of the greenhouse phenomenon in the atmosphere (carbon dioxide CO2, methane CH4, ammonia NH3, nitrous oxide N2O) [10,11]. Another factor contributing to the reduction of energy consumption and the amount of poisonous exhaust gases emitted to the atmosphere by ships is the use of hull structures with low hydrodynamic drag [12,13] or optimization of the hull shape in terms of minimizing motion resistance [14,15]. In practice, one can come across innovative structures limiting resistance, such as, a catamaran with an air cushion [16], multihull crafts with various float configurations [17,18], numerous designs of SWATH type vessels [19,20,21] and various innovative structures employing hydrofoils [22,23,24,25,26,27,28,29]. Anti-collision systems [30,31,32,33,34] and methods of optimal ship steering [35,36,37,38,39,40] are also used as another way of minimizing the ship energy consumption.
Bearing in mind the comfort of people working and transported by sea, parallel efforts are made to develop a ship hull structure with the greatest possible stability in wave. The minimum level of acceleration that should be met by sea vessels in order to ensure the comfort of travel according to ISO 6954: 2000 is 0.2 g for the crew and passengers and 0.4 g for an experienced crew [41].
The above criteria are certainly met by Small Waterplane Area Twin Hull (SWATH) vessels. Due to the stable position of this type of ships in wave, they can be used in hydrographic surveys, passenger transport, public utility services, offshore wind farms and others.
With the development of tools for modeling the hydrodynamic drag of the ship’s hull [42], the design of the SWATH type underwent modifications [21] from the 1st generation developed in the 1970s, consisting of two struts and two torpedo-shaped floats through the SWATH II (four struts, two torpedoes) [43], SWATH III (four struts, four torpedoes), up to the SWASH (one central strut and large torpedo, with two small side floats) (Figure 1) and finally to vessels using hydrofoils under its hull like the HYSWATH [44].
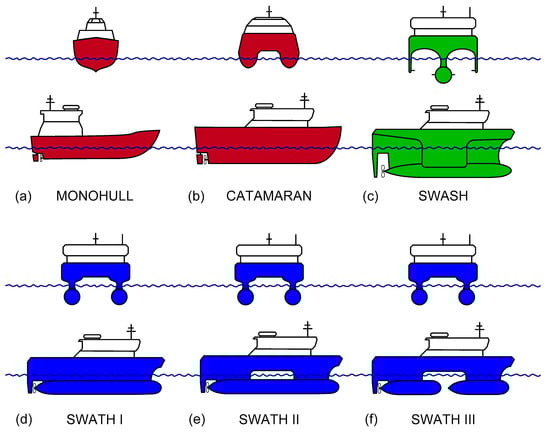
Figure 1.
Comparison of hull shapes of various vessel types: (a) MONOHULL, (b) CATAMARAN, (c) SWASH, (d) SWATH I, (e) SWATH II, (f) SWATH III.
SWATH type vessels are built on the basis of two submerged floats connected by struts to the platform above the waterline. Thanks to this, they have a hull with a small waterline area, which minimizes the contact area with the sea surface. Minimizing the area of the ship having contact with the water surface has a very beneficial effect on reducing the wave resistance of the ship’s hull. At the same time, basing the structure on two submerged torpedoes results in very high stability at high operating speeds and significant waves on the high seas. Unfortunately, the use of submerged torpedoes increases the total wetted surface area and increases the frictional resistance. Thanks to this, SWATH ships achieve very high stability at high operating speeds and significant waves on the high seas [12,21,45]. Additionally, they have a large, wide and flat platform that can be used for transportation of goods or to install specialized equipment. Examples of SWATH vessel structures are shown in Figure 2.
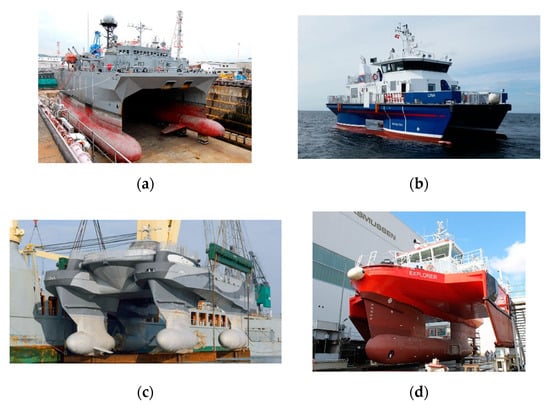
Figure 2.
Sample photos of SWATH ships: (a) SWATH GEN. I [46], (b) SWATH GEN. II [47], (c) SWATH GEN. III [48], (d) SWATH GEN. IV–SWASH [49].
The article analyzes the possibility of using an electric propulsion system for a SWATH type vessel powered by Hybrid Energy Storage System, consisting of: a chemical-based energy store (rechargeable battery packs—BAT), a hydrogen fuel cell (FC) and a diesel engine generator (D).
Based on the operational data from the actual SWATH ship, simulation models were developed for which the conventional internal combustion engine propulsion system was replaced with an electric one powered by Hybrid Energy Storage System (HESS). The advantage of using electric main propulsion of the ship is the possibility of reducing the energy consumption and emission of poisonous gases into the atmosphere.
2. Operational Properties of SWATH Vessels
Increased stability of SWATH vessels on the wave compared to monohull ships, and the possibility of reducing the emission of harmful gases into the atmosphere from the diesel propulsion system, have a positive net effect on the possibility of their implementation. SWATH ships are characterized by small waterplane area, thanks to their streamlined shape and small area struts supporting the wide and spacious structure of the main deck on two submerged hulls similar to torpedoes. It is estimated that the SWATH type vessels have a waterline area that is half the size of monohull vessels of similar displacement. SWATH struts are characterized by streamlined shapes, thanks to which the wave resistance of such a vessel is much lower than in a classic monohull. The presence of the supports has an effect on reducing the volume of the ship’s hull and the area of its contact with sea waves. As a result, the energy transferred by the waves to the hull is lower, and the ship itself becomes more stable. At the same time, the space available on board of a SWATH vessel is much larger compared to monohull vessels. Unfortunately, placing the load-bearing elements of the SWATH structure completely under the water surface increases the total wetted area of vessel and increases the frictional resistance, which in turn translates into increased consumption of energy used to propel the ship. On the other hand, when the torpedo-shaped hulls are submerged, they act as stabilizers, using the phenomenon of an exponential decrease in wave influence with increasing depth. An important element when designing a SWATH vessel is the selection of the appropriate width between the supports. The spacing of supports influences the ship’s stability related to the action of heeling moments from wind and the movement of the transported cargo and passengers. Figure 3 shows an example of a vessel of the SWATH II type, called M/V FOB SWATH 4, which belongs to the family of sister vessels built at Danish Yachts A/S. These ships are currently used mainly to operate offshore wind farms [50].
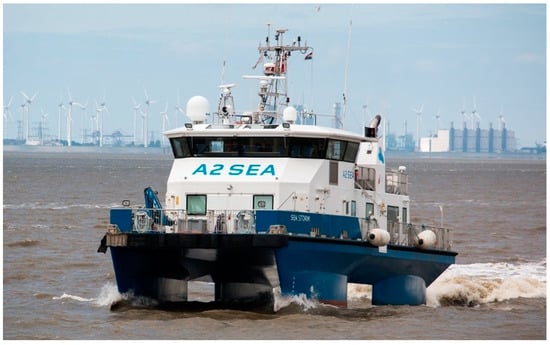
Figure 3.
SWATH GENERATION II–M/V FOB SWATH 4, IMO 9672947, (former SEA STORM) [51].
The operational data of an exemplary FOB SWATH vessel was taken from the shipowner [52]. Table 1 presents exemplary parameters of M/V FOB SWATH 2,3,4,5 and 6.

Table 1.
Specification of M/V FOB SWATH 2,3,4,5 and 6 [52,53].
The SWATH propulsion system is most often located in submerged torpedoes and partially in the supports together with ballast, fuel and freshwater tanks. Classic propellers or water jet drives are used as propulsors. Both designs can be driven by internal combustion engines located on the vessel’s deck and transmitting the driving torque through the Z-type drive with bevel gears or directly by engines located in the torpedoes and transmitting the driving torque through the propeller shaft or belt transmissions. In some constructions, gearboxes between the drive motor and the propeller are used to increase the efficiency of the drive system. The location of the drive system components has an obvious impact on the dimensions of the struts, which translates into the value of the wave resistance of the vessel. An important aspect is also crew access to the propulsion system components and the possibility of service. The employed propulsion systems make it possible to accelerate these ships to speeds of up to 25 kn. SWATH type crafts are characterized by very good wave stability and resistance to rolling even in difficult sea conditions and wave height reaching several meters. Table 2 presents a summary of the design parameters of Monohull/Catamaran/SWATH ships.
Table 2.
Comparison of design parameters of Monohull/Catamaran/SWATH craft types.
In order to reduce energy consumption for ship motion, it is proposed to use an electric propulsion system powered by HESS. The use of an electric propulsion system can contribute to an increase in its overall efficiency, which would consequently translate into a reduction in energy consumption for ship propulsion and the amount of exhaust gases emitted into the atmosphere. The electric drive system, including the main electric machine, is characterized by smaller dimensions compared to the conventional internal combustion engine. Moreover, the use of energy storage in the form of HESS, and in particular electrochemical batteries, contributes to the even distribution of the ship’s weight. Thanks to the use of the power grid on the ship, it is possible to arrange the elements of the electric propulsion system in different places of the ship, ensuring optimal use of space. Moreover, in order to increase the ship’s operability, it is possible to use containerized, interchangeable energy stores, which can be easily installed onboard the vessel. Several configurations of propulsion systems were analysed: DIESEL (ship powered only by an internal combustion engines); BAT-D (vessel powered by electric motors powered by battery electricity storage and diesel generating sets); BAT (ship powered by electric motors powered only by battery electricity storage); FC-BAT-D (vessel powered by electric motors powered by hydrogen fuel cell and battery electricity storage with diesel generating sets), FC-BAT (vessel powered by electric motors powered by hydrogen fuel cell and battery electricity storage).
3. Modeling
3.1. Mathematical Description
An important element influencing the operational properties of a marine craft is the optimal selection of the propulsion system. The above issue should be resolved on the basis of the tasks the vessel will perform, the future navigation area and operational requirements. An essential element when choosing a propulsion system is to determine the total resistance associated with a moving ship, and on this basis, with the known efficiency of propellers, it is possible to determine the power necessary to propel the ship under specific environmental conditions (ship speed, sea state, wind strength, sea currents). The total resistance of a moving ship is related to the external and hydrodynamic forces acting on the hull. The magnitude of these forces depends mainly on the speed of the ship, as well as its geometrical dimensions and shape.
The estimated value of the resistance of every ship can be determined by a dependence taking into account the following values: wave resistance, frictional resistance, pressure resistance and additional resistance:
where: RTOT—total ship resistance; Rw—wave resistance; Rfr—frictional resistance; Rp—pressure resistance; RADD—additional resistance.
There are many studies in the literature explaining the individual components of Equation (1) and the method of determining the total resistance of the ship [26,54,55,56,57]. However, it should be remembered that the parameters that are taken into account when determining the total resistance of a SWATH vessel are more complicated and must take into account more components related to the geometrical dimensions of the SWATH hull, such as: dimensions of torpedoes and supports, spacing of torpedoes, draft, superstructure height and others [12].
Taking into account the appropriate coefficients, the total resistance of a SWATH type vessel can be expressed by the relationship:
where: ρW—density of water (kg/m3); v—SWATH speed (m/s); Cw—wave resistance coefficient (-); Cfr—frictional resistance coefficient (-); Cp—pressure resistance coefficient (-); CADD—additional resistance coefficient (-); Ω—wetted area of the hull (m2).
Depending on the shape of the hull of a SWATH type ship, the percentage share of particular types may change with the change of the speed of the vessel. The wave resistance Rw, related to the formation of waves from the moving hull, due to the slender structure and streamlined shape of the supports is small and, at low speeds, it can amount to 10 to 20% of the total resistance. At higher speeds, the wave resistance can be as high as 50% of the total resistance. The percentage share of the frictional resistance Rfr in the total drag of a SWATH vessel can be as high as 70 to 90% due to the large, wetted area of this type of craft in relation to monohull vessels. The pressure resistance Rp, caused by the turbulence of the water flowing around the ship’s torpedo floats, depends mainly on their shape and the ship speed. Usually, the value of the pressure resistance for SWATH ships is small and amounts to few percent of total resistance.
The value of additional resistance RADD is mainly influenced by: aerodynamic resistance; appendage resistance of protruding parts such as rudder, propellers, fins, etc.; resistance due to fouling of the hull with seaweed; resistance resulting from deterioration of weather conditions; resistances in shallow waters and in channels which are negligibly small. The value of additional resistances can be initially estimated on the basis of:
where: Rair—aerodynamic drag (kN), dependent on the speed of the ship and the force of the wind acting on the surface of the ship’s hull; Rap—appendage resistance (kN), shows the influence of various hull appendages such as propeller, rudders, keels, skegs, thrusters, stabilizer fins, and exposed propeller shafts; Rhf—hull fouling resistance (kN); Rac—atmospheric conditions resistance (kN), dependent with the state of the sea.
Aerodynamic drag value Rair under normal weather conditions does not exceed 2 to 5% of the total drag. The value of appendage resistance Rap, depending on the used components and drive system, can be up to about a dozen percent of total resistance (bow thrusters 1–5%, shaft covers 4–8%). Depending on the frequency of surveys of the ship’s hull and the water temperature in the area in which it is operated, the value of resistance related to fouling of the hull, Rhf, may be from 0.2 to 0.5% of the total resistance. The most unpredictable and difficult to determine resistances are related to fluctuating hydro-meteorological conditions. Changes in wind speed and the resulting wave may lead to increased heeling, dive, rocking and flooding the sides and decks. They can also decrease the efficiency of the propeller and increase the resistance to motion. For SWATH vessels, despite the fact that they are very resistant to unfavorable weather conditions, in extreme conditions the value of resistance related to hydro-meteorological conditions may reach a value of up to 25% of the total resistance.
Based on the knowledge of the total resistance value RTOT and assuming the overall efficiency of individual elements of classic ship structures, at the level of: free running propeller efficiency (0.35–0.75), rotational efficiency (1–1.07), the shaft line efficiency (0.9–0.99), hull efficiency (0.95–1.05) [12,58,59,60], it is possible to determine the power value of PM (electric motor/internal combustion engine) motors used to drive the SWATH type vessel. For SWATH type units, the ranges of the presented coefficients may be slightly wider, depending on the shape of the structure and the number of torpedoes and struts. To determine the power of the propulsion engine, it is necessary to know the drive train efficiency, which consists of:
where: PM—power of drive motor (kW); RTOT—total resistance (kN); v—SWATH speed (m/s); η—drive train efficiency; ηH—SWATH hull efficiency.
Figure 4 shows the value of individual resistances related to the motion of a SWATH II vessel.
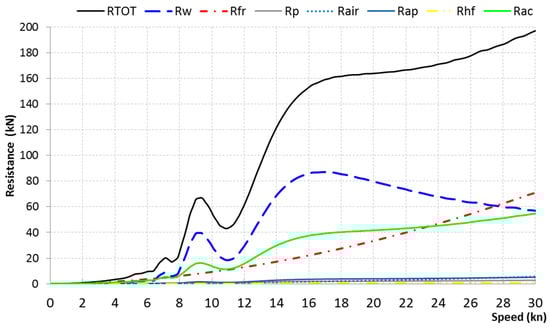
Figure 4.
Resistance related to a moving SWATH II vessel.
The Holtrop and Multihull methods [61] implemented in FREE!Ship Plus software were used to estimate the total resistance and the necessary drive power for vessels of similar dimensions namely MONOHULL, CATAMARAN, SWATH I, SWATH II shown in Figure 5, SWATH III, and SWATH IV a.k.a. SWASH, the parameters of which are presented in Table 2. The presented test results and characteristics are approximate in order to maintain the same calculation methods to enable comparative tests.
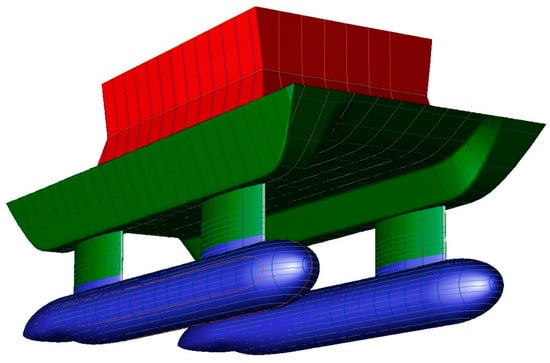
Figure 5.
Geometric shape of the SWATH II hull in FREE!ship [61].
Figure 6 shows the approximate results of calculations of the total resistance, depending on the vessel speed for the above-mentioned ships. The presented dependencies show that the hull of the SWASH craft has the lowest resistances in the speed range from 0–14 [kn] to 24–30 [kn], while in the speed range of 14–24 [kn] the MONOHULL vessel performs better.
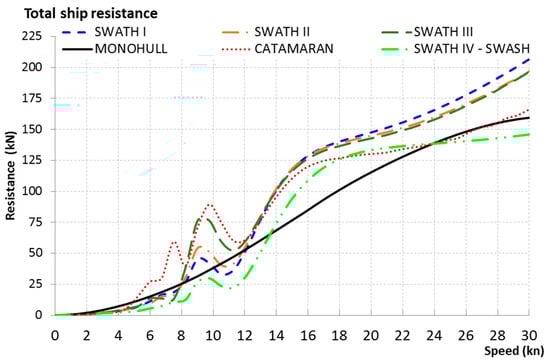
Figure 6.
Approximate plot of the relationship of total resistance versus longitudinal speed for MONOHULL, CATAMARAN, SWATH I, SWATH II, SWATH III, SWATH IV–SWASH ships.
Figure 7 shows the results of the demand for propulsive power of MONOHULL, CATAMARAN, SWATH I, SWATH II, SWATH III, SWATH IV–SWASH vessels.
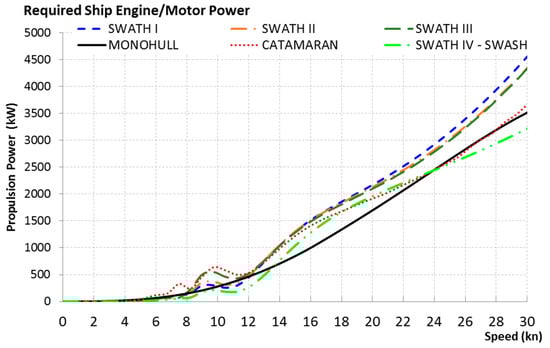
Figure 7.
Approximate plot of the relationship of required drive power versus longitudinal speed for MONOHULL, CATAMARAN, SWATH I, SWATH II, SWATH III, SWATH IV–SWASH vessels.
SWATH I, SWATH II and SWATH III ships, thanks to the ballast tanks, can change their draft. This allows them to be operated in two modes: with submerged floats, as SWATH ships and with floats partially surfaced, in catamaran mode. Figure 8 shows the results of calculations of total resistance for the two operating modes of SWATH type vessels with torpedoes submerged (draft max 2.40 m) (SWATH I, SWATH II, SWATH III) and surfaced (draft max 1.80 m), in catamaran mode (SWATH I cat, SWATH II cat, SWATH III cat).
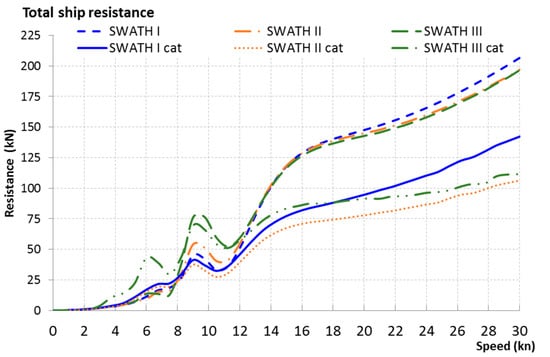
Figure 8.
Approximate plot of the relationship of total resistance versus longitudinal speed for SWATH I, SWATH II and SWATH III ships depending on float submerged/surfaced mode.
Figure 9 shows the results of the demand for propulsive power for SWATH I, SWATH II and SWATH III vessels for two modes: with torpedoes submerged and partially surfaced in catamaran mode.
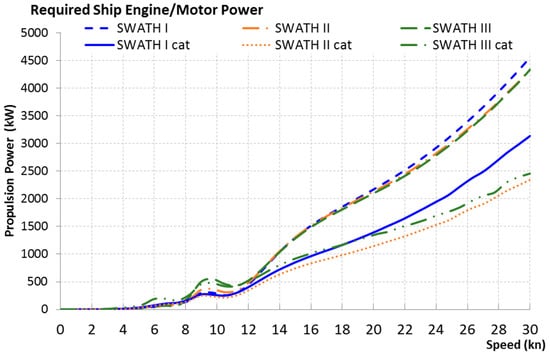
Figure 9.
Approximate plot of the required propulsion power versus longitudinal speed for SWATH I, SWATH II and SWATH III ships depending on float submerged/surfaced mode.
The SWATH II design was selected for further analysis on the basis of the determined thrust characteristics and the vessel’s motive power demand. Due to the shape of the torpedoes and the separation of the struts, this structure is more rigid and requires less power in the catamaran operation mode than the SWATH III type structure. On the other hand, in the range of higher speeds, exceeding 15 knots, the total resistance generated by the hull of the SWATH II type ship is slightly higher than the SWATH III type vessel.
3.2. Model of a Hybrid SWATH II Powertrain
Using the Modelica programming environment (with Modelica Energy Storages library and Modelica Standard Library) [62], and vessel operations data gathered from the MarineTraffic website [63], a mathematical model of a SWATH II ship with an diesel propulsion system has been developed. Subsequently the model of the electric propulsion system powered by HESS hybrid energy stores has been developed, modeling the rechargeable battery packs (BAT); hydrogen fuel cell (FC) and internal combustion engine (D).
The mathematical model was developed on the basis of the available elements of the Modelica standard library and the elements developed and/or modified by the authors taking into account the properties and correlations between devices as well as parameters and catalog data of real devices. Figure 10, Figure 11, Figure 12, Figure 13, Figure 14, Figure 15, Figure 16, Figure 17 and Figure 18 show the basic blocks of the mathematical model with a description of the functions performed.
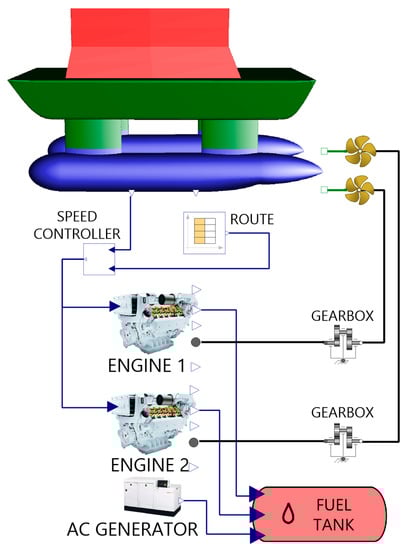
Figure 10.
Model of a Diesel-Propeller SWATH II powertrain developed in Modelica.
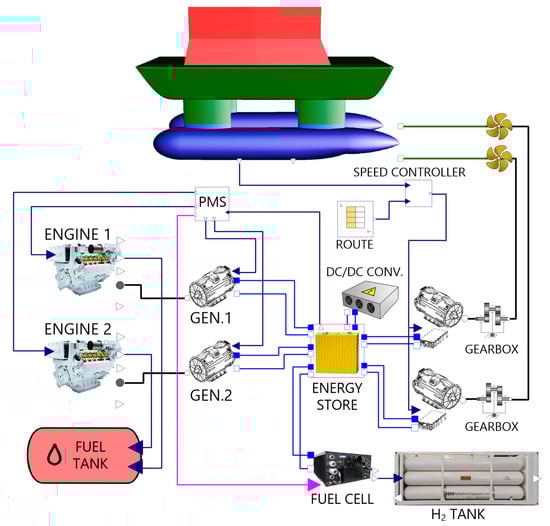
Figure 11.
Model of a hybrid Diesel-Battery-Electric SWATH II powertrain developed in Modelica.
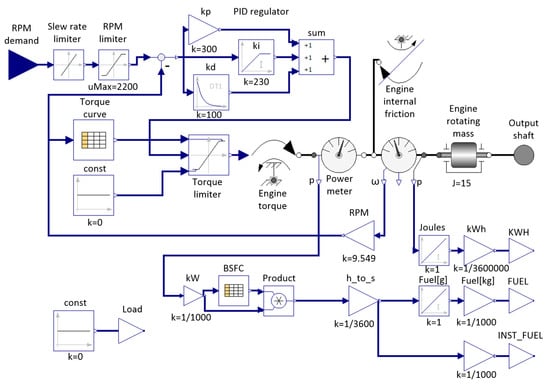
Figure 12.
Model of a MAN V12-1650 diesel engine developed in Modelica.
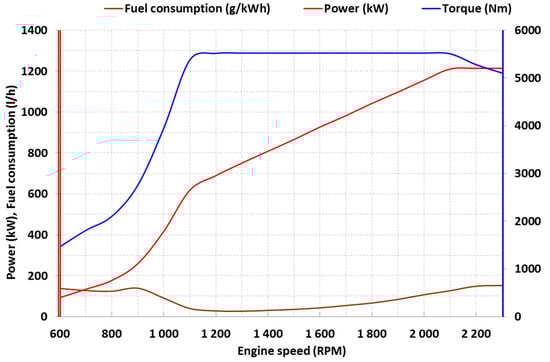
Figure 13.
MAN V12-1650 engine curves [53].
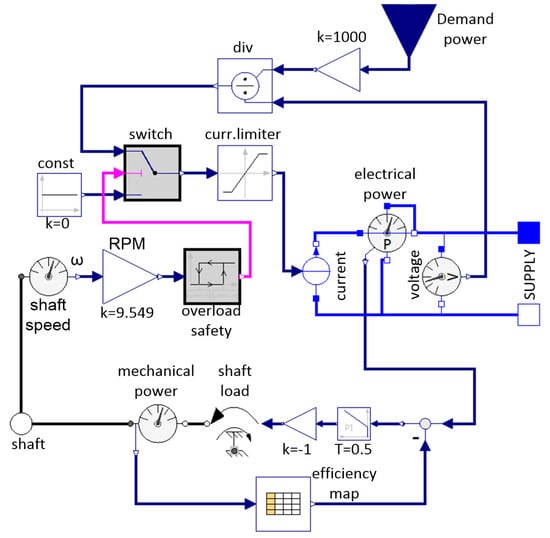
Figure 14.
Model of a generator set developed in Modelica.
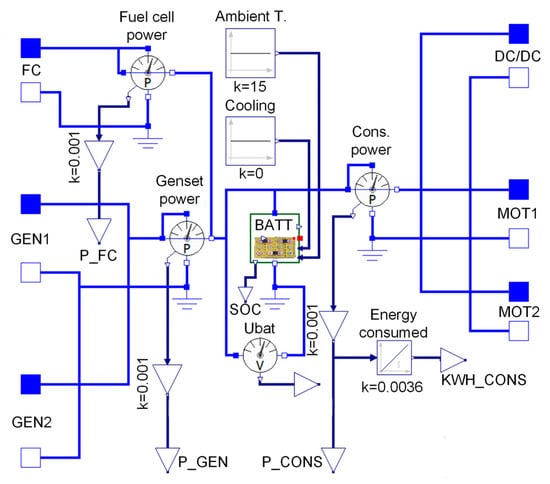
Figure 15.
Model of electrical energy store developed in Modelica.
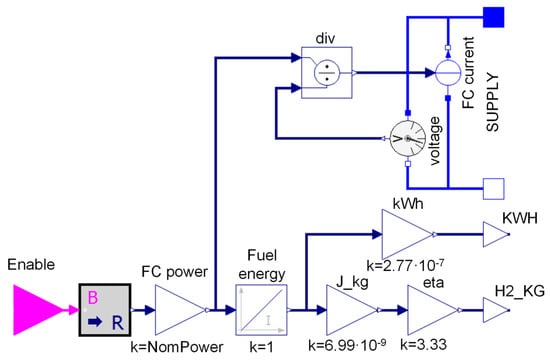
Figure 16.
Model of a PEM hydrogen fuel cell developed in Modelica.
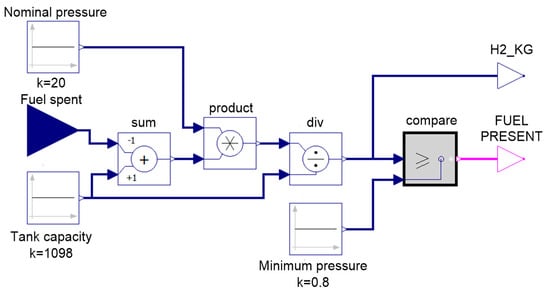
Figure 17.
Model of a 20 MPa compressed hydrogen storage tank developed in Modelica.
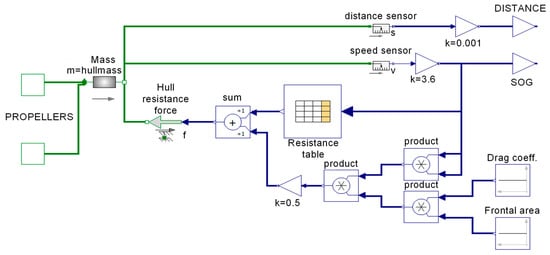
Figure 18.
Model of the ship’s hull and hull resistance components developed in Modelica.
The developed mathematical model includes such elements as:
- −
- dynamics of the mechanical structure of the ship’s hull expressed on the basis of the geometrical shapes of the ship and its mass,
- −
- description of the characteristics of internal combustion engines related to the generated power, torque and energy consumption (fuel) depending on the operating point (rotational speed, load),
- −
- description of the characteristics of the electric power generators related to the supplied mechanical power and the generated power at a specific efficiency defined by the efficiency map,
- −
- description of the properties of the electricity storage taking into account: cell temperature and related physicochemical properties such as maximum load current and operating voltage (SOC),
- −
- description of the properties of the inverter-motor electric drive system, taking into account: the efficiency of the inverter and the motor, the allowable load and power curve (torque, power, rotational speed, current, voltage),
- −
- ship’s propellers with a certain constant efficiency value,
- −
- gearboxes with a specific ratio and efficiency,
- −
- description of the properties of the DC/DC power electronic converter, taking into account the constant value of the average load of the on-board receivers,
- −
- description of the properties of the fuel cell related to the maximum load and consumption of the energy contained in the hydrogen fuel and its efficiency,
- −
- description of the properties of the hydrogen tank related to its parameters such as volume of hydrogen in the tank, hydrogen pressure,
- −
- ship’s speed regulator with a block for setting the route of passage (set speed on individual sections of the route),
- −
- power management system, including control of the flow and consumption of power between individual energy sources (generating sets, fuel cell, electric energy storage),
- −
- auxiliary generator for the DIESEL system, providing power supply at the level of a constant average load value of on-board receivers,
- −
- a measurement system tasked with the recording of all electrical and mechanical parameters of the above-mentioned devices and additionally performing the functions of converting all parameters related to energy consumption, CO2 emissions and fuel costs.
The two configurations of drive systems were modeled: the first with a DIESEL engine (Figure 10) and the second hybrid DIESEL-ELECTRIC (Figure 11) with the use of HESS in combination with batteries and hydrogen fuel cells.
The DIESEL propulsion system (D) was implemented on the basis of two identical systems installed in each of the SWATH II torpedoes, which include: a diesel engine with a nominal power of 1200 kW, reduction gear and a propeller [64]. Additionally, in order to provide power to the electric on-board devices, the use of an auxiliary diesel generator with a power of 18 kW was adopted. The structure of the modeled SWATH type diesel propulsion system consists of blocks such as: SWATH II type ship hull block modeling the hull form with the forces acting on it; internal combustion engine block; reduction gear block; propeller block; auxiliary power generator block and a transition route block.
Configuration of the hybrid propulsion system DIESEL-ELECTRIC (DE) with HESS mathematical model implemented in the Modelica environment allows performing research depending on the selected structure of the electric power sources. Possible configurations include: battery electricity storage with diesel generating sets (BAT-D), as well as hydrogen fuel cell and battery electricity storage with diesel generating sets (FC-BAT-D). When selecting a given power sources combination, the individual masses of propulsion system components [65,66,67,68], automatically update the total ship mass, which affect the overall energy consumption of the ship [69,70,71,72,73].
The modeled drive system consists of: two generating sets with a power of 1200 kW each; electricity storage system (two parallel packages of 220 LiFePO4 300 Ah cells connected in series, with a total capacity of 422.4 kWh and a weight of 4400 kg); two electric motors with a nominal power of 1022 kW; DC/AC converter with a nominal power of 20 kW feeding the ship power grid; two hydrogen tanks, with capacity of 37.44 m3 each, and rated pressure 200 bar, containing 549 kg of hydrogen at a mass of 10,200 kg; and 14 PEM hydrogen fuel cells with a nominal power of 85 kW and a weight of 256 kg each. Based on the above parameters, the total weight of the ship was determined for each configuration at: D 118.4 t; BAT-D 119.1 t; FC-BAT-D 135.88 t.
The elements of the hybrid propulsion system (Figure 11) of the DIESEL-ELECTRIC type are presented in the form of blocks modeling: the SWATH II hull block with the forces acting on it; block of two generating sets; electric energy storage block which includes two battery packs; on-board equipment power supply unit included in the Power Management System (PMS); inverter module and electric motor block, gearbox block; propeller block; the transition route block.
Tests were carried out for two types of drive systems DIESEL (D) and DIESEL-ELECTRIC (DE). For the drive type D, one power train configuration consisting only of diesel engines was analyzed. For the second configuration of DE, seven different configurations of drive systems were analyzed, including: BAT-D with SOCON-OFF = 15–85%, BAT-D with SOCON-OFF = 10–90%, BAT-D with SOCON-OFF = 40–60%, BAT-D with SOCON-OFF = 30–70%, BAT with SOCON-OFF = 15–85%, FC-BAT-D with SOCON-OFF = 15–85%, and FC-BAT with SOCON-OFF = 15–85%. The proposed designation of SOCON-OFF = 15–85% means that the charging and discharging thresholds for BAT energy storage were chosen at 15% SOC and 85% SOC, respectively. This means that when the battery State Of Charge (SOC) drops below 15%, the BAT energy storage will be connected to the generator to supplement its energy and if the SOC exceeds 85%, the charging process will halt.
The structure of the internal combustion engine block is presented in Figure 12. The basis for modeling the engine operation is the characteristic of the maximum torque depending on the rotational speed, and the Brake Specific Fuel Consumption (BSFC) characteristic describing the fuel consumption of the engine depending on the power delivered, all presented in Figure 13.
The engine is controlled by setting the desired RPM to the RPM demand input. This value is limited to a maximum of 2200 RPM. Then it is transferred to the input of the PID controller of the engine speed. The value of the torque signal from the output of the PID controller is limited based on the torque characteristics in the torque limiter block, and then it controls the engine torque block corresponding to the actual torque generated by the crankshaft.
The mechanical power of rotation measured by the power meter block is the basis for measuring the amount of fuel consumed by the engine based on the BSFC curve. The instantaneous fuel consumption value in kg/s is available at the INST_FUEL output of the engine model; it is also integrated to obtain the total value of fuel consumed by the engine, expressed in kilograms (FUEL output). The value of the total mechanical energy generated by the motor expressed in kWh is available at the KWH output.
The block directly cooperating with the internal combustion engine in the BAT-D configuration is the generator block shown in Figure 14. It is modeled by an electrical machine identical to the one used to drive the propeller, with the difference that it works in the generator mode as a synchronous generator, at the output of which is connected a rectifier circuit producing a direct current, used to charge the electricity store.
The generator block operation is controlled by the Demand power input, to which the required electrical power is supplied. Based on the current value of the voltage at the SUPPLY output terminals permanently connected to the energy store, the value of the output current is determined, taking into account two restrictions.
The first is related to the generator rated current, which is limited by the current limiter. The second limitation, which results from the possibility of overloading the generator at too low rotational speed, resulting e.g., from the recent start of the internal combustion engine driving the generator, or from the drop in speed as a result of engine overload. In this case, the hysteresis overload safety will limit the generator current to zero for the duration of the rotational speed hysteresis system action.
The current supplied to the SUPPLY output, created by the generator, causes the flow of electricity to the storage, measured with an electrical power wattmeter. Power measurement is used to calculate shaft load. At the same time, depending on the generator rotational speed, the efficiency map of the generator-rectifier system is taken into account, which is the basis for the generator block operation.
The diagram of the electric energy storage block is shown in Figure 15. In its central place there is a model of a LiFePO4 battery with a capacity of 300 Ah, developed on the basis of a battery model from the Modelica EnergyStorages library. The introduced modifications to the battery model included the implementation of the cell load characteristics depending on temperature and SOC.
The individual energy systems, such as GEN1, GEN2, FC (fuel cell), DC/DC converter and motors MOT1 and MOT2 generators are connected through the corresponding DC junctions, distributed around the perimeter of the energy storage block. Each of the device groups: generators, fuel cells and engines, has its own measurement system for the electric power flowing through this group, with the values available on the P_FC, P_GEN and P_CONS connectors. The value of the total energy consumed by the DC/DC converter and drive motors expressed in kWh is available on the KWH_CONS connector.
The fuel cell block showed in Figure 16 models a stack of fuel cells with a specific power rating and efficiency. The base model to determine the efficiency was a 30 kW PEM Ballard FCveloCity MD fuel cell, with a total efficiency of 30%. The fuel cell model works in two states, controlled by the Enable input. Starting the module energizes the SUPPLY output with a specific rated power calculated in the FC power block, through the flow of the current forced by the FC current block, appropriate to the actual voltage level at SUPPLY terminals. [74].
The energy released by the fuel cell, expressed in joules, is counted in the Fuel Energy block. This value is then converted into an energy value expressed in kWh available at the KWH output and into a mass value of hydrogen fuel consumed. The mass of consumed hydrogen, available at the output H2_KG, is calculated on the basis of the calorific value of hydrogen and the total efficiency of the fuel cell.
Figure 17 shows a diagram of the hydrogen pressure vessel model. The model represents two tanks with a rated pressure pn equal to 20 MPa and rated capacity mn equal to 549 kg of hydrogen. The modeled variable is the pressure in the tank p expressed in MPa, changing according to the relationship:
where: mn–rated capacity of the tanks in kg H2, mf–mass of H2 consumed by the fuel cell in kg, pn–rated pressure of the tank in MPa.
Due to the fact that fuel cells are supplied with hydrogen directly from the pressure tank, without the participation of pumps, taking into account the requirements of fuel cells related to the minimum fuel pressure at the inlet of 0.8 MPa, the hydrogen tank model block is equipped with a system comparing the pressure in the hydrogen tank with the set minimum pressure. If the pressure in the tank is above the minimum pressure, the comparison system transmits the FUEL PRESENT signal to the fuel cell, which allows the cell to operate.
The model of the ship’s hull with its resistances is shown in Figure 18. The main modeled element is the hull mass block, the value of which is automatically calculated before starting the simulation, based on the defined type of propulsion system.
The mass block is directly related to the RTOT hull resistance force block, the value of which is the sum of the hydrodynamic and aerodynamic resistances (1). The value of the total aerodynamic drag Rair is derived from the drag equation:
where: ρ—air density in kg/m3, A—frontal area of the ship’s surfaced part, expressed in m2, Cd—coefficient of aerodynamic drag, v—apparent wind velocity in relation to the ship’s hull, expressed in m/s.
The value of total hydrodynamic resistance is taken from the Resistance table containing the results of the simulation of hull resistances depending on the ship speed. Additionally, the ship’s hull block has two outputs. The first one, the DISTANCE output, provides the value of the distance traveled by the vessel in km. The second SOG output (Speed over Ground) allows for one to read the value of the longitudinal speed of the vessel in km/h.
All parameters of the modeled elements and devices presented in the diagrams are recorded by the measuring system, which additionally performs conversion functions related to energy consumption, CO2 emissions and fuel costs.
4. Simulation Results
The comparative analysis for the developed models of DIESEL and DIESEL-ELECTRIC propulsion systems has been carried out in the Modelica environment using the actual route of the M/V FOB SWATH 4, IMO 9672947 [52] as available from the MarineTraffic website [63].
The simulation was carried out in the OpenModelica environment, using the DASSL solver with a variable step with a maximum length of 100 s and a maximum simulation duration of 300,000 s. The following solver options were used: Root Finding, Restart After Event as well as coloredNumerical Jacobian. The maximum integration order of 5 was selected.
Figure 19 shows the registered speed profile of the M/V FOB SWATH 4, which was used as a test profile for all the analyzed configurations of the propulsion system in the developed SWATH II ship model. Selected test route covers a period of approximately 82 h (3 days, 10 h) and is associated with the ship tasks including leaving the port, traveling to the vicinity of offshore wind farm towers, maneuvering there and finally returning to the home port. The maximum speed during the journey under the given route did not exceed 20 kn.
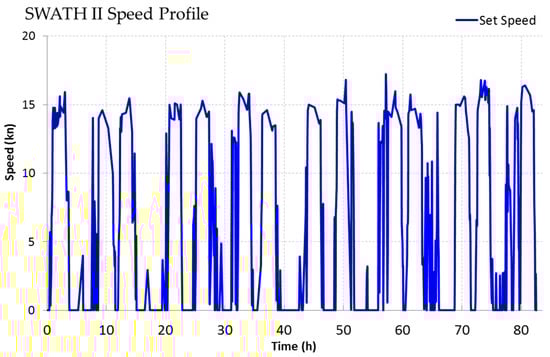
Figure 19.
Ship transition route speed profile of a SWATH II type ship.
Figure 20 shows the demand for power from drive motors necessary to drive a SWATH II ship along a given test route, shown in Figure 19 using the vessel’s longitudinal speed controller.
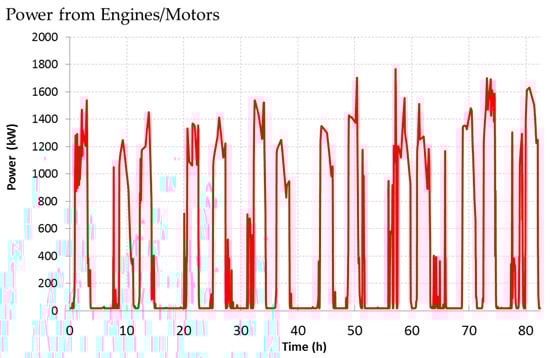
Figure 20.
Propulsion power during the tested transition route of SWATH II type vessel.
Figure 21 shows the consumption of energy contained in the fuel for individual types of drive systems of the SWATH II ship. Additionally, for the BAT-D hybrid system, the test results for various configurations of the electricity storage related to the setting of charging and discharging thresholds depending on the SOC are presented.
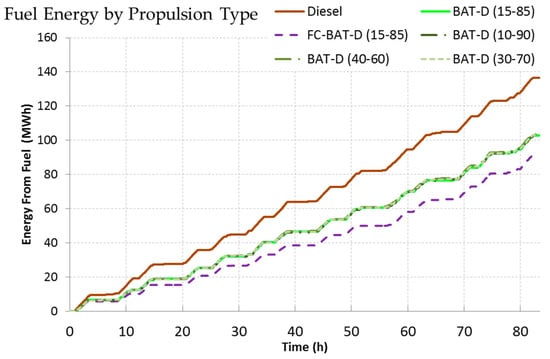
Figure 21.
Time plot of consumed fuel energy, depending on the selected configuration of powertrain: Diesel, BAT-D (15–85), BAT-D (10–90), BAT-D (30–70), BAT-D (40–60), FC-BAT-D (15–85).
Figure 22 shows the waveforms of the state of charge of the energy storage (SOC) cooperating with generating sets. The characteristics are presented for the adopted four switch-on and switch-off thresholds for charging the energy storage: SOCON-OFF = 15–85%, SOCON-OFF = 10–90%, SOCON-OFF = 30–70%, SOCON-OFF = 40–60%. The presented values were recorded by the measuring system during the simulation tests.
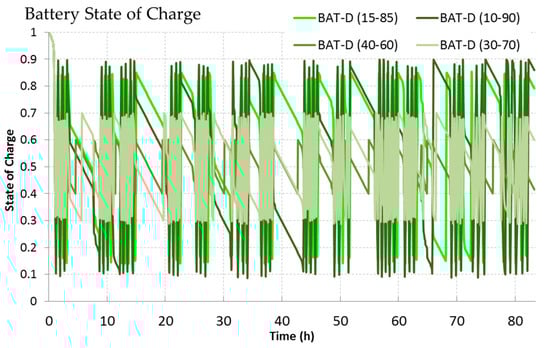
Figure 22.
BAT energy store State Of Charge plot, depending on the selected configuration of powertrain: BAT-D (15–85), BAT-D (10–90), BAT-D (30–70), BAT-D (40–60).
Figure 23 presents the changes in the HESS battery voltage for the four selected charge-discharge threshold values. At the start of simulation, the SOC of the battery is equal to 1, which explains the high initial peak in all four cases. During the course of simulation, the higher voltage peak-to-peak values can be observed in the wider threshold cases, such as BAT-D (10–90) configuration, compared to smaller differences of BAT-D (30–70) case, caused by deeper discharging and charging.
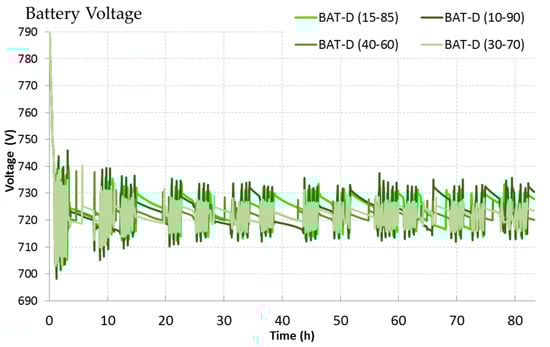
Figure 23.
BAT energy store voltage, depending on the selected configuration of powertrain: BAT-D (15–85), BAT-D (10–90), BAT-D (30–70), BAT-D (40–60).
Based on the examination of the waveforms in Figure 21, Figure 22 and Figure 23, it can be concluded that the picked threshold level of charge/discharge of the electricity storage has little effect on the total energy consumption for the adopted test route.
Figure 24 shows the emission of carbon dioxide and other harmful substances into the atmosphere, linked to the fuel consumption of the SWATH II vessel. Carbon dioxide emissions by combustion engines were estimated on the basis of the assumption that 3.08 kg of CO2 is generated from one kilogram of diesel after combustion [75].
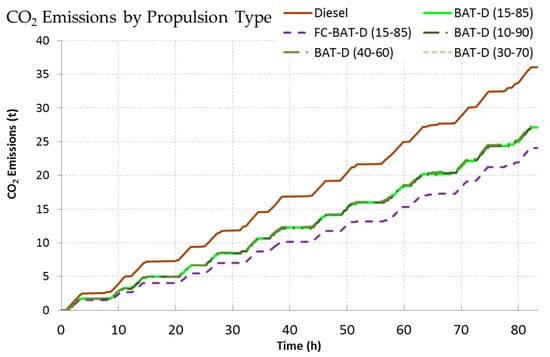
Figure 24.
CO2 emission depending on the selected drivetrain configuration: DIESEL, BAT-D (15–85), BAT-D (10–90), BAT-D (30–70), BAT-D (40–60), FC-BAT-D (15–85).
Figure 25 shows the costs related to fuel consumption of a SWATH II ship depending on the selected configuration of the drive system. The operating costs of a given drive system were estimated on the basis of the unit fuel consumption and the adopted market prices: diesel oil USD 328/ton [76], electricity USD 0.14/kWh [77], hydrogen USD 16.51/kg [78].
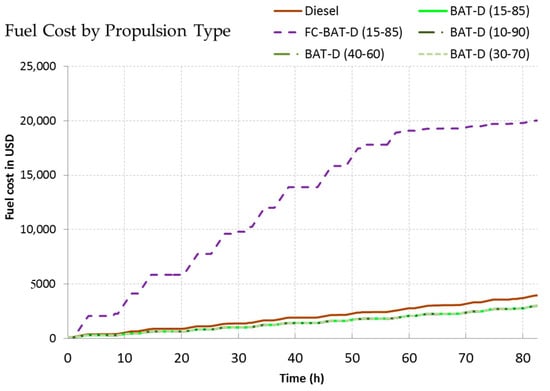
Figure 25.
Comparison of operating costs of a SWATH II vessel on a given test route, depending on the adopted configuration of the drive system: DIESEL, BAT-D (15–85), BAT-D (10–90), BAT-D (30–70), BAT-D (40–60), FC-BAT-D (15–85).
The flow of energy between its sources, namely the BAT energy storage, FC hydrogen fuel cells and generating sets D, and electricity consumers and the main electric drive, is shown in Figure 26.
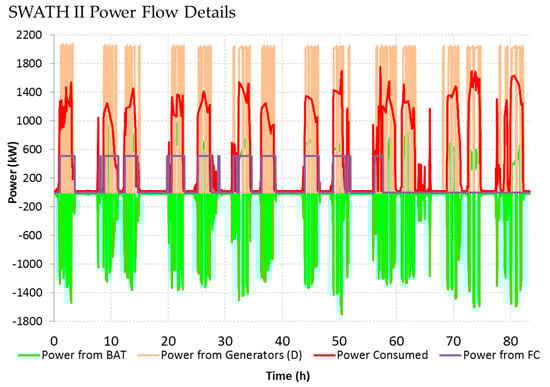
Figure 26.
Plot of power flow between battery (BAT), generators (D), fuel cell (FC) and propulsion system.
5. Discussion
The analysis of the obtained test results of various configurations of the SWATH II drive system showed that the use of a DIESEL-ELECTRIC hybrid drive system may significantly reduce the operating costs of the vessel, as well as the amount of exhaust gases emitted to the environment, when compared to the drive type DIESEL. In addition to the development of a mathematical model based on actual operating data, the research also includes the development of models for electric drive system components such as inverters, drive motors, power electronic converters, electricity storage, hydrogen tanks and hydrogen fuel cells.
The length of the test route was about 580 nm and it was not a problem to cover it for DIESEL, BAT-D and FC-BAT-D drive systems. The maximum range achieved by the vessel for the BAT configuration was 7.2 nm and for FC 181.2 nm. In order for the given route to be covered only on battery power, using the LiFePO4 cell technology with the energy density of approx. 100 Wh/kg, the mass of the energy storage would have to be approx. 350 tons, and using Li-Ion cells with a density of 200 Wh/kg—169 tons, and for upcoming cells with a density of 1000 Wh/kg—about 34 tons [79].
Based on the analysis of the waveforms related to consumption of energy contained in fuel, the state of charge of energy store and the voltage at energy store terminals (Figure 20, Figure 21 and Figure 22), it can be concluded that the adopted SOCON-OFF level of discharge and charging of the electricity storage has little effect on the total energy consumption for the adopted test route. Taking into account the influence of the SOC charge level on the cell life parameter called SOH (State Of Health), it is recommended to adopt a configuration of at least SOCON-OFF = 15–85%. Adopting the SOCON-OFF = 10–90% configuration causes the energy store to operate within extreme limits that may shorten the SOH lifetime of the energy store. On the other hand, assuming too narrow operating range of the energy store, e.g., SOCON-OFF = 40–60%, the number of generators starts will be greater than for the energy store operation range at the level of SOCON-OFF = 10–90%. Therefore, assuming a certain level of operation SOCON-OFF of the energy store, the operational situation of the ship should be calculated, taking into account the ship’s route and the stops schedule.
The obtained test results confirmed the expectation of reduced fuel consumption used to propel the ship. Specific Energy Consumption (SEC) expressed in kilowatt hours kWh per nautical miles Nm was correspondingly for the configuration type: DIESEL 236.24 kWh/nm; BAT-D (10–90) 177.94 kWh/nm; BAT-D (15–85) 177.97 kWh/nm; BAT-D (30–70) 178.17 kWh/nm; BAT-D (40–60) 179.11 kWh/nm; BAT (15–85) 58.51 kWh/nm; FC-BAT-D (15–85) 179.05 kWh/nm; FC-BAT (15–85) 70.42 kWh/nm. Thus, the lowest SEC value was obtained for the BAT configuration 58.51 kWh/nm (percentage difference to DIESEL system (−75.23%), then FC-BAT 70.42 kWh/nm (−70.19%) and then in order with slight differences, BAT-D configurations 177.97 ÷ 179.11 kWh/nm (−24.67 ÷ −24.18%), FC-BAT-D 179.51 kWh/nm (−24.21%) and finally, DIESEL 236.24 kWh/nm.
For DIESEL and BAT-D configurations, the efficiency of the drive system is largely dependent on the efficiency of the internal combustion engine (η), which depends on the engine operating point (Figure 13). The engine operating point depends on its load, which is simply a resultant function of the set engine rotational speed, the ship’s loading condition and hydro-meteorological conditions (canopies, waves, sea currents). If a powerful engine is only slightly loaded, its efficiency will be low. On the other hand, if the same engine is loaded in the optimal range of its operation, i.e., approximately 85–90% of the rated power, for example by driving a generator as in the BAT-D configuration (η ≈ 41.5%), then the value of its average efficiency will be significantly higher than when the engine is operated in the DIESEL drive system (η ≈ 24.5%) on the same route.
The emission of poisonous gases and carbon dioxide into the atmosphere is related to the consumed energy (Figure 24). Along with the reduction of fuel consumption, the CO2 emission was reduced and it amounted to: DIESEL 62.30 kgCO2/nm; BAT-D (10–90) 46.80 kgCO2/nm; BAT-D (15–85) 46.81 kgCO2/nm; BAT-D (30–70) 46.86 kgCO2/nm; BAT-D (40–60) 47.11 kgCO2/nm; BAT 5.66 kgCO2/nm; FC-BAT-D (15–85) 41.46 kgCO2/nm; FC-BAT (15–85) 0.11 kgCO2/nm [80]. The highest value of CO2 emission reduction was obtained for the system powered mainly by FC-BAT hydrogen fuel cells (15–85) 0.11 kgCO2/nm (−99.82%), due to the fact that generation of electricity from hydrogen gives no emission of CO2. This was followed by BAT 5.66 kgCO2/nm (−90.91%), FC-BAT-D (15–85) 41.46 kgCO2/nm (−33.45%) systems; BAT-D (10–90) 46.80 kgCO2/nm (−24.87%); BAT-D (15–85) 46.81 kgCO2/nm (−24.86%); BAT-D (30–70) 46.86 kgCO2/nm (−24.78%); BAT-D (40–60) 47.11 kgCO2/nm (−24.38%).
It should be noted that the FC-BAT-D propulsion system uses hydrogen fuel cells, with power of one unit is not large (85 kW). In order to provide propulsion for the SWATH II type vessel, at least a dozen of them should be used only with hydrogen fuel cells. The maintenance and operation of hydrogen tanks may also be a problem. In addition, the cost analysis showed that the operation of the FC-BAT-D propulsion system is significantly more expensive compared to both DIESEL, BAT-D and BAT systems (Figure 25). The ship’s cost per mile (CPM) in DIESEL is USD 6.64/nm; in BAT-D (10–90) is USD 5.16/nm; in BAT-D (15–85) USD 5.17/nm; in BAT-D (30–70) is USD 5.17 USD/nm; in BAT-D (40–60) is USD 5.20/nm; in BAT (15–85) is USD 14.63/nm; in FC-BAT-D (15–85) is USD 34.47/nm; in FC-BAT (15–85) is USD 96.32/nm. The lowest cost of operation in relation to the DIESEL configuration was obtained for the following configurations: BAT-D (10–90) at 5.16 USD/nm (−22.25%), BAT-D (15–85) at 5.17 USD/nm (−22.23%), BAT-D (30–70) at 5.17 USD/nm (−22.15%), BAT-D (40–60) at 5.20 USD/nm (−21.75%). The remaining systems generate higher unit costs in relation to the CPM index, respectively: BAT (15–85) at USD 14.63/nm (+220.23%); FC-BAT-D (15–85) at USD 34.47/nm (+518.95%); and FC-BAT (15–85) at USD 96.32/nm (+1450.18%).
6. Conclusions
The use of the DIESEL-ELECTRIC hybrid drive system to drive the SWATH II type craft can significantly contribute to the reduction of operating costs as well as the amount of exhaust gases emitted into the environment.
The obtained test results confirmed that thanks to the appropriate configuration of the electric drive system and the appropriate selection of parameters (SOCON-OFF), it is possible to extend the SOH life of the batteries.
The use of a hybrid drive system with electrical components allows for optimal placement of elements on board the ship, which translates into an increase in the level of safety for the crew and transported goods.
The use of hybrid propulsion enables the adaptation of vessels by shipowners to increasingly stringent environmental protection regulations. The operation of the internal combustion engine in its optimal load range in a hybrid system, such as BAT-D, has a positive effect on the increase of the average value of its efficiency, in relation to the DIESEL configuration, which entails a reduction in fuel consumption and emission of exhaust gases into the atmosphere.
The advantages of using a DIESEL-ELECTRIC hybrid drive, and in particular the possibility of temporary shutdown of diesel engines, allows local reduction of exhaust gases emissions to zero, especially in zones where exhaust emissions and noise from internal combustion engines are not desired.
Author Contributions
Conceptualization, A.Ł. and W.K.; computations, A.Ł. and W.K.; methodology, A.Ł. and W.K.; experimental verification, A.Ł. and W.K.; writing text of the article, A.Ł. and W.K.; review and editing, A.Ł. and W.K.; visualization, A.Ł. and W.K.; supervision, A.Ł. and W.K. All authors have read and agreed to the published version of the manuscript.
Funding
The project is financed from the Ministry of Science and Higher Education program named “Regionalna Inicjatywa Doskonałości” in the years 2019–2022, project number 006/RID/2018/19, the sum of financing 11 870 000 PLN.
Conflicts of Interest
The authors declare no conflict of interest.
References
- Brewer, T.L. A Maritime Emission Control Area for the Mediterranean Sea? Technological Solutions and Policy Options for a ‘Med ECA’. Euro-Mediterr. J. Environ. Integr. 2020, 5, 1–5. [Google Scholar] [CrossRef]
- Rouïl, L.; Ratsivalaka, C.; André, J.-M.; Allemand, N. ECAMED: A Technical Feasibility Study for the Implementation of an Emission Control Area (ECA) in the Mediterranean Sea—Synthesis Report; French National Institute for Industrial Environment and Risks: Verneuil-en-Halatte, France, 2019. [Google Scholar]
- Przybylowski, A. Baltic Sea Region cities advancing towards sustainable urban mobility—Copenhagen and Gdynia case studies. In Proceedings of the CERS—Engines of Urban and Regional Development, Banská Bystrica, Slovakia, 20–22 September 2017; pp. 495–505. [Google Scholar]
- Przybylowski, A. Global Trends Shaping Life Quality in Agglomerations with Particular Emphasis on Mobility in Seaport Agglomerations. TransNav Int. J. Mar. Navig. Saf. Sea Transp. 2019, 13, 615–620. [Google Scholar] [CrossRef]
- Shakeri, N.; Zadeh, M.K.; Nielsen, J.B. Hydrogen Fuel Cells for Ship Electric Propulsion: Moving Toward Greener Ships. IEEE Electrif. Mag. 2020, 8, 27–43. [Google Scholar] [CrossRef]
- Sierpinski, G.; Staniek, M.; Celinski, I. New Methods for Pro-Ecological Travel Behavior Learning. In Proceedings of the 8th International Conference of Education, Research and Innovation (ICERI), Seville, Spain, 18–20 November 2015; pp. 6926–6933. [Google Scholar]
- Skrúcaný, T.; Figlus, T.; Vrabel, J.; Šarkan, B.; Synák, F. Measuring of noise emitted by moving vehicles. MATEC Web Conf. 2017, 107, 00072. [Google Scholar] [CrossRef]
- Abramowicz-Gerigk, T.; Burciu, Z.; Jachowski, J. An Innovative Steering System for a River Push Barge Operated in Environmentally Sensitive Areas. Pol. Marit. Res. 2017, 24, 27–34. [Google Scholar] [CrossRef]
- Abramowicz-Gerigk, T.; Burciu, Z.; Górski, W.; Reichel, M. Full scale measurements of pressure field induced on the quay wall by bow thrusters – indirect method for seabed velocities monitoring. Ocean Eng. 2018, 162, 150–160. [Google Scholar] [CrossRef]
- Yu, Z.Z.; Jing, L. Effects of exhaust post-treatment technology on diesel engine emissions. In Proceedings of the International Conference on Transportation, Mechanical, and Electrical Engineering (TMEE), Changchun, China, 16–18 December 2011; IEEE: Piscataway, NJ, USA, 2011; pp. 1804–1807. ISBN 978-1-4577-1701-7. [Google Scholar]
- Nevalainen, P.; Kinnunen, N.M.; Kirveslahti, A.; Kallinen, K.; Maunula, T.; Keenan, M.; Suvanto, M. Formation of NH 3 and N 2 O in a modern natural gas three-way catalyst designed for heavy-duty vehicles: The effects of simulated exhaust gas composition and ageing. Appl. Catal. A Gen. 2018, 552, 30–37. [Google Scholar] [CrossRef]
- Yun, L.; Bliault, A.; Rong, H.Z. High Speed Catamarans and Multihulls. In Technology, Performance, and Applications; Springer: New York, NY, USA, 2019; ISBN 9781493978908. [Google Scholar]
- Bonfiglio, L.; Perdikaris, P.; Vernengo, G.; De Medeiros, J.S.; Karniadakis, G. Improving SWATH Seakeeping Performance using Multi-Fidelity Gaussian Process and Bayesian Optimization. J. Ship Res. 2018, 62, 223–240. [Google Scholar] [CrossRef]
- Bonfiglio, L.; Perdikaris, P.; Brizzolara, S. Multi-fidelity Bayesian Optimization of SWATH Hull Forms. J. Ship Res. 2019. [Google Scholar] [CrossRef]
- Pérez-Arribas, F.; Calderon-Sanchez, J. A parametric methodology for the preliminary design of SWATH hulls. Ocean Eng. 2020, 197, 106823. [Google Scholar] [CrossRef]
- Air-Cushion Principle—Umoe WAVECRAFT™ %. Available online: https://www.wavecraft.no/technology/air-cushion-principle/ (accessed on 28 January 2020).
- Dubrovsky, W.A. Multi-Hull Vessels; M31805-037/048(01)-78/20-78; Shipbuilding Publishing House: Petersburg, Russia, 1978. (In Russian) [Google Scholar]
- Dubrovsky, V.A. Multi-hulls: New options and scientific developments. Ships Offshore Struct. 2010, 5, 81–92. [Google Scholar] [CrossRef]
- Medaković, J.; Dario, B.; Blagojević, B. A Comparison of Hull Resistances of a Mono-Hull and A SWATH Craft. Int. J. Eng. Sci. Innov. Technol. 2013, 2, 155–162. [Google Scholar]
- Nesteruk, I.; Krile, S.; Koboevic, Z. Electrical Swath Ships with Underwater Hulls Preventing the Boundary Layer Separation. J. Mar. Sci. Eng. 2020, 8, 652. [Google Scholar] [CrossRef]
- Grannemann, F. SWATH—A new concept for the Safety and Security at Sea. Cienc. Tecnol. Buques 2015, 8, 47–56. [Google Scholar] [CrossRef]
- Jaramillo, C.M. Improvement of Seaworthiness of Fast Catamaran by Hydrofoils Support. Master’s Thesis, University of Rostock, Rostock, Germany, 2017. [Google Scholar]
- Mahmud, S. The applicability of hydrofoils as a ship control device. J. Mar. Sci. Appl. 2015, 14, 244–249. [Google Scholar] [CrossRef]
- Prastowo, H.; Santoso, A.; Arya, A. Analysis and Optimation Hydrofoil Supported Catamaran (HYSUCAT) Size 25 Meter based on CFD Method. Int. J. Mar. Eng. Innov. Res. 2016, 1, 1. [Google Scholar] [CrossRef]
- Najafi, A.; Aliakbari, T.; Hashemi, S.A. Experimental optimization of hydrodynamic performance of catamarans using hydrofoil element. Proc. Inst. Mech. Eng. Part M J. Eng. Marit. Environ. 2018, 233, 488–501. [Google Scholar] [CrossRef]
- Birk, L. Fundamentals of Ship Hydrodynamics: Fluid Mechanics, Ship Resistance and Propulsion; John Wiley & Sons: Hoboken, NJ, USA, 2019; ISBN 1118855485. [Google Scholar]
- Naz, N.; Karim, M. Investigation of Hydrodynamic Characteristics of High Speed Multihull Vessels including Shallow Water Effect. Procedia Eng. 2017, 194, 51–58. [Google Scholar] [CrossRef]
- Prasad, B.; Dhanak, M. Hydrodynamics of Advanced-hull Surface Vehicles. In Proceedings of the OCEANS 2018 MTS/IEEE Charleston, Charleston, SC, USA, 22–25 October 2018; IEEE: Piscataway, NJ, USA, 2018; pp. 1–7. ISBN 978-1-5386-4814-8. [Google Scholar]
- Kula, K. An Overview of Roll Stabilizers and Systems for Their Control. TransNav Int. J. Mar. Navig. Saf. Sea Transp. 2015, 9, 405–414. [Google Scholar] [CrossRef]
- Lisowski, J.; Mohamed-Seghir, M. Comparison of Computational Intelligence Methods Based on Fuzzy Sets and Game Theory in the Synthesis of Safe Ship Control Based on Information from a Radar ARPA System. Remote Sens. 2019, 11, 82. [Google Scholar] [CrossRef]
- Mohamed-Seghir, M. Methods based on fuzzy sets to solve problems of Safe Ship control. In Novel Algorithms and Techniques in Telecommunications and Networking; Sobh, T., Elleithy, K., Mahmood, A., Eds.; Springer Netherlands: Dordrecht, The Netherlands, 2010; pp. 373–377. ISBN 978-90-481-3661-2. [Google Scholar]
- Krzysztof, S.K. Autopilot Using the Nonlinear Inverse Ship Model. In Marine Navigation and Safety of Sea Transportation; CRC Press: Boca Raton, FL, USA, 2015; pp. 101–107. [Google Scholar]
- Formela, K.; Neumann, T.; Weintrit, A. Overview of Definitions of Maritime Safety, Safety at Sea, Navigational Safety and Safety in General. TransNav Int. J. Mar. Navig. Saf. Sea Transp. 2019, 13, 285–290. [Google Scholar] [CrossRef]
- Guze, S.; Smolarek, L.; Weintrit, A. The area-dynamic approach to the assessment of the risks of ship collision in the restricted water. Sci. J. Marit. Univ. Szczec. 2016, 117, 88–93. [Google Scholar] [CrossRef]
- Lisowski, J. The Sensitivity of State Differential Game Vessel Traffic Model. Pol. Marit. Res. 2016, 23, 14–18. [Google Scholar] [CrossRef]
- Lisowski, J. Comparison of Dynamic Games in Application to Safe Ship Control. Pol. Marit. Res. 2014, 21, 3–12. [Google Scholar] [CrossRef]
- Czech, P. Autonomous vehicles: Basic issues. Sci. J. Silesian Univ. Technol. Ser. Transp. 2018, 100, 15–22. [Google Scholar] [CrossRef]
- Weintrit, A.; Neumann, T. Safety of Marine Transport Introduction; CRC Press: Boca Raton, FL, USA, 2015. [Google Scholar]
- Neumann, T. Routing Planning As an Application of Graph Theory with Fuzzy Logic. TransNav Int. J. Mar. Navig. Saf. Sea Transp. 2016, 10, 661–664. [Google Scholar] [CrossRef]
- Neumann, T. Good choice of transit vessel route using Dempster-Shafer Theory. In Proceedings of the 2015 International Siberian Conference on Control and Communications (SIBCON), Omsk, Russia, 21–23 May 2015; IEEE: Piscataway, NJ, USA, 2015; pp. 1–4. ISBN 978-1-4799-7103-9. [Google Scholar]
- ISO. ISO 6954:2000. Available online: https://www.iso.org/standard/28883.html (accessed on 16 October 2020).
- Lin, Y.; Yang, Q.; Guan, G. Automatic design optimization of SWATH applying CFD and RSM model. Ocean Eng. 2019, 172, 146–154. [Google Scholar] [CrossRef]
- Boiko, A.; Bondarenko, O.; Davydenko, Y. Hull Parametric Modeling of a Small Waterplane Area Twin Hull ships. In Proceedings of the 2019 15th International Conference on the Experience of Designing and Application of CAD Systems (CADSM), Polyana (Svalyava), Ukraine, 26 February–2 March 2019; IEEE: Piscataway, NJ, USA, 2019; pp. 1–4. ISBN 978-1-7281-0053-1. [Google Scholar]
- Zhao, S.; Xiang, M.; Zhou, H.; Zhang, W. Hydrodynamics Analysis on the High-Speed Surface Vehicle with Super-Cavitating Hydrofoils. J. Appl. Fluid Mech. 2018, 11, 1005–1012. [Google Scholar] [CrossRef]
- Guo, J.; Ji, X.-B.; Wen, Y.-Y.; Cui, X. A new shock factor of SWATH catamaran subjected to underwater explosion. Ocean Eng. 2017, 130, 620–628. [Google Scholar] [CrossRef]
- MarineLink. BMT, Philly Shipyard to Conduct U.S. Navy T-AGOS(X) Studies. Available online: https://www.marinelink.com/news/bmt-philly-shipyard-conduct-us-navy-481743 (accessed on 22 October 2020).
- Offshore Wind. Danish Yachts Launches 27m Cat-SWATH. Offshore Wind. Available online: https://www.offshorewind.biz/2015/03/30/danish-yachts-launches-27m-cat-swath/ (accessed on 22 October 2020).
- Twitter. RHB Stevedoring Rotterdam na Twitterze: Rhb Discharged a Super Catamaran “Sea Slice” from SAL “FRAUKE”. Available online: http://t.co/4aYuptNl7Z (accessed on 22 October 2020).
- Safe Transfer in the Elbe Estuary. Available online: https://www.mtu-solutions.com/eu/en/stories/marine/commercial-vessels/safe-transfer-in-the-elbe-estuary.html (accessed on 22 October 2020).
- Offshore Windservice. Available online: http://odfjellwind.com/ (accessed on 23 October 2020).
- FOB SWATH 4 Vessel. Photos from Fabian Vornholt. Available online: https://www.vesseltracker.com/en/Ships/Fob-Swath-4-9672947/gallery/1510548 (accessed on 23 October 2020).
- FOB SWATH 2,3,4,5 and 6—Offshore Windservice. Available online: http://odfjellwind.com/fob-swath-25m/ (accessed on 23 October 2020).
- MAN. Marine Diesel Engine, Technical Data Sheet V12-1650. Available online: https://pasch.es/pdfs/Naval/Motores/MAN/LIGERO/V12-1650.pdf (accessed on 23 October 2020).
- Haase, M.; Davidson, G.; Thomas, G.; Binns, J.; Bose, N. A Practical Design Approach including Resistance Predictions for Medium-speed Catamarans. Ship Technol. Res. 2013, 60, 4–12. [Google Scholar] [CrossRef]
- Vernengo, G.; Villa, D.; Bruzzone, D.; Bonfiglio, L. A study on the added resistance of a catamaran advancing in waves considering variations of both operating and geometric parameters. Ships Offshore Struct. 2020, 1–19. [Google Scholar] [CrossRef]
- Molland, A.F.; Turnock, S.R.; Hudson, D.A. Ship Resistance and Propulsion: Practical Estimation of Ship Propulsive Power; Molland, A.F., Turnock, S.R., Hudson, D.A., Eds.; Cambridge University Press: Cambridge, UK, 2011; ISBN 9780521760522. [Google Scholar]
- Kim, M.; Hizir, O.; Turan, O.; Day, S.; Incecik, A. Estimation of added resistance and ship speed loss in a seaway. Ocean Eng. 2017, 141, 465–476. [Google Scholar] [CrossRef]
- Begovic, E.; Bertorello, C.; Mancini, S. Hydrodynamic Performances of Small Size Swath Craft. Brodogr. Shipbild. 2015, 2015, 1–22. [Google Scholar]
- Carlton, J.S. Marine Propellers and Propulsion; Elsevier: Amsterdam, The Netherlands, 2019; ISBN 9780081003664. [Google Scholar]
- Begovic, E.; Bertorello, C.; Bove, A.; De Luca, F. Experimental study on hydrodynamic performance of SWATH vessels in calm water and in head waves. Appl. Ocean Res. 2019, 85, 88–106. [Google Scholar] [CrossRef]
- FREE! Ship Plus. Available online: https://sourceforge.net/projects/freeship/ (accessed on 10 September 2019).
- The Modelica Association—Modelica Association. Available online: https://www.modelica.org/ (accessed on 30 October 2020).
- AIS Marine Traffic. MarineTraffic: Global Ship Tracking Intelligence. Available online: https://www.marinetraffic.com (accessed on 19 October 2020).
- Figlus, T. A Method for Diagnosing Gearboxes of Means of Transport Using Multi-Stage Filtering and Entropy. Entropy 2019, 21, 441. [Google Scholar] [CrossRef]
- Mohamed-Seghir, M.; Krama, A.; Refaat, S.S.; Trabelsi, M.; Abu-Rub, H. Artificial Intelligence-Based Weighting Factor Autotuning for Model Predictive Control of Grid-Tied Packed U-Cell Inverter. Energies 2020, 13, 3107. [Google Scholar] [CrossRef]
- Mansouri, M.; Mohamed-Seghir, M.M.; Nounou, H.N.; Nounou, M.N.; Abu-Rub, H. Bayesian methods for time-varying state and parameter estimation in induction machines. Int. J. Adapt. Control. Signal. Process. 2015, 29, 905–924. [Google Scholar] [CrossRef]
- Iwaszkiewicz, J.; Mysiak, P. Supply System for Three-Level Inverters Using Multi-Pulse Rectifiers with Coupled Reactors. Energies 2019, 12, 3385. [Google Scholar] [CrossRef]
- Iwaszkiewicz, J. Trójfazowy trójpoziomowy falownik z obniżoną zawartością harmonicznych. Przegląd Elektrotechniczny 2019, 1, 128–133. [Google Scholar] [CrossRef]
- Masnicki, R.; Mindykowski, J. Coordination of operations in registration channel of data from electrical power system. Measurement 2017, 99, 68–77. [Google Scholar] [CrossRef]
- Masnicki, R. The Fluency of Data Flow in the Instrument for Measurement and Registration of Parameters of the Electrical Power Network. In Proceedings of the IEEE 15th International Conference on Environment and Electrical Engineering (EEEIC), Rome, Italy, 10–13 June 2015; pp. 2040–2044. [Google Scholar]
- Gnacinski, P.; Tarasiuk, T.; Mindykowski, J.; Peplinski, M.; Gorniak, M.; Hallmann, D.; Pillat, A. Power Quality and Energy-Efficient Operation of Marine Induction Motors. IEEE Access 2020, 8, 152193–152203. [Google Scholar] [CrossRef]
- Gnaciński, P.; Mindykowski, J.; Tarasiuk, T. Effect of power quality on windings temperature of marine induction motors. Part II: Results of investigations and recommendations for related regulations. Energy Convers. Manag. 2009, 50, 2477–2485. [Google Scholar] [CrossRef]
- Al-Falahi, M.D.A.; Tarasiuk, T.; Jayasinghe, S.D.G.; Jin, Z.; Enshaei, H.; Guerrero, J. AC Ship Microgrids: Control and Power Management Optimization. Energies 2018, 11, 1458. [Google Scholar] [CrossRef]
- Ballard Power Systems, Inc. Fuel Cell Power Module for Heavy Duty Motive Applications. Available online: https://www.ballard.com/docs/default-source/spec-sheets/fcvelocitymd.pdf?sfvrsn=ebc380_2 (accessed on 20 October 2020).
- GUPTA, H.N. Fundamentals of Internal Combustion Engines; PHI Learning: New Delhi, India, 2013; ISBN 9788120346802. [Google Scholar]
- Ship & Bunker. Rotterdam Bunker Prices. Available online: https://shipandbunker.com/prices/emea/nwe/nl-rtm-rotterdam (accessed on 26 November 2020).
- EUROSTAT—Statistics Explained. Electricity Price Statistics. Available online: https://ec.europa.eu/eurostat/statistics-explained/index.php/Electricity_price_statistics (accessed on 26 November 2020).
- Min-Hon, R.; Yu-Ling, K.; Guan-Ting, Y.; Shi-Chung, C.; Rei, M.-H.; Kao, Y.-L.; Yeh, G.-T.; Chen, S.-C. The Influence of the Hydrogen Supply Modes on a Hydrogen Refueling Station. Mod. Econ. 2020, 11, 867–880. [Google Scholar] [CrossRef][Green Version]
- Graphenano. A Spanish Company Develops a Battery with an Autonomy of 800 km. Available online: https://www.graphenano.com/en/una-empresa-espanola-desarrolla-una-bateria-con-autonomia-800-kilometros/ (accessed on 10 October 2020).
- Moro, A.; Lonza, L. Electricity carbon intensity in European Member States: Impacts on GHG emissions of electric vehicles. Transp. Res. Part D Transp. Environ. 2018, 64, 5–14. [Google Scholar] [CrossRef]


Publisher’s Note: MDPI stays neutral with regard to jurisdictional claims in published maps and institutional affiliations. |
© 2020 by the authors. Licensee MDPI, Basel, Switzerland. This article is an open access article distributed under the terms and conditions of the Creative Commons Attribution (CC BY) license (http://creativecommons.org/licenses/by/4.0/).