Cost Optimization of Wastewater and Septage Treatment Process


Abstract
1. Introduction
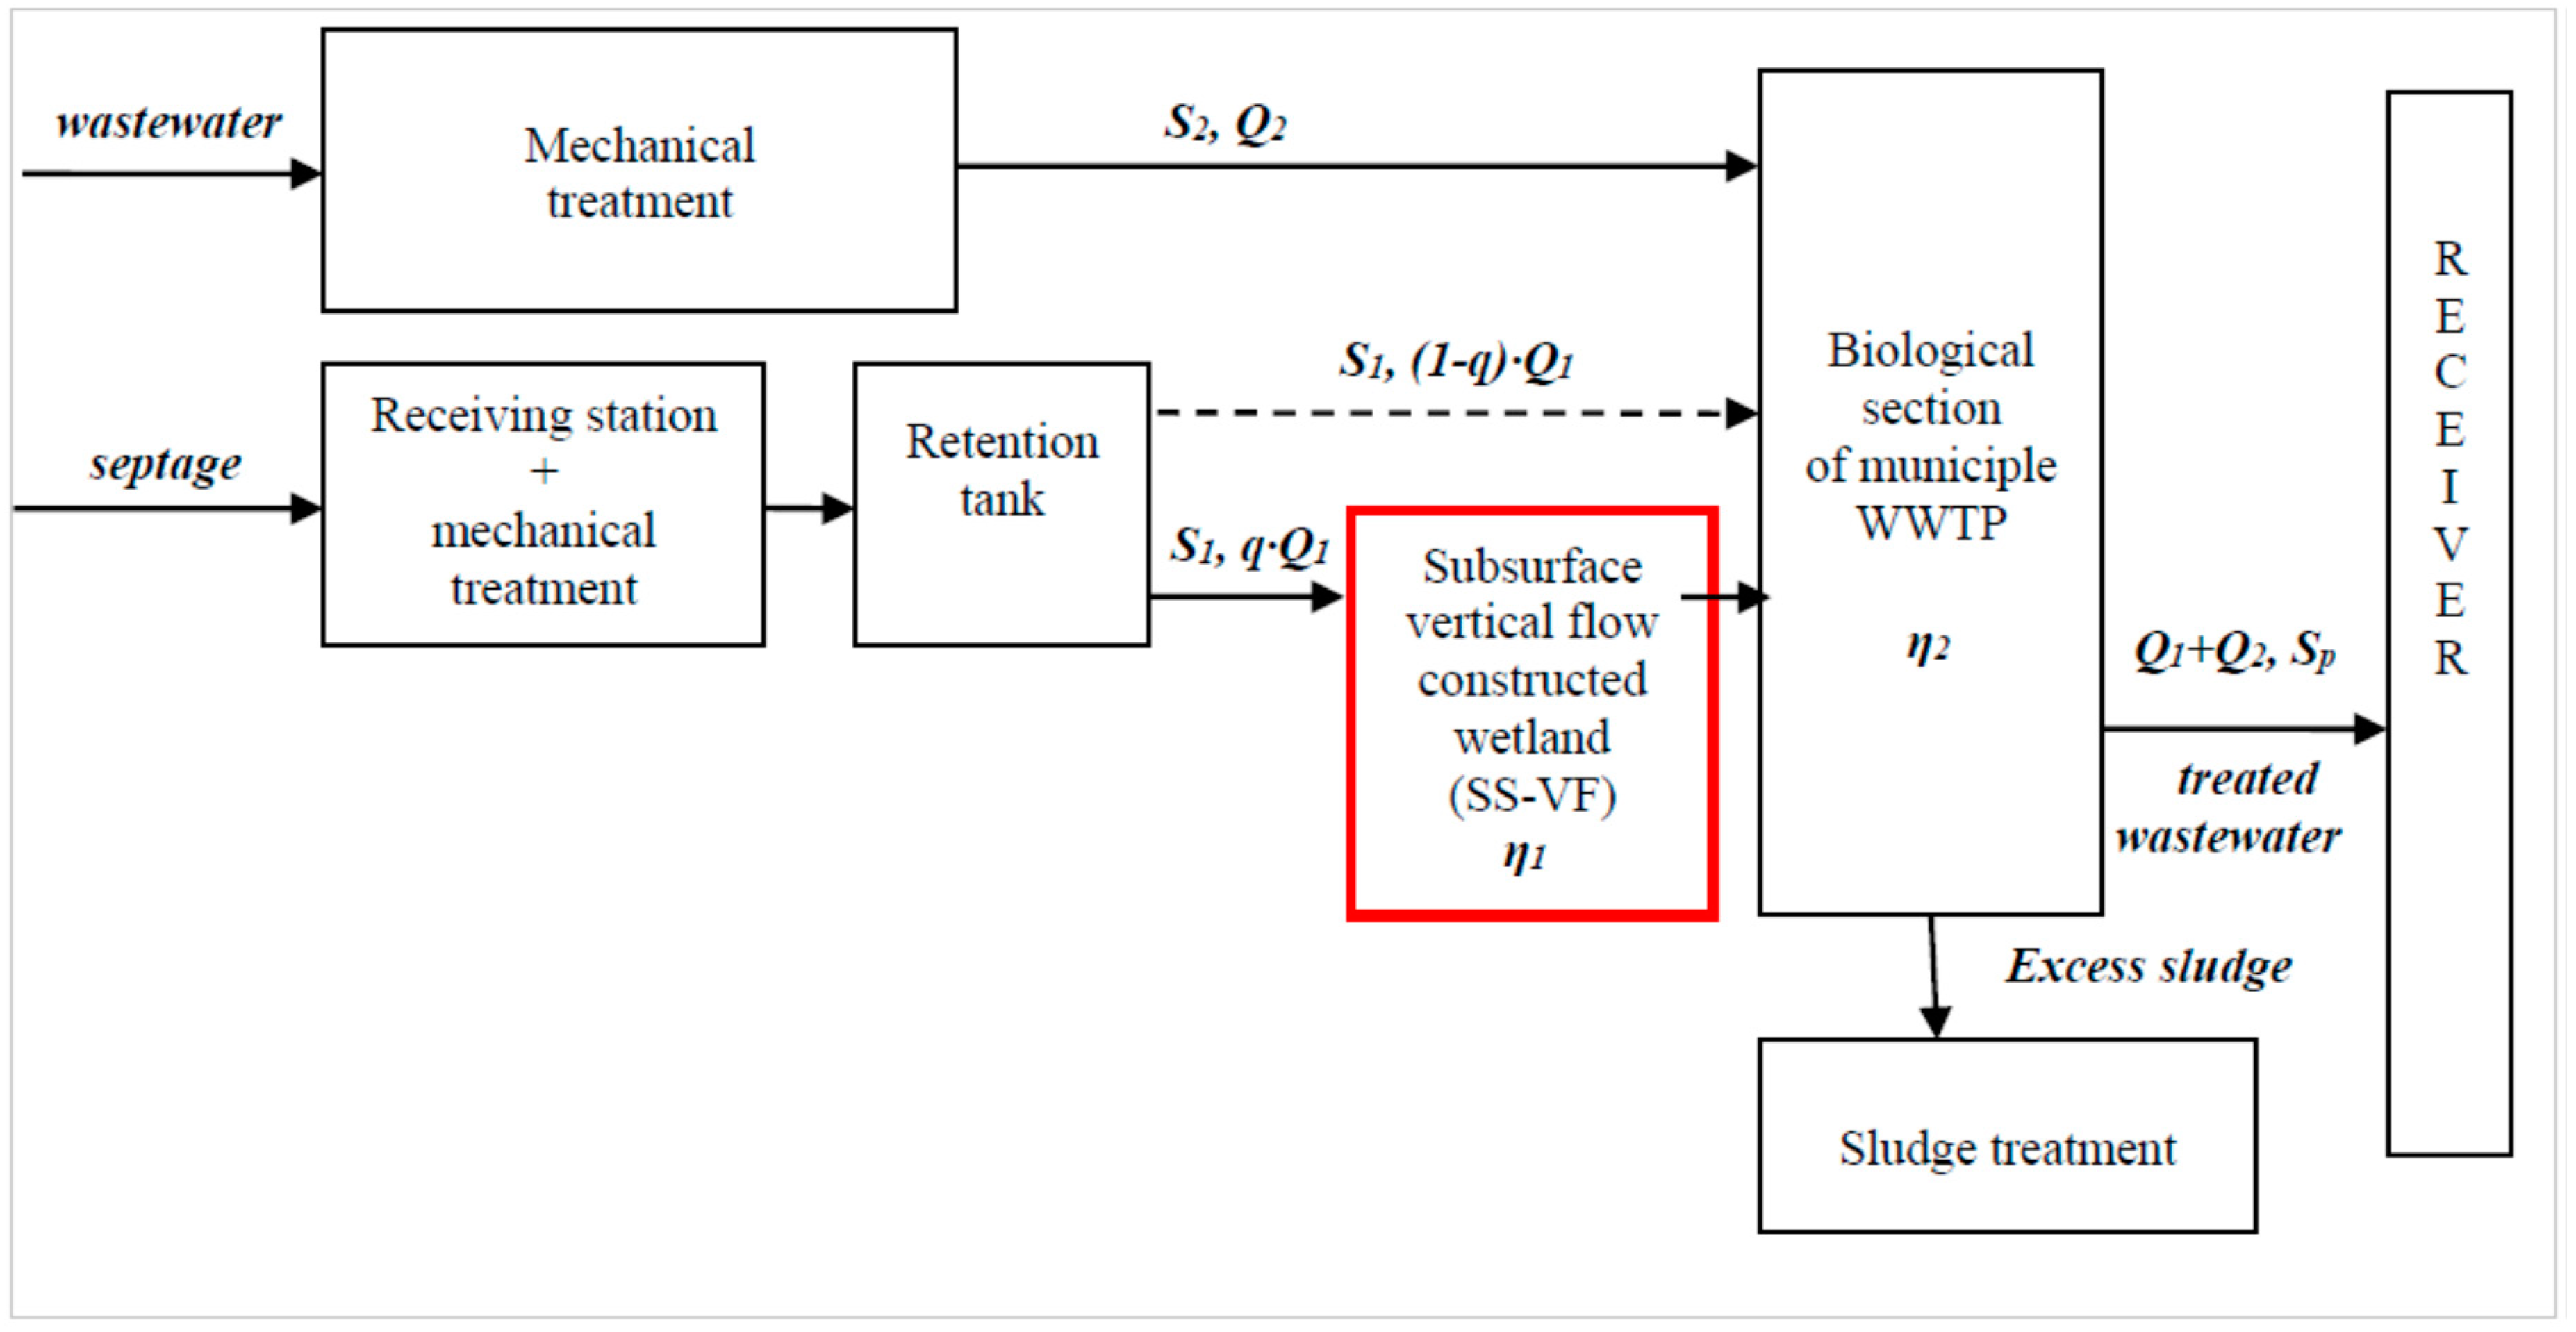
2. Mathematical Modeling
3. Results
- (1)
- Optimization criterion:
- (2)
- Decision variables:
- (3)
- Objective function:
- (4)
- Constraints:

- (5)
- Constraints of decision variables: q (0; 1 − κ)
- (6)
- Model solution algorithm:
- (7)
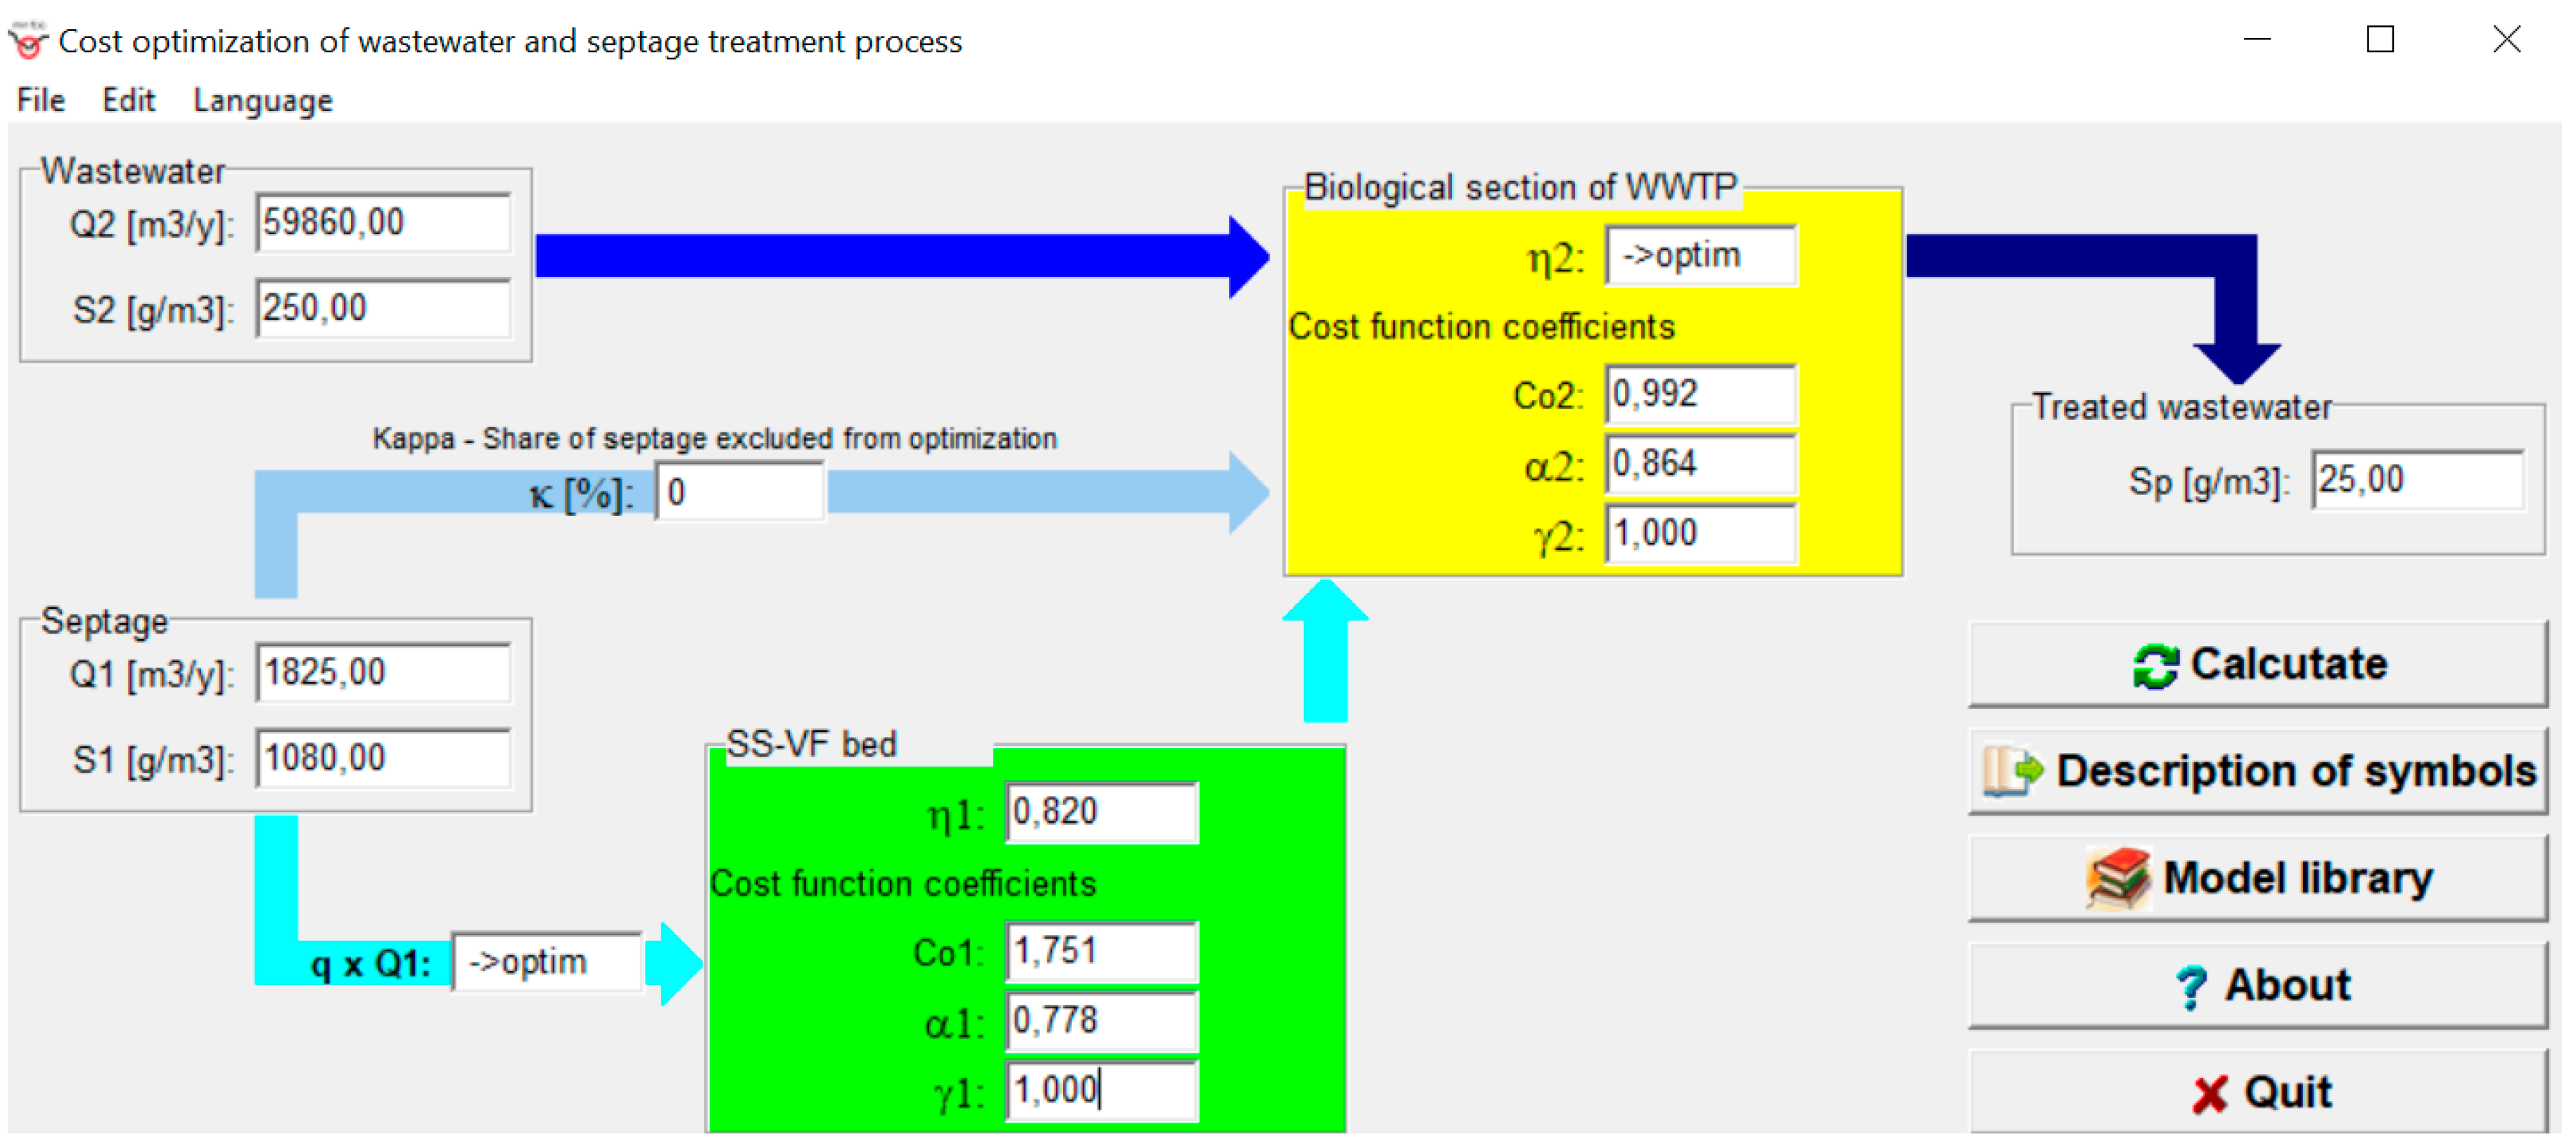
- Computer program:
- (8)
- Verification of the optimization model and interpretation of the optimization results:
4. Discussion—Verification of the Optimization Model
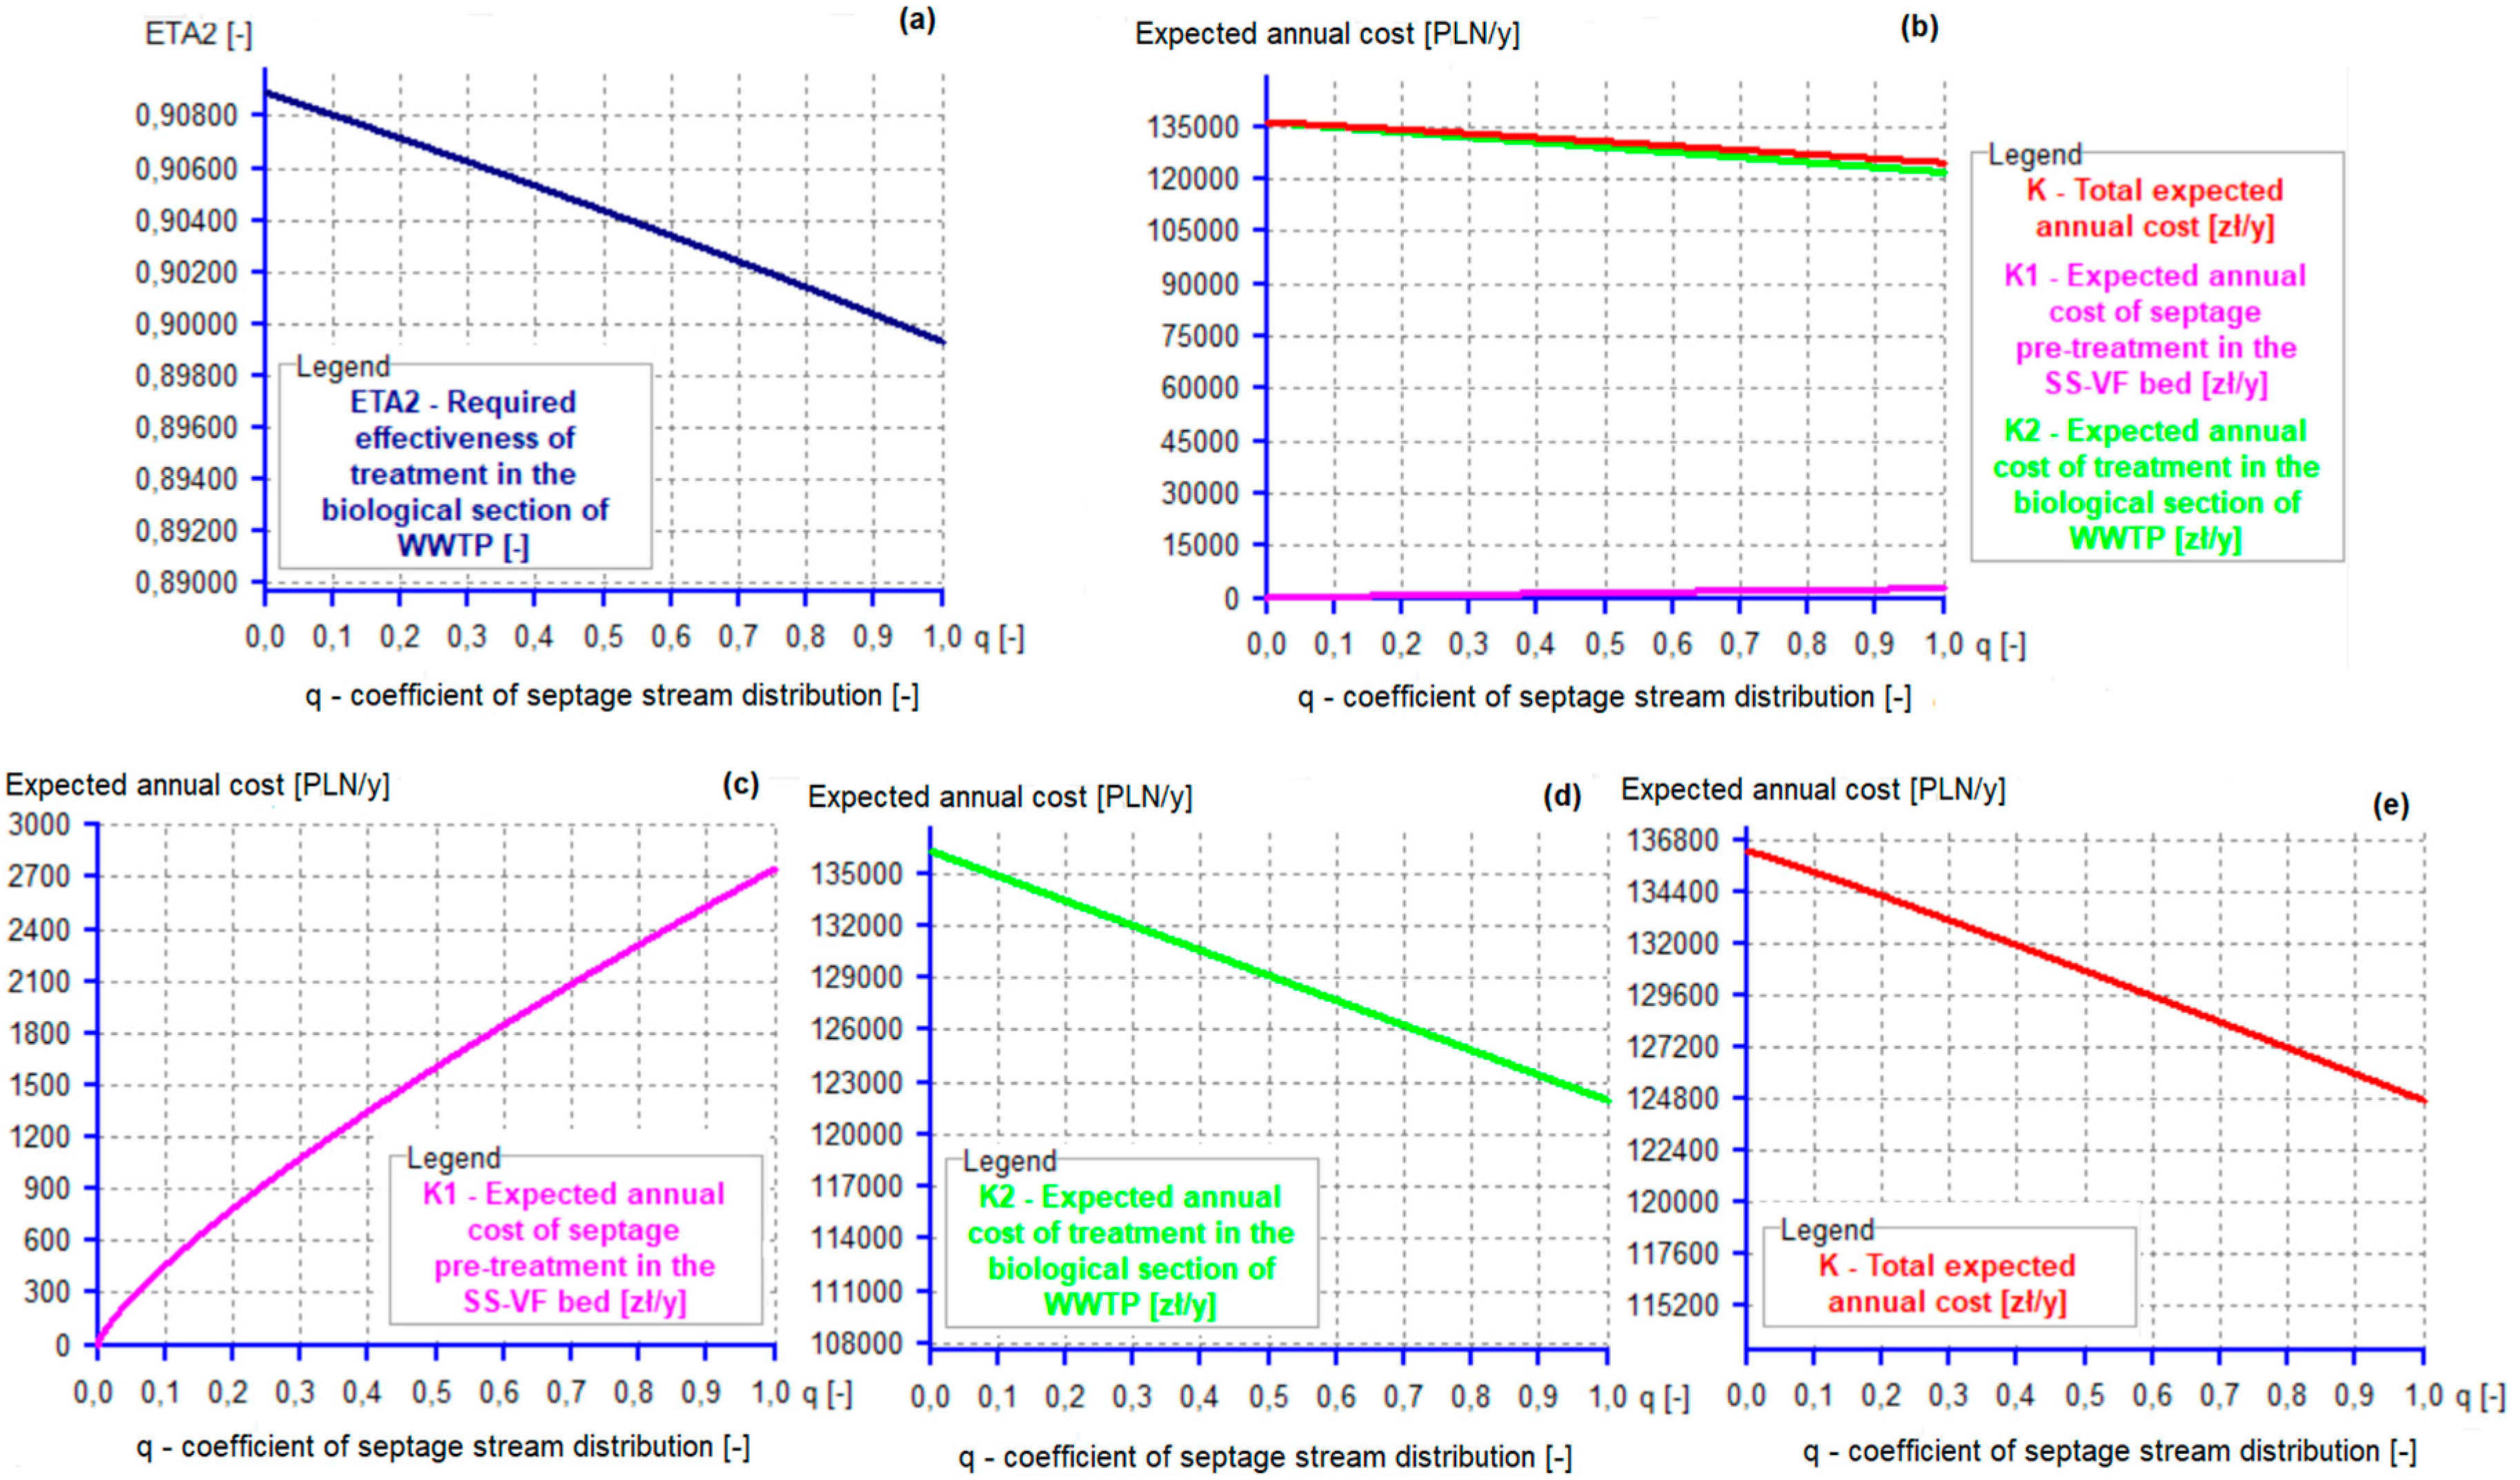
4.1. Example One
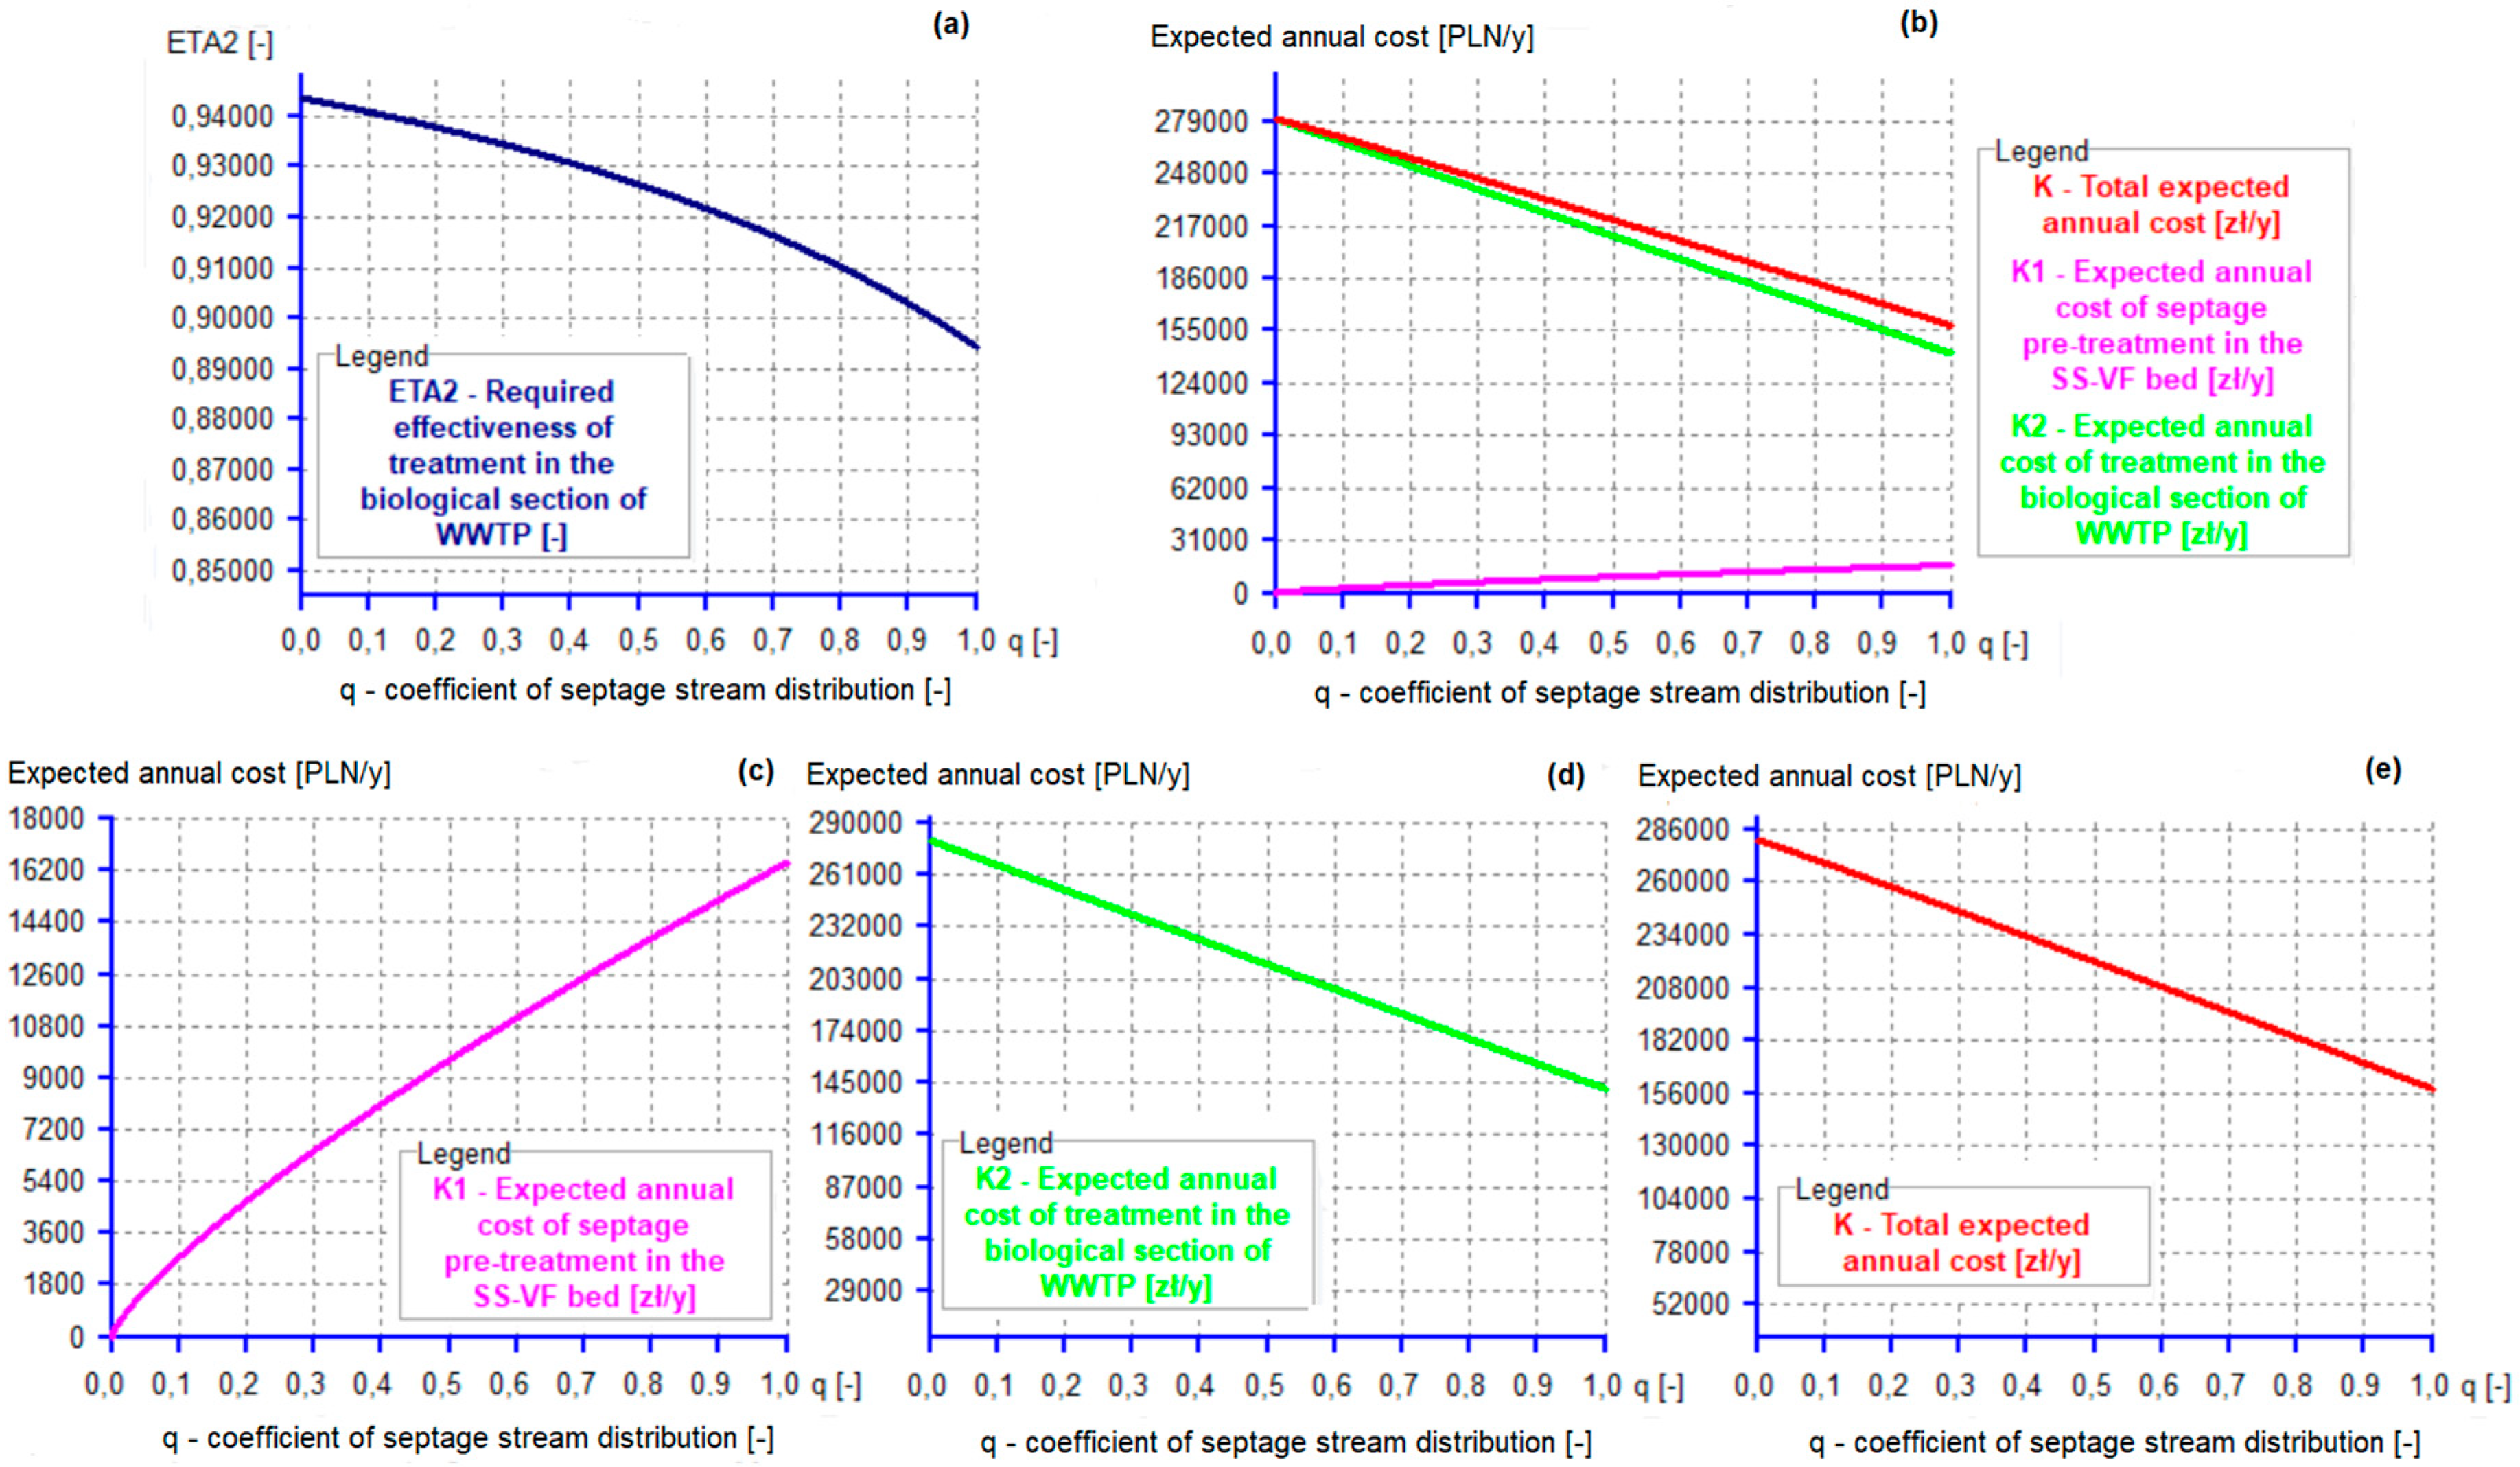
4.2. Example Two
4.3. Example Three
4.4. Comparison of Examples One to Three
5. Conclusions
Author Contributions
Funding
Conflicts of Interest
References
- Sheng, P.; Dong, Y.; Vochozka, M. Analysis of Cost-Effective Methods to Reduce Industrial Wastewater Emissions in China. Water 2020, 12, 1600. [Google Scholar] [CrossRef]
- Hernandez-Sancho, F.; Molinos-Senante, M.; Sala-Garrido, R. Cost modelling for wastewater treatment processes. Desalination 2011, 268, 1–5. [Google Scholar] [CrossRef]
- Engin, G.O.; Demir, I. Cost analysis of alternative methods for wastewater handling in small communities. J. Environ. Manag. 2006, 79, 357–363. [Google Scholar] [CrossRef] [PubMed]
- Boller, M. Small wastewater treatment plants—A challenge to wastewater engineers. Water Sci. Technol. 1997, 35, 1–12. [Google Scholar] [CrossRef]
- Ignatowicz, K.; Puchlik, M. Rotary biological contactor as alternative for small amount of wastewater treatment. Annu. Set Environ. Prot. 2011, 13, 1385–1404. [Google Scholar]
- Al-Sa’ed, R.M.Y.; Hithnawi, T.M. Domestic septage characteristic and cotreatment impacts on Albireh Wastewater Treatment Plant efficiency. Diraset Eng. Sci. 2006, 33, 187–197. [Google Scholar]
- US Environmental Protection Agency. Guide to Septage Treatment and Disposal; EPA Office of Research and Development: Washington, DC, USA, 1994. [Google Scholar]
- Liénard, A.; Payrastre, E. Treatment of sludge from septic tanks in a reed-bed filters pilot system. In Proceedings of the 5th International Conference on Wetland Systems for Water Pollution Control, Vienna, Austria, 15–19 September 1996. [Google Scholar]
- Paing, J.; Voisin, J. Vertical flow constructed wetlands for municipal wastewater and septage treatment in French rural area. Water Sci. Technol. 2005, 51, 145–155. [Google Scholar] [CrossRef] [PubMed]
- Ingallinella, A.M.; Sanguinetti, G.; Koottatep, T.; Montangero, A.; Strauss, M. The challenge of faecal sludge management in urban areas–strategies, regulations and treatment options. Water Sci. Technol. 2002, 46, 285–294. [Google Scholar] [CrossRef] [PubMed]
- Kadlec, R.H.; Wallace, S.D. Treatment Wetlands, 2nd ed.; CRC Press: Boca Raton, FL, USA, 2009. [Google Scholar]
- Kołecka, K.; Obarska-Pempkowiak, H.; Gajewska, M. Polish experience in operation of sludge treatment reed beds. Ecol. Eng. 2018, 120, 405–410. [Google Scholar]
- Jóźwiakowski, K.; Marzec, M.; Kowalczyk-Juśko, A.; Gizińska-Górna, M.; Pytka-Woszczyło, A.; Malik, A.; Listosz, A.; Gajewska, M. 25years of research and experiences about the application of constructed wetlands in south-eastern Poland. Ecol. Eng. 2019, 127, 440–453. [Google Scholar] [CrossRef]
- Malinowski, P.; Dąbrowski, W. Modeling of Organic Substances and Ammonia Nitrogen Removal in Vertical Flow Constructed Wetlands. J. Ecol. Eng. 2020, 21, 231–237. [Google Scholar] [CrossRef]
- Kinsley, C.; Crolla, A. Reed Bed Filters to Treat Septage under Canadian Climatic Conditions, AOWMA Annual Conference; Ramada Convention Centre: Edmonton, Alberta, 2013. [Google Scholar]
- Kengne, I.M.; Dodane, P.-H.; Amougou, A.; Koné, D. Vertical–Flow Constructed Wetlands as Sustainable Approach for Feacal Sludge Dewatering in Developing Countries. Desalination 2009, 248, 291–297. [Google Scholar] [CrossRef]
- Koottatep, T.; Surinkul, N.; Polprasert, C.; Kamal, A.S.M.; Koné, D.; Montangero, A.; Heinss, U.; Strauss, M. Treatment of septage in constructed wetlands in tropical climate: Lessons learnt from seven years of operation. Water Sci. Technol. 2005, 51, 119–126. [Google Scholar] [CrossRef] [PubMed]
- Koné, D.; Strauss, M. Low-cost options for treating faecal sludge in developing countries–challenges and performance. In Proceedings of the 9th International IWA Specialist Group Conference on Wetlands Systems for Water Pollution Control and to the 6th International IWA Specialist Group Conference on WasteStabilisation Ponds, Avignon, France, 27 September 2004. [Google Scholar]
- Karolinczak, B.; Dąbrowski, W. Effectiveness of septage pre-treatment in vertical flow constructed wetlands. Water Sci. Technol. 2017, 76, 2544–2553. [Google Scholar]
- Tan, Y.Y.; Tang, F.E.; Saptoro, A.; Khor, E.H. Septage treatment using vertical-flow engineered wetland: A critical review. Chem. Eng. Trans. 2015, 45, 1531–1536. [Google Scholar]
- Bui, J.J.X.; Tang, F.E.; Tan, Y.Y.; Wong, K.S.; Saptoto, A. Dewatering and Mineralization of Sludge in Vertical Flow Constructed Wetlands: A Review. In Proceedings of the IOP Conference Series: Materials Science and Engineering, International Conference, Sarawak, Malaysia, 26–28 November 2018. [Google Scholar]
- Tyteca, D. Nonlinear programming model of wastewater treatment plant. J. Environ. Eng. Div. Am. Soc. Civ. Eng. 1981, 107, 747–766. [Google Scholar]
- Gillot, S.; De Clercq, B.; Defour, D.; Simoens, F.; Gernaey, K.; Vanrolleghem, P.A. Optimization of Wastewater Treatment Plant Design and Operation Using Simulation and Cost Analysis. Available online: http://citeseerx.ist.psu.edu/viewdoc/download?doi=10.1.1.64.1268&rep=rep1&type=pdf (accessed on 20 September 2020).
- Sid, S.; Volant, A.; Lesage, G.; Heran, M. Cost minimization in a full-scale conventional wastewater treatment plant: Associated costs of biological energy consumption versus sludge production. Water Sci. Technol. 2017, 76, 2473–2481. [Google Scholar] [CrossRef]
- Lange, O. Optimal Decisions. Principles of Programming; PWN: Warsaw, Poland, 1974; pp. 12–14. (In Polish) [Google Scholar]
- Miłaszewski, R. Economic effectiveness of investments in water supply and sewage management and water pollution control. In Materials for Studying Water Supply and Water Pollution Control Economics, 2nd ed.; Cygler, M., Miłaszewski, R., Eds.; Economy and Environment: Białystok, Poland, 2008; pp. 56–64. [Google Scholar]
- Karolinczak, B.; Miłaszewski, R. Application of assessment methods of the economic effectiveness of water supply and sewerage facilities. Annu. Set Environ. Prot. 2016, 18, 770–782. (In Polish) [Google Scholar]
- Mielcarek, A.; Rodziewicz, J.; Janczukowicz, W.; Struk-Sokołowska, J. The impact of biodegradable carbon sources on nutrients removal in post-denitrification biofilm reactors. Sci. Total Environ. 2020, 720, 137377. [Google Scholar] [CrossRef] [PubMed]


| Expected Annual Cost (PLN/Year) | Variant Zero | Alternative Variant |
|---|---|---|
| Cost of septage pre-treatment in SS-VF bed | - | 2.748 |
| Cost of treatment in the biological section of a WWTP | 136.287 | 121.978 |
| Total | 136.287 | 124.726 |
| Savings in alternative variant | 11.561 (8.5%) |
| Expected Annual Cost (PLN/Year) | Variant Zero | Alternative Variant |
|---|---|---|
| Cost of septage pre-treatment in SS-VF bed | - | 16.485 |
| Cost of treatment in the biological section of WWTP | 280.548 | 141.979 |
| Total | 280.548 | 158.464 |
| Savings in alternative variant | 122.083 (43.5%) |
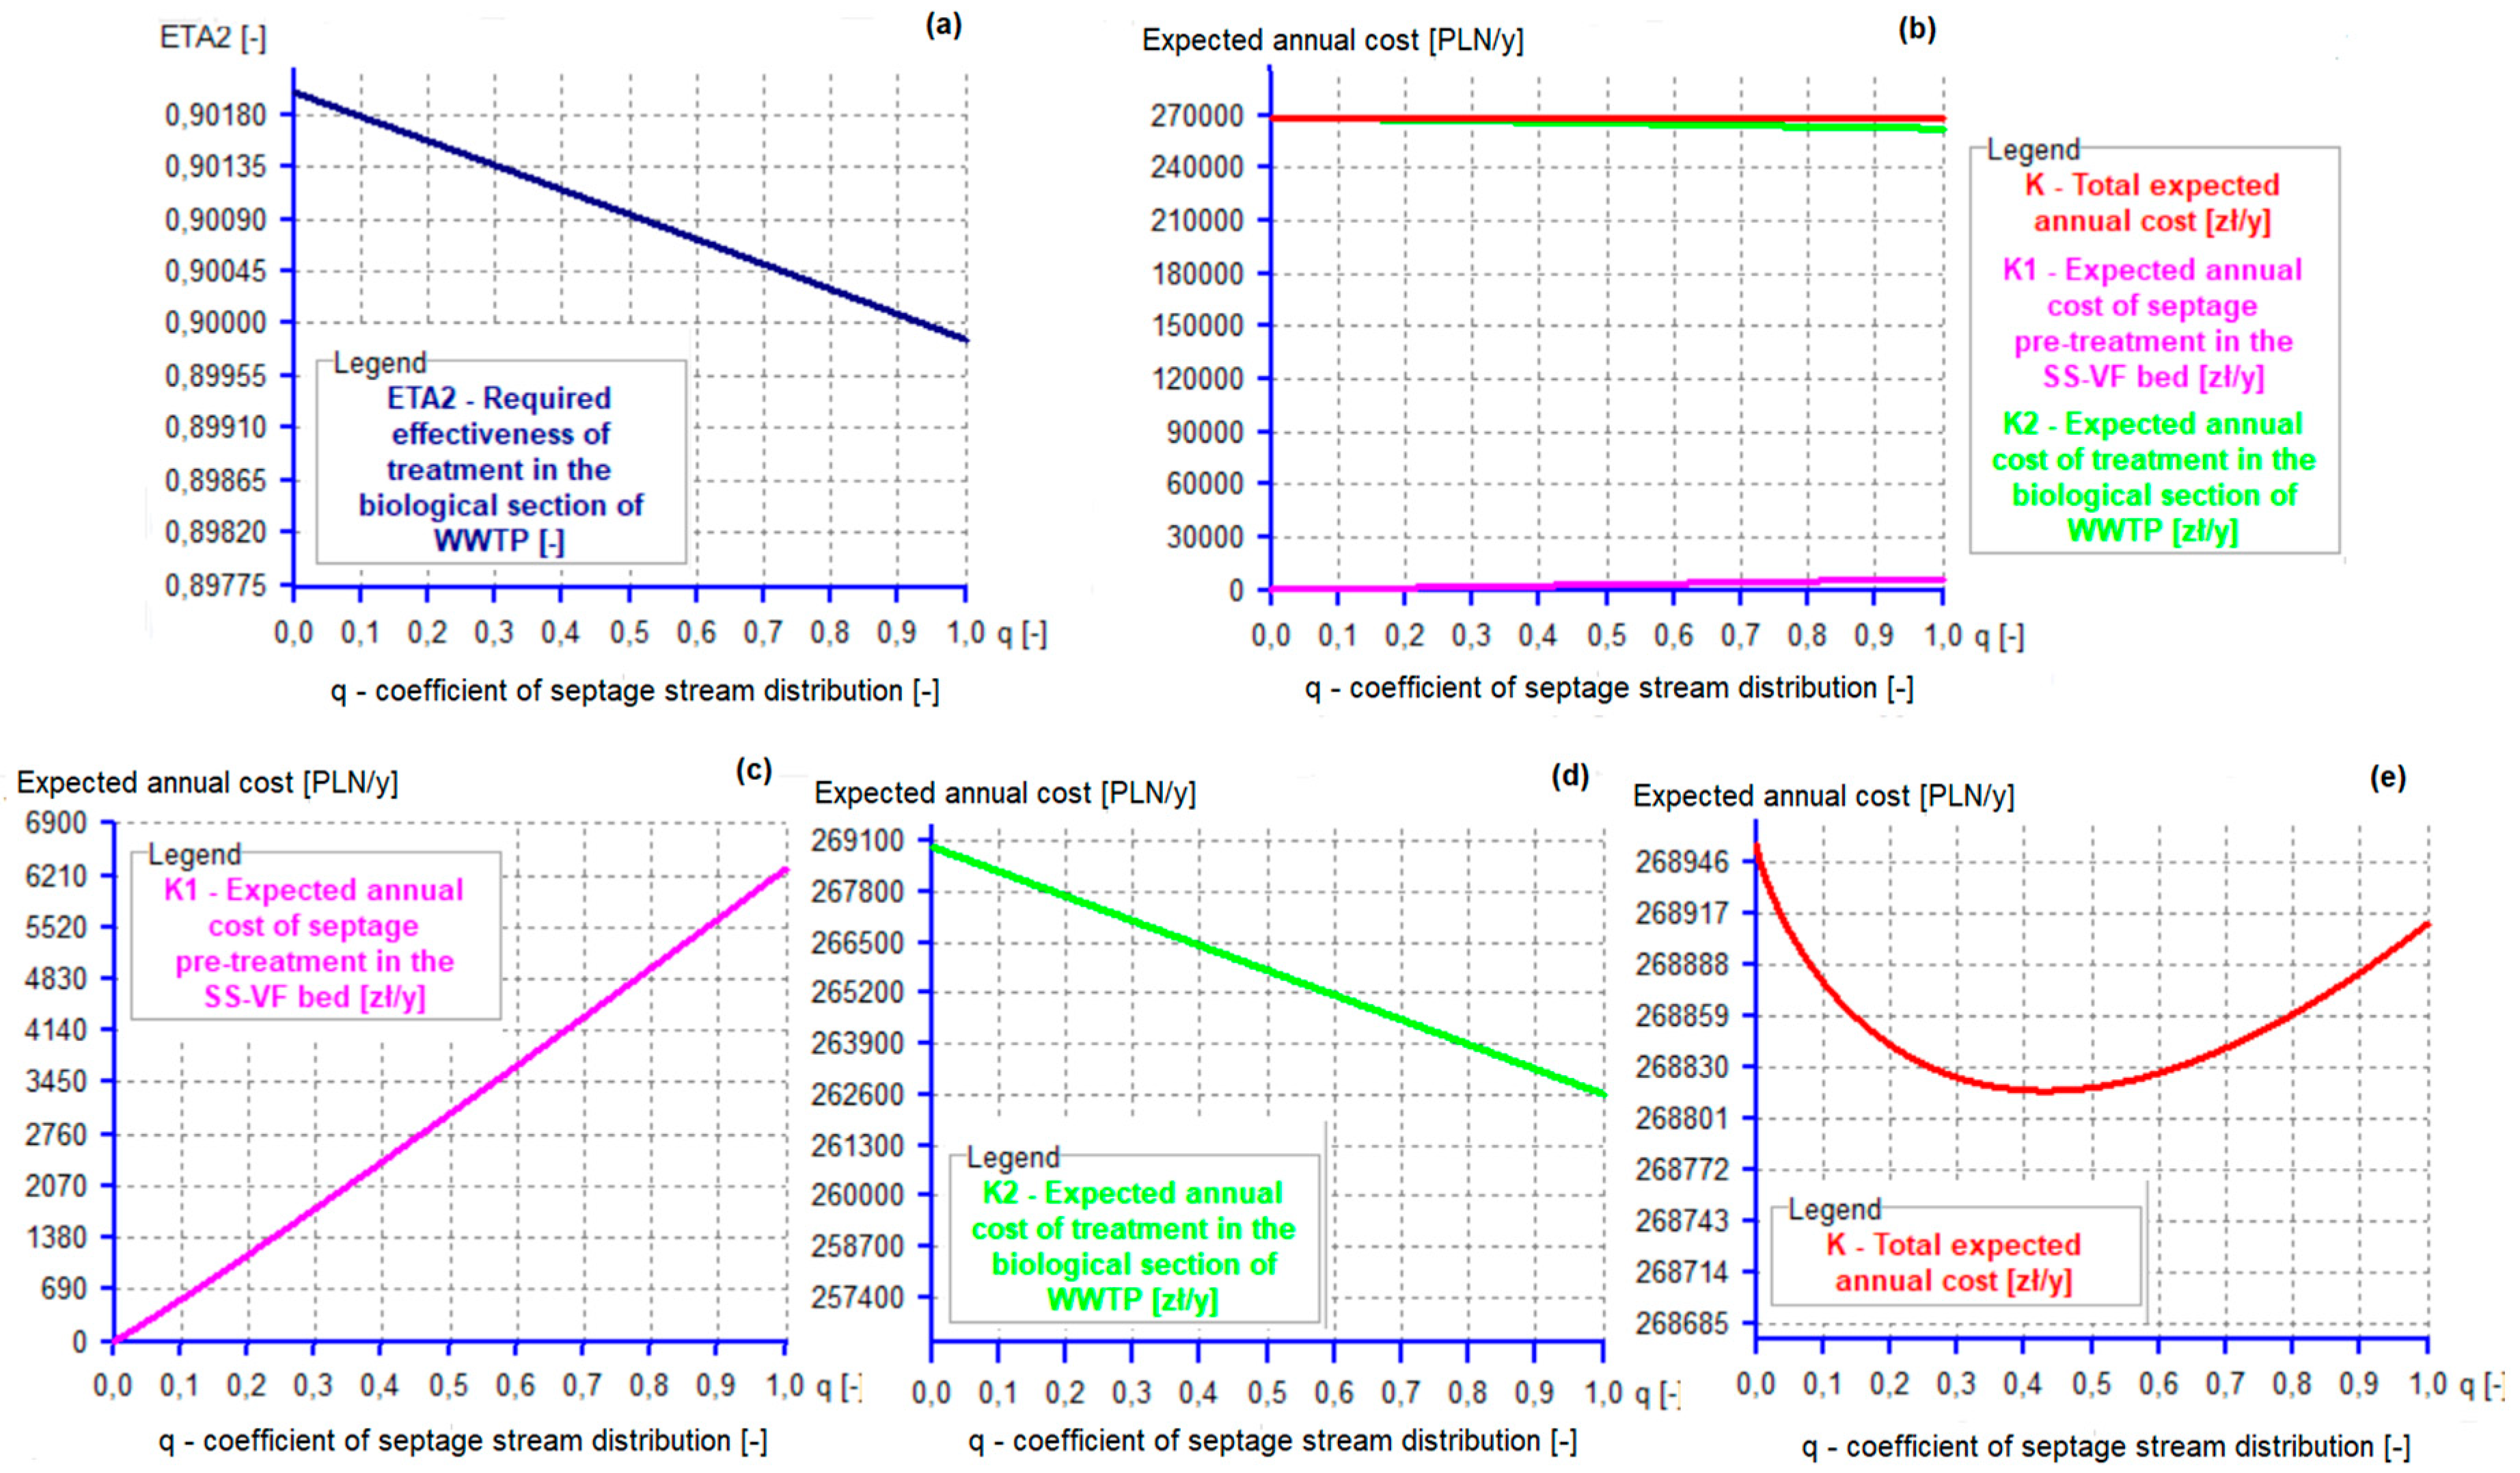
| Expected Annual Cost (PLN/Year) | Variant Zero | Alternative Variant |
|---|---|---|
| Cost of septage pre-treatment in SS-VF bed | - | 2.597 |
| Cost of treatment in the biological section of WWTP | 268.957 | 266.220 |
| Total | 268.957 | 268.817 |
| Savings in alternative variant | 140 (0.05%) |
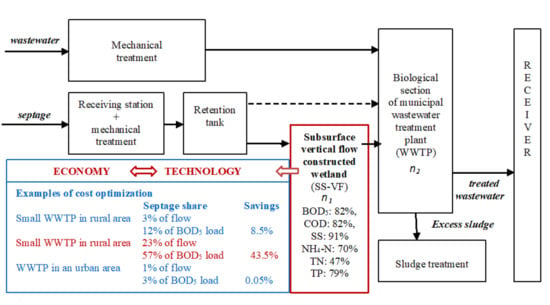
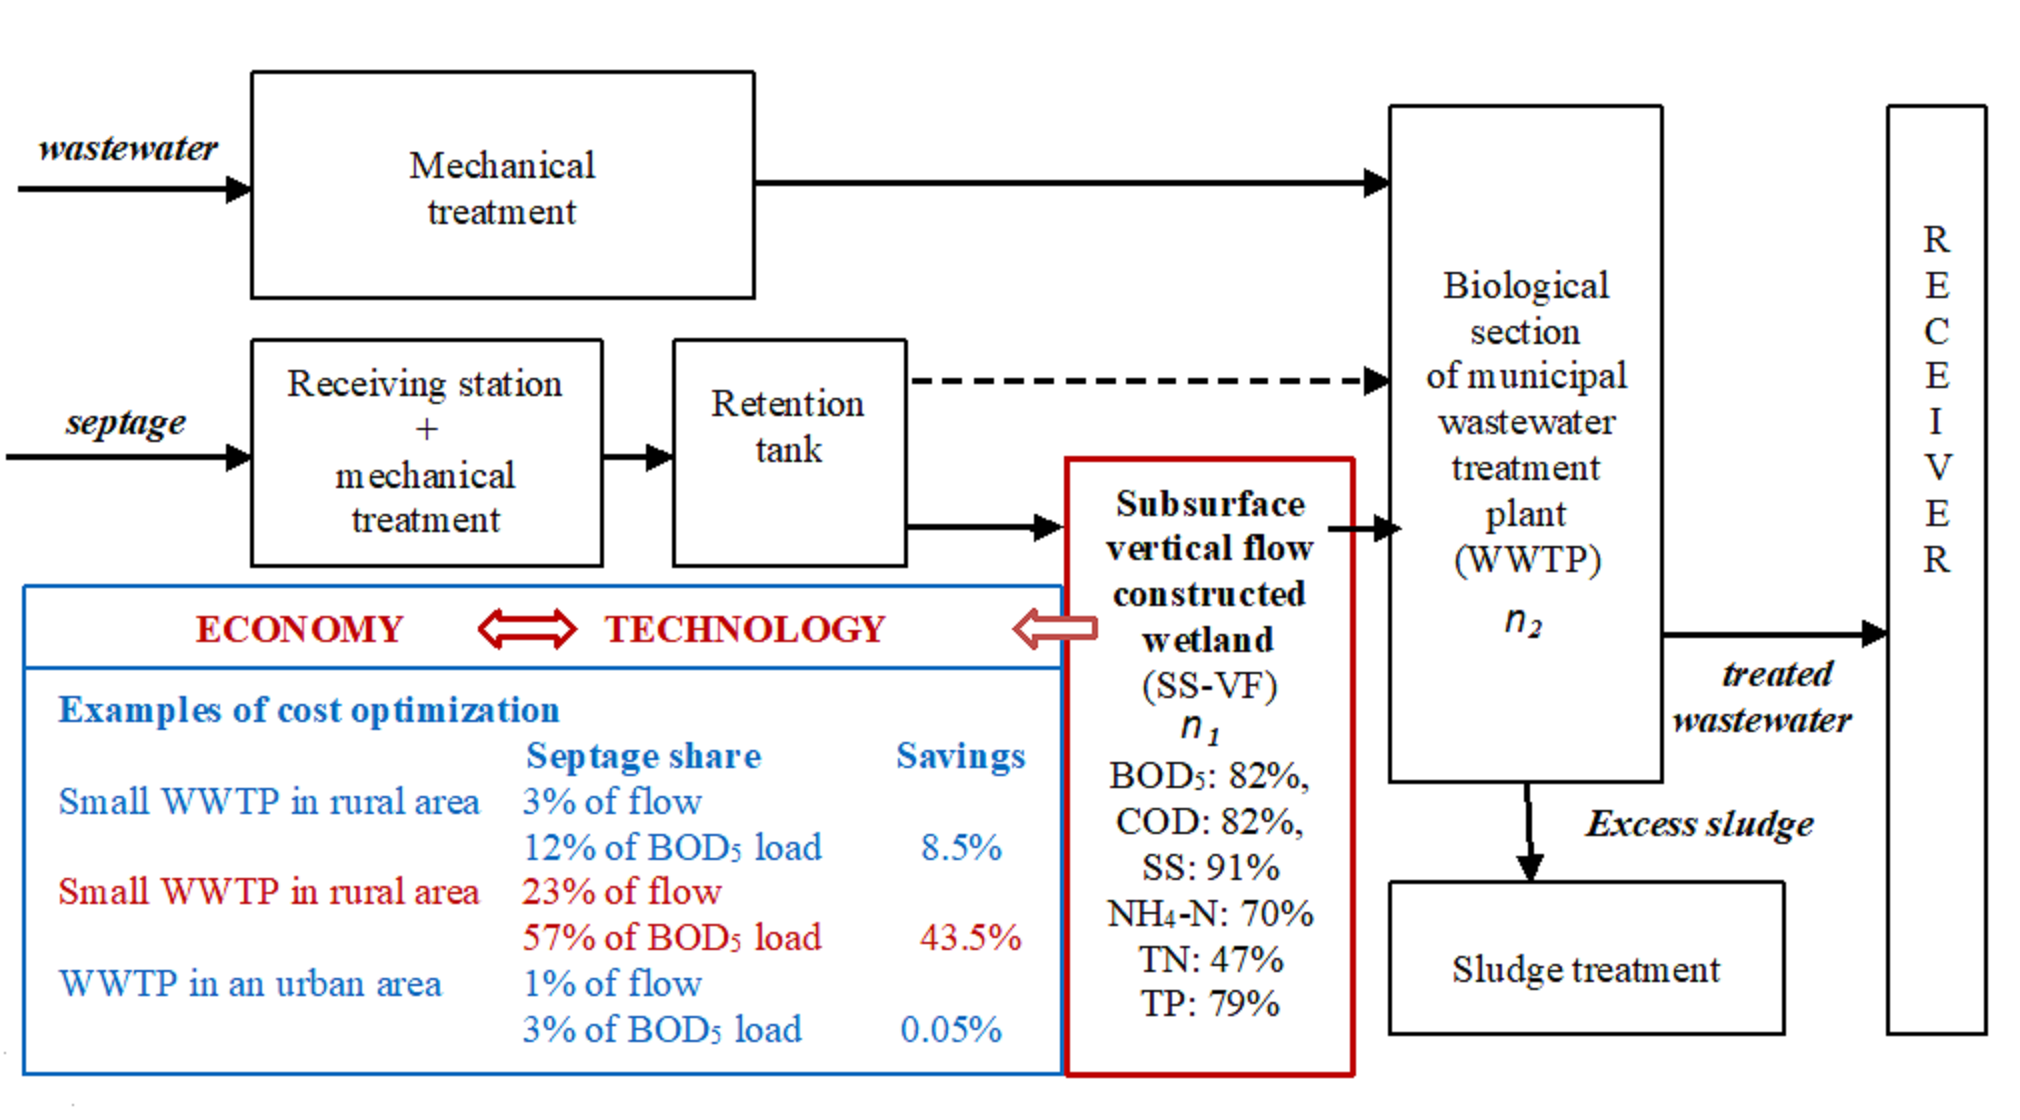
| Example | Septage Share | Savings in Alternative Variant |
|---|---|---|
| 1. Small WWTP in a rural area | 3% of flow 12% of BOD5 load | 8.5% |
| 2. Small WWTP in a rural area | 23% of flow 57% of BOD5 load | 43.5% |
| 3. WWTP in an urban area | 1% of flow 3% of BOD5 load | 0.05% |
Publisher’s Note: MDPI stays neutral with regard to jurisdictional claims in published maps and institutional affiliations. |
© 2020 by the authors. Licensee MDPI, Basel, Switzerland. This article is an open access article distributed under the terms and conditions of the Creative Commons Attribution (CC BY) license (http://creativecommons.org/licenses/by/4.0/).
Share and Cite
Karolinczak, B.; Miłaszewski, R.; Dąbrowski, W. Cost Optimization of Wastewater and Septage Treatment Process. Energies 2020, 13, 6406. https://doi.org/10.3390/en13236406
Karolinczak B, Miłaszewski R, Dąbrowski W. Cost Optimization of Wastewater and Septage Treatment Process. Energies. 2020; 13(23):6406. https://doi.org/10.3390/en13236406
Chicago/Turabian StyleKarolinczak, Beata, Rafał Miłaszewski, and Wojciech Dąbrowski. 2020. "Cost Optimization of Wastewater and Septage Treatment Process" Energies 13, no. 23: 6406. https://doi.org/10.3390/en13236406
APA StyleKarolinczak, B., Miłaszewski, R., & Dąbrowski, W. (2020). Cost Optimization of Wastewater and Septage Treatment Process. Energies, 13(23), 6406. https://doi.org/10.3390/en13236406