Hybrid Renewable Hydrogen Energy Solution for Application in Remote Mines


Abstract
1. Introduction
2. Methodology
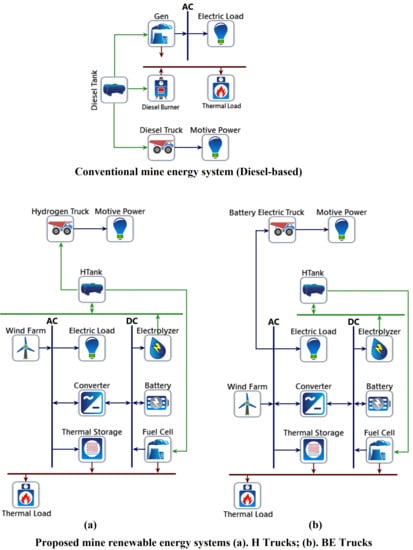
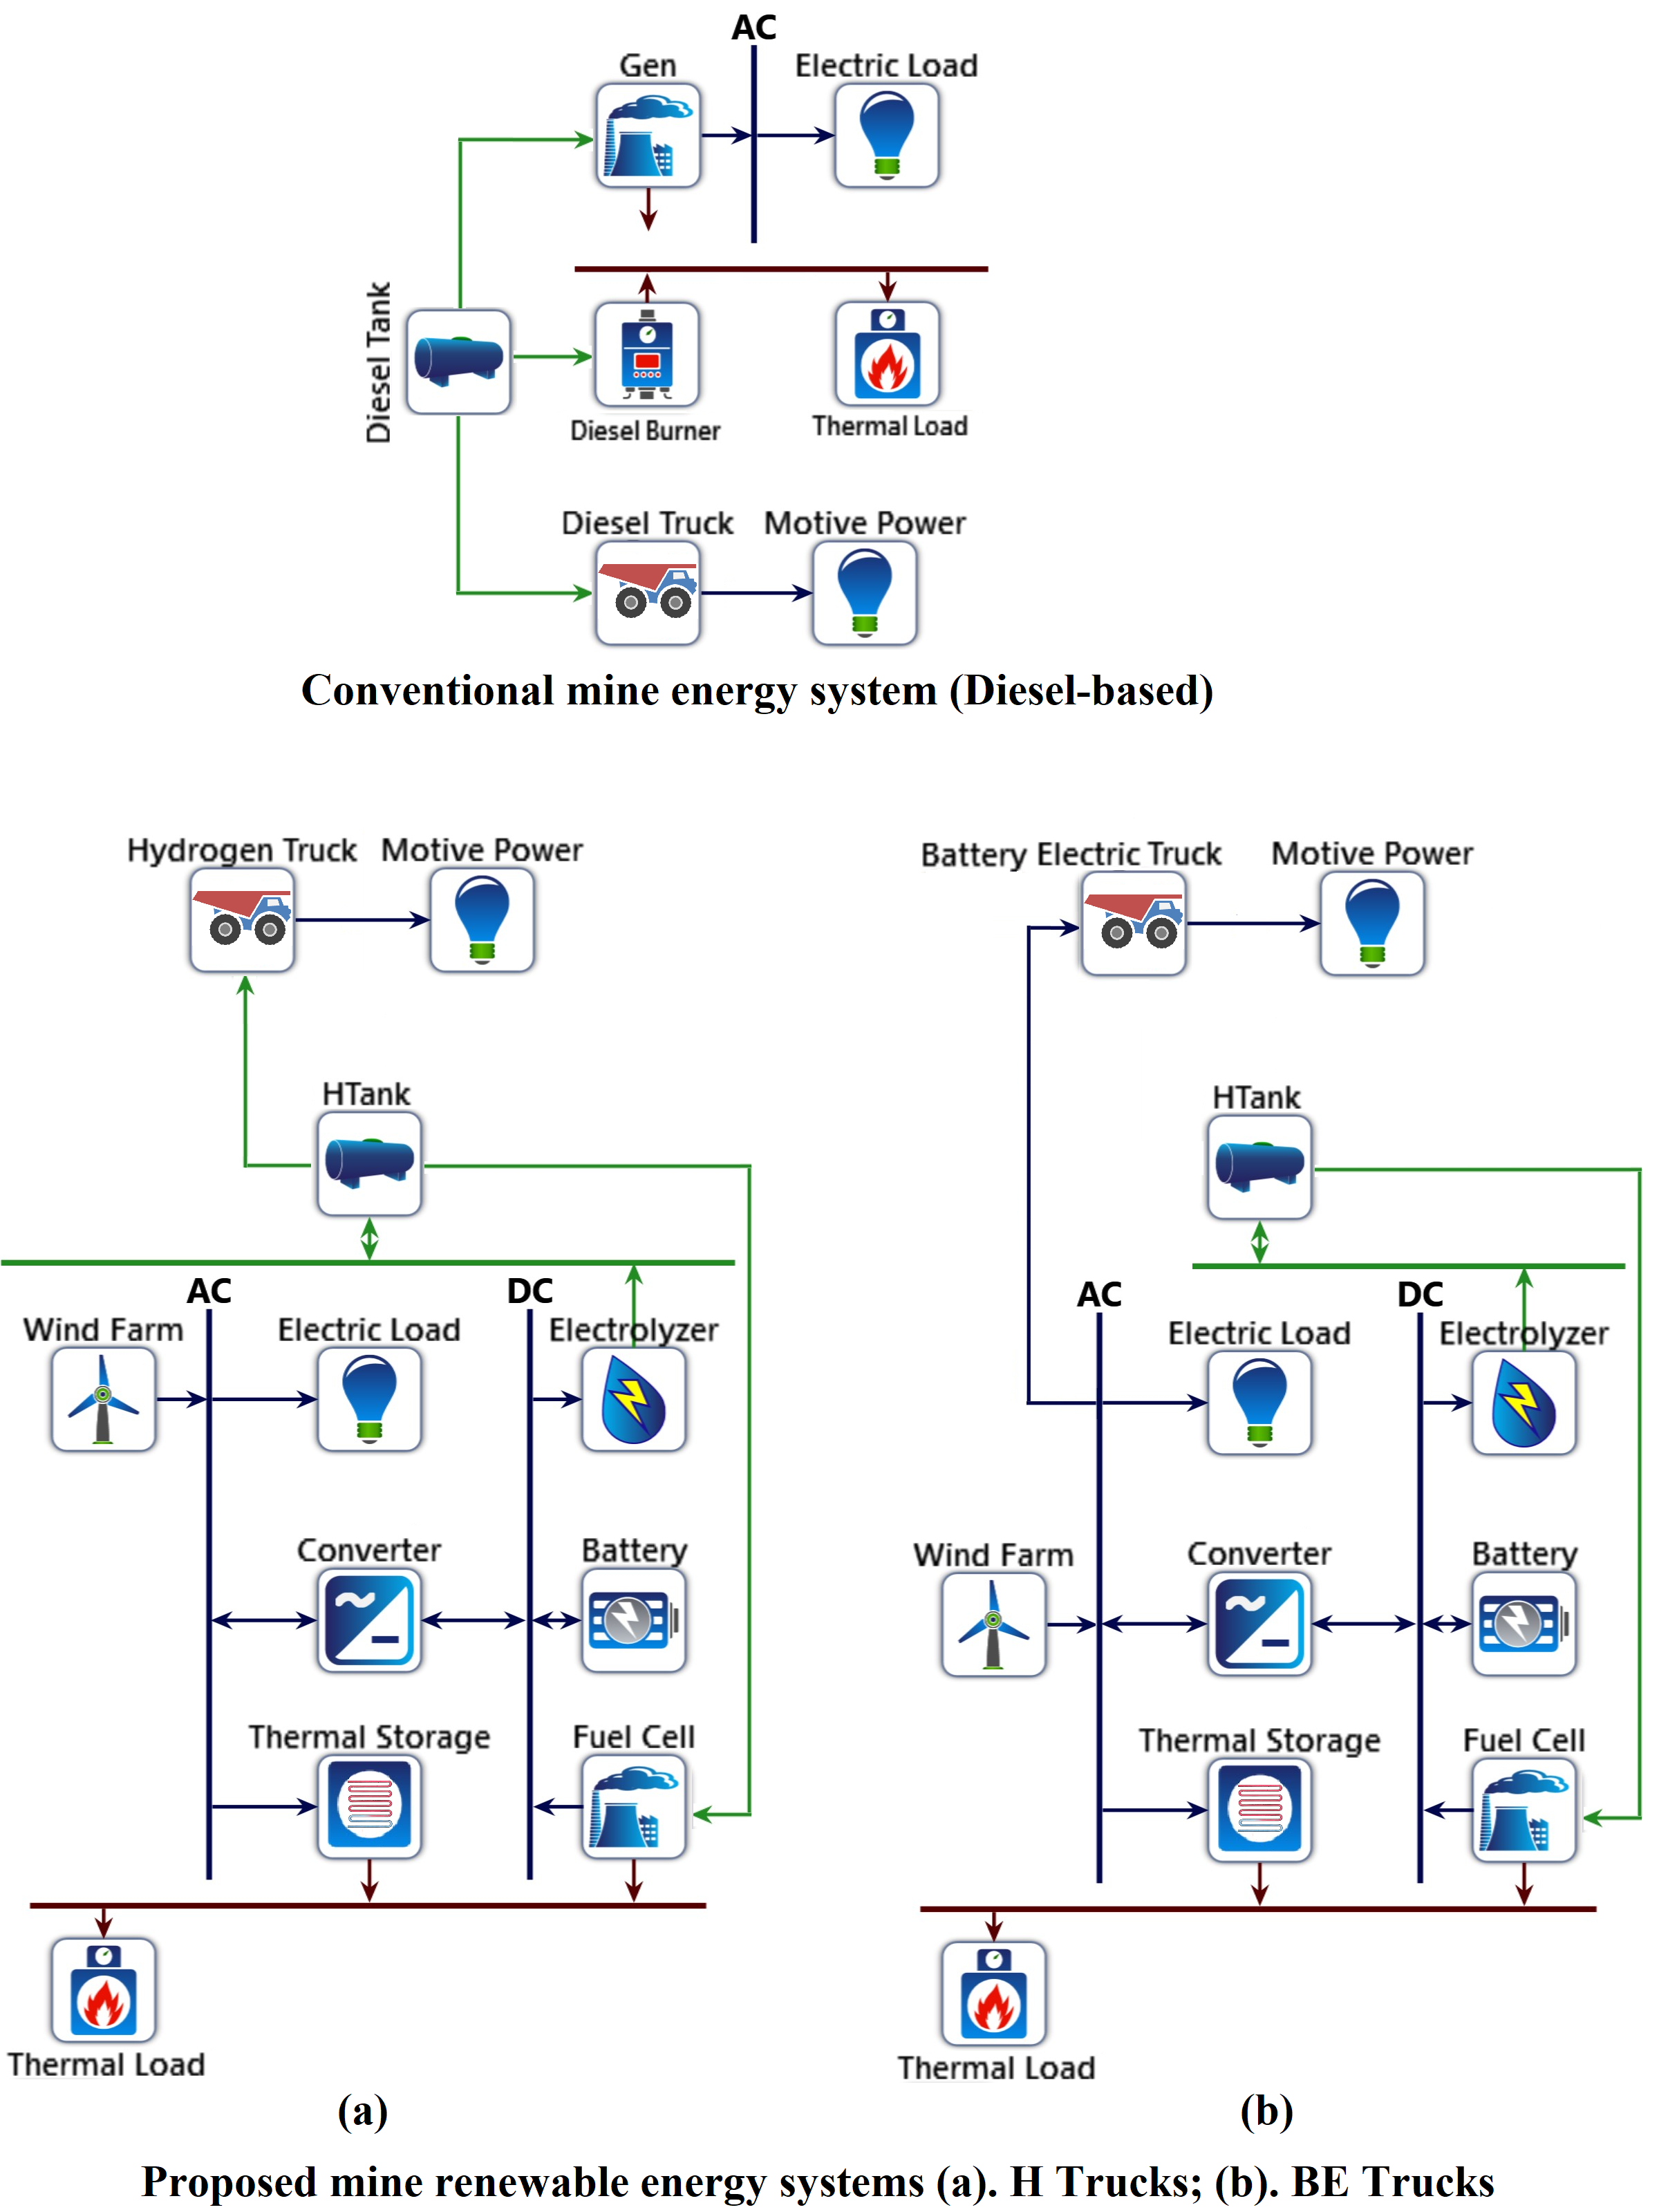
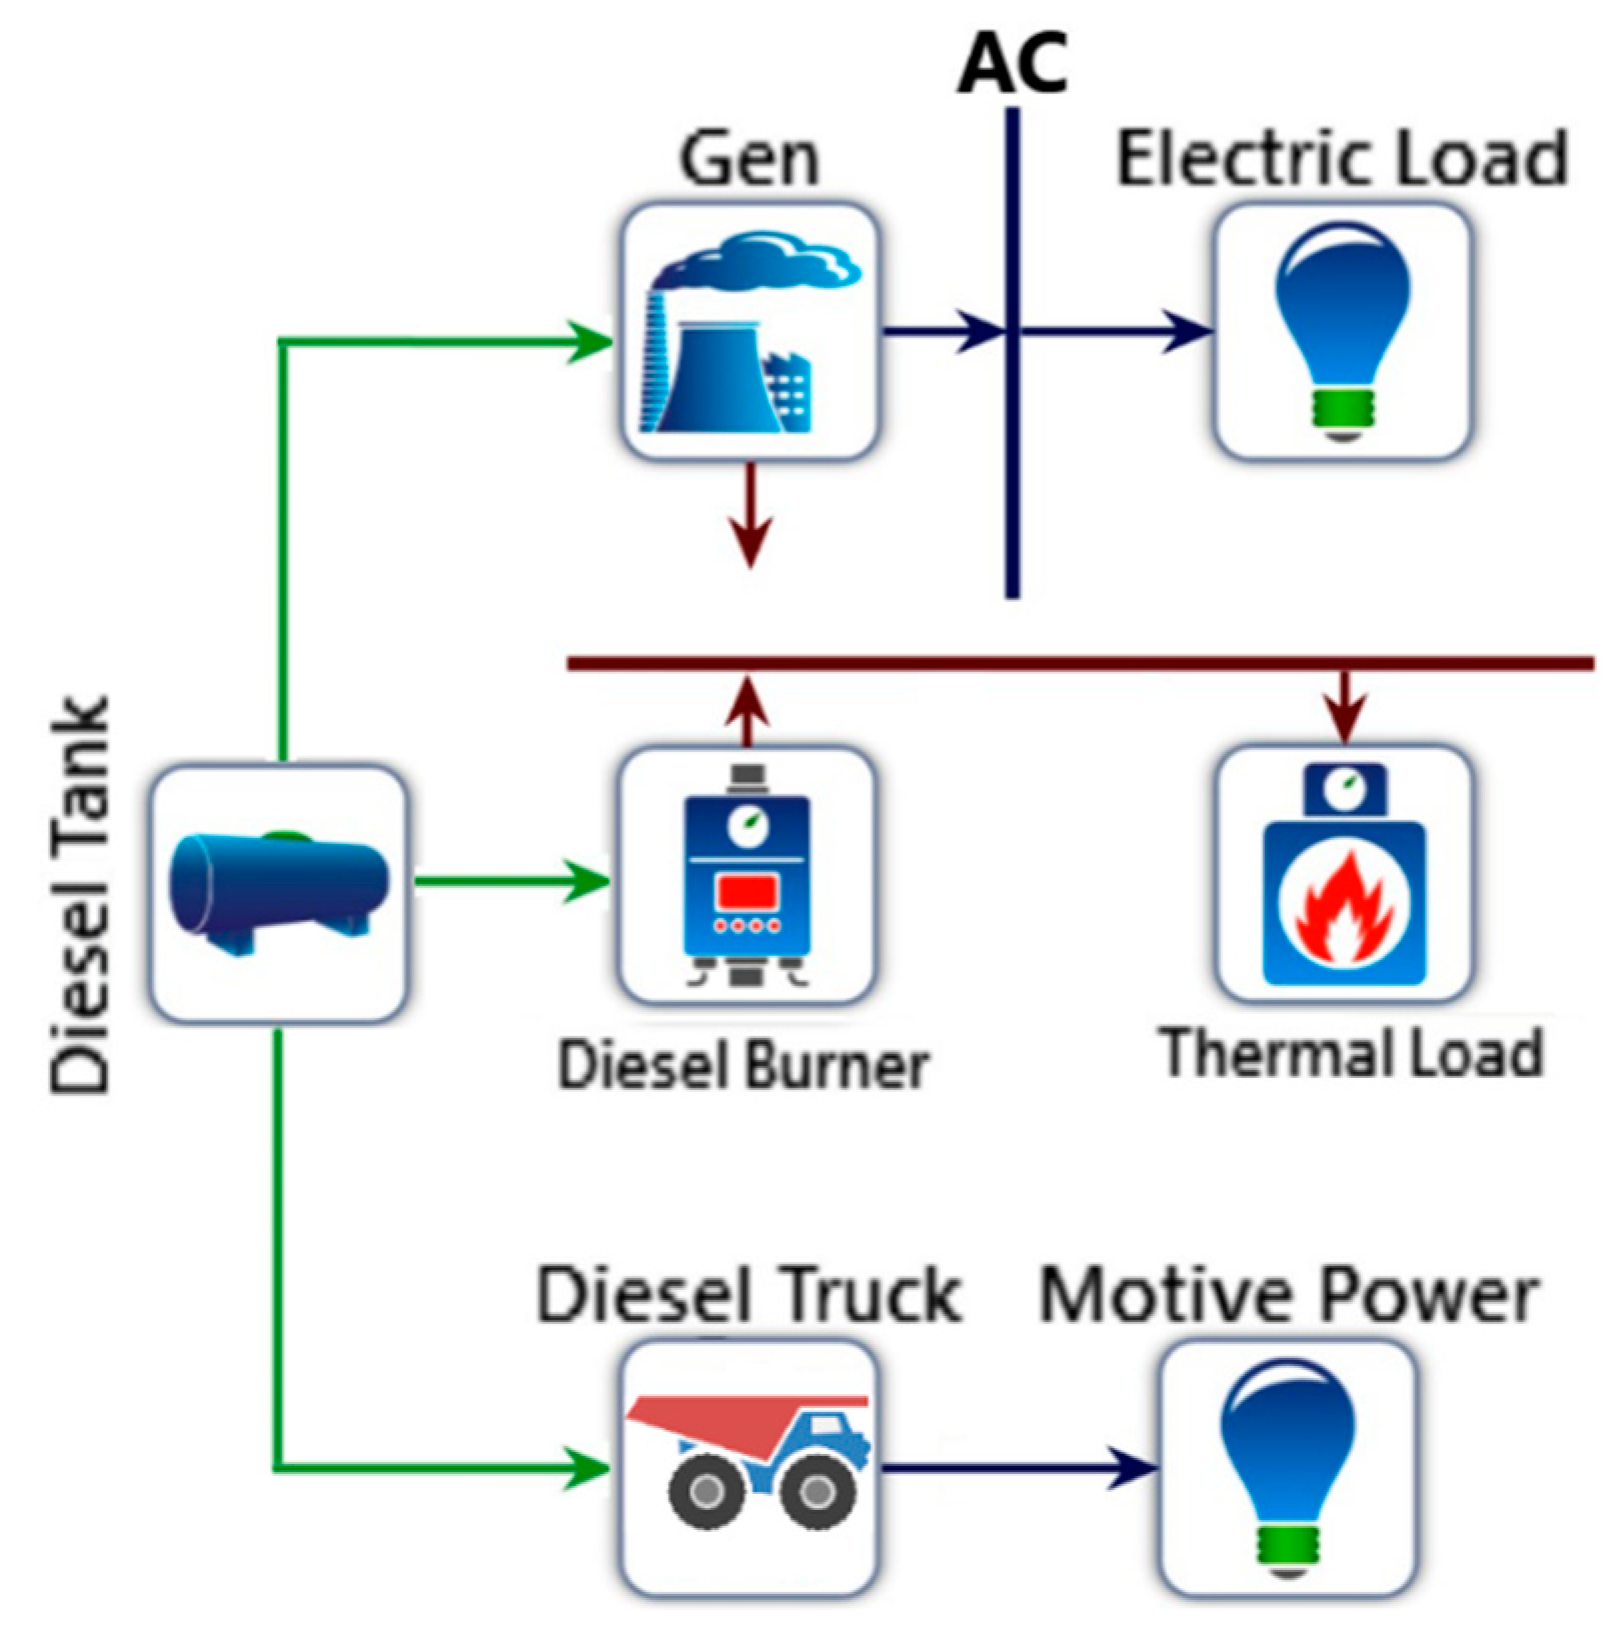
2.1. Conventional Remote Mine Energy System
Greenhouse Gases Emission
2.2. Renewable Energy System Configuration
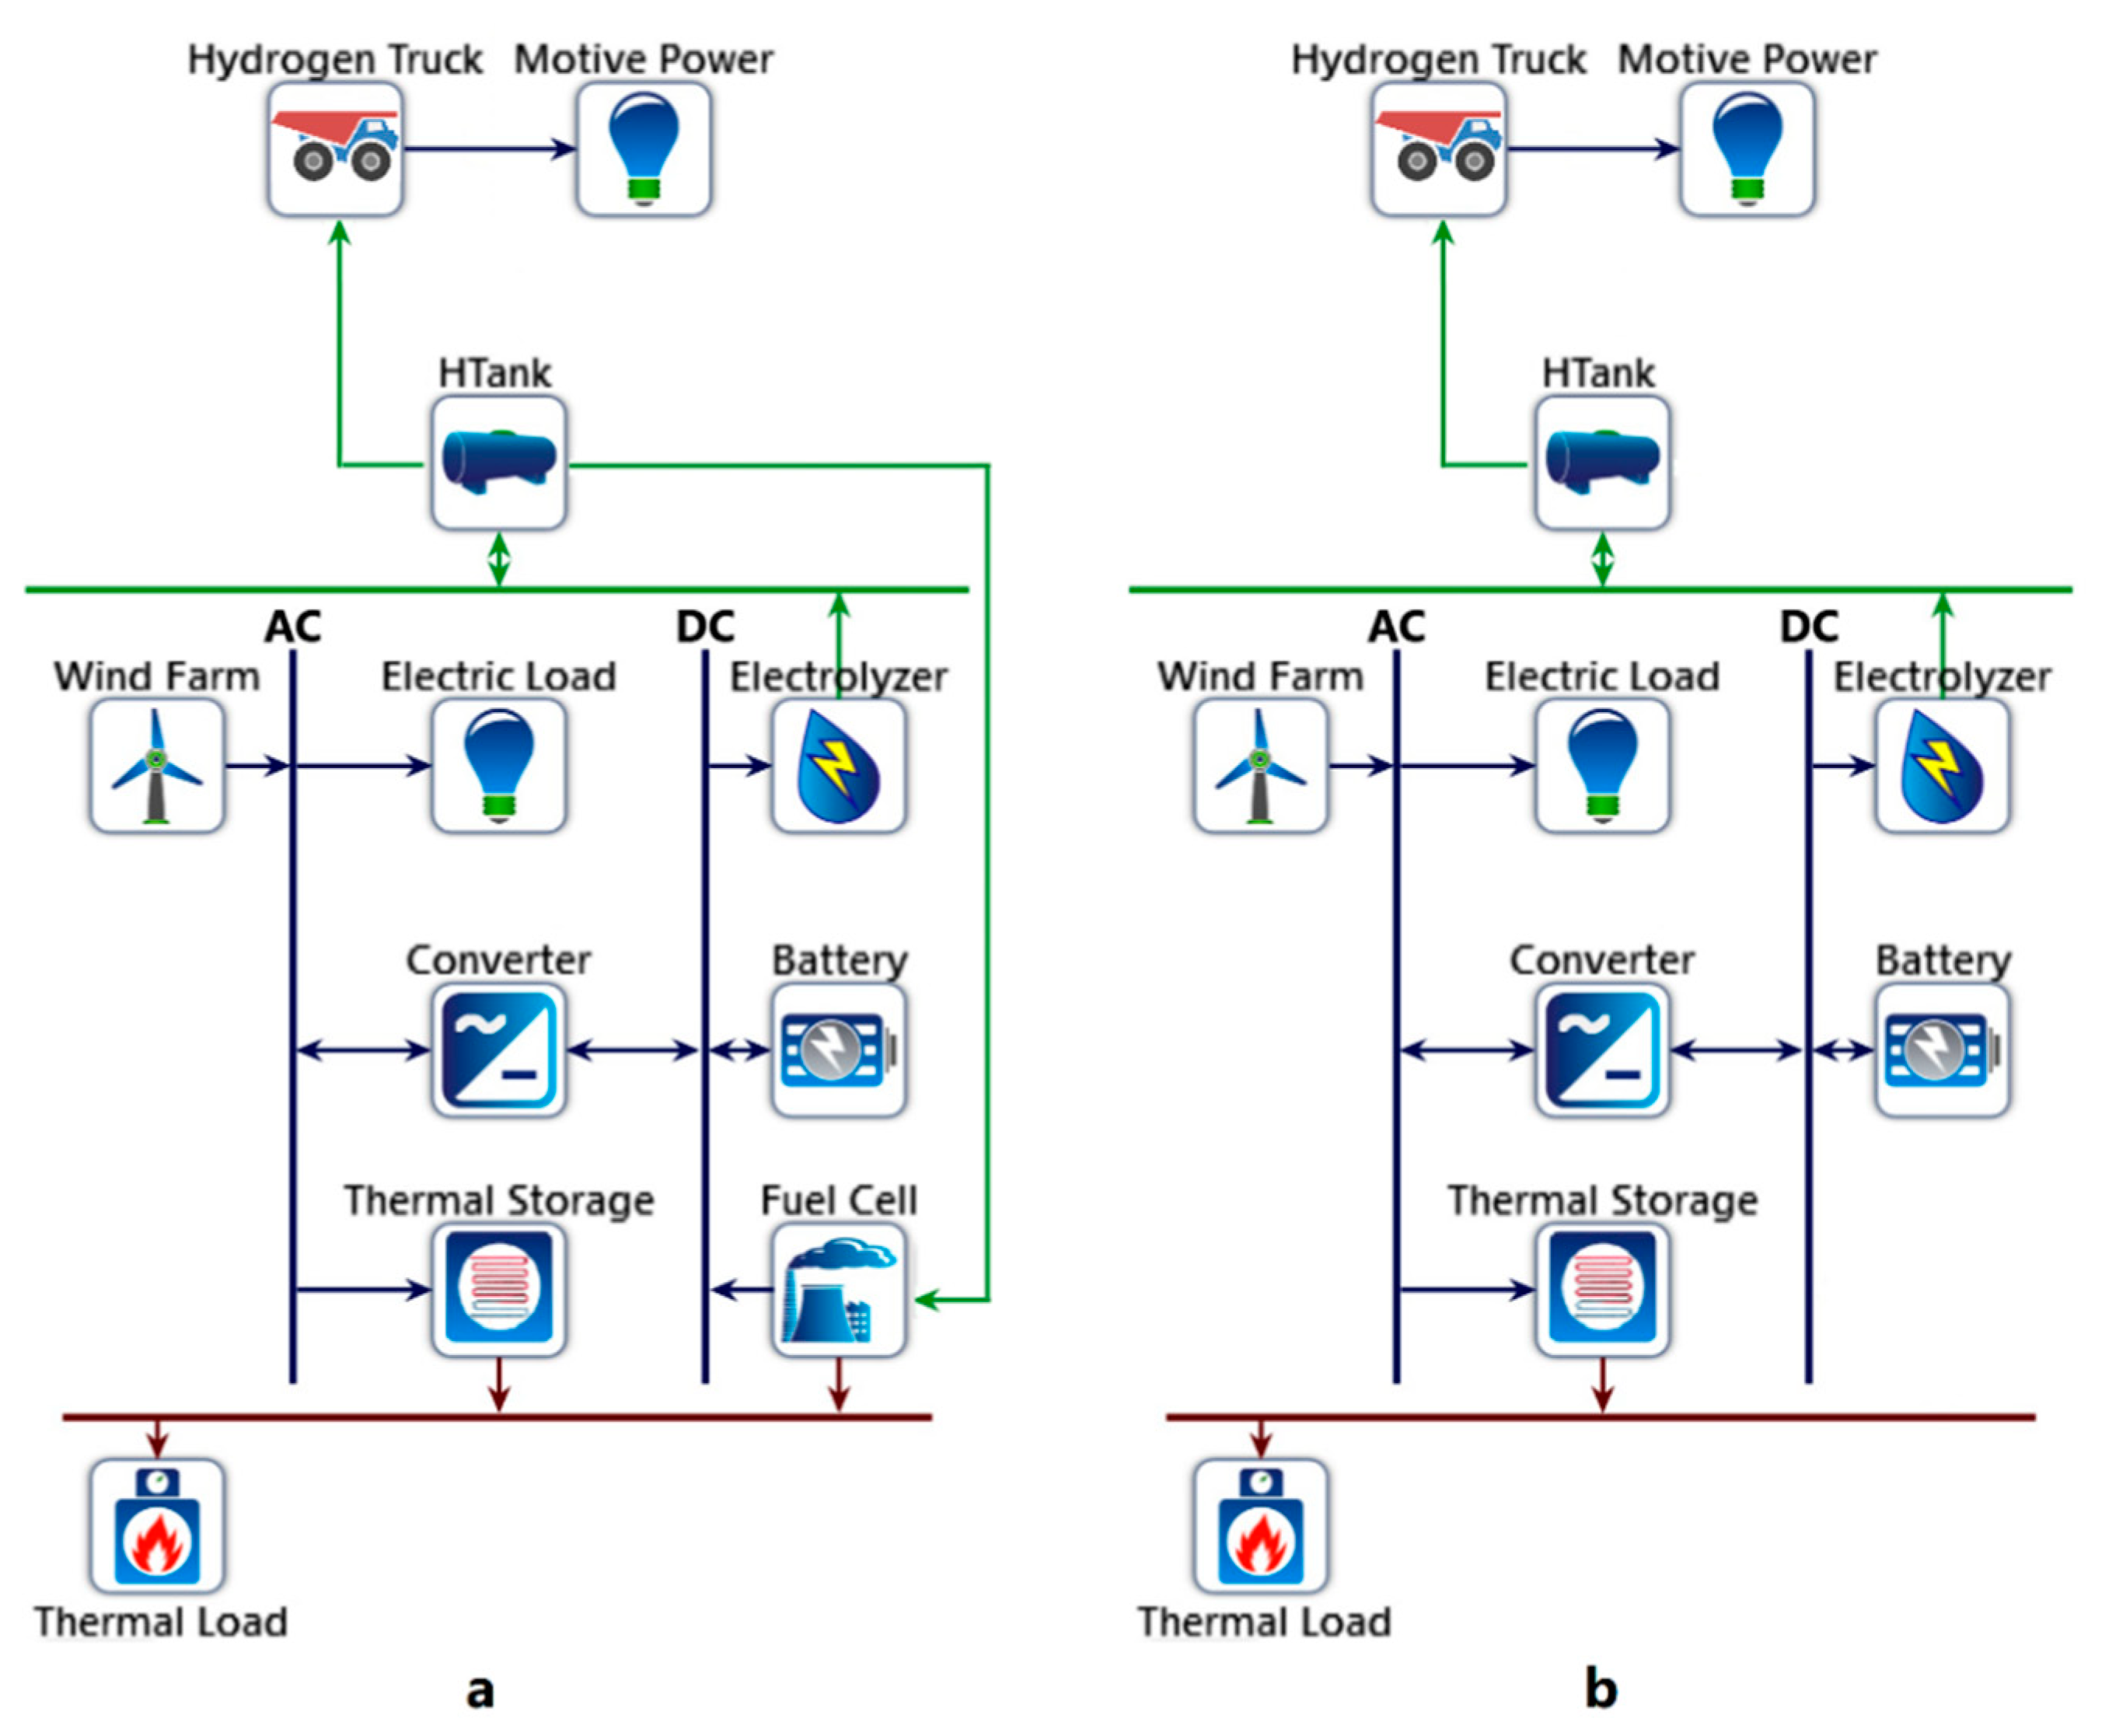
- Figure 3a represents the battery–fuel cell–hydrogen truck system (B/FC/HT). The wind farm is connected to AC bus to feed the electrical demand of the mine; the surplus power from wind farm is stored in battery banks or fed to the electrolyzer to generate hydrogen. Hydrogen is stored in the hydrogen tanks which feed the hydrogen trucks for haulage purposes and fuel cells to cover the power shortages to supply 100% of the load. Also, to supply the heating demand of the mine, thermal energy is stored in the thermal storage system using the surplus of the wind farm during low heat demand season, and it is used when the heating demand is peaked. Note that the thermal storage system is embedded in all of the configurations.
- Figure 3b illustrates the battery–hydrogen truck system (B/HT) configuration. In this system, the power shortage is covered by battery bank and there is no need for fuel cell; however, electrolyzers use surplus wind power to produce hydrogen which will be stored and used in hydrogen tanks.
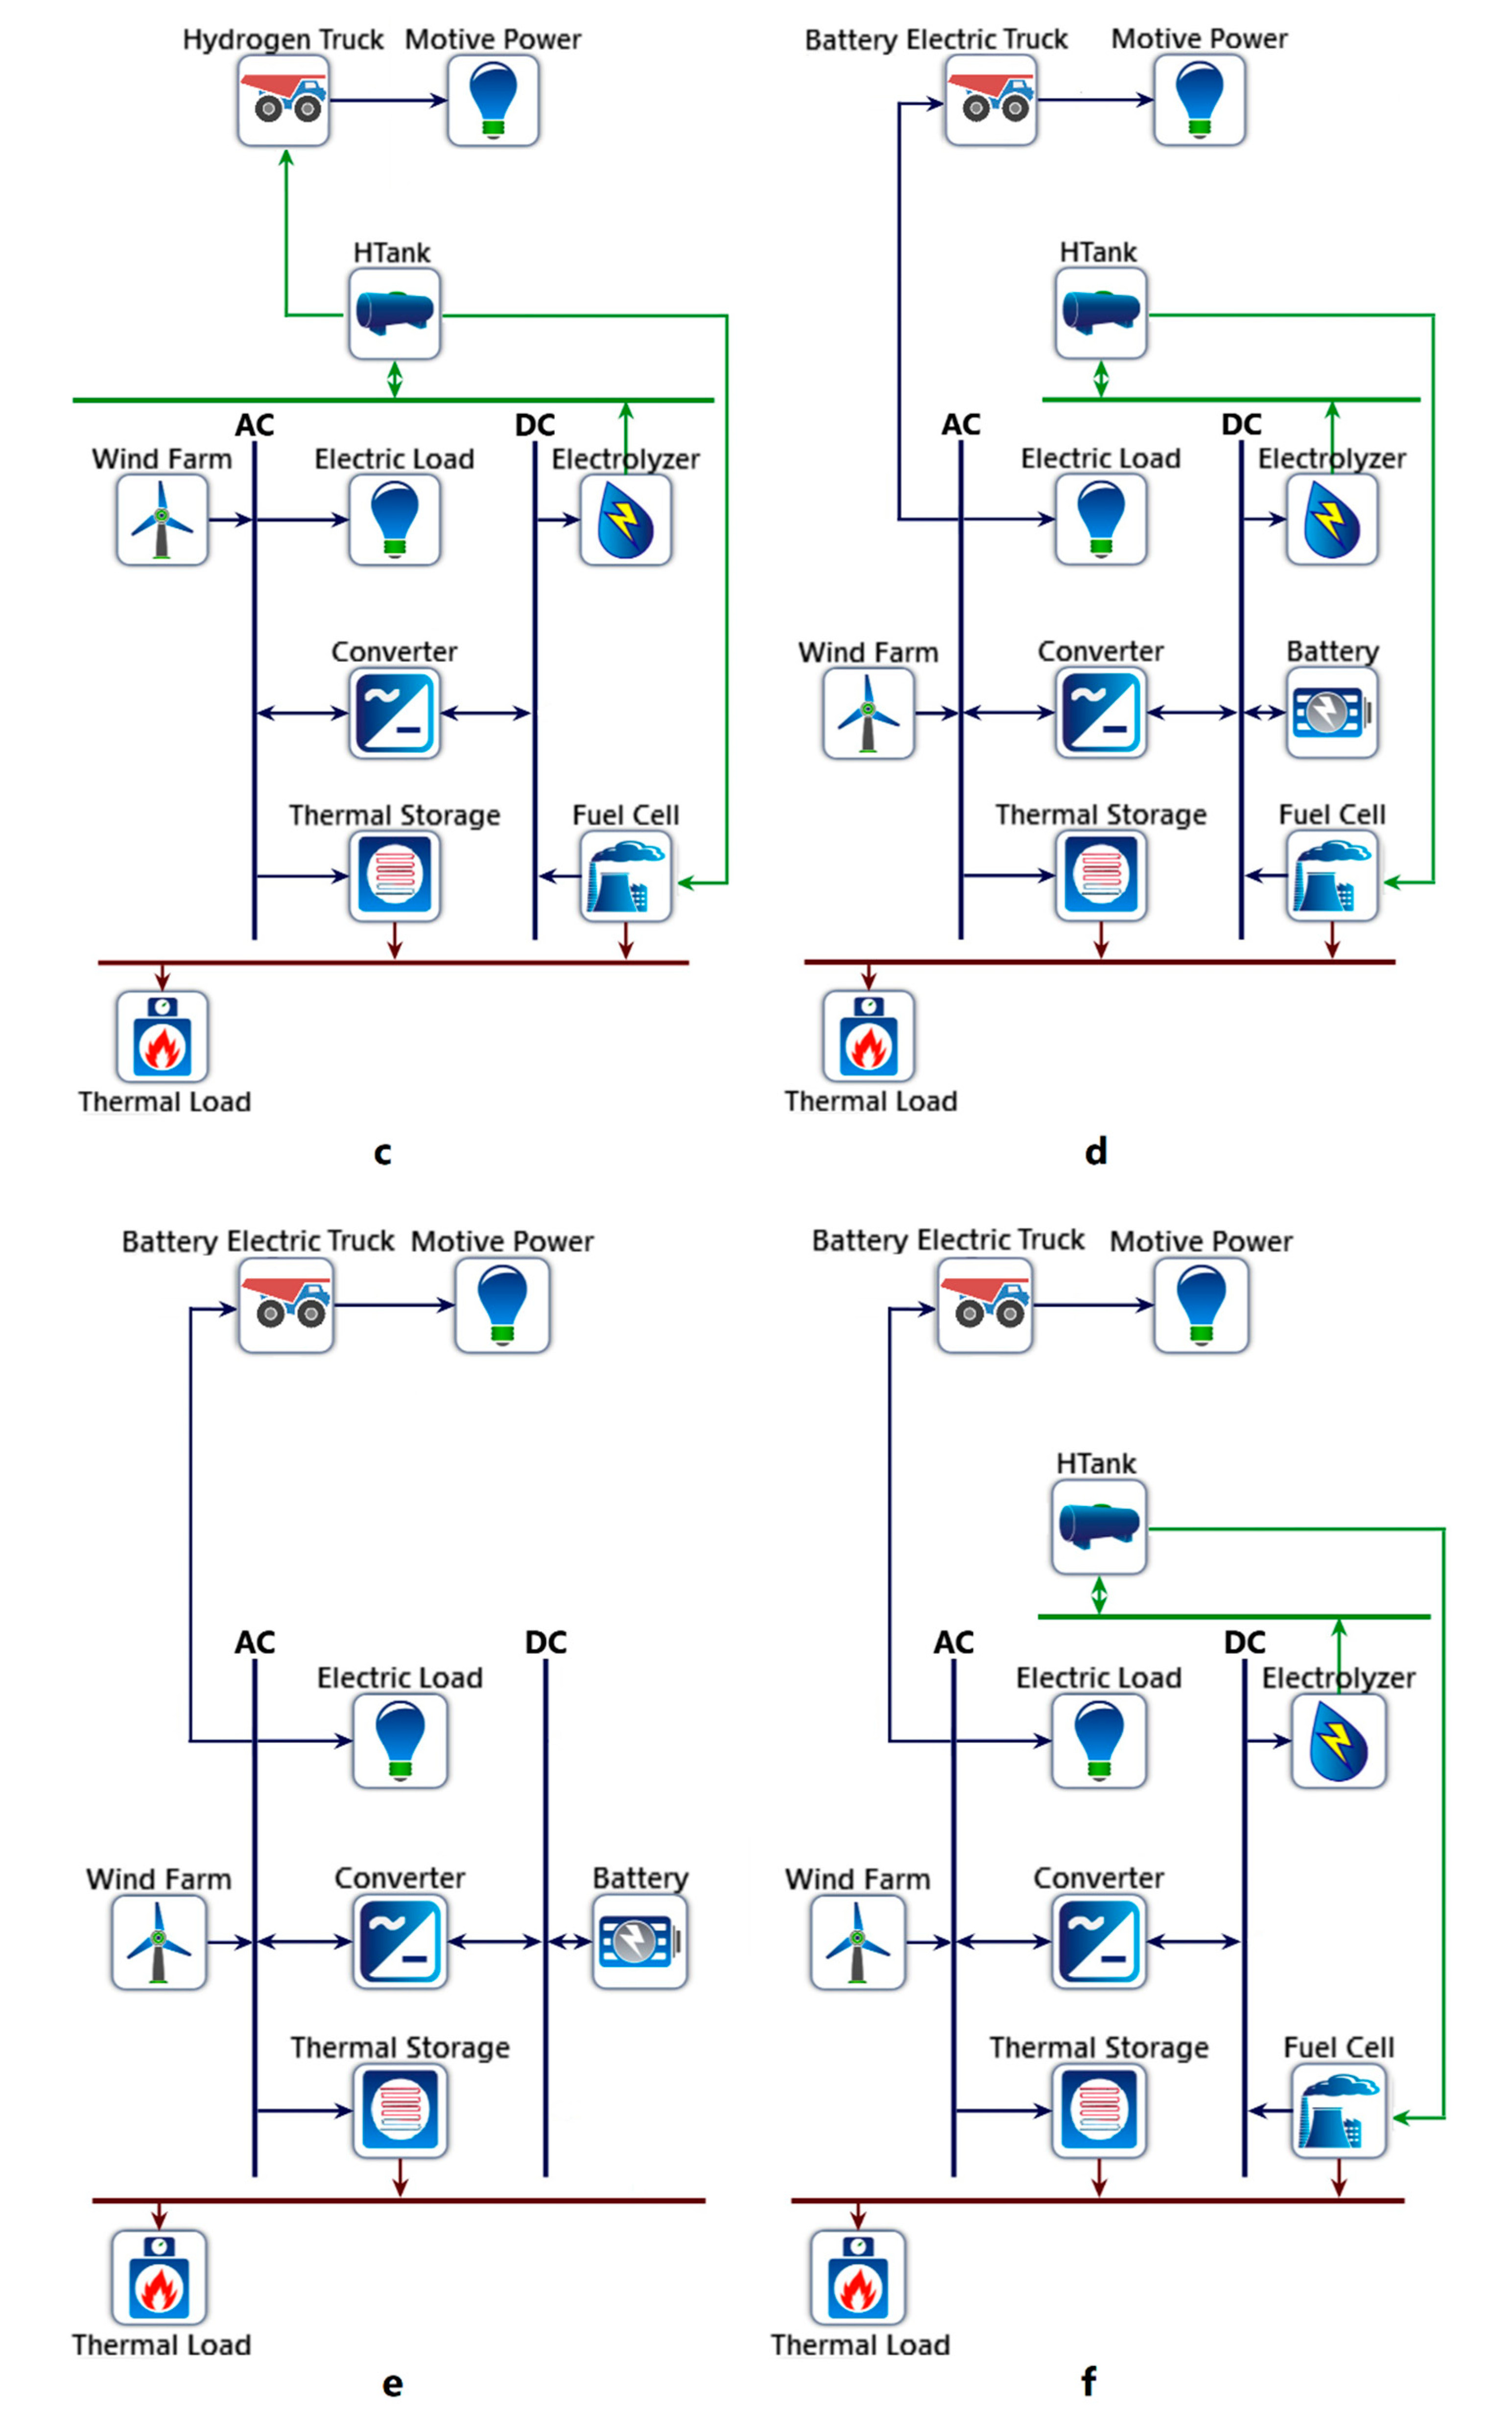
- Figure 3c is the fuel cell–hydrogen truck system (FC/HT). In this case, all the power shortages are supplied by fuel cells, and there is no need for battery banks.
- The configuration of battery–fuel cell–battery electric truck system (B/FC/BET) is shown in Figure 3d. In this design, the electric load needs of the mine and the BET are both covered by hybridization of wind turbine, battery, and fuel cell. Also, to avoid equipment downtime (when the battery is under charge), battery swapping will be necessary, which means that for every truck, there is a spare battery pack.
- Figure 3e represents the battery–battery electric truck system (B/BET). Wind turbine combined with battery banks supply the electric load and battery electric trucks power, and there is no need for electrolyzer, hydrogen tank, and fuel cell in this system.
- The last one is the fuel cell–battery electric truck system (FC/BET), which is shown in Figure 3f. The electric load and motive power are supplied with wind turbine and fuel cell system. There is no need for a battery bank in this system.
2.3. Renewable Energy System
2.3.1. Wind Turbine
2.3.2. Battery Bank
2.3.3. Electrolyzer
2.3.4. Fuel Cell
2.3.5. Thermal Storage System
2.4. Economic and Financial Calculations
2.5. Simulation and Optimization
3. Results
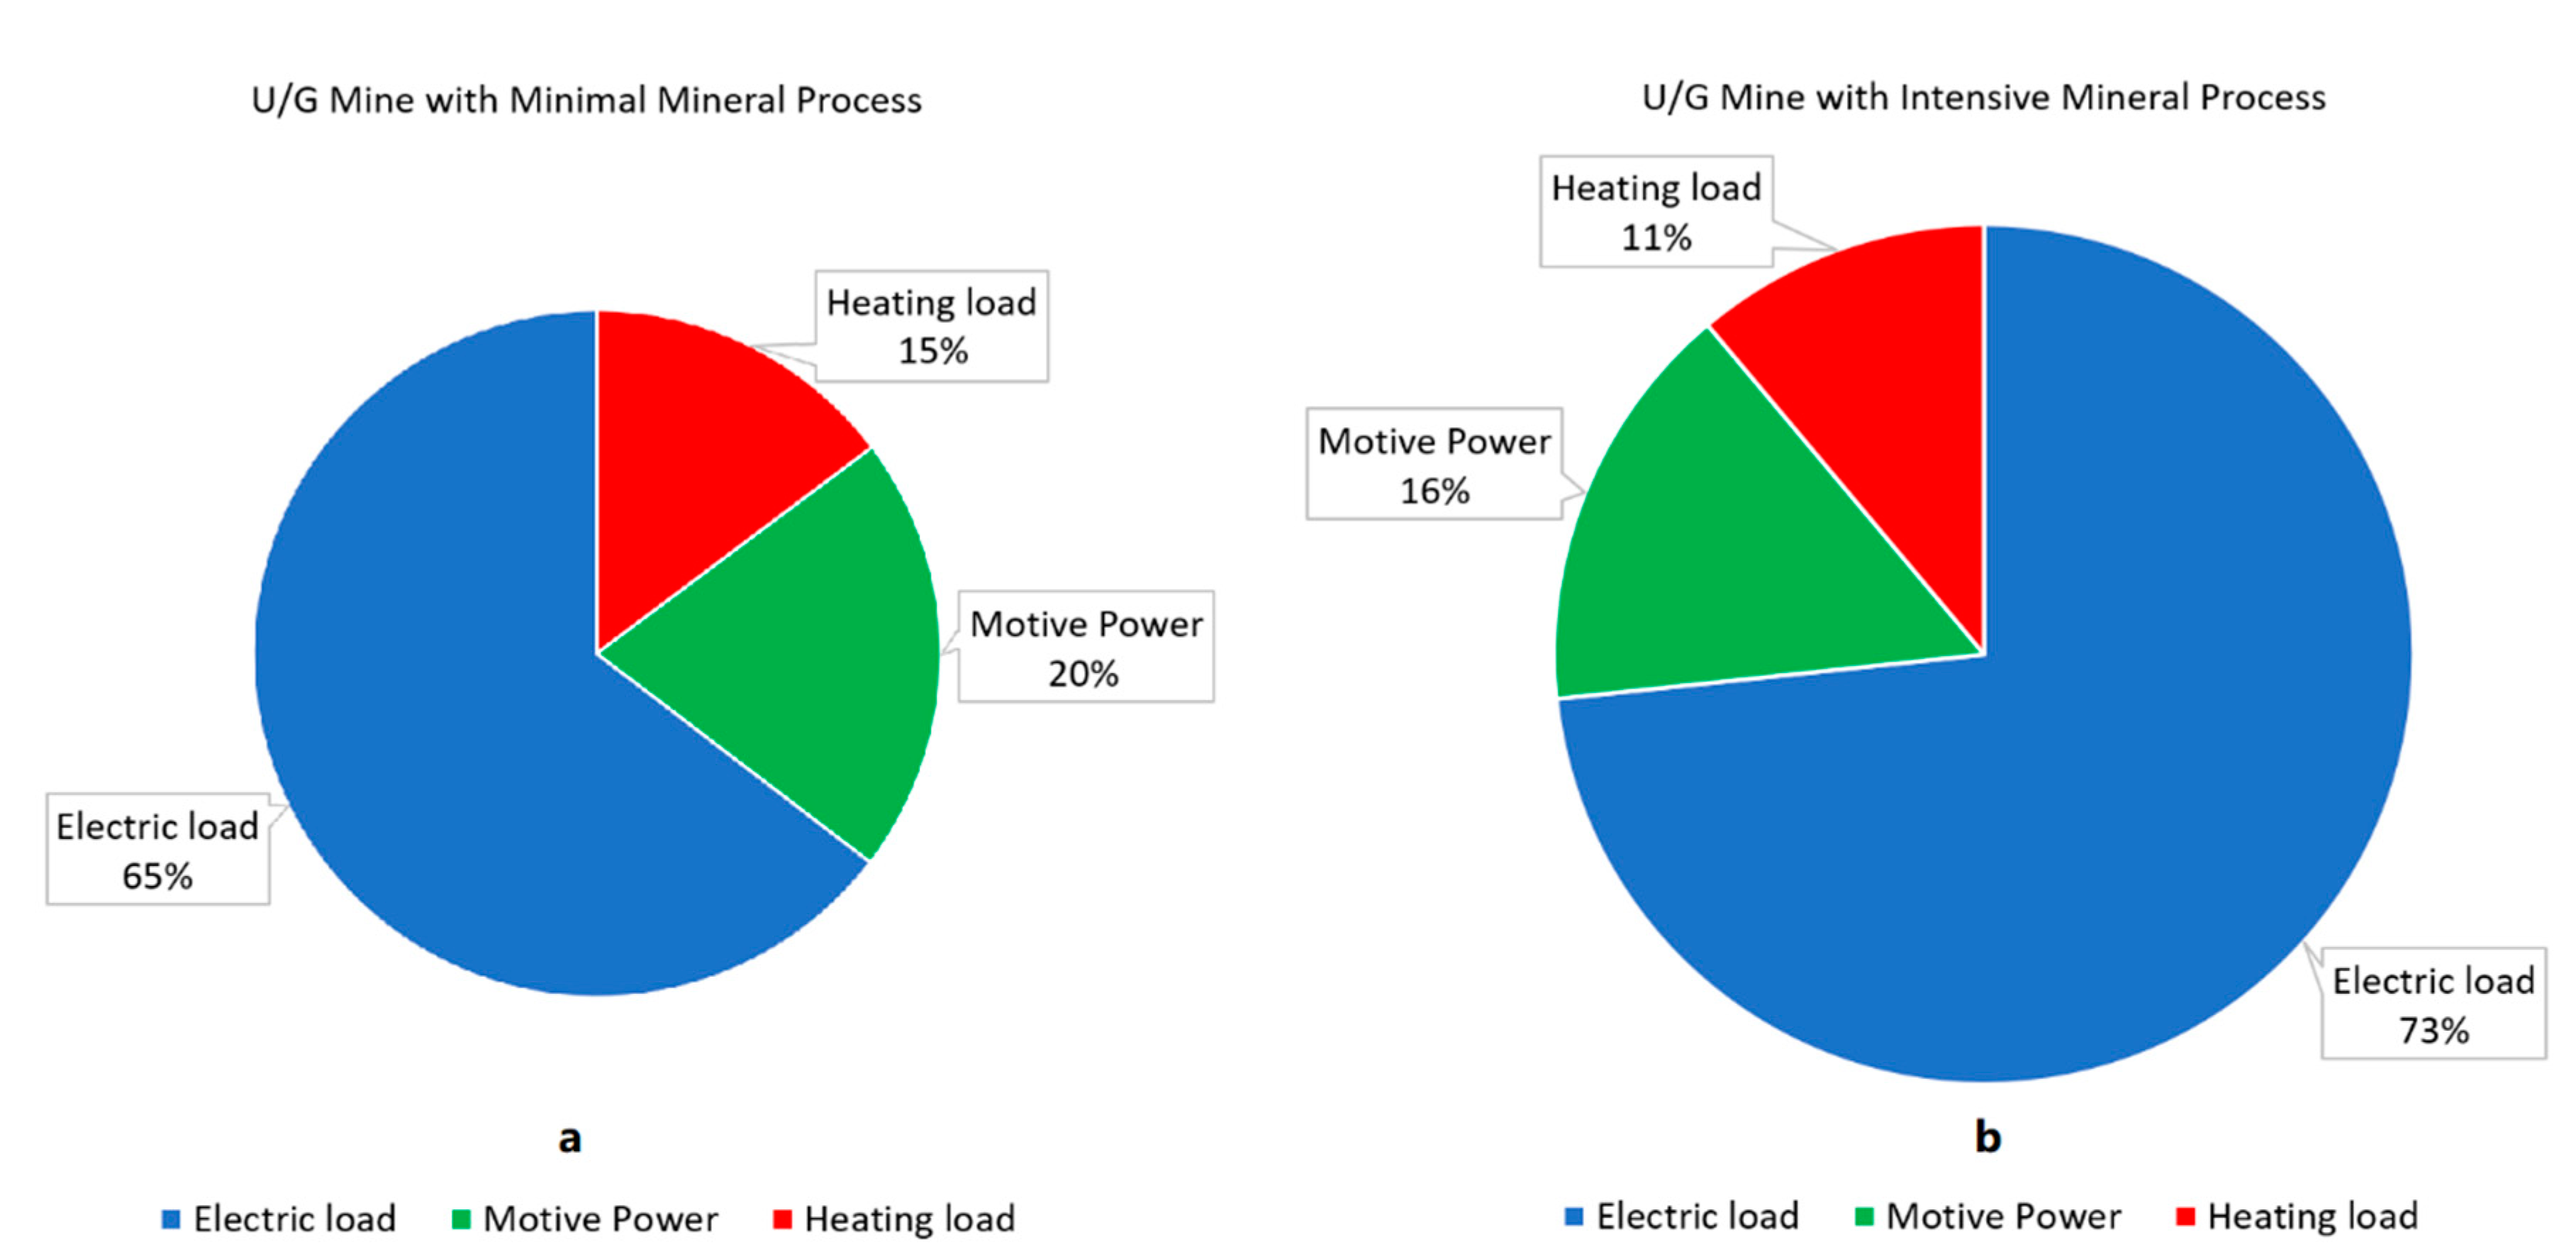
3.1. Case Study
3.2. Diesel-Based System Results
3.3. Renewable System Results
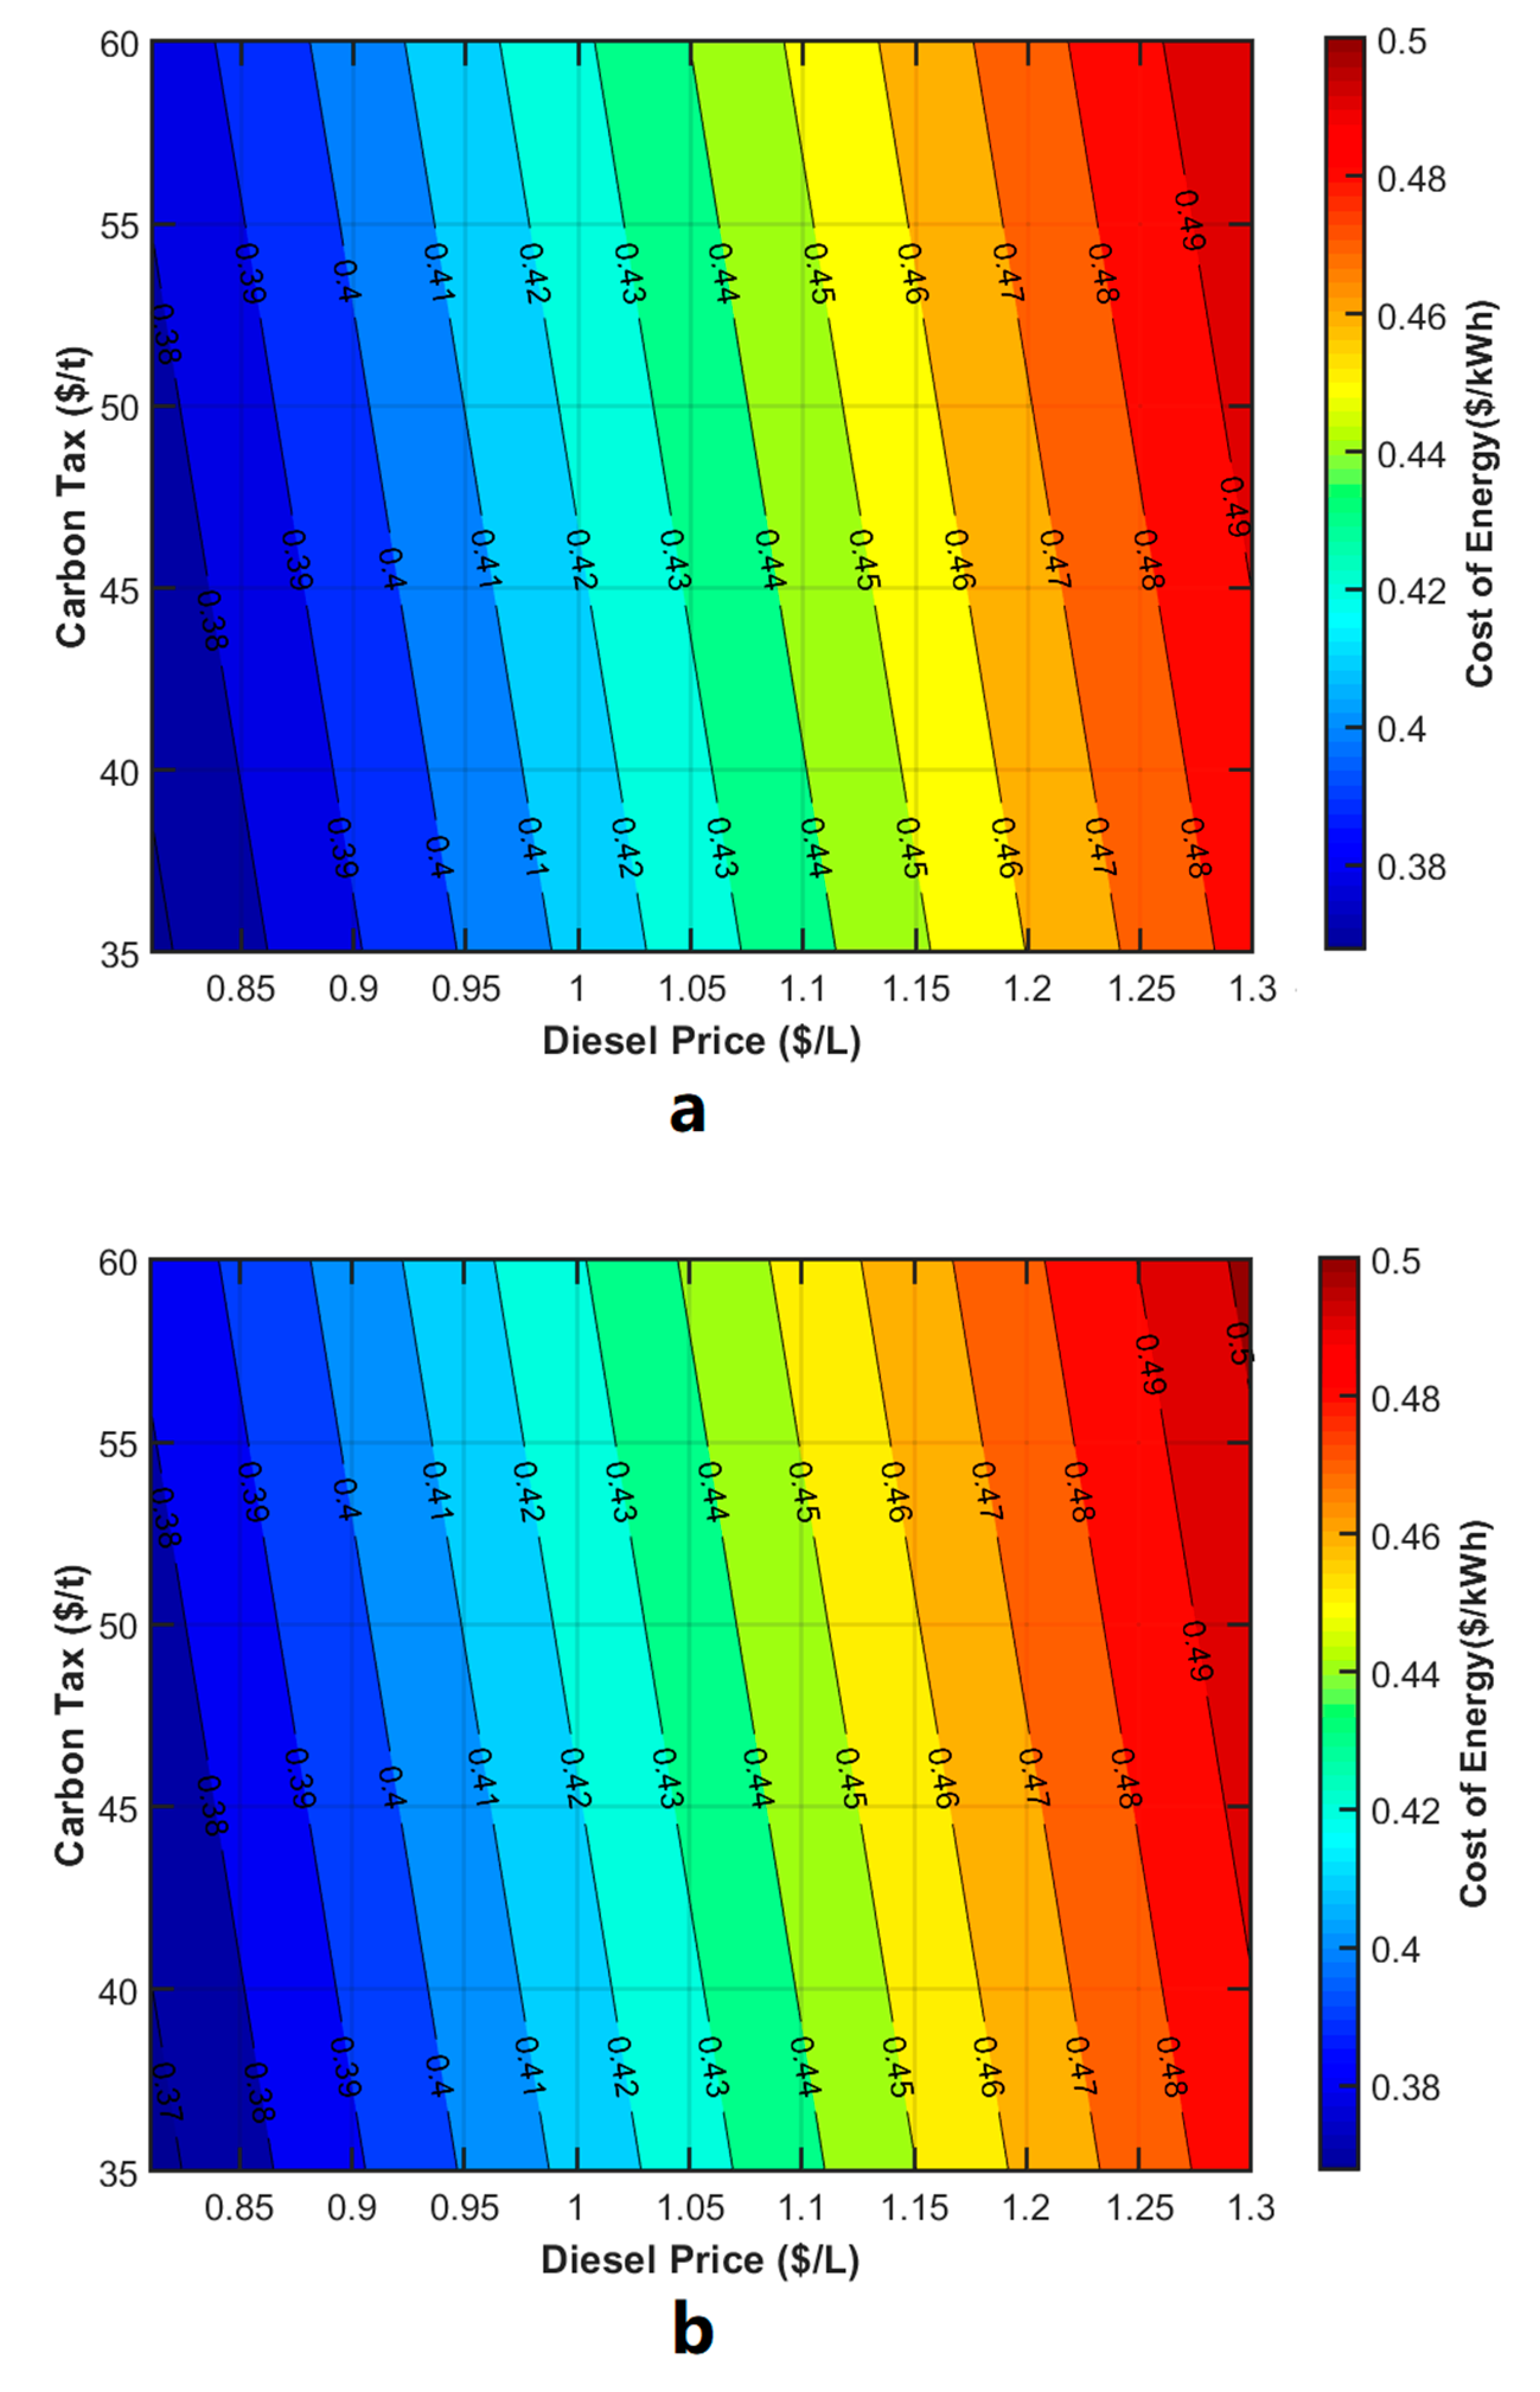
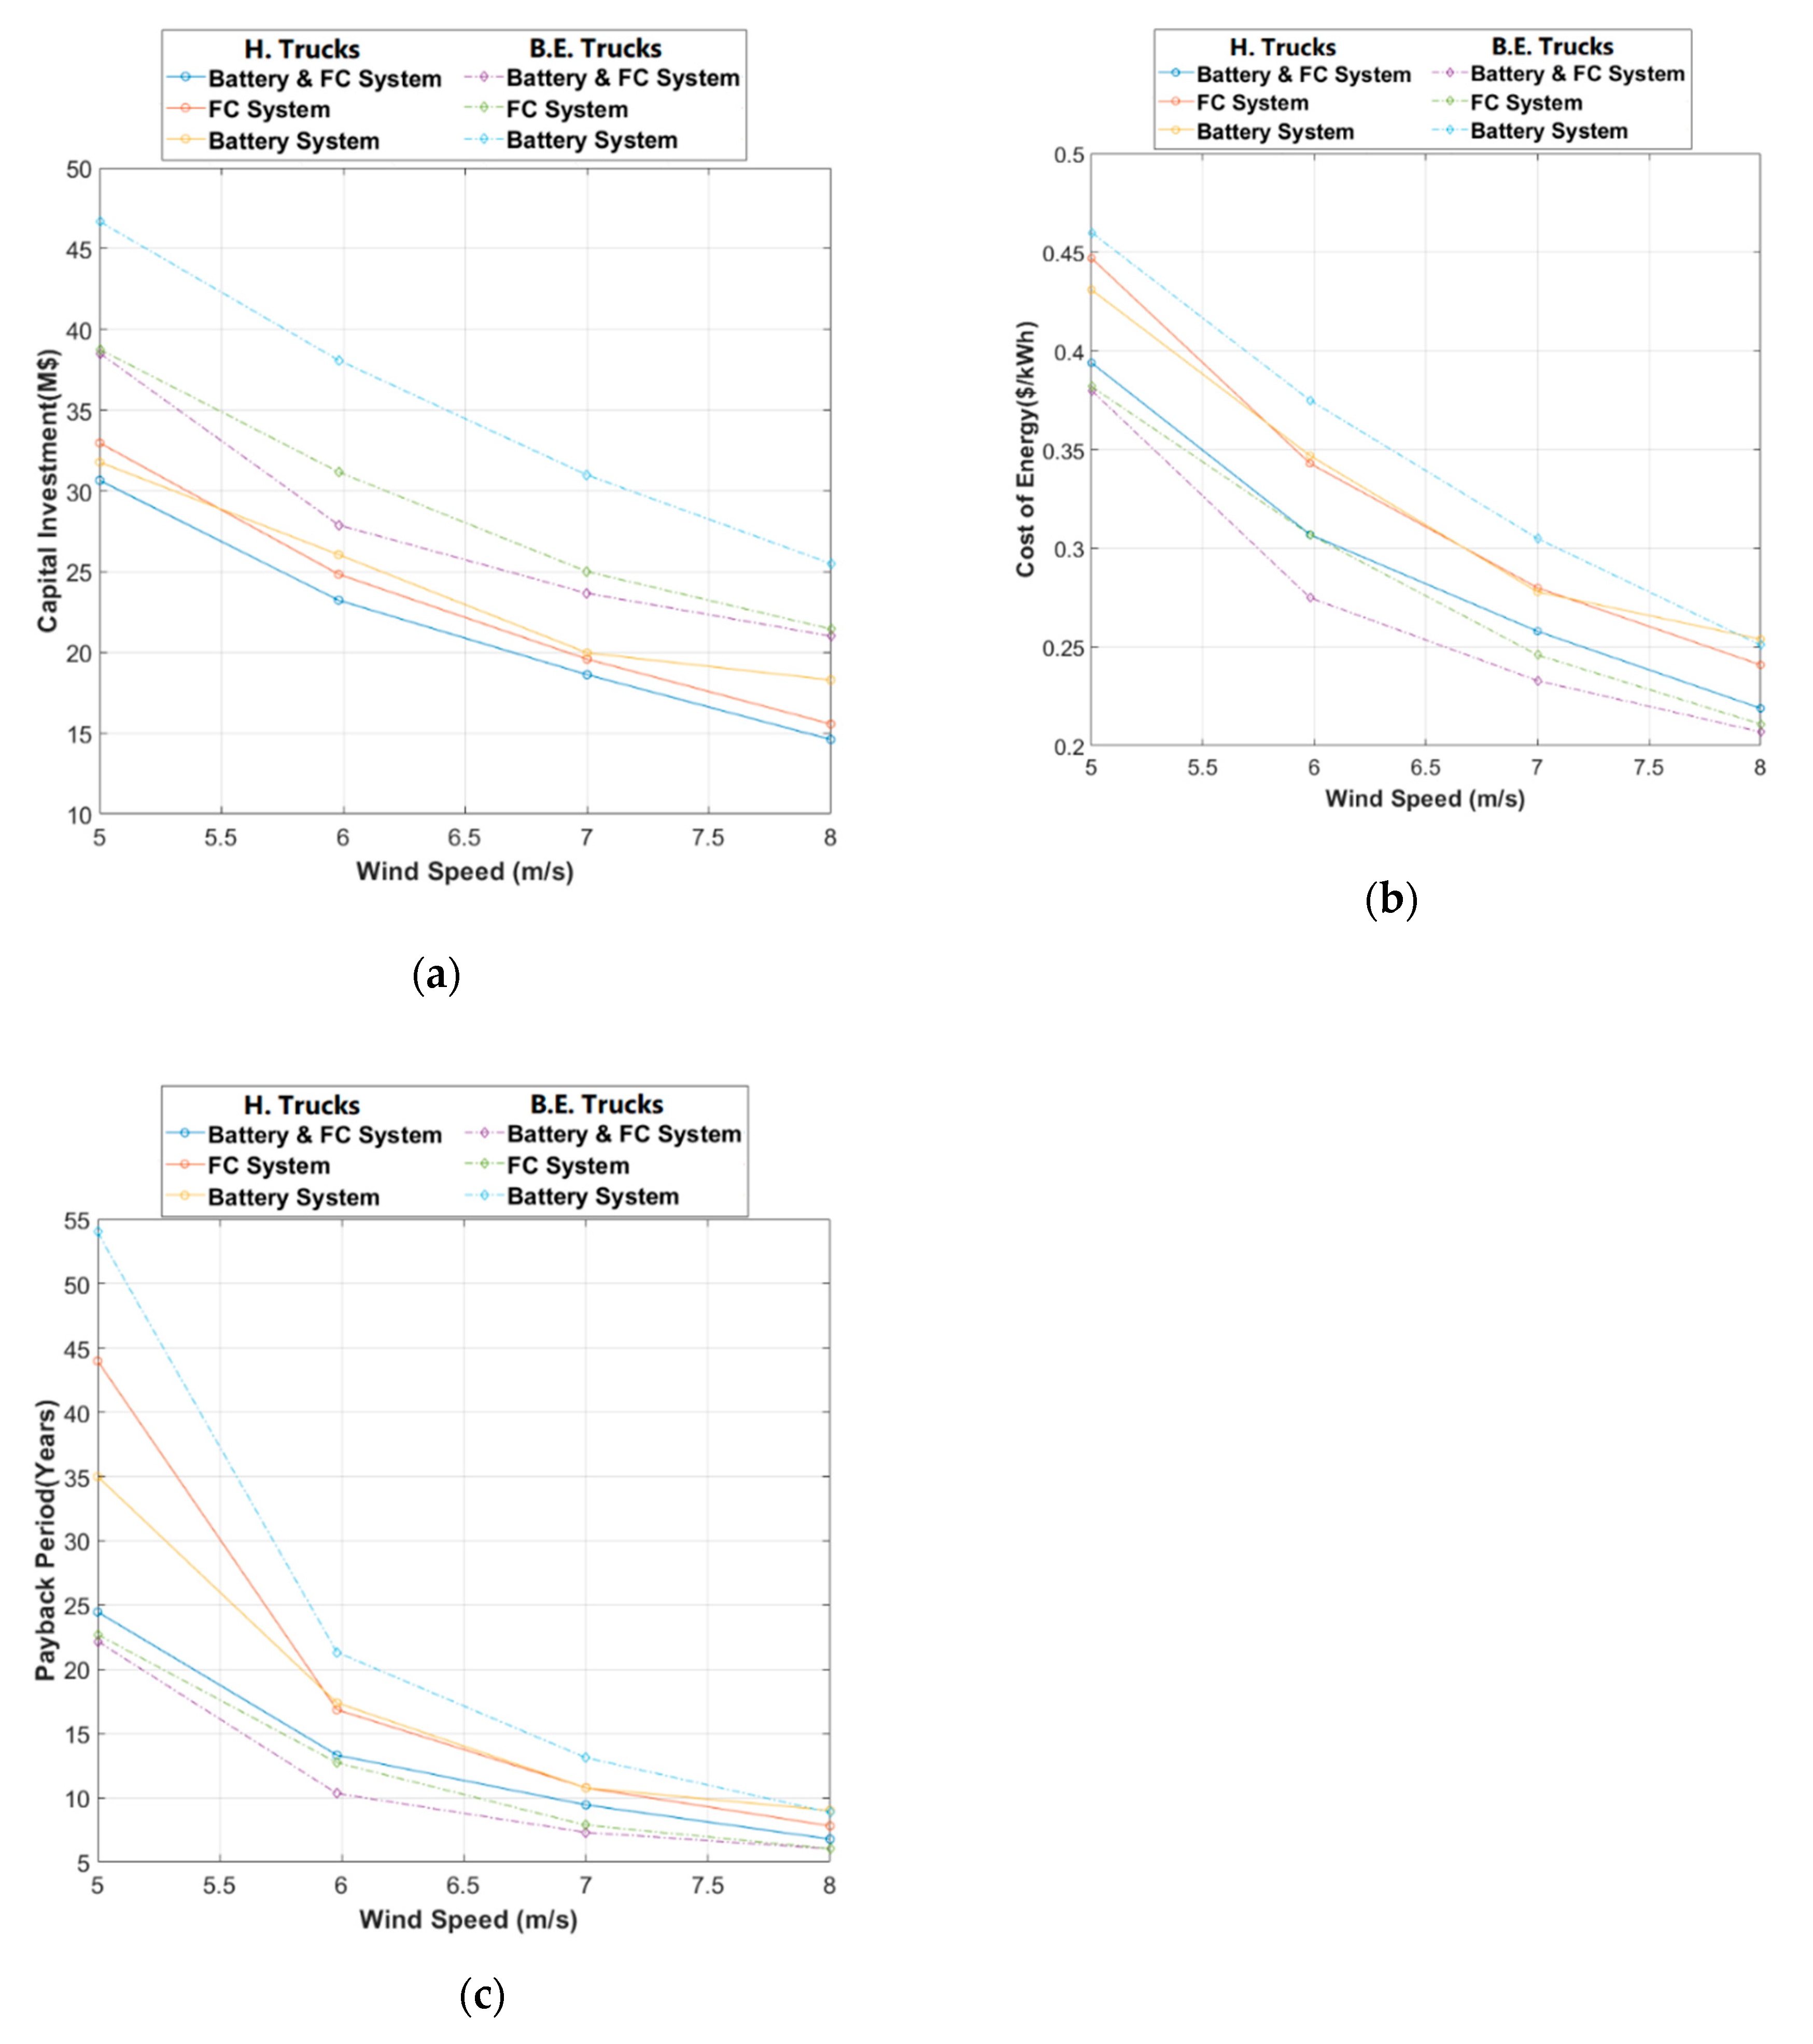
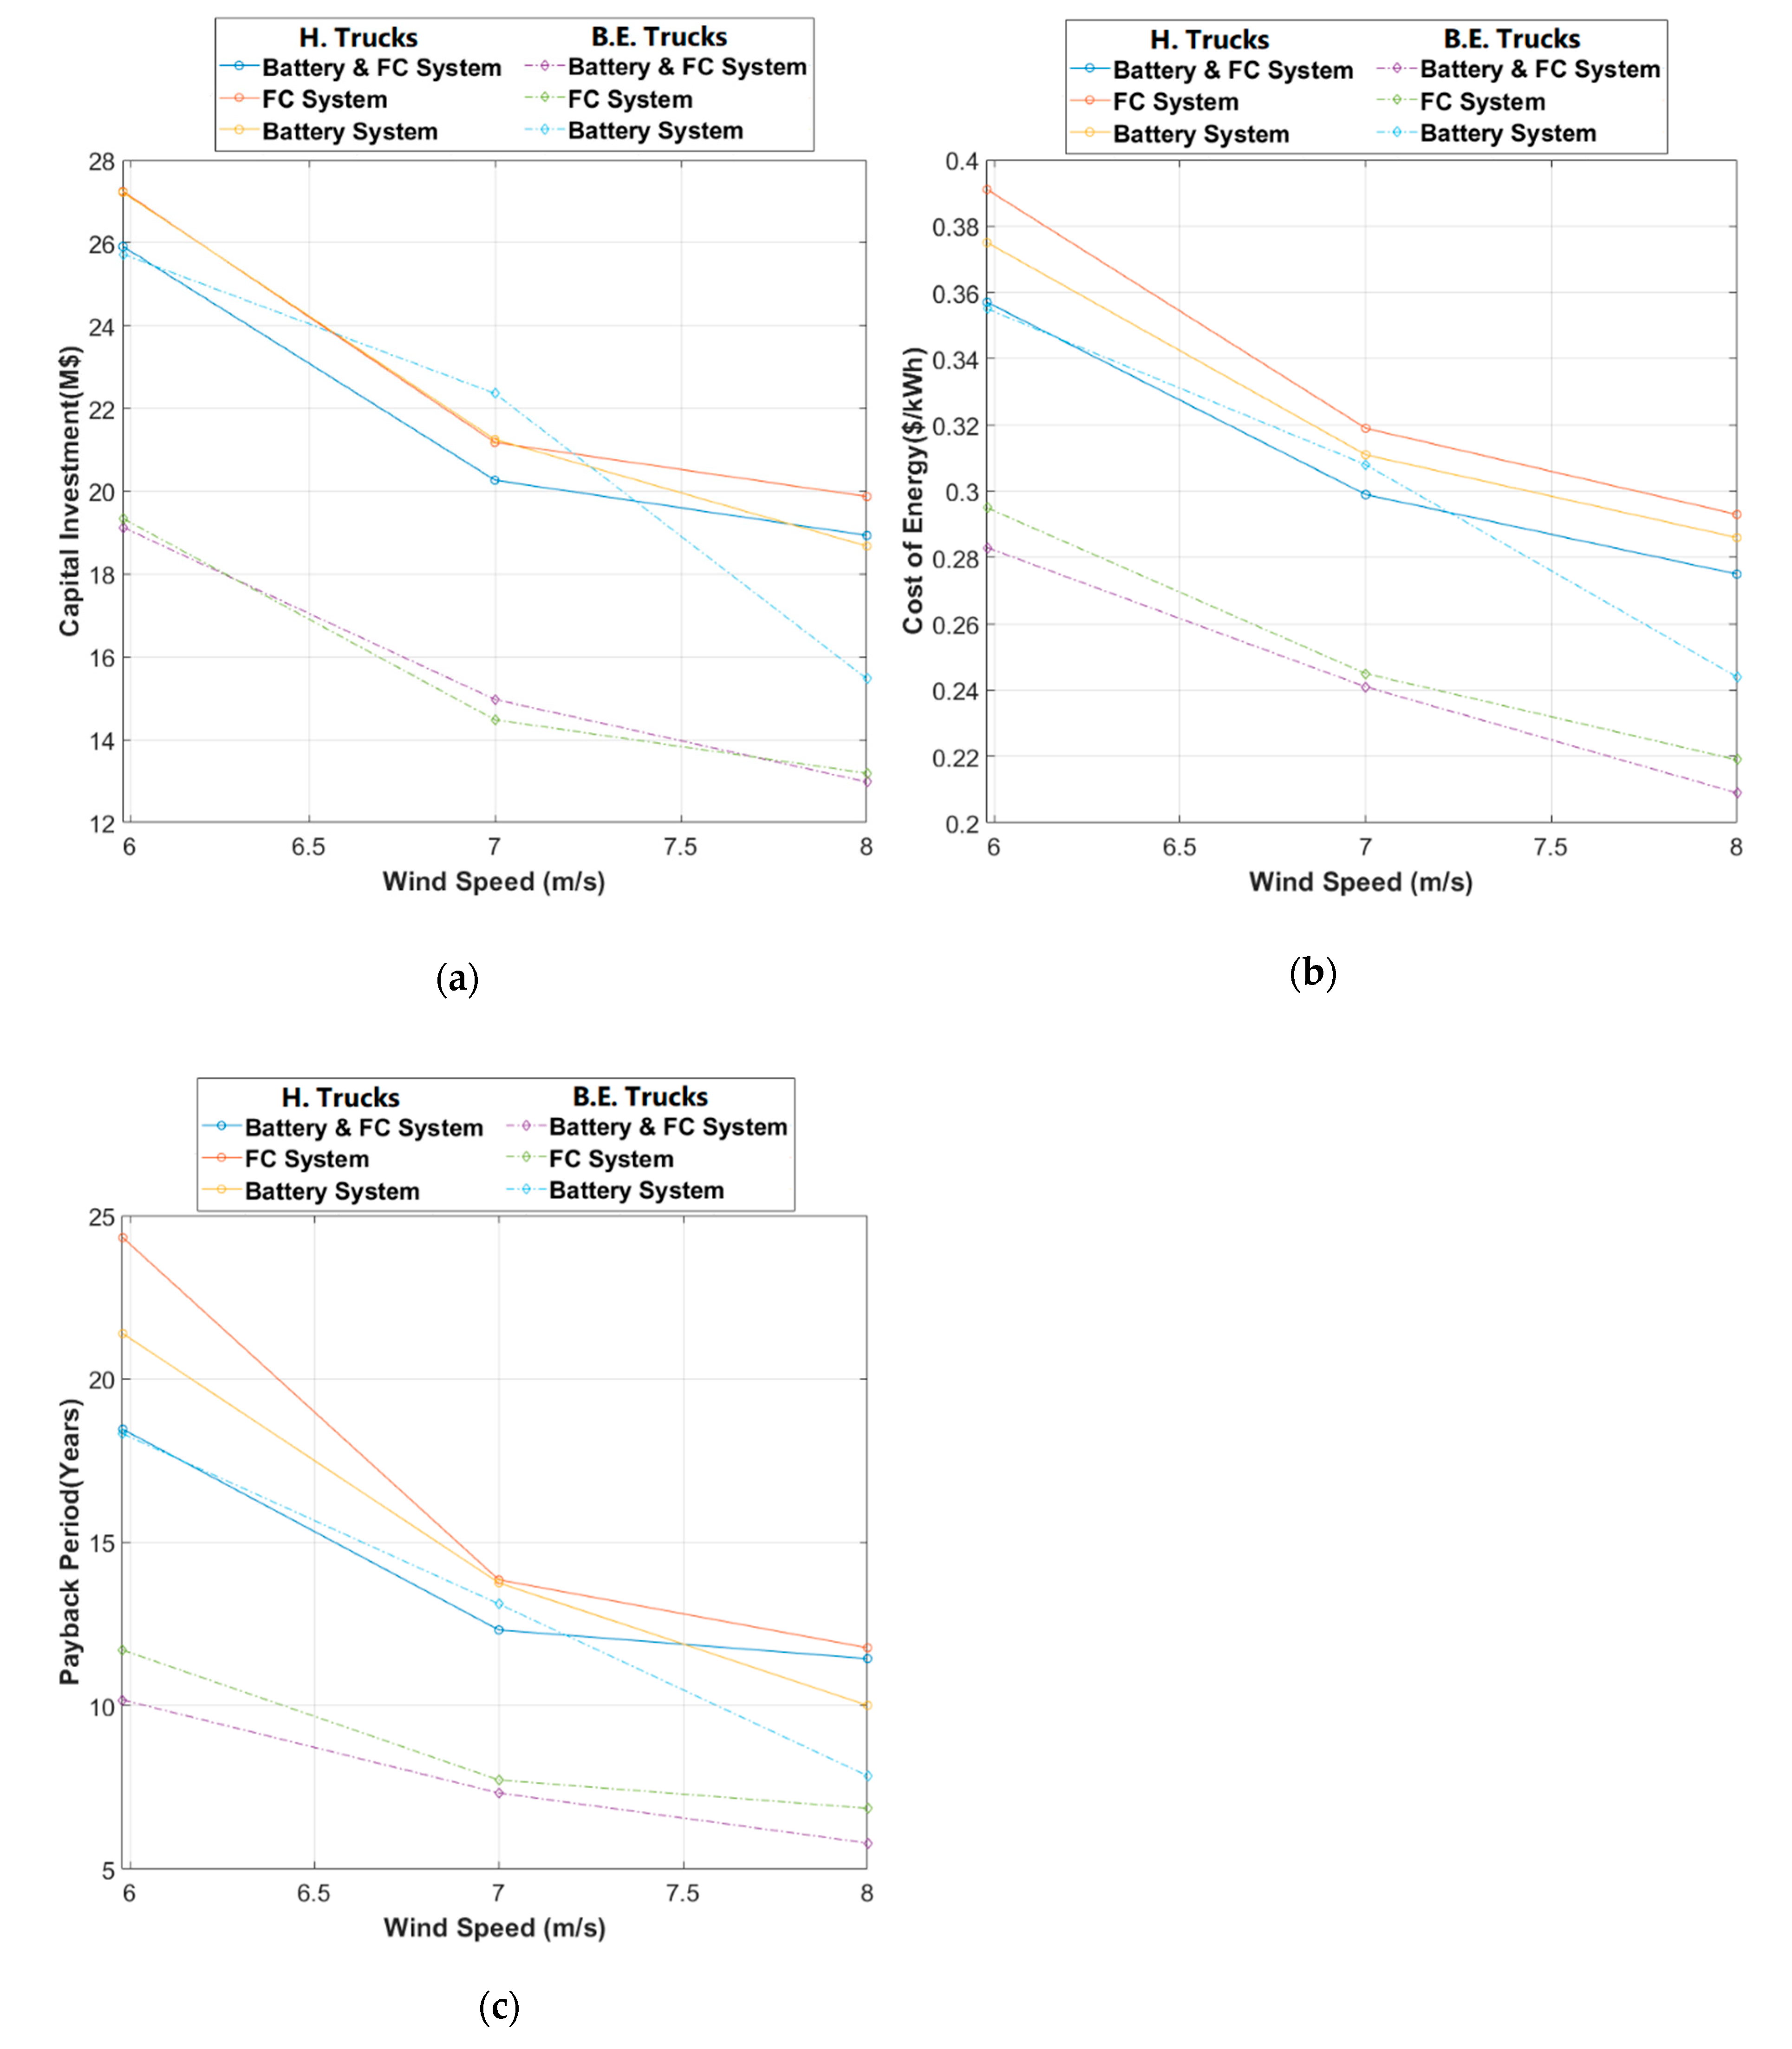
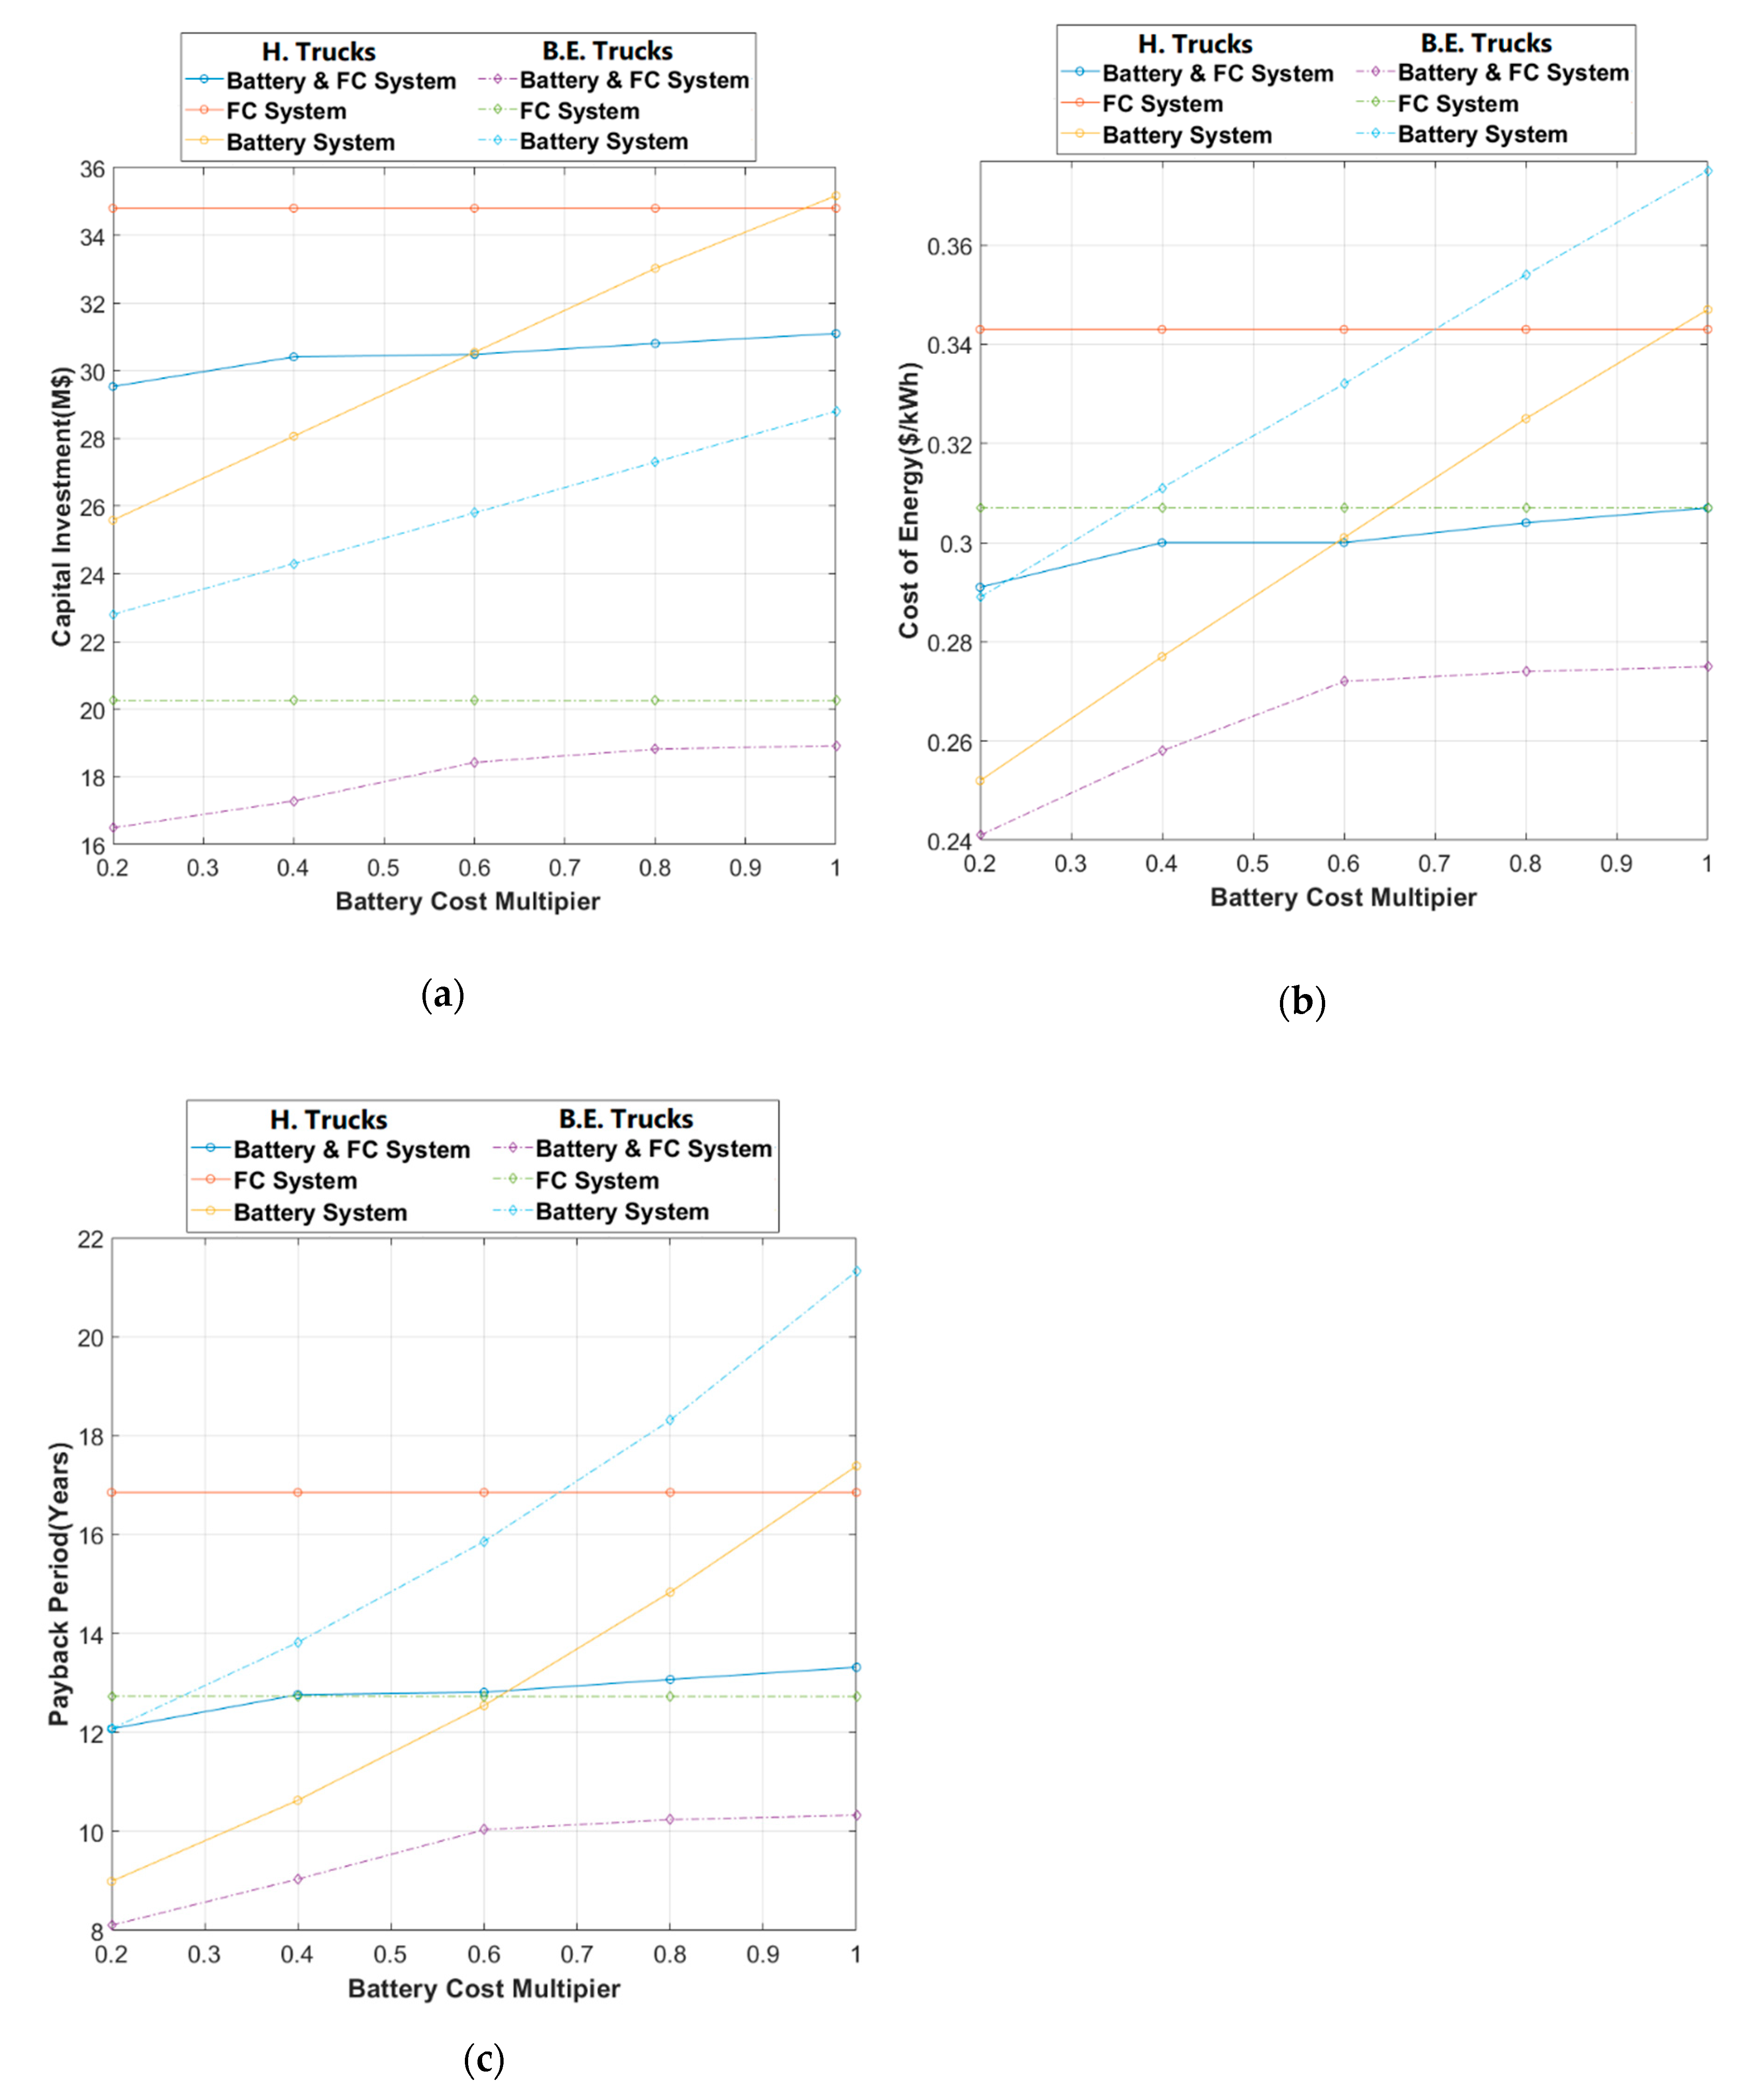
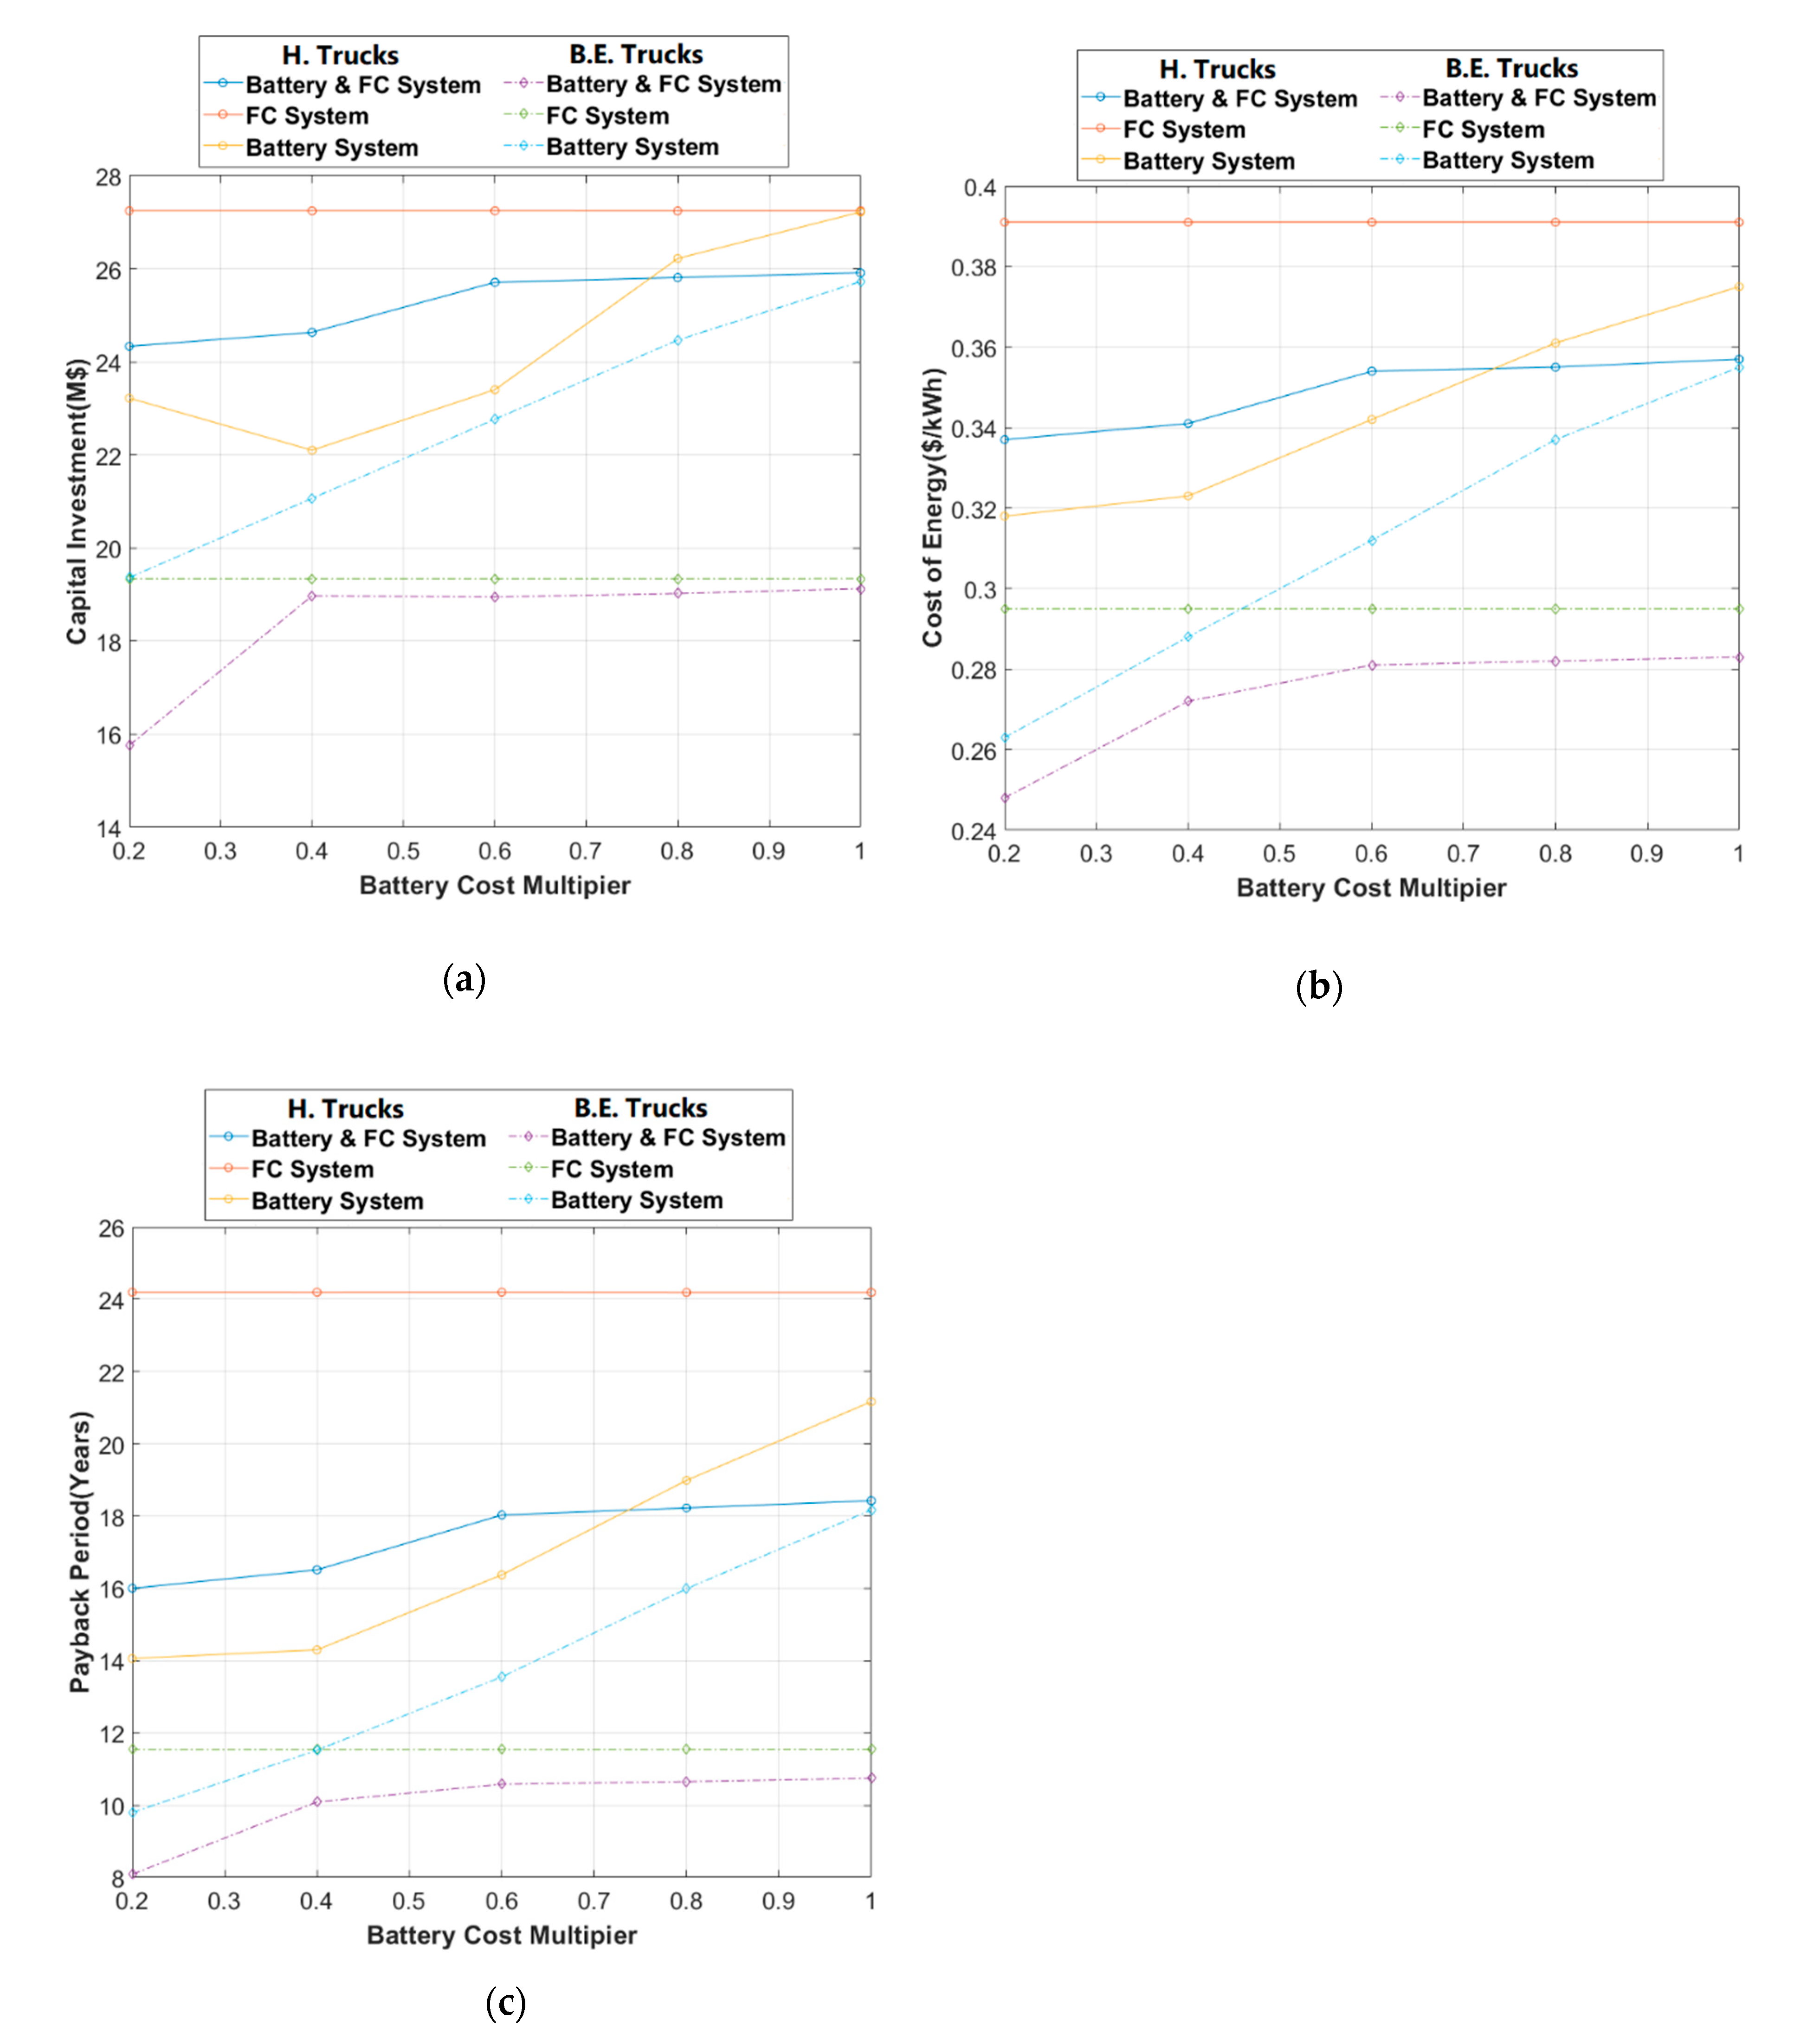
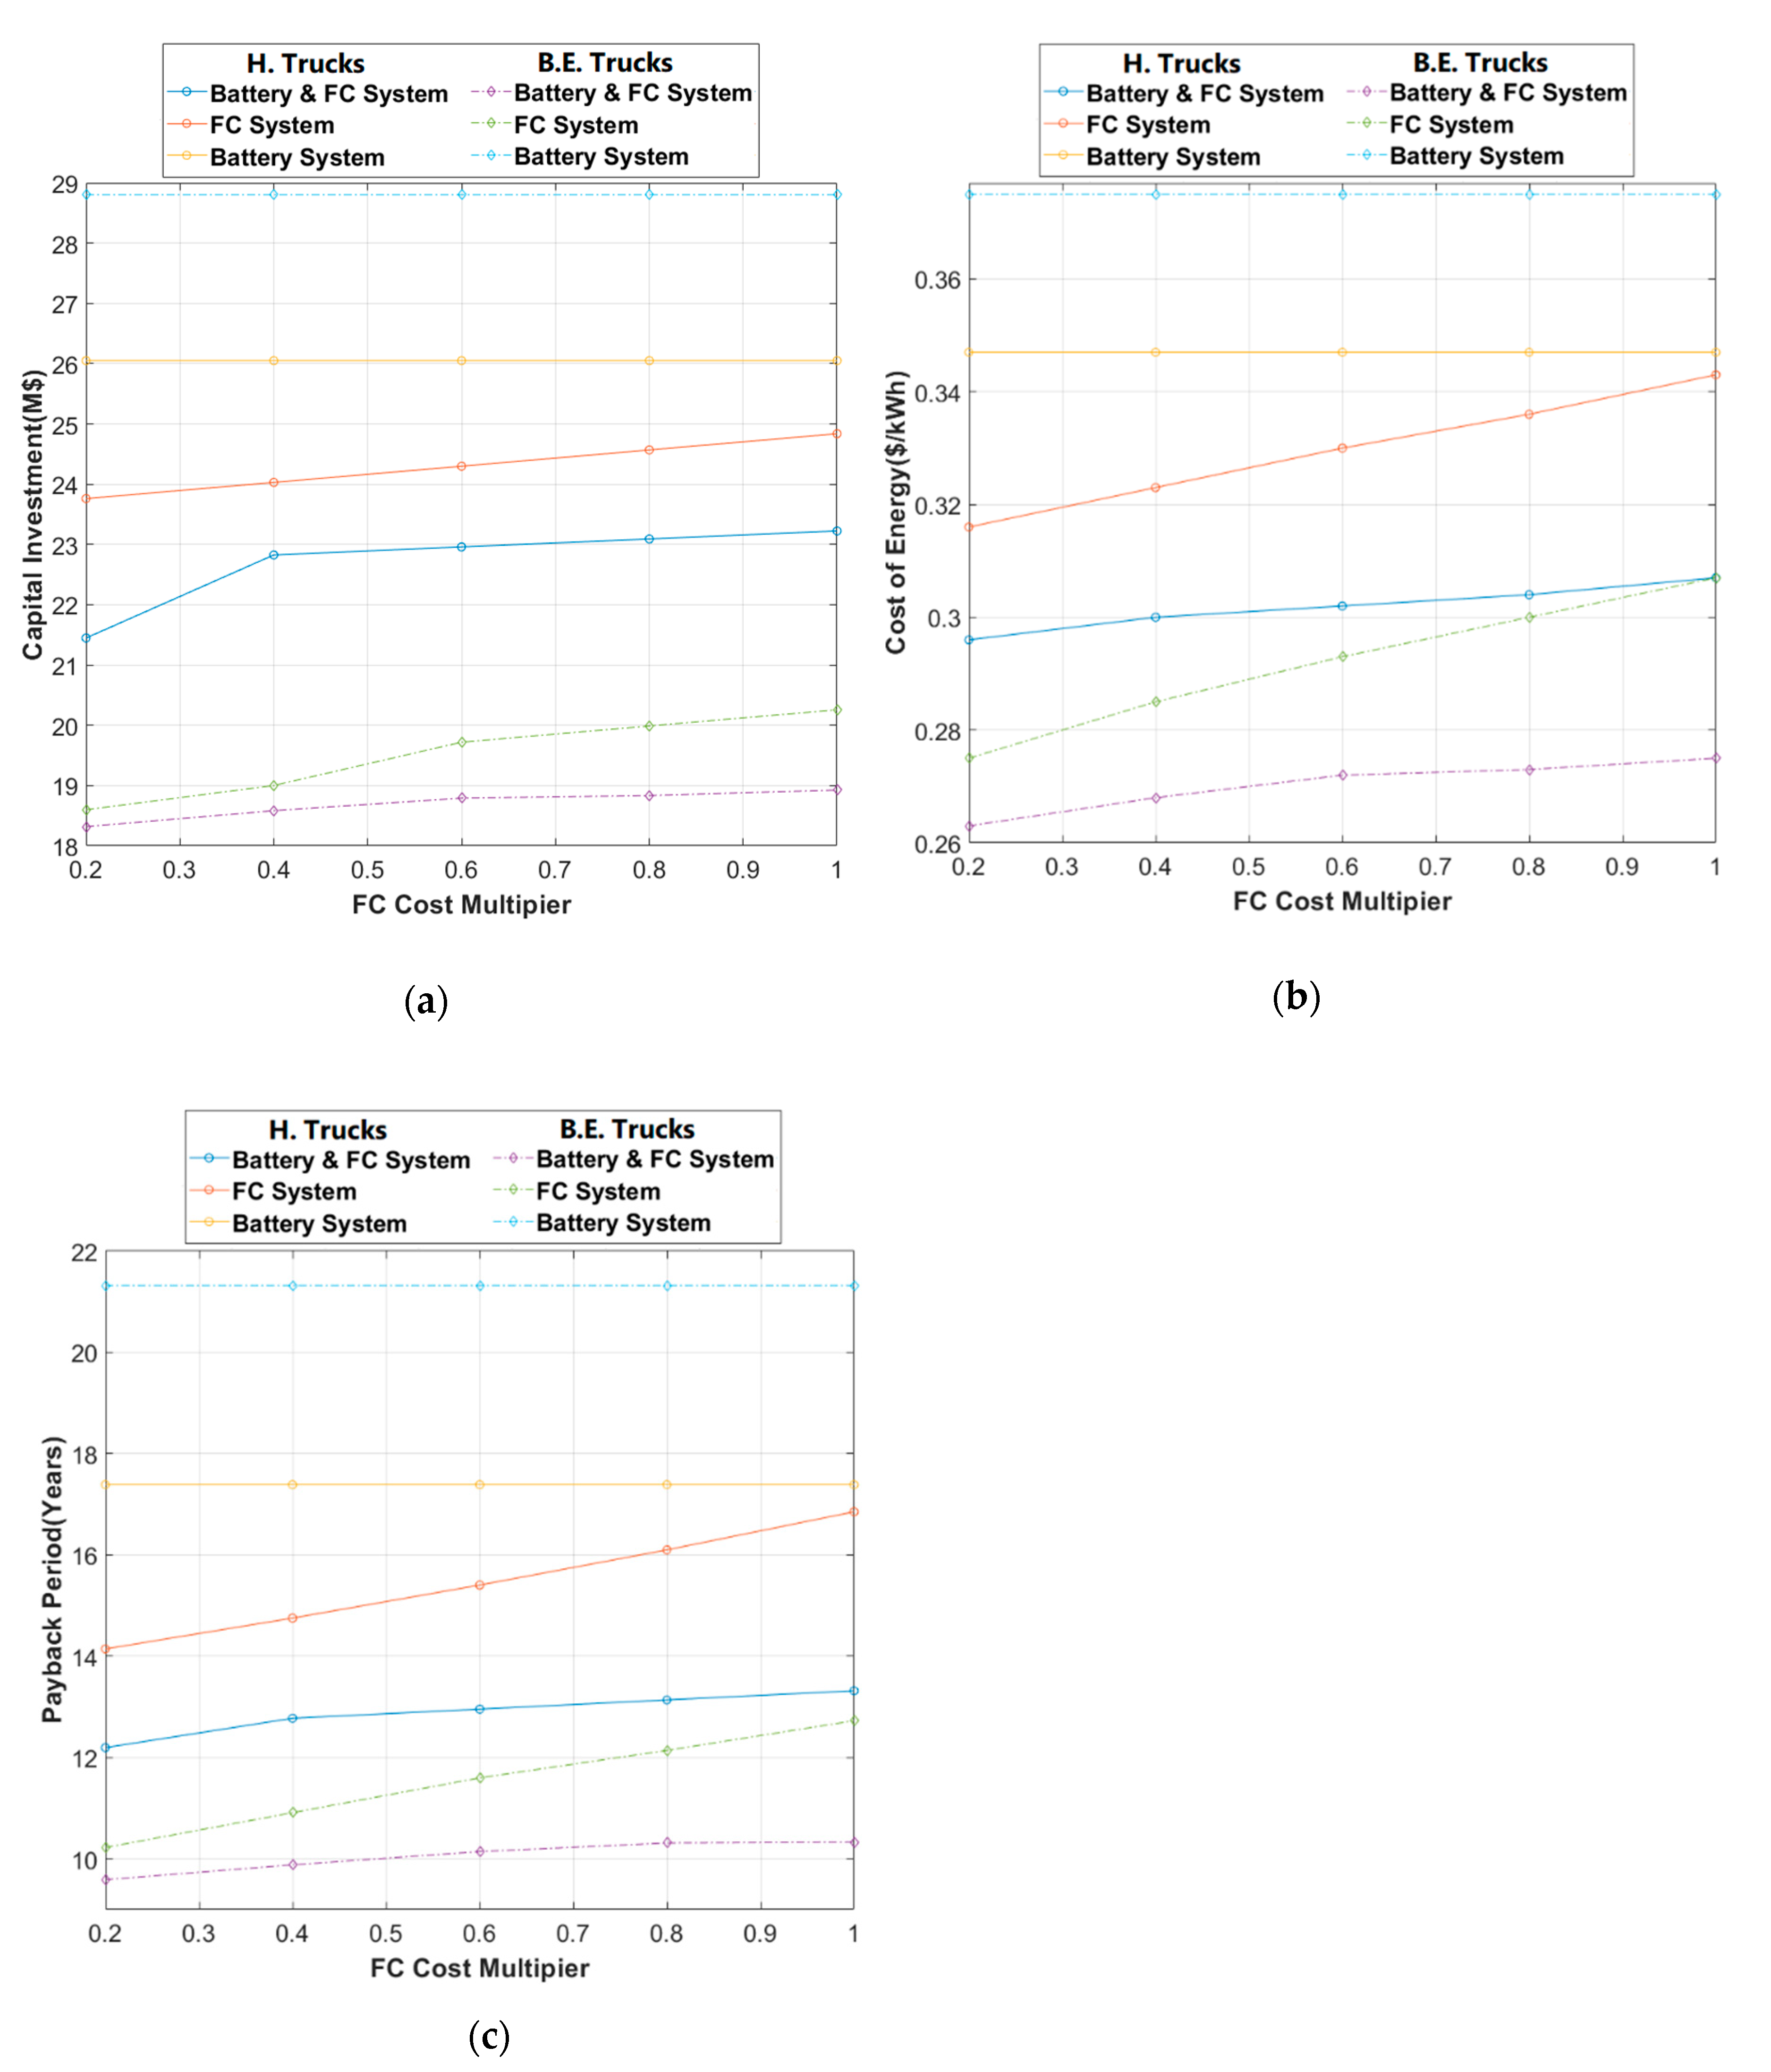
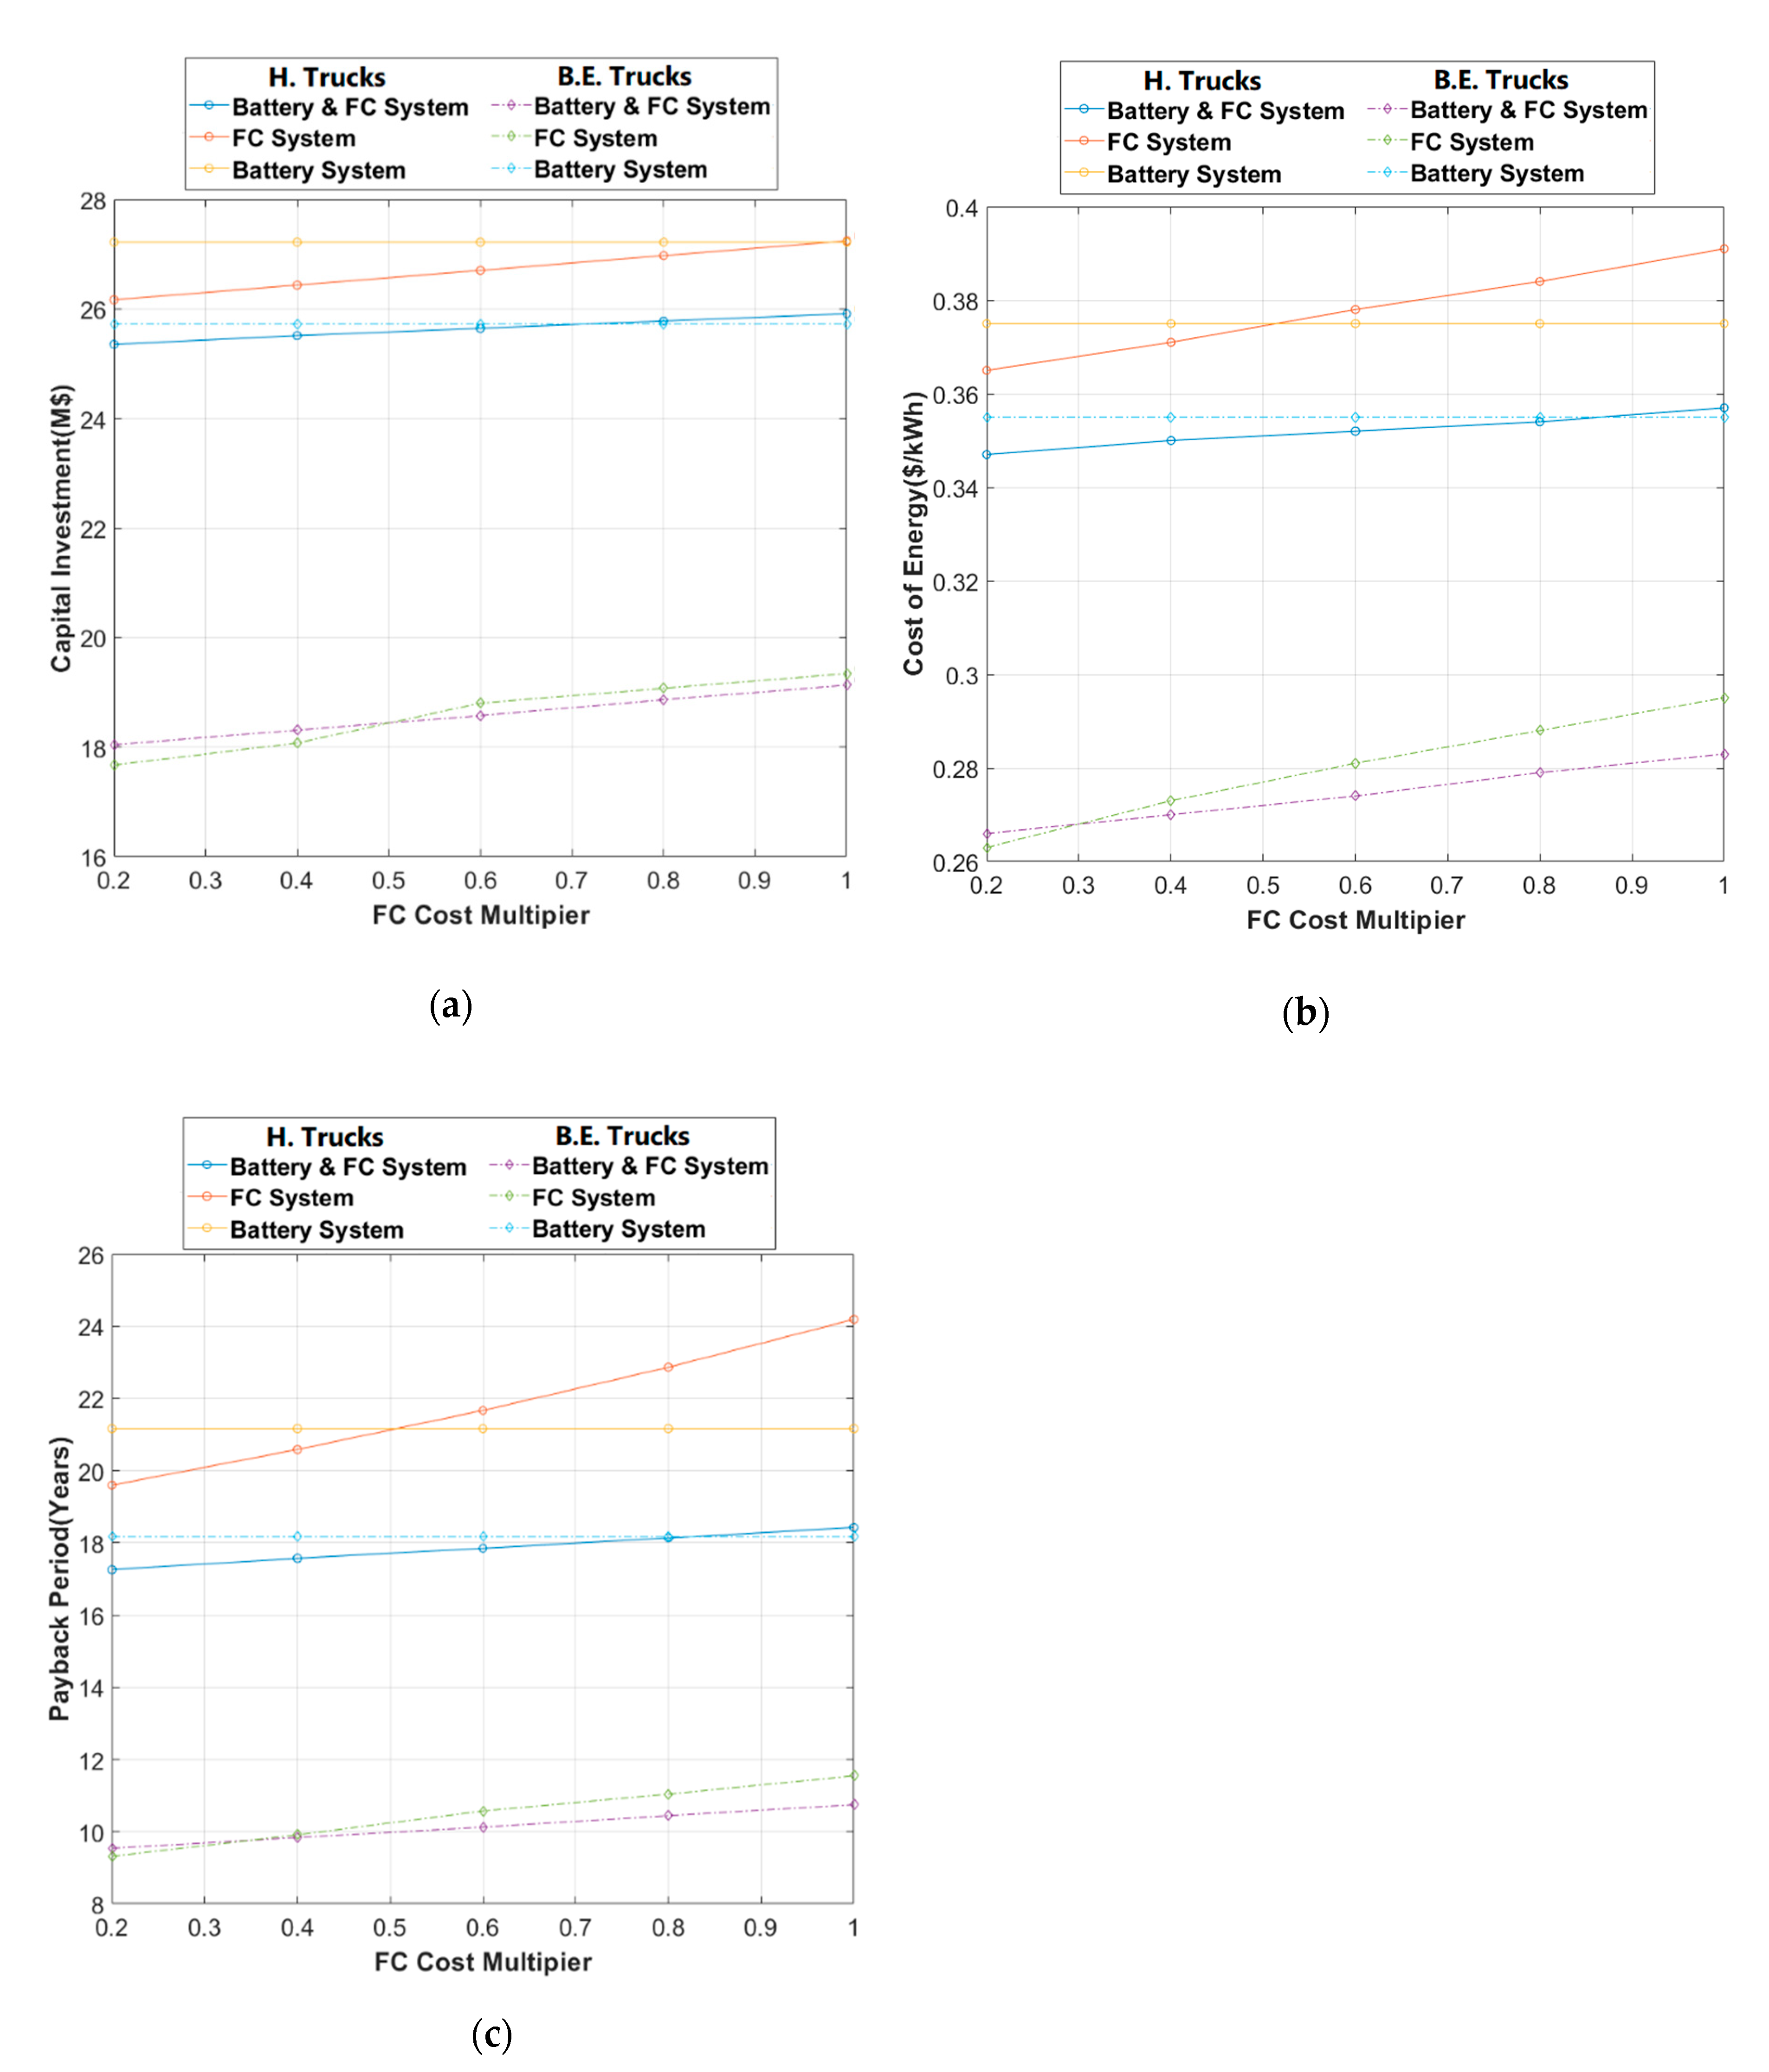
3.4. Sensitivity Analysis Results
4. Conclusions
Author Contributions
Funding
Conflicts of Interest
References
- Ghoreishi-Madiseh, A.S.; Kalantari, H.; Kuyuk, A.F.; Sasmito, A.P. A new model to analyze performance of mine exhaust heat recovery systems with coupled heat exchangers. Appl. Energy 2019, 256, 113922. [Google Scholar] [CrossRef]
- Kalantari, H.; Ghoreishi-Madiseh, S.A.; Amiri, L.; Sasmito, A.P.; Hassani, F. Numerical study of waste heat recovery by direct heat exchanger systems. E&ES 2020, 463, 012031. [Google Scholar]
- Natural Resources Canada. Energy Sources and Distribution. Available online: https://oee.nrcan.gc.ca/corporate/statistics/neud/dpa/showTable.cfm?type=CP§or=agg&juris=ca&rn=3&page=6 (accessed on 22 May 2020).
- Ghoreishi-Madiseh, S.A.; Kuyuk, A.F.; Kalantari, H.; Sasmito, A.P. Ice versus battery storage; a case for integration of renewable energy in refrigeration systems of remote sites. Energy Procedia 2019, 159, 60–65. [Google Scholar] [CrossRef]
- Hongxing, Y.; Wei, Z.; Chengzhi, L. Optimal design and techno-economic analysis of a hybrid solar–wind power generation system. Appl. Energy 2009, 86, 163–169. [Google Scholar]
- Diaf, S.; Daif, D.; Belhamel, M.; Haddidi, M.; Louche, A. A methodology for optimal sizing of autonomous hybrid PV/wind system. Energy Policy 2007, 35, 5708–5718. [Google Scholar] [CrossRef]
- Nfah, E.M.; Ngundam, J.M.; Tschinda, R. Modelling of solar/diesel/battery hybrid power systems for far-north Cameroon. Renew. Energy 2007, 35, 832–844. [Google Scholar] [CrossRef]
- Nfah, E.M.; Ngundam, J.M. Modelling of wind/Diesel/battery hybrid power systems for far North Cameroon. Energy Convers. Manag. 2008, 49, 1295–1301. [Google Scholar] [CrossRef]
- Finding Data to Run HOMER. Available online: https://www.homerenergy.com/products/pro/docs/latest/finding_data_to_run_homer.html (accessed on 22 May 2020).
- Canadian Mining and Energy, Sustainability and Environment. Available online: https://www.miningandenergy.ca/sustainability/article/diavik_diamond_mine_turns_to_wind/ (accessed on 22 May 2020).
- Natural Resources Canada. Science and Data. Available online: https://www.nrcan.gc.ca/science-and-data/funding-partnerships/funding-opportunities/current-investments/glencore-raglan-mine-renewable-electricity-smart-grid-pilot-demonstration/16662 (accessed on 22 May 2020).
- GLENCORE Canada. Raglan Mine. Available online: https://www.glencore.ca/en/Media-and-insights/Insights/Raglan-Mine-Operates-its-Second-Wind-Turbine (accessed on 22 May 2020).
- Hlal, M.I.; Ramachandaramurthy, V.K.; Sarhan, A.; Pouryekta, A.; Subramaniam, U. Optimum battery depth of discharge for off-grid solar PV/battery system. J. Energy Storage 2019, 26, 100999. [Google Scholar] [CrossRef]
- Salkuti, S.R. Comparative analysis of electrochemical energy storage technologies for smart grid. TELKOMNIKA 2020, 18, 2118–2124. [Google Scholar] [CrossRef]
- Al-Sharafi, A.; Sahin, A.Z.; Ayar, T.; Yilbas, B.S. Techno-economic analysis and optimization of solar and wind energy systems for power generation and hydrogen production in Saudi Arabia. Renew. Sustain. Energy Rev. 2017, 69, 33–49. [Google Scholar] [CrossRef]
- Shiroudi, A.; Taklimi, S.R.H.; Mousavifar, S.A.; Taghipour, P. Stand-alone PV-hydrogen energy system in Taleghan-Iran using HOMER software: Optimization and technoeconomic analysis. Environ. Dev. Sustain. 2013, 15, 1389–1402. [Google Scholar] [CrossRef]
- Bansal, S.; Zong, Y.; You, S.; Mihet-Popa, L.; Xiao, J. Technical and Economic Analysis of One-Stop Charging Stations for Battery and Fuel Cell EV with Renewable Energy Sources. Energies 2020, 13, 2855. [Google Scholar] [CrossRef]
- Cecilia, A.; Carroquino, J.; Roda, V.; Costa-Castelló, R.; Barreras, F. Optimal energy management in a standalone microgrid, with photovoltaic generation, short-term storage, and hydrogen production. Energies 2020, 13, 1454. [Google Scholar] [CrossRef]
- Singh, S.; Chauhan, P.; Aftab, M.A.; Ali, I.; Hussain, S.M.; Ustun, T.S. Cost Optimization of a Stand-Alone Hybrid Energy System with Fuel Cell and PV. Energies 2020, 13, 1295. [Google Scholar] [CrossRef]
- Silva, S.B.; Severino, M.M.; de Oliveira, M.A.G. A stand-alone hybrid photovoltaic, fuel cell and battery system: A case study of Tocantins, Brazil. Renew. Energy 2013, 57, 384–389. [Google Scholar] [CrossRef]
- Dursun, B. Determination of the optimum hybrid renewable power generating systems for Kavakli campus of Kirklareli University, Turkey. Renew. Sustain. Energy Rev. 2012, 16, 6183–6190. [Google Scholar] [CrossRef]
- Kalinci, Y. Alternative energy scenarios for Bozcaada island, Turkey. Renew. Sustain. Energy Rev. 2015, 45, 468–480. [Google Scholar] [CrossRef]
- Mason, J.E.; Zweibel, K. Baseline model of a centralized pv electrolytic hydrogen system. Int. J. Hydrogen Energy 2007, 32, 2743–2763. [Google Scholar] [CrossRef]
- Natural Resource Canada, Office of Energy Efficiency. Table 3: Secondary Energy Use and GHG Emissions by Industry. Available online: https://www.nrcan.gc.ca/energy-efficiency/energy-efficiency-industry/energy-management-industry/energy-benchmarking industry/benchmarking-guides/5171#ll (accessed on 22 May 2020).
- HOMER (Hybrid Optimization of Multiple Energy Resources). Available online: https://www.homerenergy.com (accessed on 22 May 2020).
- Government of B.C., Environmental and Climate Change. Available online: https:// www2.gov.bc.ca/gov/content/environment/climate-change/planning-and-action/carbon-tax (accessed on 22 May 2020).
- NASA Prediction of Worldwide Energy Resources. Available online: https://power.larc.nasa.gov/ (accessed on 22 May 2020).
- Hakimi, S.M.; Moghaddas-Tafreshi, S.M. Optimal sizing of a stand-alone hybrid power system via particle swarm optimization for Kahnouj area in south-east of Iran. Renew. Energy 2009, 34, 1855–1862. [Google Scholar] [CrossRef]
- Amphlett, J.C.; Baumert, R.M.; Mann, R.F.; Peppley, B.A.; Roberge, P.R.; Harris, T.J. Performance modeling of the Ballard Mark IV solid polymer electrolyte fuel cell: I. Mechanistic model development. J. Electrochem. Soc. 1995, 142, 1. [Google Scholar] [CrossRef]
- Canadian Weather, Climate and Hazards. Available online: https://www.canada.ca/en/services/environment/weather.html (accessed on 22 May 2020).
- Pokhrel, S.; Kuyuk, A.F.; Kalantari, H.; Ghoreishi-Madiseh, S.A. Techno-Economic Trade-off between Battery Storage and Ice Thermal Energy Storage for Application in Renewable Mine Cooling System. Appl. Sci. 2020, 10, 6022. [Google Scholar] [CrossRef]
- Energy Efficiency and Renewable Energy, Fuel Cell Technologies Office Multi-Year Research, Development, and Demonstration Plan. Available online: https://www.energy.gov/eere/fuelcells/downloads/fuel-cell-technologies-office-multi-year-research-development-and-22 (accessed on 22 May 2020).
- Car and Driver, Caterpillar 797. Available online: https://www.caranddriver.com/reviews/a15140071/caterpillar-797-specialty-file (accessed on 22 May 2020).
- Varaschin, J.; de Souza, E. Economics of diesel fleet replacement by electric mining equipment. In Proceedings of the 15th North American Mine Ventilation Symposium 2015, Blacksburg, VA, USA, 20–25 June 2015. [Google Scholar]
- Luta, D.N.; Raji, A.K. Optimal sizing of hybrid fuel cell-supercapacitor storage system for off-grid renewable applications. Energy 2019, 166, 530–540. [Google Scholar] [CrossRef]
- Esposito, D.V. Membraneless electrolyzers for low-cost hydrogen production in a renewable energy future. Joule 2017, 20, 651–658. [Google Scholar] [CrossRef]
- Fathy, A. A reliable methodology based on mine blast optimization algorithm for optimal sizing of hybrid PV-wind-FC system for remote area in Egypt. Renew. Energy 2016, 95, 367–380. [Google Scholar] [CrossRef]
- National Laboratory of the U.S. Department of Energy. Available online: https://www.hydrogen.energy.gov/pdfs/review14/pd031_harrison_2014_o.pdf (accessed on 22 May 2020).
- Chi, J.; Yu, H. Water electrolysis based on renewable energy for hydrogen production. Chin. J. Catal. 2018, 39, 390–394. [Google Scholar] [CrossRef]
- Gabbar, H.A.; Abdussami, M.R.; Adham, M. Techno-Economic Evaluation of Interconnected Nuclear-Renewable Micro Hybrid Energy Systems with Combined Heat and Power. Energies 2020, 13, 1642. [Google Scholar] [CrossRef]
- Natural Resources Canada. Retail Fuel Prices by Province-Energy Sources. 2018. Available online: https://www.nrcan.gc.ca/energy/fuel-prices/4593 (accessed on 22 May 2020).
- Amiri, L.; de Brito, M.A.; Baidya, D.; Kuyuk, A.F.; Ghoreishi-Madiseh, S.A.; Sasmito, A.P.; Hassani, F.P. Numerical investigation of rock-pile based waste heat storage for remote communities in cold climates. Appl. Energy 2019, 252, 113475. [Google Scholar] [CrossRef]


| Parameters | U/G Mining Operation with Intensive Mineral Process | U/G Mining Operation with Minimal Mineral Process |
|---|---|---|
| Electric demand | ||
| Motive power | ||
| Thermal demand |
| Parameters | Value | Ref | Parameters | Value | Ref |
|---|---|---|---|---|---|
| Nominal discount rate (i′) | [32] | Inflation rate (f) | [32] | ||
| Fuel Cell capital cost ($/kW) | [33] | Fuel Cell replacement cost ($/kW) | [33] | ||
| Battery capital cost ($/kWh) | [15] | Battery replacement cost ($/kWh) | [15] | ||
| Diesel Truck capital cost ($/kW) | [33] | Diesel Truck replacement cost ($/kW) | [33] | ||
| H Truck capital cost ($/kW) | [33,34] | H Truck replacement cost ($/kW) | [33,34] | ||
| BE Truck capital cost ($/kW) | [33,34] | BE Truck replacement cost ($/kW) | [33,34] | ||
| Electrolyzer capital cost ($/kW) | [35,36] | Electrolyzer replacement cost ($/kW) | [35,36] | ||
| H Tank capital cost ($/kW) | [35] | H Tank replacement cost ($/kW) | [35] | ||
| Wind turbine capital cost ($/kW) | * | Wind turbine replacement cost ($/kW) | * | ||
| Lifetime of the mine (years) | - | Fuel Cell efficiency | [37] | ||
| Electrolyzer efficiency | [38,39] | Convertor efficiency Lifetime of battery (years) | [15] [15] | ||
| Lifetime of fuel cell (years) | [37] | Lifetime of Diesel Truck (years) | [33] | ||
| Lifetime of H Truck (years) Lifetime of BE Truck (years) | [33,34] [33,34] | Lifetime of Electrolyzer (years) | [36] | ||
| Lifetime of Turbine (years) | [40] | Lifetime of Convertor (years) | [15] | ||
| Lifetime of Tank (years) | [37] | Diesel price ($/L) Diesel generator cost ($/kW) | [41] [15] | ||
| Diesel generator replacement cost ($/kW) | [15] | Thermal storage system cost ($/MWh) | [42] | ||
| Carbon tax ($/ton) | [25] | Convertor capital cost ($/kW) | [15] | ||
| Convertor replacement cost ($/kW) | [15] |
| Type of the Mine | U/G Mining Operation with Minimal Mineral Process | U/G Mining Operation with Intensive Mineral Process | |
|---|---|---|---|
| Pollutant | Units | ||
| Carbon Dioxide | t MW−1 y−1 | ||
| Carbon Monoxide | t MW−1 y−1 | ||
| Unburned Hydrocarbons | t MW−1 y−1 | ||
| Particulate Matter | t MW−1 y−1 | ||
| Sulfur Dioxide | t MW−1 y−1 | ||
| Nitrogen Oxides | t MW−1 y−1 |
| Type of the Mine | U/G Mining Operation with Minimal Mineral Process | |||||
| B/FC/BET | B/BET | FC/BET | B/FC/HT | B/HT | FC/HT | |
| Wind Turbine (MW) | ||||||
| Battery (MWh) | ||||||
| Fuel Cell (MW) | ||||||
| Electrolyzer (MW) | ||||||
| H Truck (kW) | ||||||
| BE Truck (kW) | ||||||
| CAPEX (M$) | ||||||
| COE ($/kWh) | ||||||
| Payback (years) | ||||||
| Type of the Mine | U/G Mining Operation with Intensive Mineral Process | |||||
| B/FC/BET | B/BET | FC/BET | B/FC/HT | B/HT | FC/HT | |
| Wind Turbine (MW) | ||||||
| Battery (MWh) | ||||||
| Fuel Cell (MW) | ||||||
| Electrolyzer (MW) | ||||||
| H Truck (kW) | 310 | |||||
| BE Truck (kW) | ||||||
| CAPEX (M$) | ||||||
| COE ($/kWh) | ||||||
| Payback (years) | ||||||
| Feasibility Collar | Feasible | Poorly Feasible | Infeasible | |||
Publisher’s Note: MDPI stays neutral with regard to jurisdictional claims in published maps and institutional affiliations. |
© 2020 by the authors. Licensee MDPI, Basel, Switzerland. This article is an open access article distributed under the terms and conditions of the Creative Commons Attribution (CC BY) license (http://creativecommons.org/licenses/by/4.0/).
Share and Cite
Kalantari, H.; Ghoreishi-Madiseh, S.A.; Sasmito, A.P. Hybrid Renewable Hydrogen Energy Solution for Application in Remote Mines. Energies 2020, 13, 6365. https://doi.org/10.3390/en13236365
Kalantari H, Ghoreishi-Madiseh SA, Sasmito AP. Hybrid Renewable Hydrogen Energy Solution for Application in Remote Mines. Energies. 2020; 13(23):6365. https://doi.org/10.3390/en13236365
Chicago/Turabian StyleKalantari, Hosein, Seyed Ali Ghoreishi-Madiseh, and Agus P. Sasmito. 2020. "Hybrid Renewable Hydrogen Energy Solution for Application in Remote Mines" Energies 13, no. 23: 6365. https://doi.org/10.3390/en13236365
APA StyleKalantari, H., Ghoreishi-Madiseh, S. A., & Sasmito, A. P. (2020). Hybrid Renewable Hydrogen Energy Solution for Application in Remote Mines. Energies, 13(23), 6365. https://doi.org/10.3390/en13236365