Abstract
Solar hybrid mini-grid systems possess the potential to substantially support electrification in sub-Saharan Africa. While their technical reliability has been proven, their financial viability is achieved only by heavy subsidization as of now. Due to the growing importance of results-based financing, we ask whether newly developed business models leveraging on the value added of electricity supply in rural areas (such as the KeyMaker Model) bare the potential to substantially reduce amount of grants required to finance the initial capital investment and thus contribute to a sustainable form of development. The principle of the KeyMaker Model is based on utilizing the locally supplied mini-grid electricity to establish a local agro-processing project, the revenues of which are an additional income stream for the mini-grid operator, while the project creates an end-market for the local farmers to sell their produce. We have developed two scenarios (without and with KeyMaker Model) for four rural villages in Nigeria as a case study to scientifically assess the potential of KeyMaker Models. We simulated and optimized the mini-grid systems using the software tool HOMER. We then assessed their financial viability. Our analysis demonstrates grant finance requirements ranging from 82% to 99% of the total investment for the base-case mini-grid projects without consideration of the KeyMaker Model. We find that a well-selected KeyMaker Model such as cocoa bean processing reduced the grant requirement by 68 percentage points, while processes based on maize, palm oil and cassava processing achieved reductions of 36, 26 and 8 percentage points, respectively. Hence, we conclude that the value added by the introduction of new local business models bares the potential to reduce grant requirements for the socially and economically necessary electrification across the Global South.
1. Introduction
In 2015, Member States of the United Nations adopted the 2030 Agenda for Sustainable Development and defined the 17 Sustainable Development Goals (SDGs), which among others aim to ensure clean and affordable energy (SDG7) and reduce the world’s population share living under extreme poverty to 3% by 2030 (SDG1) and take urgent climate action (SDG13). As of today, 840 million people still lack access to electricity, two thirds of which live in Sub-Saharan Africa, and 80% of them do so in rural areas. There are fundamentally three approaches to electrify remote rural communities, namely the installation of solar home systems, the development of mini-grids (MGs) and the extension of the national grid [1,2]. MGs in this context refer to stand-alone systems with the capability to supply up to 1 MW of electrical power to a wide range of customers that are connected through a distribution grid [3]. The optimal option will ultimately depend on how remote a given population cluster is, its population density and its level of economic activity.
Mini-grids have the capability to cost-effectively power both direct current (DC) and alternating current (AC) appliances at household level and heavier loads such as welding shops, mills, rural agro-processing businesses, health centers, schools and village-level water purification units. Hence, they have the potential to turn an off-grid rural village into a “local business hub” (with the implicit job creation potential) [4]. Furthermore, well-designed mini-grids are proving to be significantly more reliable than the national grid in terms of minimizing power outages: while outages for grid-connected customers can amount to 53% of the year in sub-Saharan Africa [5], recently developed mini-grids are able to provide almost year-round power, often with uptimes exceeding 97% [6]. Cost-reflective tariffs charged to MG customers are by norm substantially higher than tariffs charged to grid-connected customers, which in the sub-Sahara African context are often subsidized [6], with utilities in some instances setting grid tariffs that account merely for 41–80% of the levelized cost of electricity (LCoE) [6]. Existing research has shed light on the fact that African utilities are often not able to profitably run their operations [7,8].
The solar mini-grid sector has been gaining traction driven by substantial cost reductions for PV modules, lead-acid and lithium ion batteries. According to ESMAP [6], the LCoE of mini-grid electricity is forecasted to experience a 60% reduction by 2030. While the technology has been proven to be highly reliable, the economics of MGs are not as attractive. It is not uncommon for MGs nowadays to require public subsidies and grants of up to 80% of their capital investment in order to offer sufficient returns to private investors. In spite of forecasted cost reductions, the need prevails to identify new business models that transform the economics of the sector and ensure its increasing independence from development finance and grants [9].
Along these lines, our objective is to assess the potential of newly developed business models leveraging on the value added of electricity supply in rural areas, such as the KeyMaker Model to contribute to a sustainable form of development by increasing the profitability of MGs as well as to reduce the share of subsidies that are currently being deployed to materialize these projects. To answer the research question, we selected four villages in rural Nigeria, implemented two rounds of simulations for each of the four cases, and assessed the economic viability: The first round of simulations targeted the design of four MGs to electrify the selected villages. In the second round of simulations, we assessed the extent to which the economics of the mini-grid projects is altered upon applying the KMM across the four villages.
The idea of KeyMaker Models was first developed by INENSUS GmbH (Goslar, Germany) and is being implemented and promoted by that company after having been tested by its subsidiary in Tanzania, the mini-grid operator JUMEME Rural Power Supply Ltd. (Mwanza, Tanzania). Its underlying principle is based on having the mini-grid operator leverage on its established network on the ground and management structures as well as stable supply of electricity to qualitatively improve a strategic value chain in the local community, often on the agriculture processing and trading sectors. The electricity supplier in turn becomes as well an agro-product processor. As an outcome, the farmers’ produce is now locally processed and well-preserved while marketed beyond the local community to reach regional, national or international markets, freeing the community from the economic constraint implied by its remote location.
The remainder of this work is structured as follows: In Section 2, we provide a detailed overview of existing business models across the MGs sector to map and contextualize existing gaps. We then introduce our methods in Section 3, before proceeding with the presentation of the results in Section 4. Thereinafter, we discuss the outcomes of our work in Section 5. We conclude in Section 6.
2. Literature Review
The topic of mini-grids as a means for rural electrification has been widely explored during the last years. A study recently published by the World Bank [6] lists innovation on business models that transform the (currently weak) economics of MG projects as one of the priority research areas. Given the wide diversity of research topics on MGs and the limited scope of this paper, our literature review aims to shed light on the identified gaps that directly refer to our research foci: (1) analysis of existing business models that have attempted to improve the economics of MGs and (2) analysis of existing approaches to determine the financial and economic viability of MGs in rural areas across the Global South. In both cases, an emphasis is placed on highlighting the large amounts of grant finance that MG projects developed so far have required to achieve attractive returns to the undertaken investment, a topic which existing research on MGs has largely omitted. For the purpose, an in-depth analysis of articles, white papers, reports and case studies stemming both from academic and industrial backgrounds has been undertaken.
2.1. Identified Business Models in the Mini-Grid Sector
Table 1 summarizes identified business models across the reviewed literature. We find that all references experiment only within the boundaries of the electricity supply business without leveraging on the potentials triggered by the availability of reliable electricity.

Table 1.
Identified mini-grid business models.
Essentially, common business models aim to reduce the cost incurred to generate a specific unit of revenue, either by achieving economies of scale or aiming to reduce the capital cost of MG projects. A growing amount of research is being developed exploring the potential of coupling the energy, water and food sectors (the so-called Energy-Water-Food Nexus), which to a certain extent shares with the KMM analyzed in this work the understanding of electricity as a means rather than merely an end in itself.
2.2. The KeyMaker Model (KMM)
Unlike the majority of previously implemented business models in the rural MG sector, the KMM’s foundations lie in the windows of opportunities enabled by the supply of electricity to energy deprived rural contexts. Essentially, the KMM understands electricity supply not as the end but as a mean to economically transform recipient communities. The MG project developer/operator leverages on the reliable supply of electricity as well as established management structures and network on the ground to tackle prevailing challenges across other local value chains in the rural context. Generally the agro-processing and agricultural product trading sectors are focused. Hence, the MG operator expands their investments to agro-processing equipment in addition to the necessary mini-grid power generation and distribution assets [22]. While the KMM resembles the Energy-Food-(Water) Nexus principle in the sense that both have their foundation on the interface between the energy and food sectors, the former has a clear focus on extrapolating the outcome of the project beyond the local community where the mini-grid and agro-processing facility are implemented as means to reach profitability. The eventual goal of the KMM operator is to produce and process at a scale that allows to, once local demand is covered, market the locally processed produce beyond the community by exporting to regional, national or even international markets. A core part of the KMM is centered on processing high quality natural resources (crops, animal-derivates, etc.) using stable mini-grid electricity supply, the community’s local expertise on these resources, and local labor from the same recipient community (whose salaries are by norm relatively lower than urban wages), all of which enable the KMM’s project cost structures to compete with urban and peri-urban agro-processors [22].
The increase in local farmers’ incomes (who are the MG operator’s customers on the electricity business) is ensured by establishing solid and mutually beneficial crop supply partnerships with the MG operator, which goes from being merely the supplier of electricity to being a reliable off-taker of the farmers’ produce. The presence of the MG operator on the rural village, which is often remotely located, creates a new market for the farmers.
For a KMM to be successful, it is of fundamental importance that it positively impacts the recipient community in terms of economic value and job creation. The KMM is to imply a competition for external stakeholders to the community where the mini-grid is located, not internal ones. This is due to the self-interest of the mini-grid developer to create economic opportunities for the village population, because he or she directly benefits from additional units of electricity sold. The mini-grid developer is able to significantly protect farmers from seasonal price fluctuations, and thus increase their household incomes throughout the year, which ultimately benefits as well the economics of the mini-grid through contributing to more stable electricity consumption patterns. The KMM allows the interests of farmers and mini-grid developers to be aligned, as they both have the role of client and supplier, either through the electricity supply or the food processing business.
The partial or full processing of farmers’ produce at the local village instead of selling the unprocessed produce to external traders has two fundamental impacts on the value chain: (1) the produce leaving the village is now of higher quality and thus can be sold at higher prices to downstream off-takers (i.e., on-site value creation); (2) due to the moisture reduction during the processing of agricultural products, the weight of the overall produce decreases, and with it the per unit transport cost.
While the technical feasibility of mini-grid based KMMs has been proven and their positive impacts on a community level are well comprehensible, as JUMEME’s experience highlights [22], the claimed potential of KMMs to substantially reduce the need for grant-based funding to cover investment costs still is to be proven. In the following, we will focus on this aspect.
2.3. Financial Assessment and Validation Approaches of Mini-Grid Projects
While extensive research covering the topic of techno-economic optimization of rural MGs in the Global South context is available (cf. [10,23,24,25]), the identified literature tends to repeatedly omit three fundamental aspects of the analysis. Firstly, as Franz et al. [26] state, important cost categories of the MG project development and operation such as company “overhead [expenses], transaction costs and customer relationship management” [26] and distribution grid costs tend to be underestimated or neglected in the analysis. Furthermore, Yang’s work [27] concludes that these costs are often bundled under the “Other costs” category, while in fact comprise a heavier burden on the overall project cost than some of the expenditures on hardware components. Secondly, in spite of several studies that assess the viability of MGs from the financial perspective [28,29,30,31], underlying assumptions regarding the capital structure of the assessed projects are not well described. While some studies do mention the relevance of subsidies to materialize the presented projects, they do not clearly state the share of the project that is financed through debt, equity or grants. Thirdly, the identified literature tends to undertake the financial assessment of the MG projects taking purely the cost perspective, that is, by benchmarking MG projects according to their LCoE. While insightful, this approach fails to take into account the revenue streams generated (or not) by the assessed project, which ultimately would be a first point of interest for a potential investor, as Tao and Finenko [32] state.
Some authors have aimed at integrating one or several of the previously stated points into their research work. In his work dedicated to assess the viability of MGs in Uganda, Raisch [33] highlights the essential role that subsidies are to play for the projects to achieve an acceptable project IRR of 18%, taking into account prevailing cost of debt, equity levels and project risk. Bhattacharyya [34] has complemented the techno-economic optimization of MGs in rural Bangladesh with an assessment of the required grant finance to achieve a positive net present value (NPV). He concludes that at existing grid-parity tariffs, even a complete subsidization of the initial capital investment would not be sufficient for the project to reach a positive NPV, and thus part of the OPEX would have to be subsidized, too [34]. The research of Keely and Managi [35] targeted the Indonesian market. They bring the above presented analysis further by discussing the impact of varying grant shares and debt-equity rations on both the projects’ IRR as well as the NPV. However, the study omits overhead and project development costs. The authors conclude that a minimum grant share of 35% of the total initial investment would be required for the project IRR to be higher than the mini-grids’ WACC across all scenarios [35].
Available research tackling the discussed weaknesses of previously developed studies undertaking techno-economic assessments of MGs is still limited. For the MG sector to realize its full potential, it will have to capture the attention of actors willing to provide financial resources beyond development finance. For this to be the case, a broader understanding of the real cost of MGs has to be developed (as well as of the subsidies currently required) to achieve attractive returns, and the profitability of MGs has to experience substantial improvements through the implementation of new business models.
3. Material and Methods
We selected four Nigerian villages to serve as pilot cases for this work, with the aim to filter out the role the KMM has on the overall MG project economics regardless of the context (see Figure A1 in Appendix A for a map outlining selected villages). The villages were selected based on the following criteria: (1) they are listed in the databases of the Nigerian Rural Electrification Agency (NREA) [36] and the Nigerian Federal Ministry of Power, Works and Housing [37] as candidates to be electrified though the establishment of mini-grid technology rather than through national grid extension or the implementation of solar home systems; (2) they are demographically comparable, with a recorded population of between 1000 and 2000 inhabitants and existence of two schools and one health centre (as signs of a relative importance of the village in its wider off-grid context); (3) the villages are located near rivers or bodies of sweet water (given how most agri-processing activities require a stable water source) and outside of national parks; (4) they are located in geographical zones where the farming of potentially promising crops to be processed as part of a KMM are predominant. We then simulated two versions of each village’s MG system (before and after integration of the KMM loads and business) and derived corresponding financial models. To this end, we used HOMER software [38] for the MG power generation assets design and optimization, while spreadsheet calculations served to derive the villages’ load profiles and the MG financial models. We used Google Earth to verify the villages location as outlined above, structure and MG compatibility of the villages. The MG design process, which has been applied in this work is composed of five steps: (1) village load profile estimation, (2) MG project cost estimation, (3) technical design of power generation assets in HOMER, (4) distribution grid cost estimation, and (5) development of MG financial model. Figure 1 illustrates our approach. Firstly, input variables such as villages’ solar irradiation levels, cost inputs for the MG components in the Nigerian context, village electrical loads, as well as KMM business loads (for the second-round systems) have been inserted in HOMER. The power generation assets are thus sized and optimized for each of the four selected villages and fed into the spreadsheet-based financial models, where additional cost categories that cannot be explicitly modelled in HOMER are contemplated, such as project development and other soft costs, distribution grid and power house expenses, as well as project finance structure. At this point, the main economic variables of each MG system are obtained, including LCoEs, project internal rate of returns (IRRs) and grant requirement levels.
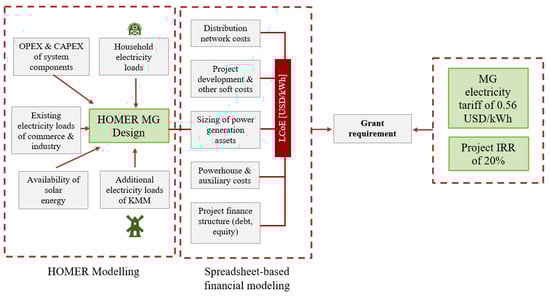
Figure 1.
Illustration of methodological framework.
Among the diversity of software tools available for the techno-economic optimization of hybrid mini-grids, we have selected HOMER (in spite of the above mentioned limitations) for the following reason: The aims of this analysis are (1) analyzing the economic viability of mini-grid projects, (2) shedding light on the required levels of subsidization and (3) assessing how a business model such as the KMM impacts the overall project economics, rather than performing an in-depth optimized design from the technical perspective. A growing amount of literature is emphasizing the value added of applying approaches such as centres of moments and annealing for power generation asset sizing and grid structure optimization, respectively [39]. Domenech et al. [40] benchmarked the advantages and limitations of traditionally optimization methods with multicriteria approaches, while Liang et al. [41] combined the former with artificial intelligence approaches. Fioriti et al. [42] applied stochastic modelling to isolated mini-grids. Although our method based on HOMER does not account for social factors and detailed distribution grid sizing [40], the nature of our analysis (with a focus on performing sensitivity analyses on how different variables affect the overall project economics), the availability of literature in regards to distribution grid costs and the fact that HOMER is the most widely used software across the mini-grid sector, have all contributed to its selection to perform this analysis.
3.1. Development of Base-Case Scenarios
In order to assess each village’s load profiles, we identified estimates and assumptions regarding village customer typology and actual electricity consumption patterns of each type of costumer in rural settings, for which we relied on INENSUS’ field data obtained through the company’s involvement in JUMEME, a Tanzanian mini-grid operator with a portfolio of 12 mini-grids across islands in Lake Victoria. Further, we gathered data on population [36,37], regional average household sizes, population shares across low-, middle- and high income levels, households appliance use and appliance power ratings [43,44,45,46,47,48]. Table A1 and Table A2 in Appendix A summarize the derived daily electricity consumption levels for each costumer type and the main cost assumptions for the modelling purposes in HOMER, respectively. The following components have been selected for the simulation purposes: (1) generic flat plate PV modules with a lifetime of 25 years and an assumed derating factor of 80% connected to the DC bus; (2) Surrette 6 CS-25PS deep-cycle lead-acid batteries (Surrette Battery Company Ltd., Springhill, NS, Canada) with nominal capacity of 6.91 kWh, minimum state of charge of 40%, lifetime throughput of 6879 kWh and 20 years total lifetime [49] connected to the DC bus in 48 V strings of eight batteries per string; (3) diesel generator component as on file in HOMER to allow for optimum generator sizing; (4) a generic bi-directional system converter with 90% efficiency connecting the AC and DC buses and functioning both as a rectifier (converting AC to DC) and inverter (converting DC to AC); (5) two system controllers, one for each type of dispatch strategy, to simulate both load-following and cycle-charging dispatch strategies. The optimization problem we solved using HOMER to design MG systems is the following:
s.t.
Share of renewable energy of at least 70% of total electricity supply (the rationale behind a minimum requirement of 70% renewable energy fraction is based on the objective of simulating mini-grids that could be of interest to be developed from an environmental perspective as well, achieving substantial reductions in CO2 emissions in relation to the case the same village loads were powered entirely by diesel generators. The impact of variations on the renewable energy fractions on the economics of the mini-grid project is assessed on the sensitivity analysis).
Operational reserve of at least 5% of electricity demand in each time step:
Operational reserve of at least 40% of the PV feed-in in each time step:
Total excess electricity lower than 20% of electricity demand:
Here, represents capital and operational costs, stands for revenue, is the project lifetime, N represents the total number of components, i is the real discount factor, represents total installed capacities, the feed-in and demand power of electricity. The indices are defined as follows: index represents the components, stands for capital, t is the index of years within the project’s lifetime T, stand for operation and maintenance, refers to replacement, refers to supply components (with and ), refers to demands, and indicates the hours.
Going beyond the scope of HOMER, we included remaining cost categories in terms of project development and soft costs, system O&M, powerhouse, auxiliary and installation costs. Ohiare (2015) [50] undertook a detailed study modelling the least cost option for rural electrification in Nigeria by 2030 proposing an average low voltage line length of 25 m per household connection. ESMAP’s distribution grid cost estimates (including single- and three-phase cabling and poles) of 14.98 USD/meter are relied upon to estimate the low voltage distribution grid costs of each simulated MG [50]. The same document estimates that MG distribution grid costs tend to fall on the range of 17% to 25% of total capital investment costs [50]. Hence, we added distribution grid costs Cgrid as follows:
where Z is the number of connections (customers). Further, we crosschecked that the resulting grid costs do not fall below 17% nor exceed 25% of total investment costs. We used a spreadsheet-based financial model tool to integrate all cost categories and the project finance structure (equity, debt and grant components) as well as effects of system depreciation and the Nigerian tax regulatory context. We focused the economic evaluation of each project on assessing the grant share ensuring (1) a project lifetime IRR (including the remaining value of assets) of 20% and (2) an electricity tariff for customers of 0.56 USD/kWh (which is the average tariff of developed MGs in Nigeria until now [3]). Given the relatively high risk perceived in the Nigerian context in terms of average inflation rates of 11–12% [51], the novelty of the MG sector in the country, generally unstable political and economic frameworks and high costs of capital (with nominal interest rates often exceeding 20–30% [52]), a realistic project would have to achieve a project IRR of at least 20% to compensate investors for the risk they face. We calculated the project IRR as follows:
where stands for revenues from electricity sold in year t, stands for net profits (before taxes) generated by the KMM (applicable only for the KMM-coupled MGs), refers to the remaining value of assets after the 20 years of the MG project lifetime, and Ct refers to all expenses incurred in year t (namely operation and maintenance, component replacement costs, interests on loans and taxes on income), and Cc refers to total required capital investment in both MG as well as KMM agro-processing plant assets at the start of the project. The electricity tariff is assumed to be subject to an inflation/indexing rate of 6.5%, considering that standard practice is based on keeping electricity tariffs fixed for a range of 2–4 years and are adjusted for inflation after that period. Operational expenditures, nevertheless, are indexed at the average national inflation rate of 11% (limitations of this approach are further outlined in Section 5). Furthermore, single-phase and three-phase users are subject to a connection and installation fees of 24 USD (8600 Naira) and 187 USD (67,400 Naira), respectively, the payment of which is distributed throughout the first three years of MG operation. Further assumptions on the financial model include: currency exchange rate of 1 USD = 360 Naira [53] with an assumed annual indexation of 5%, a technical uptime of 99%, distribution grid losses of 8%, an electricity demand ramp-up in the order of 60%, 80% and 100% on the first, second and third years after MG commissioning and a constant diesel price of 0.69 USD/liter (250 Naira/liter) (with a 10% mark-up to account for transport costs to remote areas) [54].
While the grant component varies depending on the MG economics, the debt-equity ratio is kept at 0.7 of the non-subsidized share for all projects. This ensures that the resulting project IRRs are comparable. The loan is assumed to be borrowed in foreign currency (USD) at a nominal interest rate of 7%, tenor of 10 years and grace period of one year. The assumed return on equity is 20%, which results in a weighted average cost of capital (WACC) of approximately 11%. The annual net operating profits are subject to 30% income tax, 5% VAT tax [55] and 1% communal tax, aligned with the Nigerian corporate tax framework. The overhead costs, including the salary of the managing director, management and technical staff, accounting, travel and vehicle costs, office costs, consultancy cost and fees, company insurance and an additional miscellaneous category are assumed to remain constant across all simulated villages. These have been assumed to amount to approximately USD 14,000 per year.
3.2. Development of KeyMaker Model-Coupled Mini-Grid Systems
We re-sized and re-designed each of the previously simulated and optimized four MGs to account for the required power demand of the KMM food processing machinery. We further adjusted the financial models correspondingly to integrate the KMM net profits as additional revenue streams for the mini-grid investor. The coupling of the KMM on the MG has two main impacts on the financial model: (1) it increases the annual MG revenues through a significant increase of electricity sold (the hypothesis being that the more electrical energy intensive the KMM is, the more it benefits the MG economics); (2) as long as the KMM and MG project accounts are merged (i.e., as long as both projects are undertaken by the MG operator solely or through a joint venture with a local stakeholder), a profitable KMM would strengthen the overall economics of the MG. In this work, a different KMM has been selected for each village’s MG.
The Famine Early Warning Systems Network’s (FEWS NET) (2018) [56] extensive report covering the livelihoods zone map for Nigeria served as starting point to selected the value chains serving as KMM pilot cases. We then proceeded as follows: Firstly, we assessed the overall market conditions and regulatory frameworks in Nigeria for the pre-selected crops. Secondly, we analyzed each potential KMM’s project economics. To this end, we accounted for the purchase of equipment and machinery for the specified processing capacities, building construction of the KMM factory, overall transport expenses (from farm to factory and from factory to market, assuming a distance of 25 km), personnel/labor costs, expenditures in O&M of the equipment (assuming 2% of the respective machinery costs), depreciation, packaging, rent, utilities and taxes. Further, we developed financial plans for the selected KMMs, and compared the resulting net operating profit margins to estimates available from the literature review.
We prioritized value chains with net operating profits above 10–15% (after taxes), stability in crop supply throughout the year and favorable market conditions. We focused on identifying potential gaps that the implementation of the KMM could fill in terms of improving the productivity of the crop processing, increasing the quality of the processed product and reducing the transport costs of delivering the produce to the market. This implies identifying national market sizes of crops and their respective processed products (in tons and USD), average market prices (season and off-seasonal) [51,54,57,58,59,60,61,62,63,64,65,66,67,68,69], export potential, seasonality and yields of crops (kg/hectare of farm land/year), regulatory frameworks and availability of tax incentives for the export of the processed products and import of required crop processing equipment. The result of this analysis concluded in the following selected KMM processes: processing of palm fruit to palm oil, processing of maize grain to maize starch in order to make ogi—a widespread eaten fermented cereal pudding in Nigeria made from, among others, maize—processing of cassava root to produce cassava flour, and finally, processing of fresh cocoa bean into cocoa butter and cocoa powder. See Table 2 for further details on the regarding conversion rates.
Table 2.
Crop conversion rates from input to processed product.
Moreover, we analyzed the energy and water intensity of each process. Energy use in each process has been split between electrical and thermal energy units, provided that the former is the load that would eventually have to be supplied directly by the MG. In order to make the results of the four villages comparable, we assumed an equal processing capacity of 200 kg of processed product a day for the four prioritized KMMs. The mentioned processing capacity corresponds to a small- to middle-scale processing business, which at an early stage of project assessment would be realistic and easily absorbed by the recipient community. Additionally, such a small-scale KMM is expected to source the required amounts of crop supply by farmers from the surrounding communities. Each KMM alters the optimal MG design depending on the energy intensity of the specific process. All KMMs have been assumed to operate 10 h a day, from 8 AM to 6 PM, coinciding with typical mill operating hours in rural areas as well as with sunlight hours. Table A3 in Appendix A presents the annual hours of operation for each KMM, conditioned mainly by the seasonal calendars of the crops. In Table A4, we summarize the value chains of selected crops and relevant market characteristics. We adjusted the respective financial models of the four MGs by adding the annual electricity demand of the KMMs. We integrated the net annual profits estimated for each KMM in the financial model as an additional revenue stream for the entire MG project. Given the relatively low capital expenditures of the KMMs, the purchase of the processing equipment and machinery is assumed to be fully financed by equity, resulting in zero expenses on interests. The MG electricity tariffs are kept at 0.56 USD/kWh as was done in the first part of the analysis. Finally, we compare the resulting grant share levels required for these newly modelled MGs in order to maintain a project IRR of 20% to those of the first round MG projects.
4. Results
Having introduced our methods, we now summarize our results. First, we demonstrate the developed KMM value chains. We then compare both the technical and financial outcomes of the base-case before introducing KMM value chains with the results of the second-round simulations including KMMs that are based on rural electrification. Finally, we provide sensitivity analyses for main influencing factors, comprising the diesel price, mini-grid tariffs, the costs of capital, the project IRR requirements, the KMM product market price and future mini-grid capital and O&M cost reductions.
4.1. Analysis of KeyMaker Model (KMM) Value Chains
We found that the first key impact factor for a successful KMM application is securing the supply of crops in the required quantities for the business to operate at its designed capacity. Two additional fundamental factors for the KMM selection are the market price of the processed products as well as the number of months per year throughout which raw crops can be supplied to the processing factory, delimited by the respective crops’ harvesting seasons. The next step in the selection of suitable KMMs involved the analysis of the energy intensity levels of the processing of each type of crop. Figure 2 outlines the significantly higher (electrical) energy requirements for the processing of cocoa bean to cocoa butter and powder. For every ton of processed cocoa butter and powder, approximately 1537 kWh of electricity are needed, according to literature [73]. The three remaining selected value chains are at comparably lower levels, with the processing of ogi, cassava flour and palm oil at 147 kWh/ton [71], 21.6 kWh/ton [74] and 64.29 kWh/ton [70], respectively. Among the analyzed crops, the processing of cocoa is expected to favor the MG project most substantially due to its high electricity intensity. Nevertheless, the fact such a KMM would only operate during five months a year prevents that this advantage is realized throughout the whole year. Therefore, the question arises as to whether the additional revenues from electricity compensate for the required upsizing of a MG powering a cocoa-based KMM.
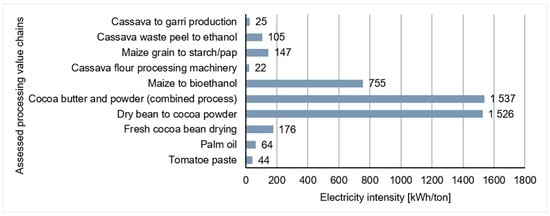
Figure 2.
Electricity intensity levels (kWhelectric/kg of processed product).
The financial assessment of the processing business for the four selected value chains is presented in Table 3. Each village has been assigned a KMM based on the respective crop predominance in the region, thus ensuring stable crop supplies by local farmers. The corresponding KMM annual net profits have assumed to be achieved after a ramp-up phase of three years and have accordingly been included in the MG projects financial models.
Table 3.
Summary of economic results of selected KeyMaker Models.
The results prove that the high market prices of cocoa butter and powder are sufficient to offset the business’ higher initial capital expenditures, shorter harvesting seasons and higher energy intensity levels. The annual net profits (before taxes—in order to prevent double-taxing) of the four selected value chains have been introduced in the financial models of the second round of simulated MGs. The power required to run the KMM equipment is introduced in the four previously derived village load curves, as presented in Table 4.
Table 4.
Power requirements of each KMM with processing capacity of 200 kg/day.
4.2. Technical Design of Base-Case vs. Second-Round Mini-Grids
As expected, adding the KMM loads to the base-case MGs causes the system size to increase. The increase proves to be roughly proportional to the (electrical) energy intensity of the four selected value chains. This pattern can be seen in Figure 3. Coupling a palm oil and cassava flour processing factory with a daily capacity of 200 kg leads to an increase in the MGs output power by 2% and 4%, respectively. This is in line with the relatively lower electrical energy intensity (see Figure 2). The MG’s output power increases by 12% for Mambe due to the integration of the maize processing factory, which is aligned with an intermediate electrical energy intensity in relation to the other three value chains. Finally, the size of the MG has to increase by 79% in order to ensure stable power supply for the cocoa processing factory, which corresponds to the high electrical energy intensity of this process. The more (electrical) energy intensive a given KMM is, the higher its impact on the MG project.
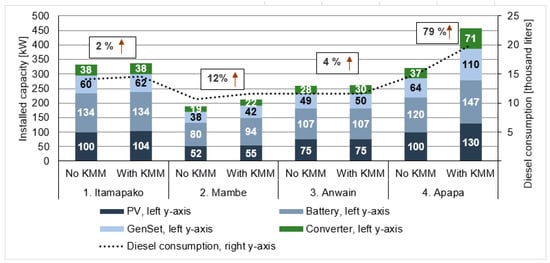
Figure 3.
Component installed capacities (kW, left axis), annual diesel consumption (liters, right axis) and increase in MG power output (labels with arrows) for the four villages.
4.3. Financial Analysis of Base-Case vs. Second-Round Mini-Grids
Figure 4 shows the initial capital expenditures as well as annual village loads (kWh) and the LCoE (USD/kWh) for the base-case and second-round MGs of the four villages. The required capital investments for the base-case scenarios vary from USD 251,000 to USD 467,000 according to the size of the respective systems; the LCoEs range from 1.15 USD/kWh in Apapa (where initial capital expenditure are the highest) to 1.42 USD/kWh in Anwain. Capital investments range from USD 272,650 to USD 562,747 for the second-round simulations. An interesting finding is that in spite of a drastic increase in the capital expenditures to develop the significantly larger MG in Apapa, the resulting LCoE decreases by 13% in that village more than in any other site.
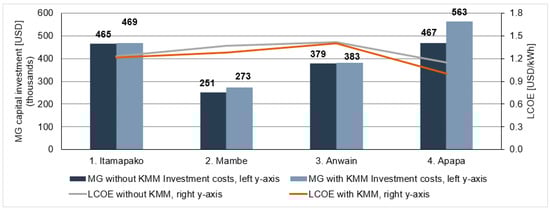
We find the following pattern across the four villages: in spite of an increase in the initial capital expenditures, corresponding to the upsizing of the MG to power the KMM loads, the LCoEs for all MGs decrease, thus proving that the positive impact of the integration of the KMM through an increase in units of electricity sold offsets its negative impact through requiring higher initial capital expenditures. This sheds light on the important role that the amount of electricity produced (and sold) in a MG has to improve the economics of the overall project. Larger villages (in terms of loads) generally imply better returns for MG project developers rather than small population clusters.
At constant tariffs, the coupling of the palm oil KMM allows for a reduction in the grant share of the total project capital investment from 86% to 60%. The integration of the KMM based on the processing of maize starch, which is simulated in Mambe village, leads to grant requirement reductions from 99% to 63% of total project costs. The KMM based on processing cassava root to cassava flour presents more modest results, provided it cannot reduce the grant requirement level below 87%. Finally, the most favorable results are experienced for the MG system in Apapa, due to the integration of the cocoa processing KMM. In this case, the grant requirement level experiences a tremendous reduction from 82% of total project cost to 18%. This implies an attractive business case that can change not only the financing of a specific project, but the MG sector as a whole.
4.4. Sensitivity Analyses
In order to assess influences of parameter variations on our findings, we conducted a set of sensitivity analyses investigating the impact of: (1) the price of diesel, (2) MG tariffs, (3) the cost of capital, (4) project IRR requirements, (5) varying KMM processed product prices, and (6) reductions in MG capital and O&M costs on the overall project economics. Table 5 outlines the ranges for which each parameter has been assessed:
Table 5.
Sensitivity analyses.
We found that under none of the developed scenarios across the sensitivity analyses did any of the four base-case MGs (i.e., without KMM) reach grant requirement levels below 53% of the initial investment. This can be seen across the figures outlined in Appendix B. Among the variables assessed throughout the sensitivity analyses, the first-round MG systems are concluded to be most sensitive to electricity tariff variations, with an increase from 0.33 USD/kWh to 0.86 USD/kWh in the tariff leading to an average grant requirement reduction of 38 percentage points (see Figure A5). Further, we find the simulated MG projects to be particularly sensitive to potential reductions in capital and operational expenditures (see Figure A11). We assessed this sensitivity by repeating the undertaken simulations for a potential 2030 scenario, with the corresponding component cost reductions that are forecasted to take place. In this case, grant requirements of the simulated MGs have resulted in average reductions of 27 percentage points between the 2019 and 2030 scenarios.
The extent to which fluctuations in the price of diesel, required project IRRs and assumed cost of capital alter the shares of subsidies in the overall project financing, although prevalent, have proven to be of lesser significance, with grant requirements varying between 9 and 10 percentage points among the respective best-case and worst-case scenarios (see Figure A5, Figure A7 and Figure A9 in Appendix B, respectively). The role of varying cost of capital is particularly reflected on the optimized MG technical configurations, rather than on the capability to reduce the dependence on grants, with renewable energy fractions increasing as the cost of capital decreases (see Figure A8 in Appendix B). Not even for the lowest assumed cost of capital at 5% is a subsidy-free MG obtained that is able to achieve a project IRR 20%, as outlined in Figure A7 in Appendix B. Furthermore, decreasing the required project IRR to 12% does not substantially alter the share of subsidies of the simulated first-round MGs, with two of the four villages having grant requirement levels above 92% (see Figure A9 in Appendix B).
The extent to which the KMM load positively impacts the MG project’s economics has been clarified further during the sensitivity analysis which aimed to capture seasonal variations in the market prices of KMM processed agricultural products. Even in those cases when the price reduction of the processed product lead to (almost) zero annual net profits for the KMM business (as outlined on Table A6), the grant requirements of the MG integrating the KMM load (without including the additional revenue stream implied by processed product profits), have proven to still be lower than the grant requirements of the respective base-case simulations (without the KMM systems) for the four villages (see Figure A10 in Appendix B in contrast to grant requirements as outlined in Figure 5). While the potential of the KMM profits to positively impact the MG economics are likely to be subject to significant variances across months and years, the positive influence implied by the KMM load is a form of “risk coverage”, as long as it is assumed that this load does not fluctuate in response to changing KMM product market prices. The analysis furthermore shows that the more electrical energy-intensive the selected KMM is, the higher is the drop in grant requirement levels between the base-case scenarios without KMM systems and the case where KMM systems are coupled to the mini-grid project. This pattern applies both, during the preliminary analysis as well as during the sensitivity analysis assuming a market price reduction of the KMM processed product of 20%.
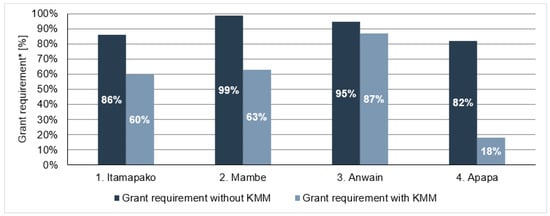
Figure 5.
Grant requirement levels (%) for simulated MGs before and after integrating KMM load to ensure project IRR of 20% at electricity tariffs of 0.56 USD/kWh.
In all cases, however, it is of high importance to correctly select the value chain that is to enable the implementation of the KMM, given the sensitivity of the MG project economics to the KMM project characteristics. As captured in Figure A10, the grant requirement levels of the MG projects increased on average by 27 percentage points from the scenario when the perceived market price of the processed product experienced a reduction of 20% to the scenario when the same product was assumed to experience a 5% increase in relation to the base case scenario prices. Finally, an additional advantage of the KMM-coupled load is its ability to increase the renewable energy fractions of the simulated optimized MGs, as outlined across Figure A3 and Figure A8 of Appendix B. This is expected to be mainly due to the “deferrable load” effect implied by the agro-processing machinery, which across all simulated cases is assumed to run during day-light operation hours, when it is relatively cheaper to produce electricity, and thus contribute to a higher share of the PV system’s installed capacity.
5. Discussion
The outcome of the presented work is necessarily bounded to the Nigerian rural context. To the extent that framework conditions of an alternative region such as macroeconomic context, price of diesel and solar energy potential are comparable to those assessed in this study, the results could be generalized. We coupled the KMM businesses with the respective MGs by assessing the average electrical energy intensities of the assessed agro-processes. In this regard, it is important to note that a lack of literature regarding the energy and water intensities of the analyzed agro-processing value chains has been identified. Hence, the energy intensities used in our study are subject to possible variations. Furthermore, our finding that more electrical energy-intensive KMMs more positively influence the entire mini-grid project economics should be assessed further by comparing value chains that, while having significantly different energy requirements, have similar net profits (in our case, the more electrical energy intensive KMM, cocoa processing, is also the most profitable one).
In our work, a constant KMM load is assumed for the 10 h of operation during daytime. In reality and in spite of a comparable daily power consumption between both approaches, a more accurate assessment would lead to a fluctuating power load across different times of the day, corresponding to the part of the process taking place (peeling, drying, grinding, etc.) at a given time step. A consequence of this simplification is that the stability of the KMM and, in turn, its capability to smoothen the overall village load are possibly overestimated. This effect is mitigated as long as the simulated KMM is of small-scale processing capacity, as has been the case in this work. Additionally, it is worth noting that agricultural crops are known for their high price variability across the year. The financial plans of the respective KMMs have considered an average of the seasonal and off-seasonal market prices. This can be seen as a limitation of our study. To capture this fact, price variations have been assessed in the previously presented sensitivity analysis.
The presented research has assumed constant tariffs across all mini-grid customer categories, while the work could as well be extended to assess the role of cross-subsidization between productive users (e.g., KMM) and household customers in the overall project economics. Further, the conservative approach applied to the financial modelling of this research in regard to inflation indexation of revenue and cost streams ought to be highlighted. While the mini-grid project revenues via the electricity tariffs have been subjected to an assumed inflation rate of 6.5% (to capture the fact that tariffs are generally not adjusted for inflation on a yearly basis but rather adjusted every two to four years), we assumed the operational costs to be subject to the average national inflation rate of 11%, as these variables are understood to be determined by the market. This fact (negatively) affects the project IRRs of the simulated systems in a substantial manner, since the nominal cost streams increase substantially more with time than the nominal revenues do. We have opted for this approach to ensure a conservative estimation given the unpredictability of the Nigerian economic environment. An extension of the sensitivity analysis, part of future work, could assess the role of varying levels of cost and revenue indexing on the obtained IRRs.
A limitation and recommendation for future research would be to perform the analysis by relying on the modified internal rate of return (MIRR) instead of the IRR as well as expanding on the net present value (NPV) analysis. This would be of particular relevance, if the investment in one of the presented projects were to be seriously considered. The logic of setting the focus on the IRR over the NPV is due to the diverging size of the benchmarked projects in terms of energy requirements and the question we aimed to answer [75]. Our research question did not relate to the project that maximizes the value of the investment (i.e., achieving a higher NPV) but rather focused on (relative) reduction potentials for subsidies. The analytical accuracy of MIRR over IRR justifies the analysis to be extended in this regard [76]. At this stage, IRR was selected provided the body of literature this paper aimed to contribute to and benchmark results with generally applies IRR analysis.
6. Conclusions and Outlook
Our aim was to contribute to the body of knowledge regarding current financial viability of mini-grids (MGs) for the purpose of rural electrification of remote areas. Hence, we assessed the potential of newly developed business models such as the KeyMaker Model (KMM) leveraging on the value added of electricity supply in rural areas to positively transform the economics of the MG sector. Unlike alternative business models identified in the literature, the KMMs’ core characteristic resides in its understanding of electrical power not as the end-product but as a means to untap local rural value chains. Effectively, the proposed local business models overstep the rural electricity supply business: they provide management structures and networks to enter a local agro-processing market, thus not only ensuring a reliable off-taker for the farmers’ production (which contributes to their stable incomes throughout the year), but as well an additional revenue stream to the MG operator implied by selling locally processed crops to nearby and foreign markets.
In order to explore the extent to which the KMM impacts the overall MG project economics, we selected four villages in rural Nigeria and two versions of the MG (without and with KMM loads), which we simulated and optimized using HOMER software. The results regarding grant requirement levels for the eight simulated MGs have been subject to sensitivity analyses. In these, we assessed the role that variables such as the price of diesel, established MG electricity tariffs, required project IRRs, cost of capital, potential reductions in MG CAPEX and OPEX and variations in the market price of KMM-processed products have in altering the obtained grant requirement levels for each project. Based on our results, we derive several conclusions as follows:
- High grant requirement levels across all base-case scenarios: Across the first round of simulations (without the KMM), the four MG systems proved to require high grant finance shares between 82% and 99% of total initial capital expenditures (see Figure 5). Our sensitivity analyses underpinned this finding, as none of the first-round MGs simulations throughout reached grant requirement levels below 53%, a case that took place only at a very optimistic electricity tariff of 0.83 USD/kWh (see Figure A5 in Appendix B).
- Potential of KMM to reduce grant requirement levels through two channels: Firstly, net annual profits from the agro-processing KMM business substantially improve the annual cash flows of the MG project. Secondly, the load implied by the KMM’s agro-processing machinery contributes to an increase in the annual electricity sold by the MG. Our analysis verifies that the increase in electricity revenues implied by the KMM load more than off-sets the increase in required initial capital investments to up-scale the MG power generation assets, since both the grant requirements and LCoEs of the second-round simulations across the four villages have significantly decreased in relation to their respective base-case scenarios, as outlined in Figure 4 and Figure 5.
- Relevance to apply well-selected KMMs: Although the KMMs based on palm oil, cassava flour and maize starch processing improve the economics of the MGs, only the cocoa butter/powder business proved to effectively free some of the simulated MGs from external subsidies in the cases (see Figure A5, Figure A9 and Figure A11 in Appendix B).
- Benefit of prioritizing electrical energy intensive KMMs: From the perspective of the MG operator, and unlike initially expected, more electrical energy intensive KMMs impact more positively the overall MG business in relation to KMMs that are not as electricity-intensive. We showed that, due to the positive effect of additional electricity loads, the grant requirement levels of even those second-round simulations having close to zero KMM net profits (see Figure A9 in Appendix B), still proved to be lower than the grant requirements of the respective first-round simulations for the four villages, as outlined in Figure 5.
The presented work concludes that the potential of the KeyMaker Model is certainly high enough so as to encourage further research to assess additional agricultural value chains, as well as to investigate synergies and complementarities between possible KMMs following the seasonality of different crops, and their application of these to other Sub-Saharan countries whose governments are betting on the scale-up of MGs to ensure the electrification of part of their rural population.
Author Contributions
Conceptualization, L.N. and A.P.; Data curation, A.C.; formal analysis, A.C.; methodology, L.N., and A.P.; resources, L.N. and A.P.; software, M.K.; supervision, L.N., and A.P.; validation, L.N. and A.P.; visualization, A.C. and L.N.; writing—original draft, A.C.; writing—review & editing, A.C., L.N., and A.P. All authors have read and agreed to the published version of the manuscript.
Funding
This research received no external funding.
Conflicts of Interest
While one of the authors is currently affiliated with INENSUS GmbH, the work has been conducted as cooperation between TU Berlin and RWTH Aachen University, keeping all scientific standards. At the time that the research was carried out, no author was affiliated with INENSUS GmbH. The authors ensure that the results reflect the outcomes of scientifically sound and unbiased analyses.
Nomenclature
| Abbreviations | |
| AC | Alternating current |
| DC | Direct current |
| i | Interest rate |
| IRR | Internal rate of return |
| KMM | KeyMaker Model |
| MG | Mini-grid |
| MIRR | Modified IRR |
| Indices | |
| d | Demand |
| s | Supply |
| t, T | Time |
| NPC | Net present cost |
| NPV | Net present value |
| O&M | Operation & maintenance |
| OPEX | Operational expenditures |
| SDG | Sustainable development goal |
| WACC | Weighted average cost of capital |
| n, N | Number of components |
| x | MG system component |
| Formula Symbols | |
| CC | Capital investment |
| CS | Capacity shortage |
| CO&M | O&M costs |
| CF | Cost of fuel |
| Ci | Expenditures in interests |
| CGrid | Cost for the distribution grid |
| CRep | Replacement costs |
| EE | Excess electricity |
| h | Hours |
| L | KMM plant load |
| P | Power |
| RS | Revenues from salvage value |
| y | Installed capacity |
| Z | Customer connection |
Appendix A. Background Information
Table A1.
Daily electricity consumption of each customer type across selected villages (kWh).
Table A1.
Daily electricity consumption of each customer type across selected villages (kWh).
| Types of Consumers | 1. Itamapako, Ogun State | 2. Mambe, Niger State | 3. Anwain, Edo State | 4. Apapa South, Oyo State |
|---|---|---|---|---|
| Low-income households | 0.81 | 0.7 | 0.45 | 0.67 |
| Mid-income households | 1.44 | 1.25 | 0.99 | 1.08 |
| High-income households | 2.07 | 1.77 | 1.99 | 2.99 |
| Health centers | 16.34 | |||
| Schools | 9.44 | |||
| Commercial customers (1-phase power supply) | 15.43 | |||
| Productive customers (3-phase power supply) | 24.88 | |||
Table A2.
Mini-grid project cost assumptions.
Table A2.
Mini-grid project cost assumptions.
| Cost Category | Capital Investment (USD/kW) | O&M (USD/kW) | Replacement Costs (USD/kW) | Lifetime (years) |
|---|---|---|---|---|
| Power Generation Assets | ||||
| PV panels and mounting | 493 | 9 | 493 | 25 |
| Lead acid battery [49] | 149 USD/kWh | 21 | 137 | 20 (6879 kWh throughput) |
| Genset | 354 | 13.8 | 354 | 20,000 h |
| Inverter/Converter | 505 | 10 | 505 | 10 |
| Charge Controller | 220 | 4.4 | 220 | 25 |
| Power Distribution Assets | ||||
| Distribution grid (incl. cabling, poles and installation) | 14.98 USD/meter of cabling. 25 m of cabling/customer [50] | 2% of capital investment | Same as capital investment | 20 |
| Customer connections | 14 USD/connection | - | Same as capital investment | 12 |
| Powerhouse [77] | ||||
| Assumed to account for 7% of total initial capital expenditures | ||||
| Auxiliary costs (including wiring, breakers and protection) [77] | ||||
| Assumed to account for 3% of total initial capital expenditures | ||||
| Soft costs (project development, logistics, site-visits, customs duties and taxes) [77] | ||||
| Assumed to account for 20% of total initial capital expenditures, taking into account project development costs of USD 645/kW. | ||||
Table A3.
KMM operational parameters used for the adjustment of the village loads.
Table A3.
KMM operational parameters used for the adjustment of the village loads.
| Prioritized KMM | KMM Operational Days a Week | Operational Months a Year | Operational Days a Year | Yearly Electricity Consumption by KMM (kWh) |
|---|---|---|---|---|
| Cocoa butter/powder | 7 | 5 | 150 | 46,110 |
| Cassava flour | 7 | 10 | 300 | 1296 |
| Pap/Maize starch | 7 | 10 | 300 | 8820 |
| Palm oil | 5 | 12 | 240 | 3072 |
Table A4.
Selected crops’ value chains and market characteristics.
Table A4.
Selected crops’ value chains and market characteristics.
| Palm Oil | Maize Starch (pap) | Cassava Flour | Cocoa Butter/Powder | |
|---|---|---|---|---|
| Crop national market size (million USD) | 1005 [78] | 6000 [65] | 8028 [59,79,80] | 698 [81] |
| National market size (tons) | 1.9 million [78] | 12.1 million [82] | 45 million [83] | 488 thousand [84] |
| Average market price in Nigeria (USD/kg) | 1.56 | 1.46 [66] (assumed 70% of stated price for rural markets) | 0.56 [80,85] | 7.5 (butter) 5.5 (powder) [86] |
| KMM net profit margin (%) | 21% | 13% | 11% | 21% |
| Harvesting season [56] | November–March | Throughout all year | October–August | November–June |
| Yield (tone/ha/year) | Unimproved seed: 0.75–0.13 Improved seed: 0.38–0.45 [87] | 1–5 [88] | 11.7 [79] | 0.35–1.5 [84] |
| Geographical production of crop [56] | South, South-East | Country-wide, focus in Center and North | South and central Nigeria | South-West |
| Import taxes/duties [89] | 10% + 25% levy | 10% | 20% | Prohibition of import |
| Value chain stage of relevance | Crude palm oil production | Pap/ogi processing, animal feed, maize storage | Cassava flour, gari, animal feed, bioethanol. | Bean drying not profitable. Potential in cocoa butter/powder processing. |
| Investment required in machinery per output capacity (USD) | 21,316 (capacity of 2000 litres/day) [90] | 35,222 (capacity of 3 MT/day) [91] | 37,855 (capacity of 3 MT/day) [92] | 37,977 (capacity of 100 kg cocoa bean/hour) [92] |

Figure A1.
Updated livelihood zone map for Nigeria (colours differentiate between predominating crops—see Table A5 for legend). Source: Famine Early Warning Systems Networks (FEWS NET) (2018) [56].
Figure A1.
Updated livelihood zone map for Nigeria (colours differentiate between predominating crops—see Table A5 for legend). Source: Famine Early Warning Systems Networks (FEWS NET) (2018) [56].

Table A5.
Livelihood zone map Nigeria (legend of Figure A1).
Table A5.
Livelihood zone map Nigeria (legend of Figure A1).
 | NG1 | Sokoto millet, cowpeas, groundnuts, and livestock |
 | NG2 | Kano-Katsina Sahelian: millet, sorghum, sesame, and livestock |
 | NG3 | Kano-Katsina sudanian: sorghum, maize, rice, and groundnuts |
 | NG4 | North-east Sahelian: millet, sesame, cowpeas, and livestock |
 | NG5 | Borno-Yobe-Bauchi millet, cowpeas, groundnuts, and sesame |
 | NG6 | Sokoto-Rima-Kano riverine flood plain rice and fishing |
 | NG7 | Komadugu-Yobe irrigated peppers with rice, millet, and vegetables |
 | NG8 | Lake Chad fishing, maize, wheat, cowpeas, and vegetables |
 | NG9 | Chad Basin: masakwa flood-recession sorghum and wheat |
 | NG10 | Hadeija-Nguru wetlands: mixed cereals, vegetables, and fishing |
 | NG11 | North-west sorghum, maize, soybeans, and rice |
 | NG12 | North-west sorghum, maize and cotton with cross-border trade |
 | NG13 | North-west and central maize dominant, sorghum, sweet potatoes, and cowpeas |
 | NG14 | Central sorghum, maize, groundnuts, cowpeas, and sesame |
 | NG15 | North-east maize dominant with rice, cowpeas, soybeans, and groundnuts |
 | NG16 | High plateau Irish potatoes, maize, acha (Digitaria), and livestock |
 | NG17 | Lower plateau rice, sorghum, and cattle |
 | NG18 | Ginger and turmeric with maize, sorghum, yams, and acha (Digitaria) |
 | NG19 | Benue river sugar cane, rice, and sugar estate labor |
 | NG20 | Central yams and maize belt, with cassava, rice, and soybeans |
 | NG21 | Niger and Benue rivers flood plain rice with maize, vegetables, and livestock |
 | NG22 | Cassava dominant with maize, yams, and tree-crops |
 | NG23 | Citrus fruits with tubers, cereals, soybeans, and groundnuts |
 | NG24 | Cocoa dominant with oil palm, cereals, and tubers |
 | NG25 | Mambila highland: cattle, maize, Irish potatoes, tea, coffee, and kola nut |
 | NG26 | Cross river cocoa with oil palm, tubers, rice, and plantain |
 | NG27 | South-east rice dominant with cassava, yams, and oil palm |
 | NG28 | South-west cocoa with oil palm, tubers, and cereals |
 | NG29 | South-west rice, cassava, and cattle with cross border trade |
 | NG30 | Cashews with oil palm, tubers, and maize |
 | NG31 | Lagos Peri-urban: fishing, poultry, piggeries, market gardening, and coconuts |
 | NG32 | Coastal strip and Niger Delta: fishing, cassava, plantain, oil palm, and rubber |
 | NG33 | South-east cassava, cereals, oil palm with extensive off-farm work and trade |
 | NG34 | North-east cattle, small ruminants, food crops with cross-border livestock trade |
 | NG35 | Niger-Benue rivers fishing and food crops |
Appendix B. Graphical Illustrations of the Sensitivity Analyses

Figure A2.
Effect of varying diesel price on grant requirement levels of analyzed mini-grids.
Figure A2.
Effect of varying diesel price on grant requirement levels of analyzed mini-grids.


Figure A3.
Effect of diesel price on renewable energy fractions (%) of analyzed MGs.
Figure A3.
Effect of diesel price on renewable energy fractions (%) of analyzed MGs.


Figure A4.
Effect of varying diesel price on LCoEs of analyzed mini-grids.
Figure A4.
Effect of varying diesel price on LCoEs of analyzed mini-grids.


Figure A5.
Effect of varying mini-grid electricity tariff (USD/kWh) on grant requirement levels for the analyzed mini-grids.
Figure A5.
Effect of varying mini-grid electricity tariff (USD/kWh) on grant requirement levels for the analyzed mini-grids.


Figure A6.
Effect of varying cost of capital on LCoEs of analysed mini-grids.
Figure A6.
Effect of varying cost of capital on LCoEs of analysed mini-grids.


Figure A7.
Effect of cost of capital on grant requirements of analyzed MGs.
Figure A7.
Effect of cost of capital on grant requirements of analyzed MGs.


Figure A8.
Effect of cost of capital on renewable energy fractions (%) of analysed MGs.
Figure A8.
Effect of cost of capital on renewable energy fractions (%) of analysed MGs.


Figure A9.
Effect of varying project IRR on grant requirement levels (%) for the simulated MG systems (pre-KMM and KMM) in each village.
Figure A9.
Effect of varying project IRR on grant requirement levels (%) for the simulated MG systems (pre-KMM and KMM) in each village.

Table A6.
Variation in KMM annual net profits with a 20% decrease and 5% increase in processed products’ market price. (Thousand $).
Table A6.
Variation in KMM annual net profits with a 20% decrease and 5% increase in processed products’ market price. (Thousand $).
| Assuming 20% Decrease in Price | Original Price | Assuming 5% Increase in Price | |
|---|---|---|---|
| Itamapako (palm oil) | 4.7 | 14.5 | 16.9 |
| Mambe (maize starch/ogi) | 311 | 10.5 | 13 |
| Anwain (cassava flour) | 0 | 3.3 | 4.4 |
| Apapa (cocoa butter/powder) | 17 | 38 | 43.2 |

Figure A10.
Impact of varying KMM product market prices on MG grant requirements (%).
Figure A10.
Impact of varying KMM product market prices on MG grant requirements (%).


Figure A11.
Impact of cost reductions in CAPEX and OPEX by 2030 on grant requirement levels (%) of simulated mini-grids.
Figure A11.
Impact of cost reductions in CAPEX and OPEX by 2030 on grant requirement levels (%) of simulated mini-grids.

References
- Jammi, R.; Sanghvi, A.; Toba, N.; Hamaguchi, K.; Li, Y. Reliable and Affordable Off-Grid Electricity Services for the Poor: Lessons from World Bank Group Experience. In IEG Learning Product; International Bank for Reconstruction and Development: Washington, DC, USA, 2016; Available online: http://documents.worldbank.org/curated/en/360381478616068138/pdf/109573-WP-PUBLIC.pdf (accessed on 19 October 2019).
- Ellman, D. The Reference Electrification Model: A Computer Model for Planning Rural Electricity Access. Master′s Thesis, Massachusetts Institute of Technology, Cambridge, MA, USA, 2015. Available online: https://dspace.mit.edu/bitstream/handle/1721.1/98551/920674644-MIT.pdf?sequence=1&isAllowed=y (accessed on 28 November 2020).
- Yakubu, A.; Sherwood, A.; Olu, G. Mini-Grid Investment Report: Scaling the Nigerian Market; Rocky Mountain Institute: Basalt, CO, USA, 2018. [Google Scholar]
- Africa, E. Opportunities and Challenges in the Mini-Grid Sector in Africa: Lessons Learnt from the EEP Portfolio; EEP Africa: Hatfield, South Africa, 2018. [Google Scholar]
- Cohn, L. Seeking the Right Business Model for Sub-Saharan Africa’s $11B Mini-Grid Opportunity; Microgrid Knowledge: Westborough, MA, USA, 2018. [Google Scholar]
- Bank, E.W. Mini-Grids for Half a Billion People: Market Outlook and Handbook; World Bank: Washington, DC, USA, 2019; Available online: https://openknowledge.worldbank.org/bitstream/handle/10986/31926/Mini-Grids-for-Half-a-Billion-People-Market-Outlook-and-Handbook-for-Decision-Makers-Executive-Summary.pdf?sequence=1&isAllowed=y (accessed on 25 June 2019).
- Trimble, C.; Kojima, M.; Perez Arroyo, I.; Mohammadzadeh, F. Financial Viability of Electricity Sectors in Sub-Saharan Africa: Quasi-Fiscal Deficits and Hidden Costs; World Bank: Washington, DC, USA, 2016; Available online: http://documents.worldbank.org/curated/en/182071470748085038/pdf/WPS7788.pdf (accessed on 8 September 2019).
- Kojima, M.; Trimble, C. Making Power Affordable for Africa and Viable forIits Utilities; World Bank: Washington DC, USA, 2016; Available online: http://documents.worldbank.org/curated/en/293531475067040608/pdf/108555-Revised-PUBLIC-Making-power-affordable-for-Africa-and-viable-for-its-utilities-Oct-2016.pdf (accessed on 8 September 2019).
- IEA. World Energy Outlook; International Energy Agency: Paris, France, 2019. Available online: https://www.iea.org/reports/world-energy-outlook-2019 (accessed on 1 March 2020).
- Bhattacharyya, S.C. Business Issues for Mini-Grid-Based Electrification in Developing Countries. In Green Energy and Technology, Mini-Grids for Rural Electrification of Developing Countries; Link, S., Ed.; Springer: Cham, Switzerland, 2014; pp. 145–164. Available online: https://link.springer.com/chapter/10.1007/978-3-319-04816-1_7 (accessed on 28 November 2020).
- Safdar, T. Business Models for Mini-Grids—Technical Report 9; Smart Villages Initiative: Cambridge, UK, 2017; Available online: https://e4sv.org/wp-content/uploads/2017/05/TR9.pdf (accessed on 4 April 2017).
- Gaudchau, E.; Gerlach, A.K.; Wasgindt, V.; Breyer, C. Business models for renewable energy based mini-grids in non-electrified regions. In Proceedings of the 28th European Photovoltaic Solar Energy Conference, Paris, France, 4 October 2013; Available online: https://reiner-lemoine-institut.de/wp-content/publications/1_Business_models_renewable_energy_minigrids/Gaudchau2013a.pdf (accessed on 28 November 2020).
- Muceka, R.; Kukeera, T.; Alokore, Y.; Kebir, N. Integrating a Solar PV System with a Household Based Backup Generator for Hybrid Swarm Electrification: A Case Study of Nigeria. In Africa-EU Renewable Energy Research and Innovation Symposium 2018 (RERIS 2018); Springer International Publishing: New York, NY, USA; Available online: https://www.researchgate.net/publication/326523703_Integrating_a_Solar_PV_System_with_a_Household_Based_Backup_Generator_for_Hybrid_Swarm_Electrification_A_Case_Study_of_Nigeria_23-26_January_2018_National_University_of_Lesotho_On_occasion_of_NULISTIC (accessed on 28 November 2020).
- Groh, S.; Philipp, D.; Lasch, B.E.; Kirchhoff, H. Swarm Electrification: Investigating a Paradigm Shift Through the Building of Microgrids Bottom-up. In Decentralized Solutions for Developing Economies, March 2015 ed.; Springer: Berlin/Heidelberg, Germany, 2015; Available online: https://www.researchgate.net/publication/268211414_Swarm_Electrification_Investigating_a_Paradigm_Shift_Through_the_Building_of_Microgrids_Bottom-up (accessed on 28 November 2020).
- Lovin, E.; Dougherty, J.; Davies, G.; Mburu, C.; Tilleard, M. Low Energy Consumption = Unprofitable Mini-Grids. Is Appliance Financing the Answer? Available online: https://nextbillion.net/mini-grids-and-appliance-financing/ (accessed on 28 November 2020).
- Graber, S.; Mong, P.; Sherwood, J. Under the Grid: Improving the Economics and Reliability of Rural Electricity Service with Undergrid Minigrids; Rocky Mountain Institute: Basalt, CO, USA, 2018; Available online: https://rmi.org/insight/under-the-grid/ (accessed on 3 May 2019).
- Kyriakarakos, G.; Balafoutis, A.T.; Bochtis, D. Proposing a Paradigm Shift in Rural Electrification Investments in Sub-Saharan Africa through Agriculture. Sustainability 2020, 12, 3096. [Google Scholar] [CrossRef]
- Haney, A.; Stritzke, S.; Trotter, P.; Puranasamriddhi, A.; Madhlopa, A.; Batidzirai, B.; Twesigye, P.; Moyo, A.; Walter, M.; Kovandova; et al. Electricity for integrated rural development. The role of businesses, the public sector and communities in Uganda and Zambia. In Project RISE Practitioner Report 2019; Smith School University of Oxford: Oxford, UK, 2019; Available online: https://www.smithschool.ox.ac.uk/publications/reports/Smith-School-RISE-Report-final.pdf (accessed on 28 November 2020).
- Fuentes-Cortés, L.F.; Ponce-Ortega, J.M. Optimal design of energy and water supply systems for low-income communities involving multiple-objectives. Energy Convers. Manag. 2017, 151, 43–52. [Google Scholar] [CrossRef]
- Winklmaier, J.; Bazan Santos, S. Promoting Rural Electrification in Sub-Saharan Africa: Least-Cost Modelling of Decentralized Energy-Water-Food Systems: Case Study of St. Rupert Mayer, Zimbabwe. In Africa-EU Renewable Energy Research and Innovation Symposium 2018 (RERIS 2018); Springer International Publishing: New York, NY, USA; pp. 71–89. Available online: https://link.springer.com/chapter/10.1007/978-3-319-93438-9_6 (accessed on 28 November 2020).
- Aresti, M.; Barclay, A.; Cherubini, P. Rethinking Access to Energy Business Models: Ways to Walk the Food-Energy-Nexus Talk in Sub-Saharan Africa; Res4Africa Foundation: Rome, Italy, 2019; Available online: https://www.res4africa.org/wp-content/uploads/2019/12/RES4Africa-RE-thinking-Access-to-Energy-Business-Models.pdf (accessed on 28 November 2020).
- González Grandón, T.D.; Peterschmidt, N. INENSUS GmbH, E4I, SE4A, SEFA. In KeyMaker Model Fundamentals; AFDB: Berlin, Germany, 2019. [Google Scholar]
- Okunlola, A.; Evbuomwan, O.; Zaheer, H.; Winklmaier, J. Assessment of decentralized hybrid mini-grids in Sub- Saharan Africa: Market analysis, Least-cost modelling, and Job creation analysis. In Africa-EU Renewable Energy Research and Innovation Symposium 2018 (RERIS 2018); Springer International Publishing: New York, NY, USA, 2018; pp. 21–34. [Google Scholar]
- Thamae, L.Z. Simulation and Optimization of Renewable Energy Hybrid Power System for Semonkong, Lesotho. In Africa-EU Renewable Energy Research and Innovation Symposium 2018 (RERIS 2018); Springer Science and Business Media LLC: Berlin, Germany, 2018; pp. 105–115. Available online: https://www.researchgate.net/publication/326526359_Simulation_and_Optimization_of_Renewable_Energy_Hybrid_Power_System_for_Semonkong_Lesotho_23-26_January_2018_National_University_of_Lesotho_On_occasion_of_NULISTICE_2018 (accessed on 28 November 2020).
- Nerini, F.F.; Broad, O.; Mentis, D.; Welsch, M.; Bazilian, M.; Howells, M. A cost comparison of technology approaches for improving access to electricity services. Energy 2015, 95, 255–265. [Google Scholar] [CrossRef]
- Franz, M.; Peterschmidt, N.; Rohrer, M.; Kondev, B. Mini-Grid Policy Toolkit: Policy and Business Frameworks for Successful Mini-Grid Roll-Outs. REN21. September 2014. Available online: https://www.ren21.net/Portals/0/documents/Resources/MGT/MinigridPolicyToolkit_Sep2014_EN.pdf (accessed on 28 November 2020).
- Yang, F.; Yang, M. Rural electrification in sub-Saharan Africa with innovative energy policy and new financing models. Mitig. Adapt. Strateg. Glob. Chang. 2018, 23, 933–952. [Google Scholar] [CrossRef]
- Steurer, E.; Manatsgruber, D.; Jouégo, E.P. Risk Clustering as a Finance Concept for Rural Electrification in Sub-Saharan Africa to Attract International Private Investors. Energy Procedia 2016, 93, 183–190. [Google Scholar] [CrossRef][Green Version]
- Malhotra, A.; Schmidt, T.S.; Haelg, L.; Waissbein, O. Scaling up finance for off-grid renewable energy: The role of aggregation and spatial diversification in derisking investments in mini-grids for rural electrification in India. Energy Policy 2017, 108, 657–672. [Google Scholar] [CrossRef]
- Schmidt, O.; Hawkes, A.; Gambhir, A.; Staffell, I. The future cost of electrical energy storage based on experience rates. Nat. Energy 2017, 2, 17110. [Google Scholar] [CrossRef]
- Agajelu, B.; Ekwueme, G.; Obuka, O.; Nnaemeka, S.P.; Ikwu, G.O.R. Life Cycle Cost Analysis of a Diesel/Photovoltaic Hybrid Power Generating System. Ind. Eng. Lett. 2013, 3, 19–30. [Google Scholar]
- Tao, J.Y.; Finenko, A. Moving beyond LCOE: Impact of various financing methods on PV profitability for SIDS. Energy Policy 2016, 98, 749–758. [Google Scholar] [CrossRef]
- Raisch, V. Financial Assessment of Mini-grids Based on Renewable Energies in the Context of the Ugandan Energy Market. Energy Procedia 2016, 93, 174–182. [Google Scholar] [CrossRef]
- Bhattacharyya, S.C. Mini-grid based electrification in Bangladesh: Technical configuration and business analysis. Renew. Energy 2015, 75, 745–761. [Google Scholar] [CrossRef]
- Keeley, A.R. The importance of financial cost for renewable energy projects: Economic viability assessment of renewable hybrid mini-grid systems in Indonesia. Green Financ. AIMS 2019, 1, 139–155. [Google Scholar] [CrossRef]
- REA. On-Grid and Off-Grid Electrical Infrastructure Nigeria. Available online: http://database.rea.gov.ng/ (accessed on 28 November 2020).
- Nigerian Energy Support Programme (NESP). Federal Ministry of Power, Works and Housing. MFG Nigeria Integration. INTEGRATION Environment & Energy GmbH, Reiner Lemoine Institut gGmbH. Available online: http://mgf-nigeria.integration.org/# (accessed on 28 November 2020).
- HOMER Energy. HOMER Pro. Available online: https://www.homerenergy.com/products/pro/index.html (accessed on 28 November 2020).
- Bhagavathy, S.; Pillai, G. PV Microgrid Design for Rural Electrification. Designs 2018, 2, 33. [Google Scholar] [CrossRef]
- Domenech, B.; Ferrer-Martí, L.; Pastor, R. Comparison of various approaches to design wind-PV rural electrification projects in remote areas of developing countries. Wiley Interdiscip. Rev. Energy Environ. 2018, 8, e332. [Google Scholar] [CrossRef]
- Lian, J.; Zhang, Y.; Ma, C.; Yang, Y.; Chaima, E. A review on recent sizing methodologies of hybrid renewable energy systems. Energy Convers. Manag. 2019, 199, 112027. [Google Scholar] [CrossRef]
- Fioriti, D.; Giglioli, R.; Poli, D.; Lutzemberger, G.; Micangeli, A.; Del Citto, R.; Perez-Arriaga, I.; Duenas-Martinez, P. Stochastic sizing of isolated rural mini-grids, including effects of fuel procurement and operational strategies. Electr. Power Syst. Res. 2018, 160, 419–428. [Google Scholar] [CrossRef]
- Olaniyan, K.; McLellan, B.C.; Ogata, S.; Tezuka, T. Estimating Residential Electricity Consumption in Nigeria to Support Energy Transitions. Sustainability 2018, 10, 1440. [Google Scholar] [CrossRef]
- Olatomiwa, L.; Mekhilef, S.; Huda, A.; Ohunakin, O.S. Economic evaluation of hybrid energy systems for rural electrification in six geo-political zones of Nigeria. Renew. Energy 2015, 83, 435–446. [Google Scholar] [CrossRef]
- Reber, T.; Booth, S.; Cutler, D.; Li, X.; Salasovich, J. Tariff Considerations for Micro-Grids in Sub-Saharan Africa; NREL: Golden, CO, USA, February 2018. Available online: https://www.nrel.gov/docs/fy18osti/69044.pdf (accessed on 6 April 2019).
- National Bureau of Statistics (NBS). General Household Survey, Panel 2015–2016; World Bank: Washington, DC, USA, 2016. Available online: https://microdata.worldbank.org/index.php/catalog/2734 (accessed on 3 May 2016).
- Feuss, C. Interview with Christopher Feuss. In Mini-Grid Expert at INENSUS; INENSUS GmbH: Goslar, Germany, 2019. [Google Scholar]
- Krebsbach, T. Interview with Thomas Krebsbach. In Mini-Grid Expert at INENSUS; INENSUS GmbH: Goslar, Germany, 2019. [Google Scholar]
- Surrette Rolls 6-CS-25PS 1150Ah, 6 V Deep Cycle Battery, Webosolar. 2019. Available online: https://webosolar.com/store/en/deep-cycle-batteries/993-surrette-rolls-6-cs-25ps-1150-ah-6-volt-deep-cycle-battery.html (accessed on 3 May 2019).
- Ohiare, S. Expanding electricity access to all in Nigeria: A spatial planning and cost analysis. Energy Sustain. Soc. 2015, 5, 8. [Google Scholar] [CrossRef]
- Nigeria Data Portal. Selected Food Prices. March 2019. Available online: http://nigeria.opendataforafrica.org/gjskat/selected-food-prices-watch-march-2019?state=1000000 (accessed on 28 November 2020).
- Stears News Limited. Why are interest rates in Nigeria so high. In StearsBusiness; Stears Business: Lagos, Nigeria, 2019. [Google Scholar]
- XE Currency Converter. Available online: https://www.xe.com/currencyconverter/convert/?Amount=1&From=USD&To=NGN (accessed on 28 November 2020).
- FEWS Network, Nigeria Price Bulletin May 2019. Famine Early Warning Systems Network. May 2019. Available online: http://fews.net/sites/default/files/documents/reports/Nigeria_2019_05_PB.pdf (accessed on 30 May 2019).
- Trading Economics. Nigeria Sales Tax Rate—VAT. Available online: https://tradingeconomics.com/nigeria/sales-tax-rate (accessed on 28 November 2020).
- FEWS NET. Revised Livelihoods Zone Map and Descriptions for Nigeria, Famine Early Warning Systems Network. September 2018. Available online: http://fews.net/sites/default/files/documents/reports/Nigeria_LH_zoning_report_09_2018.pdf (accessed on 8 April 2019).
- Nwadiaru, O.V. Interview with Ogechi Vivian Nwadiaru. In Researcher at Microenergy International Conference; MicroEnergy International GmbH: Berlin, Germany, 2019. [Google Scholar]
- Chiroma, M. Online Interview with Muhammad Chiroma, Berlin, Germany and Kano, Nigeria. 2019. [Google Scholar]
- Agricdemy. Cassava Processing in Nigeria. Available online: https://agricdemy.com/post/cassava-processing-nigeria (accessed on 8 May 2018).
- Company, F.D. Domestic Commodity Prices; Prices, D.C., Ed.; Financial Derivatives Company: Lagos, Nigeria, 2017. [Google Scholar]
- Abdulquadri, B.; Mohammed, T.; Daramola, R.B. Profitability Assessment of Value Addition of Cocoa by Farmers in Osun State. World J. Agric. Sci. 2017, 13, 179–184. [Google Scholar] [CrossRef]
- Olumo Foods. 2019. Available online: https://www.olumofoods.co.uk/catalogsearch/result/index/?p=3&q=nigeria (accessed on 31 May 2019).
- SME Market Hub. Tilapia. Hub. 2019. Available online: https://www.smemarkethub.com/stores/meatdistrictnigeria/products/197920/fresh-tilapia-fish/ (accessed on 7 May 2019).
- Pure Cocoa Powder, Nigeria Tradekey. 2019. Available online: https://nigeria.tradekey.com/cocoa-powder.htm (accessed on 15 June 2019).
- Okojie, J. Nigeria′s Maize Industry Valued at $6 bn; Business Day: Lagos, Nigeria, 2017; Available online: https://businessday.ng/agriculture/article/nigerias-maize-industry-valued-6bn/ (accessed on 31 May 2019).
- JIJI. 2 kg Fresh Raw Pap. In White Corn, Lagos State, Nigeria. 2019. Available online: https://jiji.ng/amuwo-odofin/meals-and-drinks/2kg-fresh-raw-pap-in-white-corn-12146495.html?lid=O7gr0kshWbTT1EgP&cur_pos=7&pos=7&ads_count=17&ads_per_page=17&page=1. (accessed on 2 June 2019).
- Nigeria, S. Munro Corn Flour 350 g. 2019. Available online: https://www.supermart.ng/product/munro-corn-flour-350-g. (accessed on 2 June 2019).
- TRIDGE. Catfish Nigeria. Available online: https://www.tridge.com/intelligences/catfish/price (accessed on 7 May 2019).
- FAO. Tilapia Markets in Sub-Saharan Africa; Food and Agriculture Organization of the United Nations: Rome, Italy, 2015. [Google Scholar]
- Yusniati; Parinduri, L.; Sulaiman, O.K. Biomass analysis at palm oil factory as an electric power plant. J. Phys. Conf. Ser. 2018, 1007, 012053. [Google Scholar] [CrossRef]
- Galitsky, C.; Worrell, E.; Ruth, M. Energy Efficiency Improvement and Cost Saving Opportunities for the Corn Wet Milling Industry; Energy Star: Berkeley, CA, USA, 2003. Available online: https://www.energystar.gov/sites/default/files/buildings/tools/LBNL-52307.pdf (accessed on 15 June 2019).
- FAO. Fruit and Vegetable Processing, FAO. 2009. Available online: http://www.fao.org/3/al177e/al177e.pdf (accessed on 15 April 2009).
- Adeyemi, A.; Ogunsina, A. Direct energy utilization in the processing of cocoa beans into powder. Agric. Eng. Int. 2017, 19, 213–218. [Google Scholar]
- Jekayinfa, S.; Olajide, J. Analysis of energy usage in the production of three selected cassava-based foods in Nigeria. J. Food Eng. 2007, 82, 217–226. [Google Scholar] [CrossRef]
- El-Tahir, Y.; El-Otaibi, D. Internal Rate of Return: A suggested Alternative Formula and its Macro-economics Implications. J. Am. Sci. 2014, 10, 216–221. [Google Scholar]
- Rangel, A.d.S.; de Souza Santos, J.C.; Savoia, J.R.F. Modified Profitability Index and Internal Rate of Return. J. Int. Bus. Econ. 2016, 4, 13–18. [Google Scholar] [CrossRef]
- Arranz-Piera, P. PV Minigrid Cost Benchmark Study; ESMAP World Bank: Washington, DC, USA, 2017. [Google Scholar]
- Anudu, O. Palm Oil Makers in Aggressive Expansion to Close N152bn Supply Gap; Business Day: Lagos, Nigeria, 18 April 2019; Available online: https://businessday.ng/lead-story/article/palm-oil-makers-in-aggressive-expansion-to-close-n152bn-supply-gap/ (accessed on 31 May 2019).
- Anyanwu, C.N.; Ibeto, C.N.; Ezeoha, S.L.; Ogbuagu, N.J. Sustainability of cassava (Manihot esculenta Crantz) as industrial feedstock, energy and food crop in Nigeria. Renew. Energy 2015, 81, 745–752. [Google Scholar] [CrossRef]
- JIJI. Cassava Flours in Nigeria. 2019. Available online: https://jiji.ng/287-flour/cassava (accessed on 1 April 2019).
- PricewaterhouseCoopers, Transforming Nigeria′s Agricultural Value Chain, Price Water Coopers. 2017. Available online: https://www.pwc.com/ng/en/assets/pdf/transforming-nigeria-s-agric-value-chain.pdf (accessed on 30 April 2019).
- Ater, P.I.; Aye, G.C.; Daniel, A. Analysis of Maize Value Addition among Entrepreneurs in Taraba State, Nigeria. Int. J. Environ. Agric. Biotechnol. 2018, 3, 2011–2019. [Google Scholar] [CrossRef]
- Nigeria, A. Cassava. Agriculture Nigeria. Available online: https://agriculturenigeria.com/farming-production/crop-production/crops/cassava (accessed on 5 April 2019).
- Pind Foundation. Characteristics of the Nigerian Cocoa Industry—FACTSHEET. Available online: https://pindfoundation.org/characteristics-of-the-nigerian-cocoa-industry/ (accessed on 28 November 2020).
- Olawoyin, O. How Technology Can Boost Nigeria’s Untapped Cassava Wealth; Premium Times: Lagos, Nigeria, 12 January 2019; Available online: https://www.premiumtimesng.com/business/business-interviews/305345-how-technology-can-boost-nigerias-untapped-cassava-wealth.html (accessed on 31 May 2019).
- Sterk, R. New York cocoa bean futures at eight-year lows. Food Business News. 22 February 2017. Available online: https://www.foodbusinessnews.net/articles/10460-new-york-cocoa-bean-futures-at-eight-year-lows (accessed on 31 May 2019).
- PIND. A scoping Study on Palm Oil Value Chain inRivers and Imo States, Nigeria; Foundation for Partnership Initiatives in the Niger Delta (PIND): Abuja, Nigeria, 2012; Available online: https://www.ndpifoundation.org/wp-content/uploads/2018/09/Introducing-the-Palm-Oil-Scoping-Study.pdf (accessed on 2 April 2019).
- GIZ. Value Chains at a Glimpse: Country module Nigeria; Federal Ministry for Agriculture and Rural Development. Available online: https://www.share4dev.info/fmard/documents/5249.pdf (accessed on 10 May 2019).
- Federal Government of Nigeria. Nigeria Customs Service. Available online: https://customs.gov.ng/?page_id=3075 (accessed on 25 May 2019).
- FIIRO. Machinery and Equipment for Production of Palm Oil (2000 Litre/Day). Available online: http://www.fiiro.org/index.php/services/cost-of-machinery-equipment-for-technologies/329-machinery-and-equipment-for-production-of-palm-oil-2-000l-day?highlight=WyJwYWxtIiwicGFsbXMiLCJvaWwiLCJvaWxzIiwicGFsbSBvaWwiXQ==] (accessed on 28 November 2020).
- FIIRO. Machinery and Equipment for Corn Starch Production (3 Tonnes/Day). Available online: http://www.fiiro.gov.ng/index.php/services/cost-of-machinery-equipment-for-technologies/348-machinery-and-equipment-for-corn-starch-production-3tonnes-day (accessed on 16 May 2019).
- FIIRO. Machinery and Equipment for Cassava Flour Production (3 Tonnes/Day). Available online: http://www.fiiro.org/index.php/services/cost-of-machinery-equipment-for-technologies/295-machinery-and-equipment-for-cassava-flour-production-3-tonnes-day?highlight=WyJjYXNzYXZhIiwiZmxvdXIiLCJmbG91cnMiLCJjYXNzYXZhIGZsb3VyIl0=] (accessed on 16 May 2019).


Publisher’s Note: MDPI stays neutral with regard to jurisdictional claims in published maps and institutional affiliations. |
© 2020 by the authors. Licensee MDPI, Basel, Switzerland. This article is an open access article distributed under the terms and conditions of the Creative Commons Attribution (CC BY) license (http://creativecommons.org/licenses/by/4.0/).