Frictional Properties and Seismogenic Potential of Caprock Shales

 ,
,  ,
,
Abstract
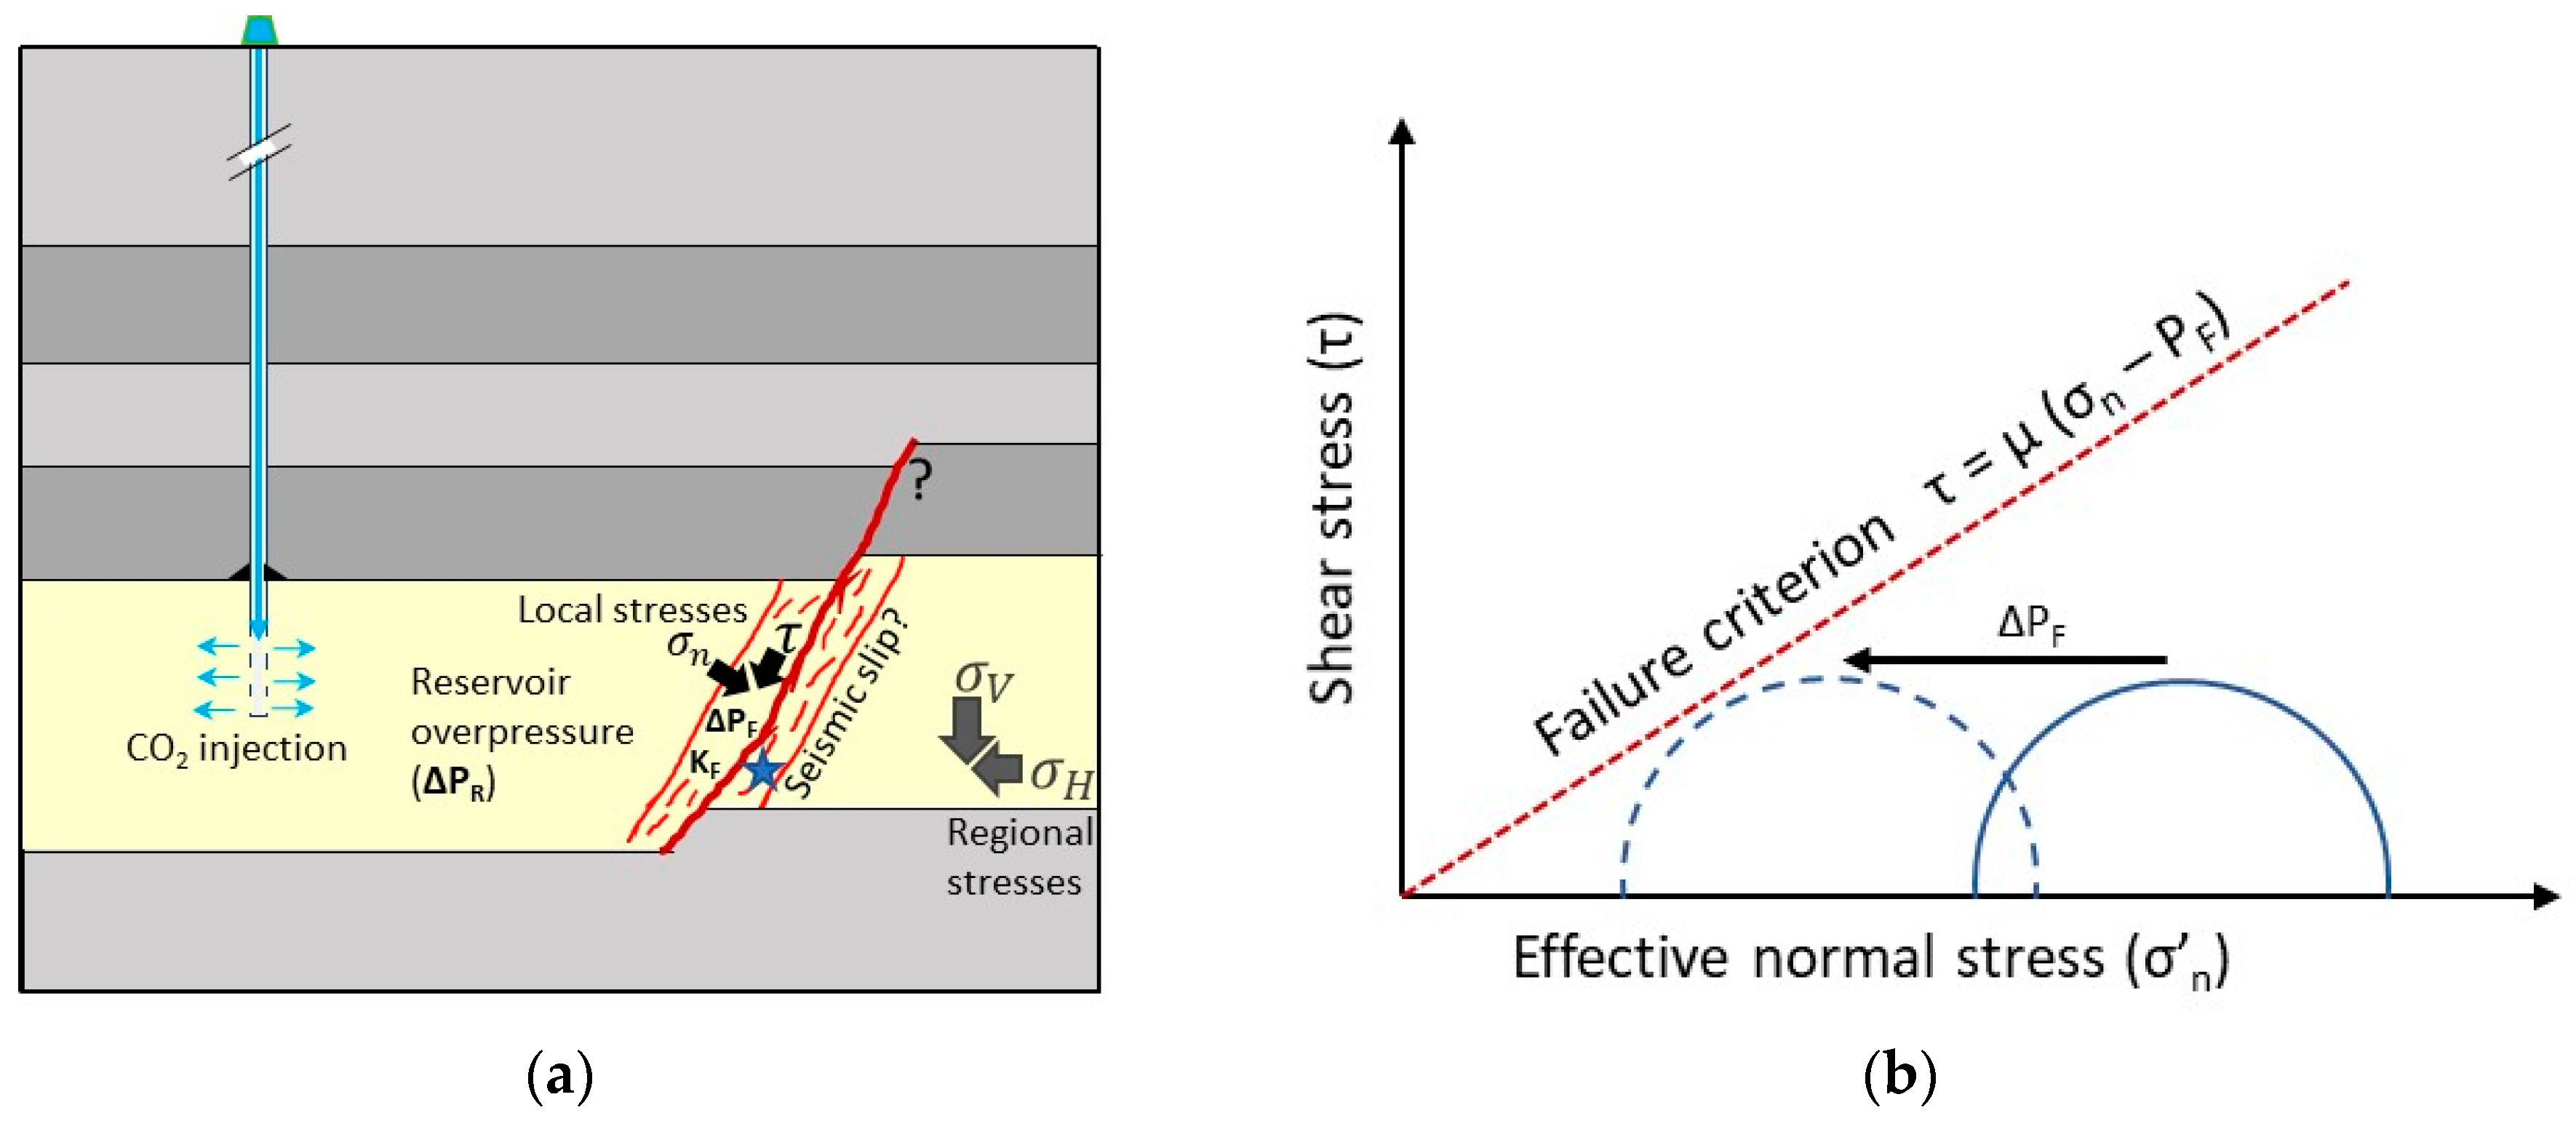
:1. Introduction
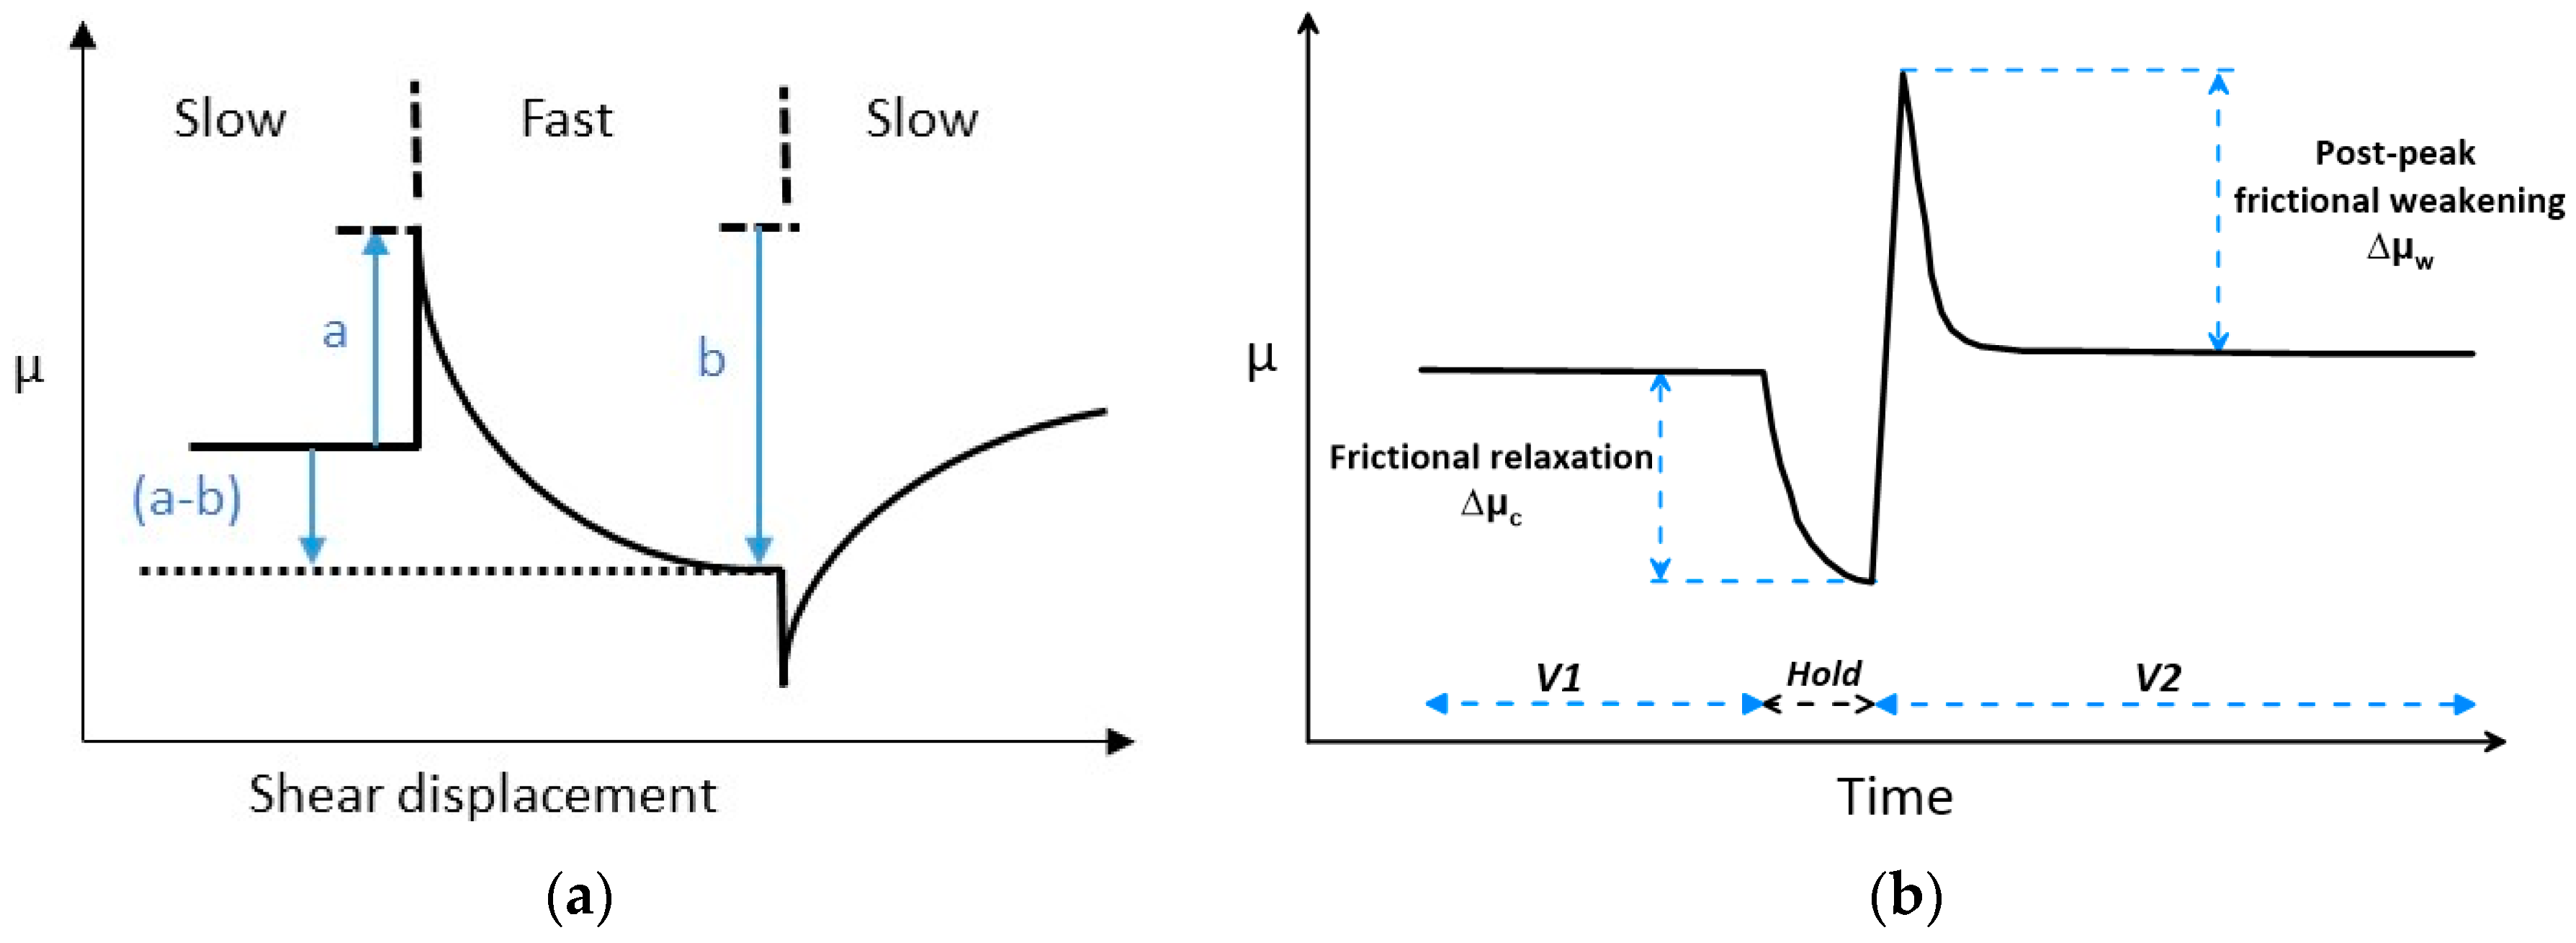
2. Rate and State Friction Law
3. Material and Methods
3.1. Test Samples
3.2. Test Procedure
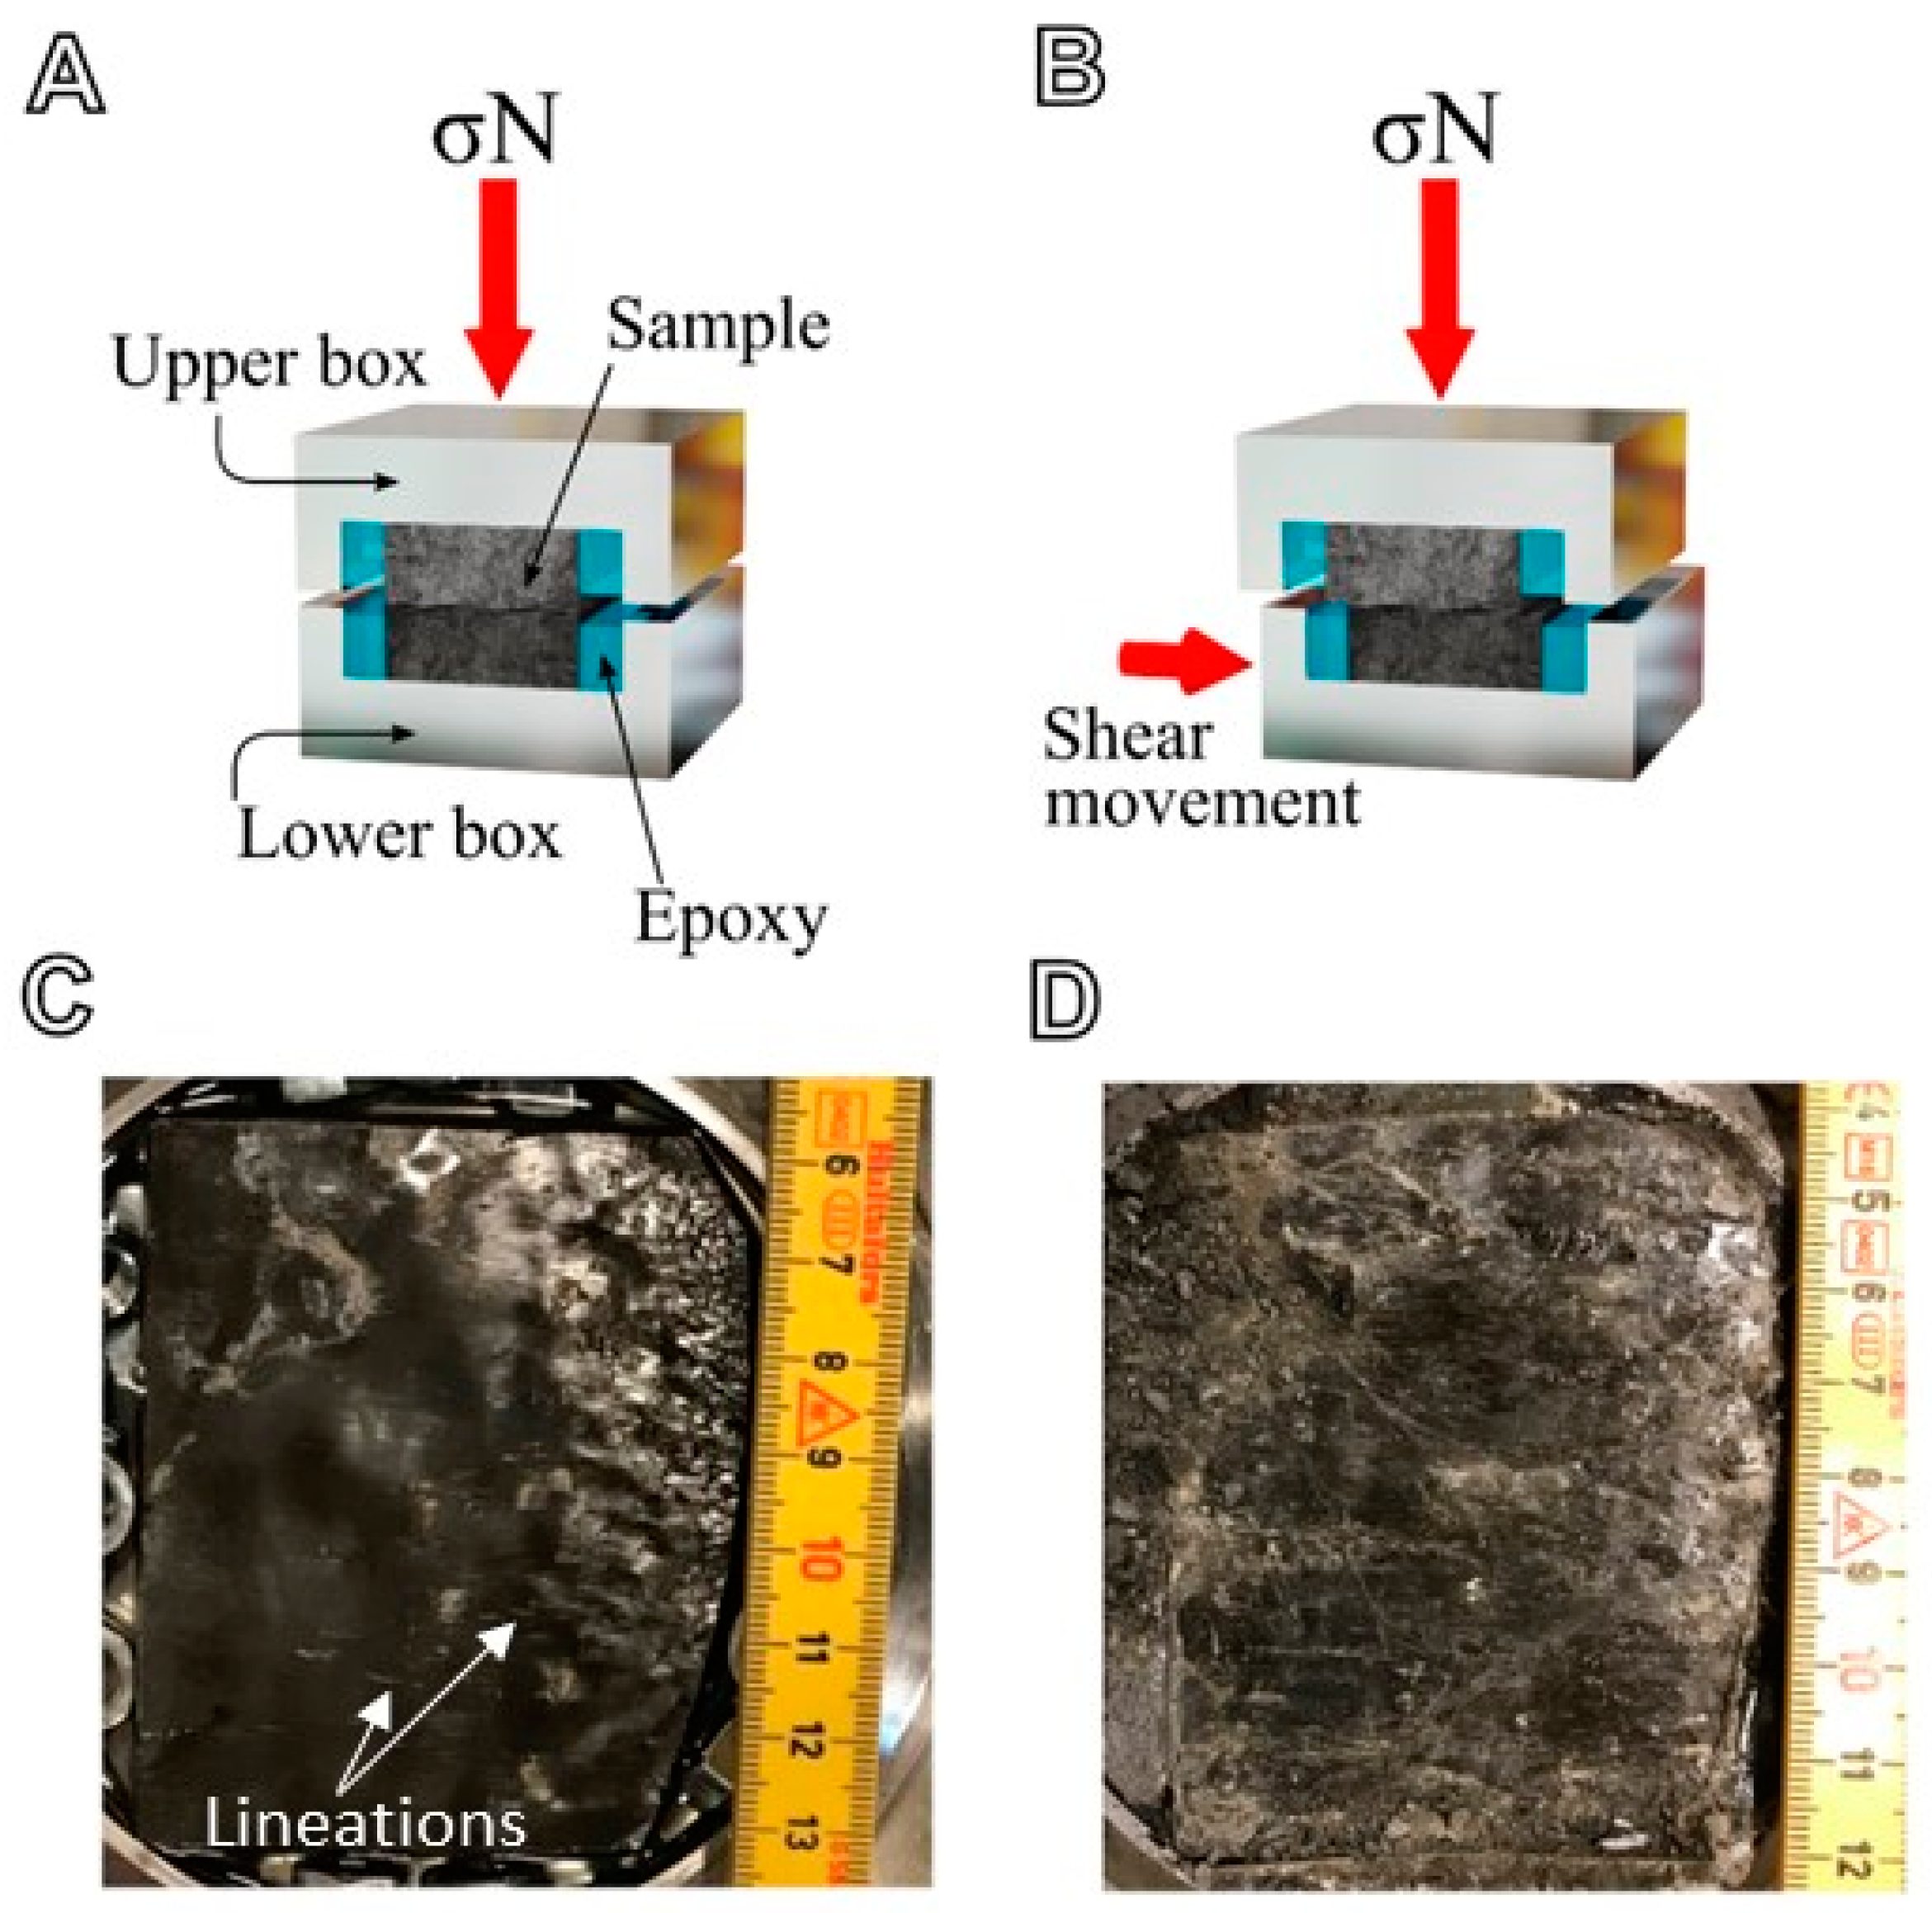
- Mounting specimen in shear box: The prepared bottom and top parts of the specimens were cast into the bottom and top boxes of the shear apparatus using a composite epoxy. The shear box was assembled to fit the two parts of the specimen together. The epoxy was allowed to cure for 24 h. During the curing period, the specimens were covered with a thin layer of plastic and oil to avoid drying. An unconfined gap of approximately 8 mm was allowed between the top and bottom boxes. The specimens were prepared and inserted into the shear box so that fracture plane was near-horizontal and located at the mid-height of the unconfined gap. This ensured that the fracture could slide freely along the horizontal plane during shearing (Figure 4).
- Application of normal load and sample seating: The normal load or stress applied to the specimens was estimated based on the representative normal stress acting on fractures at in situ conditions. A pre-loading phase was included in the shear tests to assure good seating of the two parts of the specimens. For this, the normal stress was increased to around 10% of the unconfined compressive strength of the intact material. The load was then decreased, before reloading to the target normal load.
- Velocity-stepping and slide-hold-slide (SHS) shear tests: General procedures for velocity-stepping and SHS tests are described in [5,6,12,41]. The specific procedure followed for Draupne and Rurikfjellet tests are described below:
- For both Draupne samples (DST15 and DST17), the test procedure was a combination of velocity-stepping and slide-hold-slide testing. Following application of a normal load (for DST15) and normal stress (for DST17), an initial shearing phase was conducted at a low shear velocity. Next, shearing was stopped for a given time period before re-shearing at a different velocity. The hold-time periods between shearing phases were constant for each test; 2 min for DST15 and 5 min for DST17. This is different to the regular SHS test procedure [12], where the duration of hold-time is changed during the test.
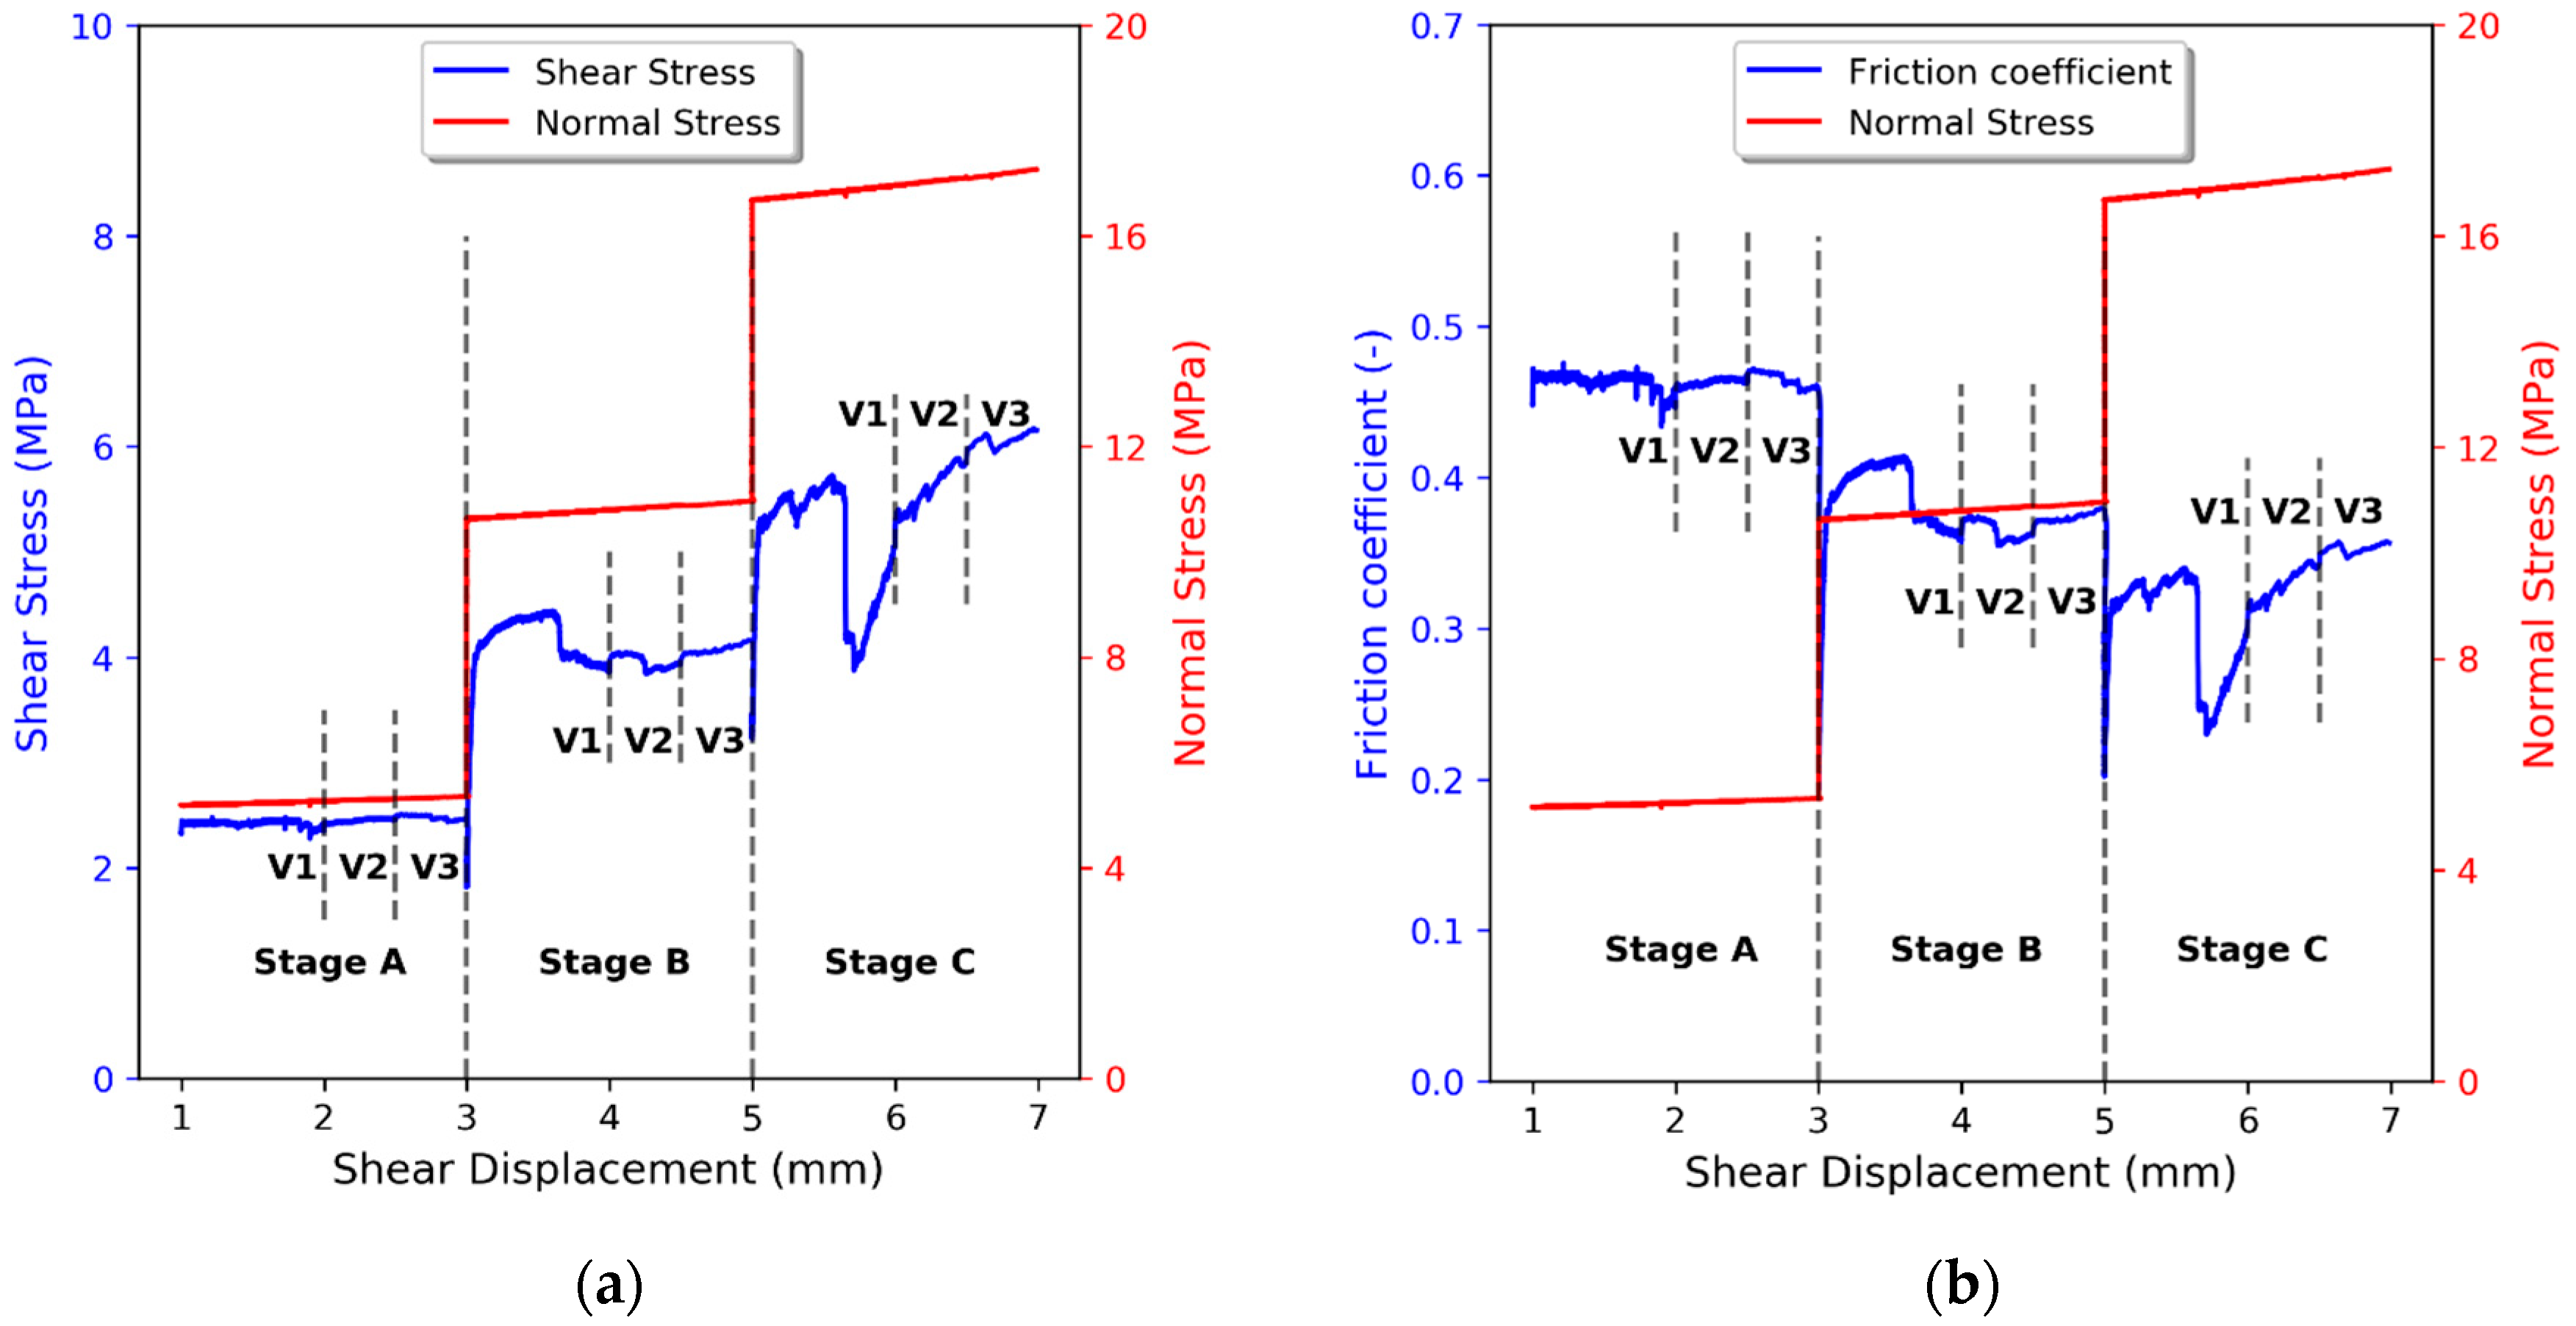
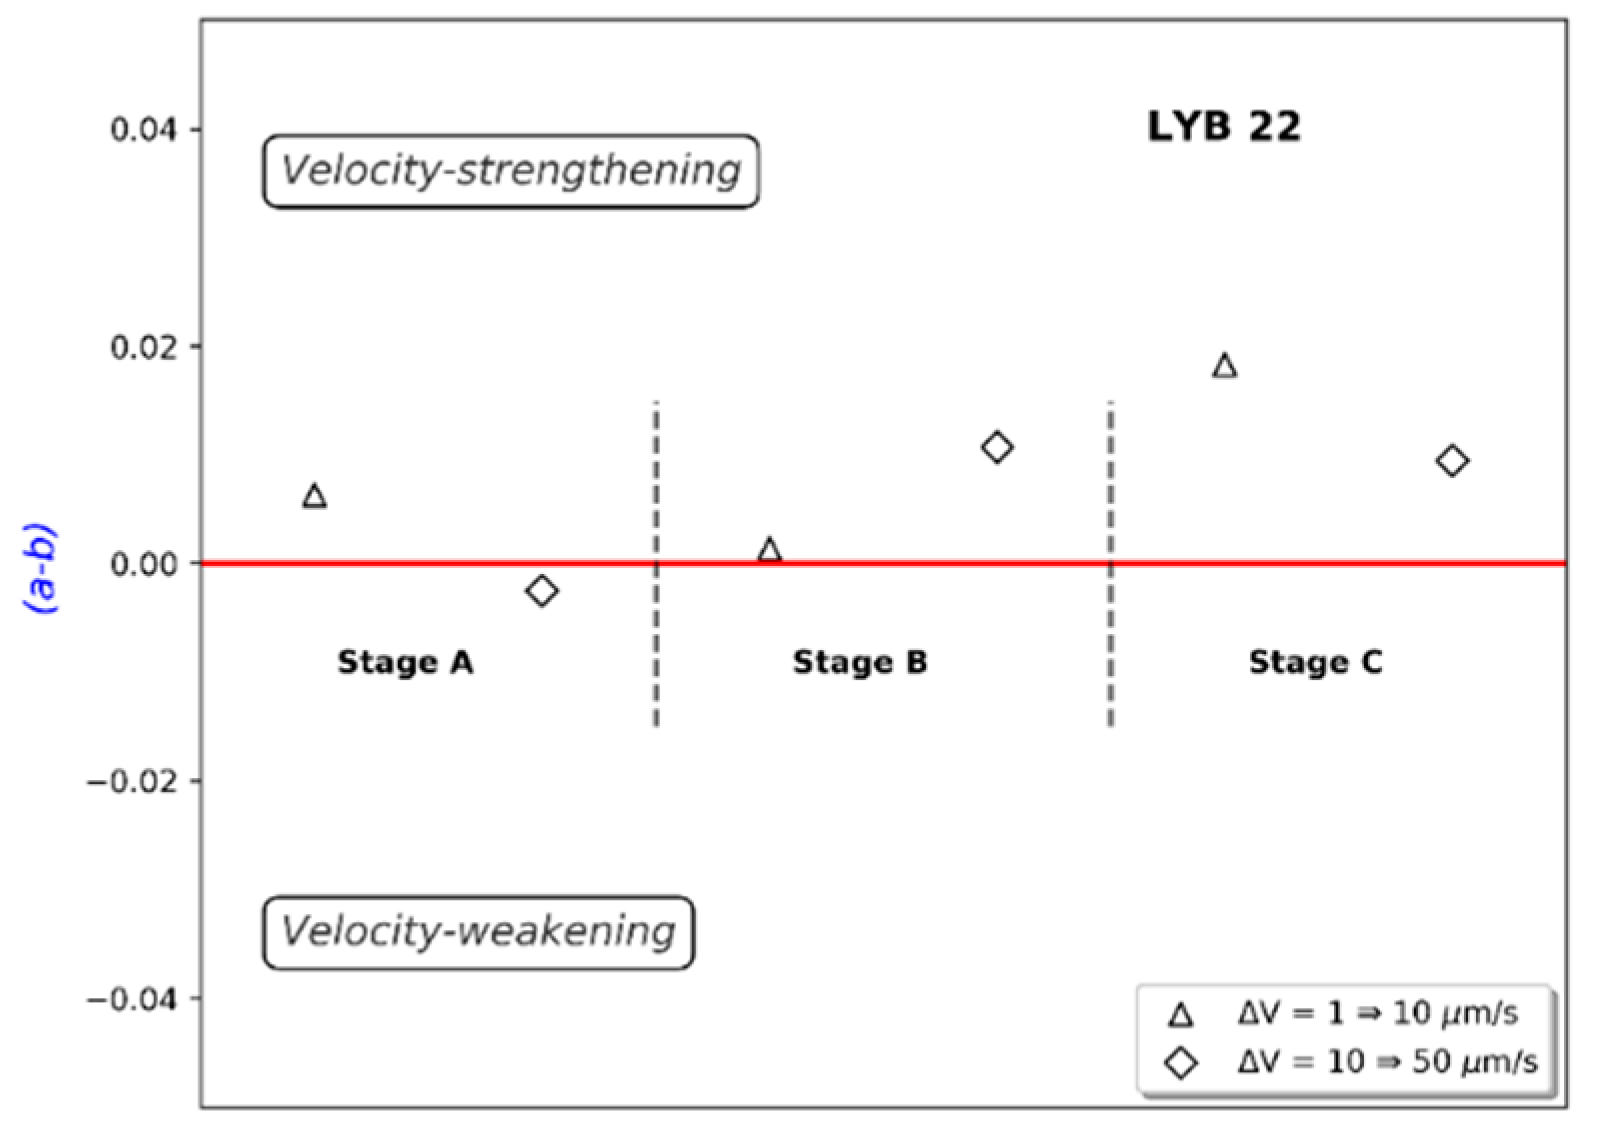
- For the Rurikfjellet specimen (LYB22), the shear velocity was changed whilst shearing the sample, i.e., no hold-time was included. Three shear velocities were used at three different constant normal loads.
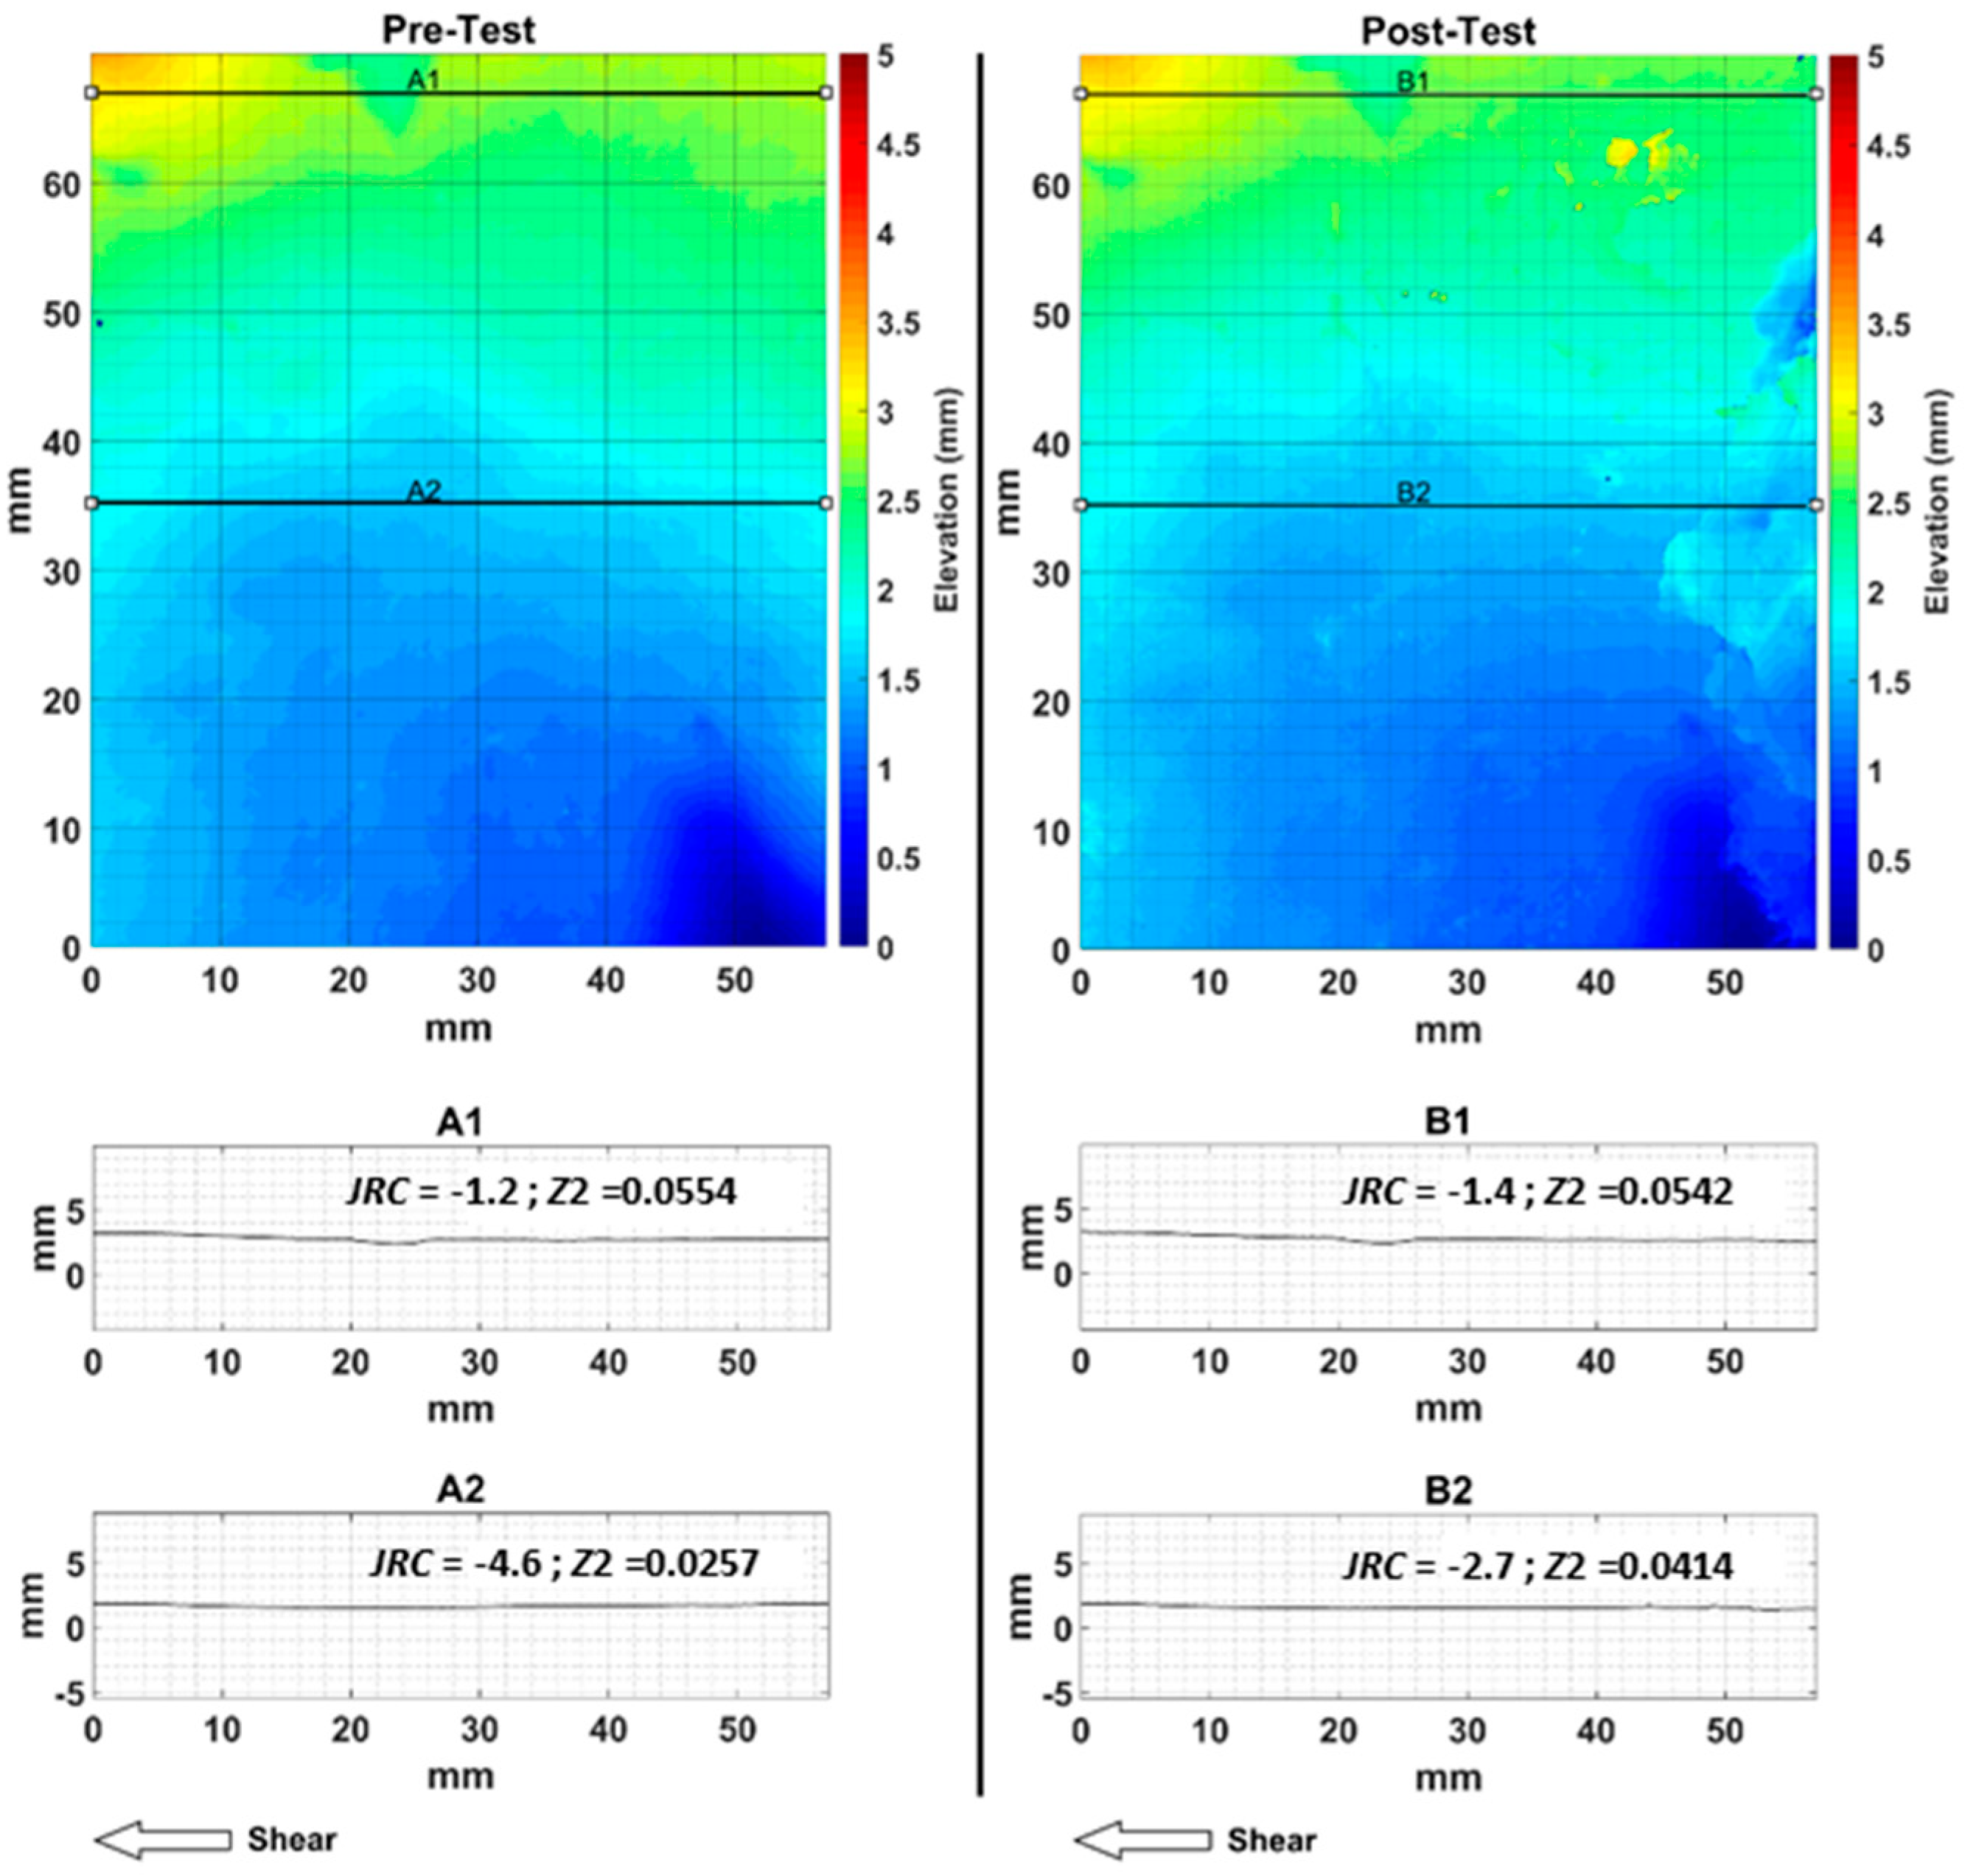
3.3. Characterization of Fracture Surface
4. Results
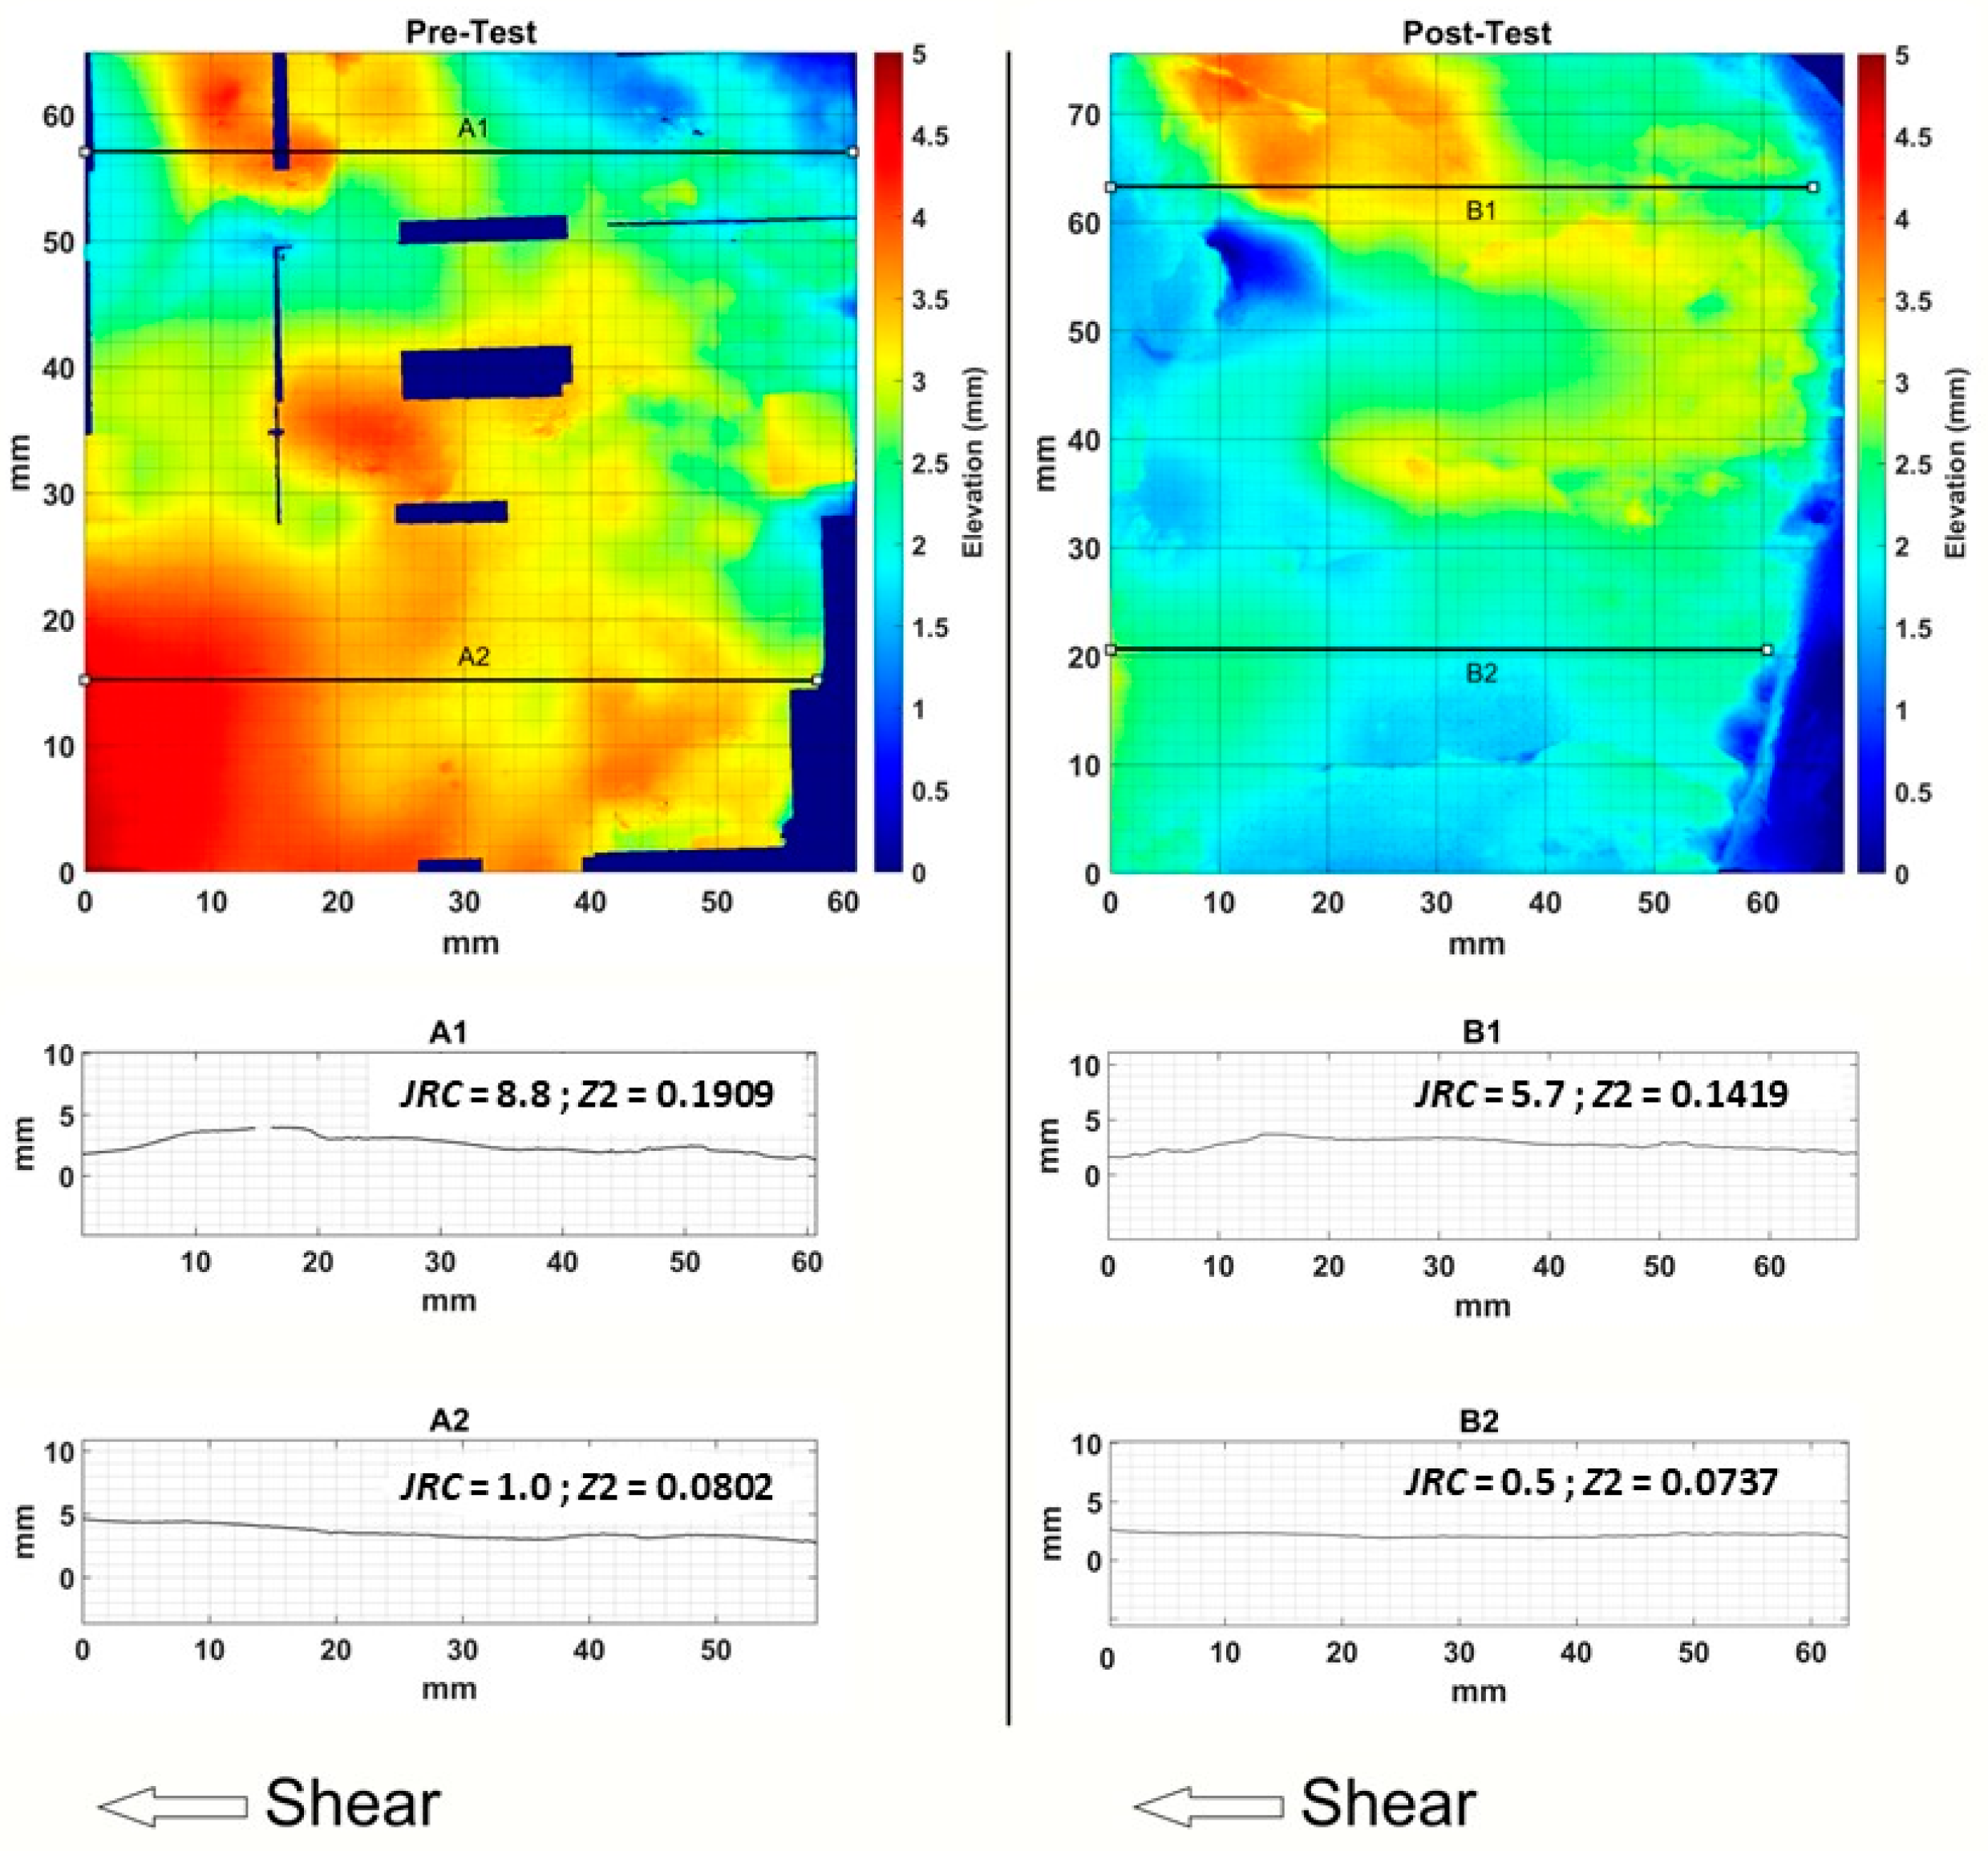
4.1. Impact of Shearing on Fracture Topography
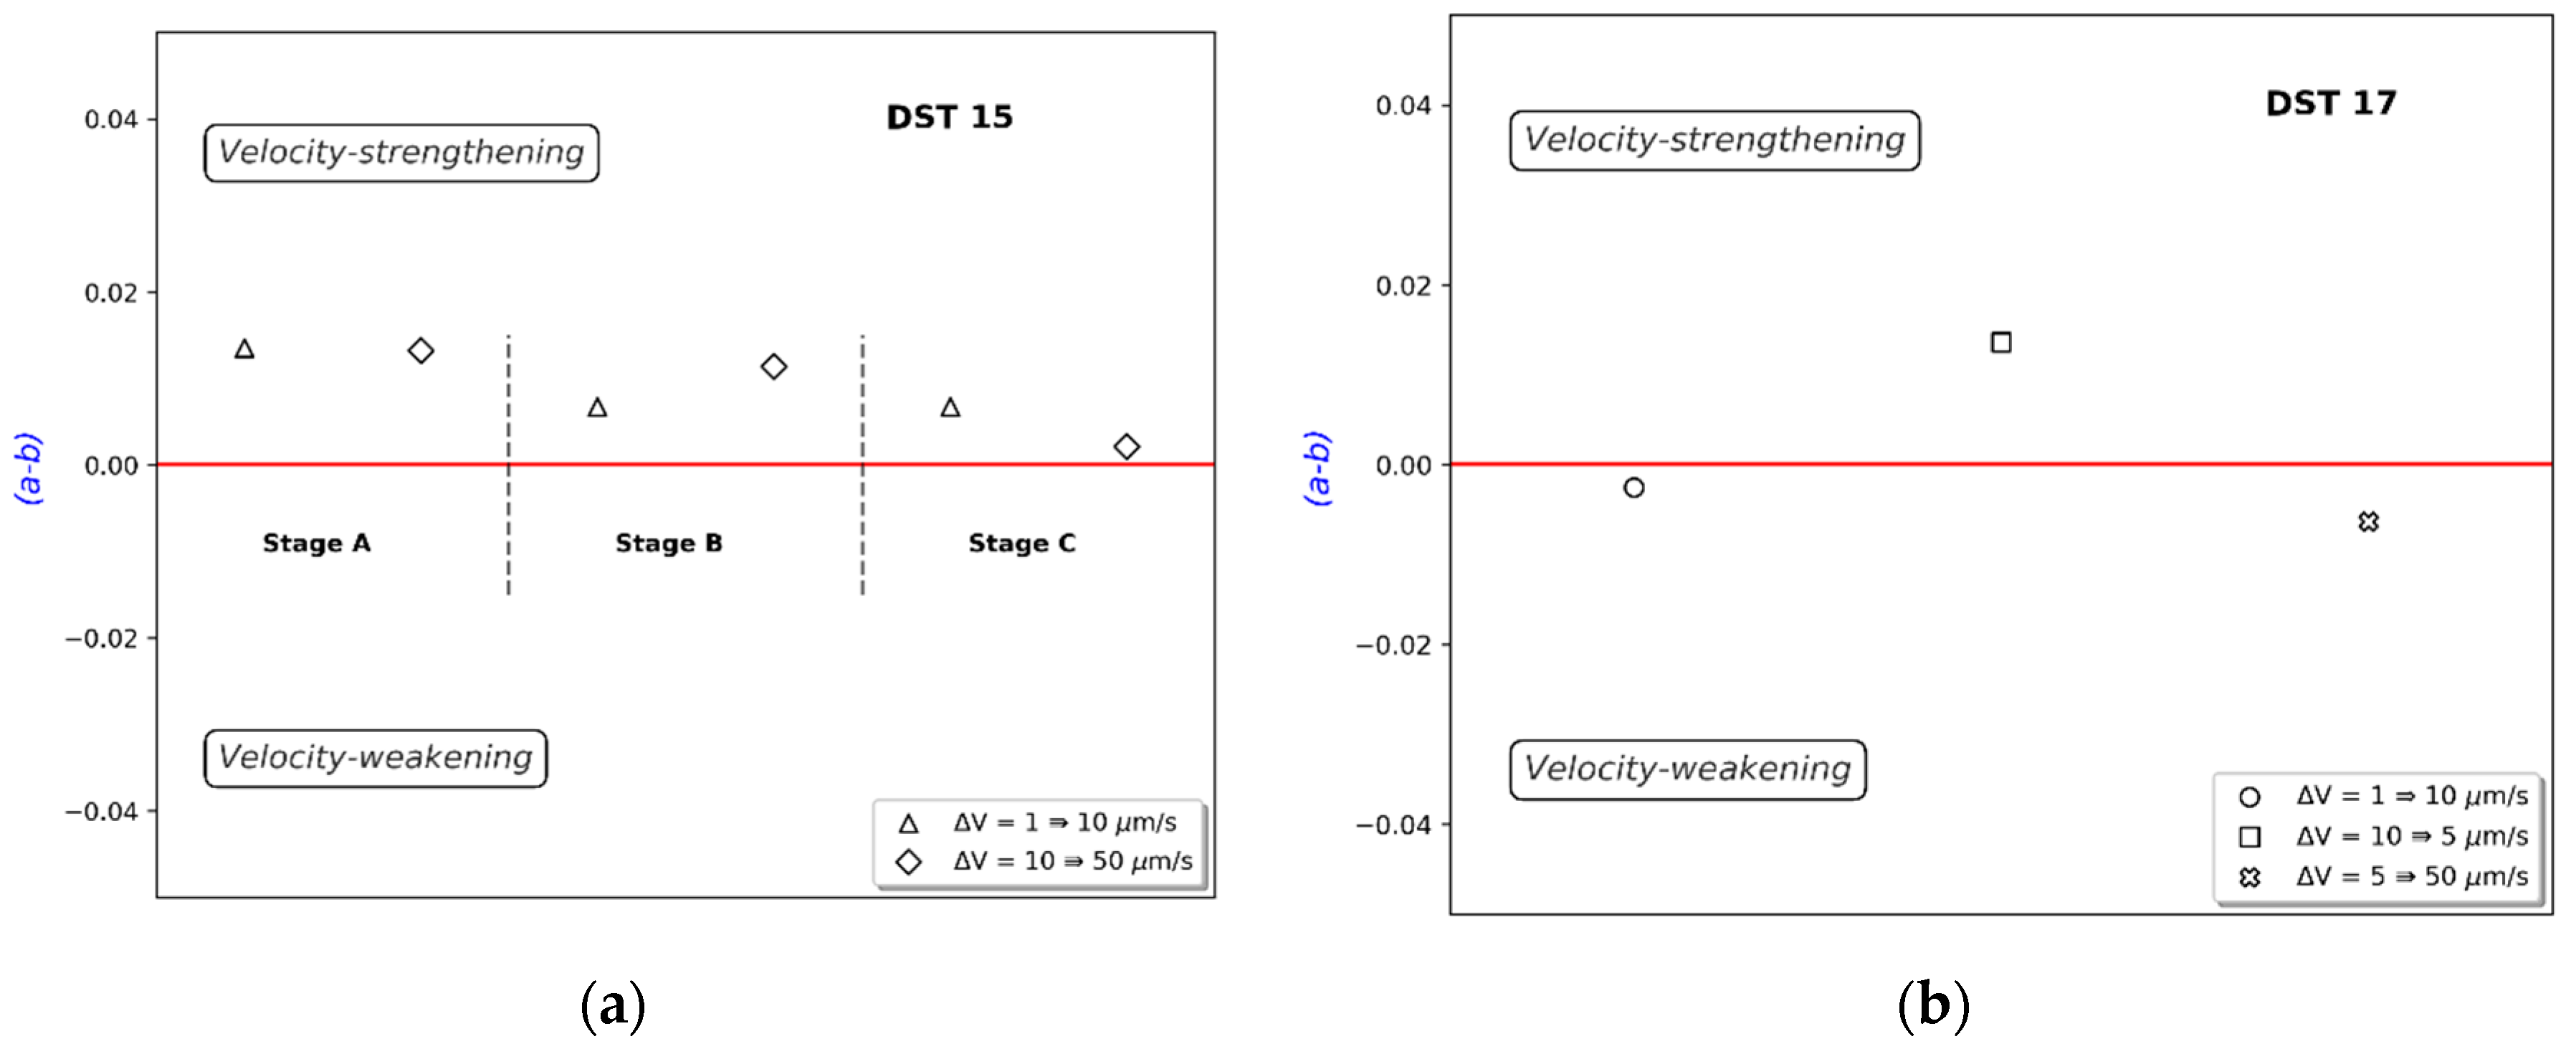
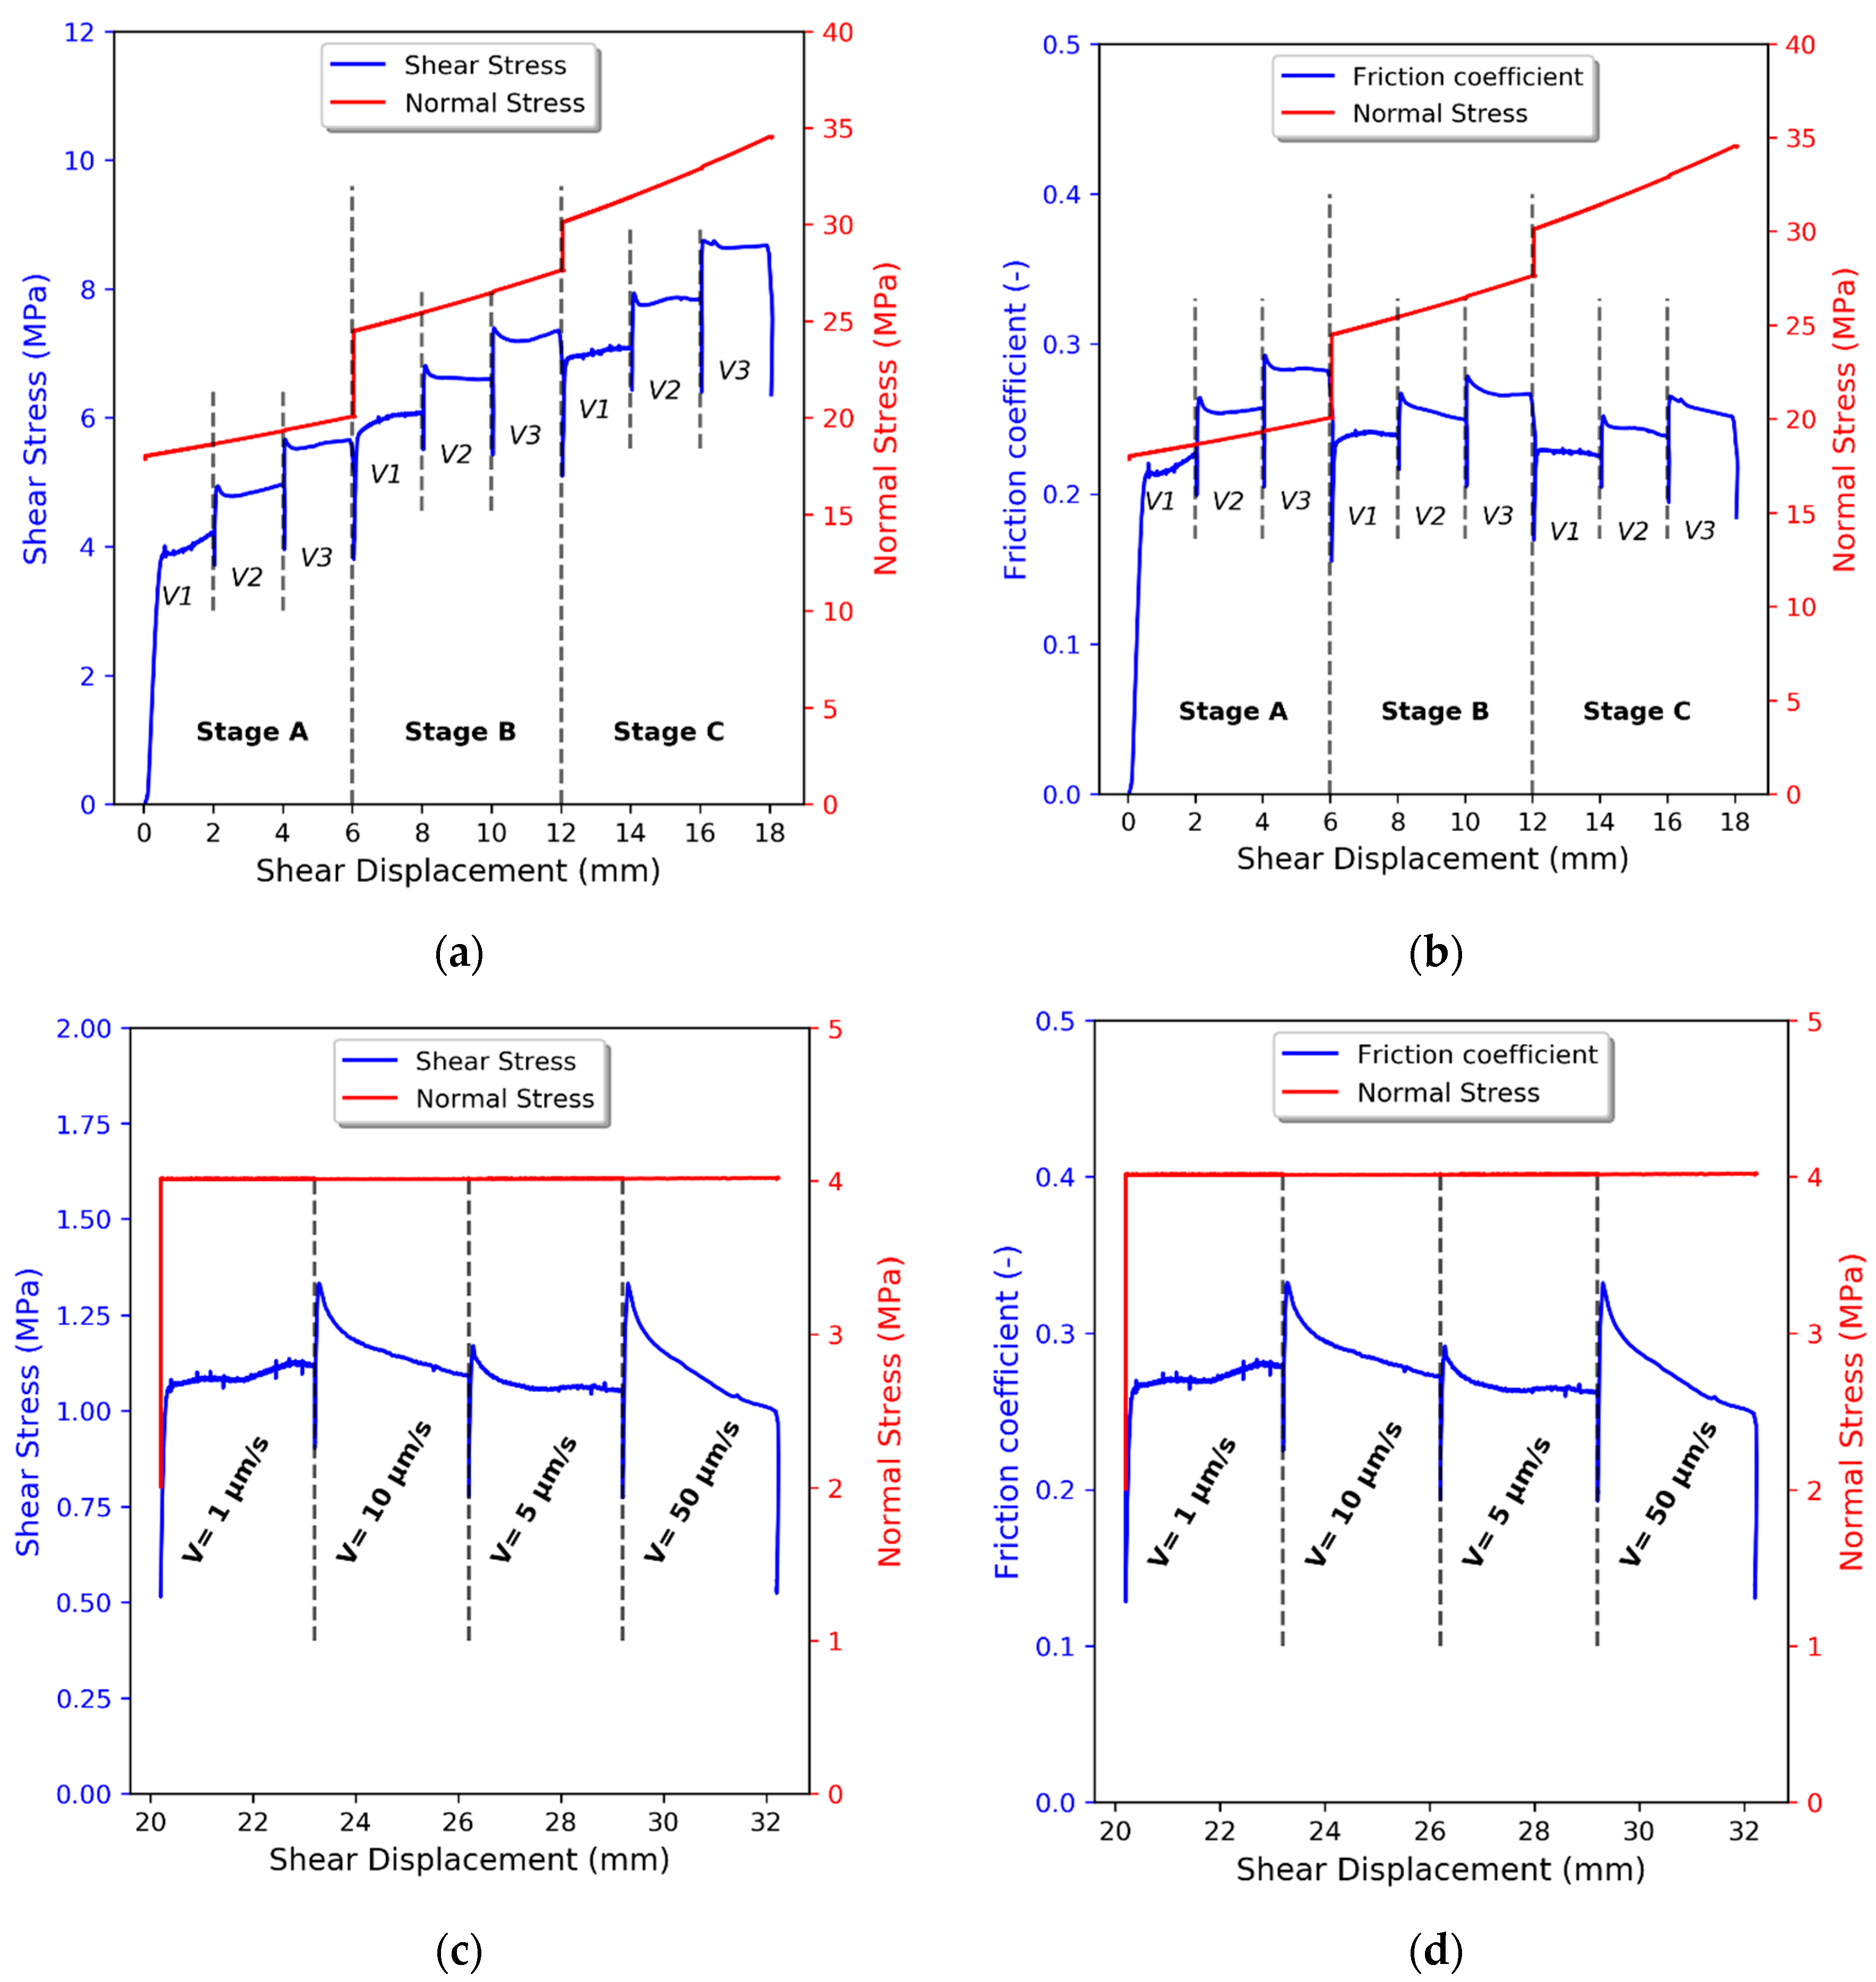
4.2. Frictional Properties at Various Shear Velocities for Draupne
4.3. Frictional Properties at Various Shear Velocities for Rurikfjellet Shale
5. Discussion
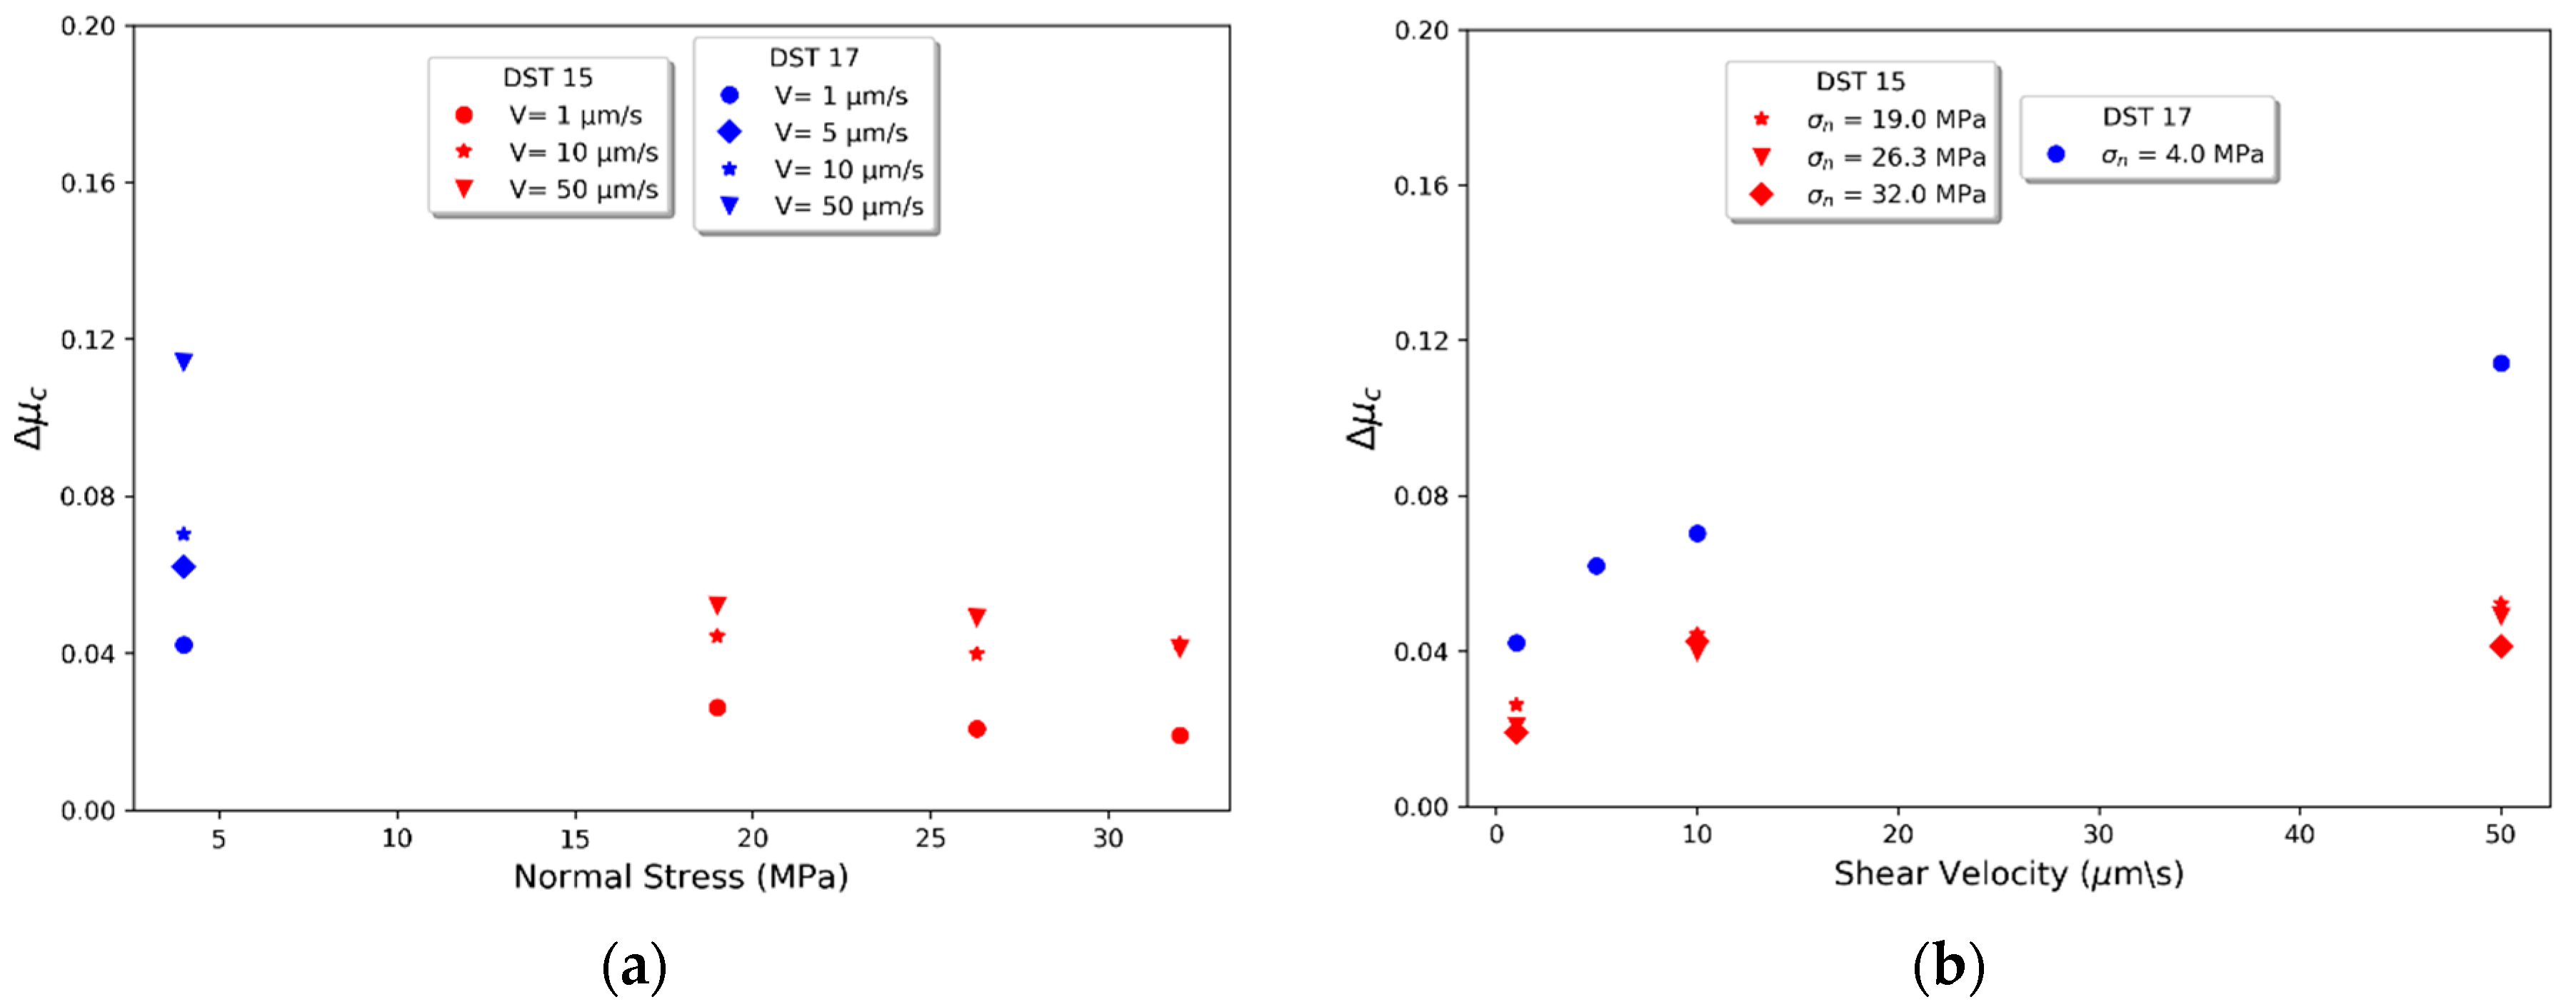
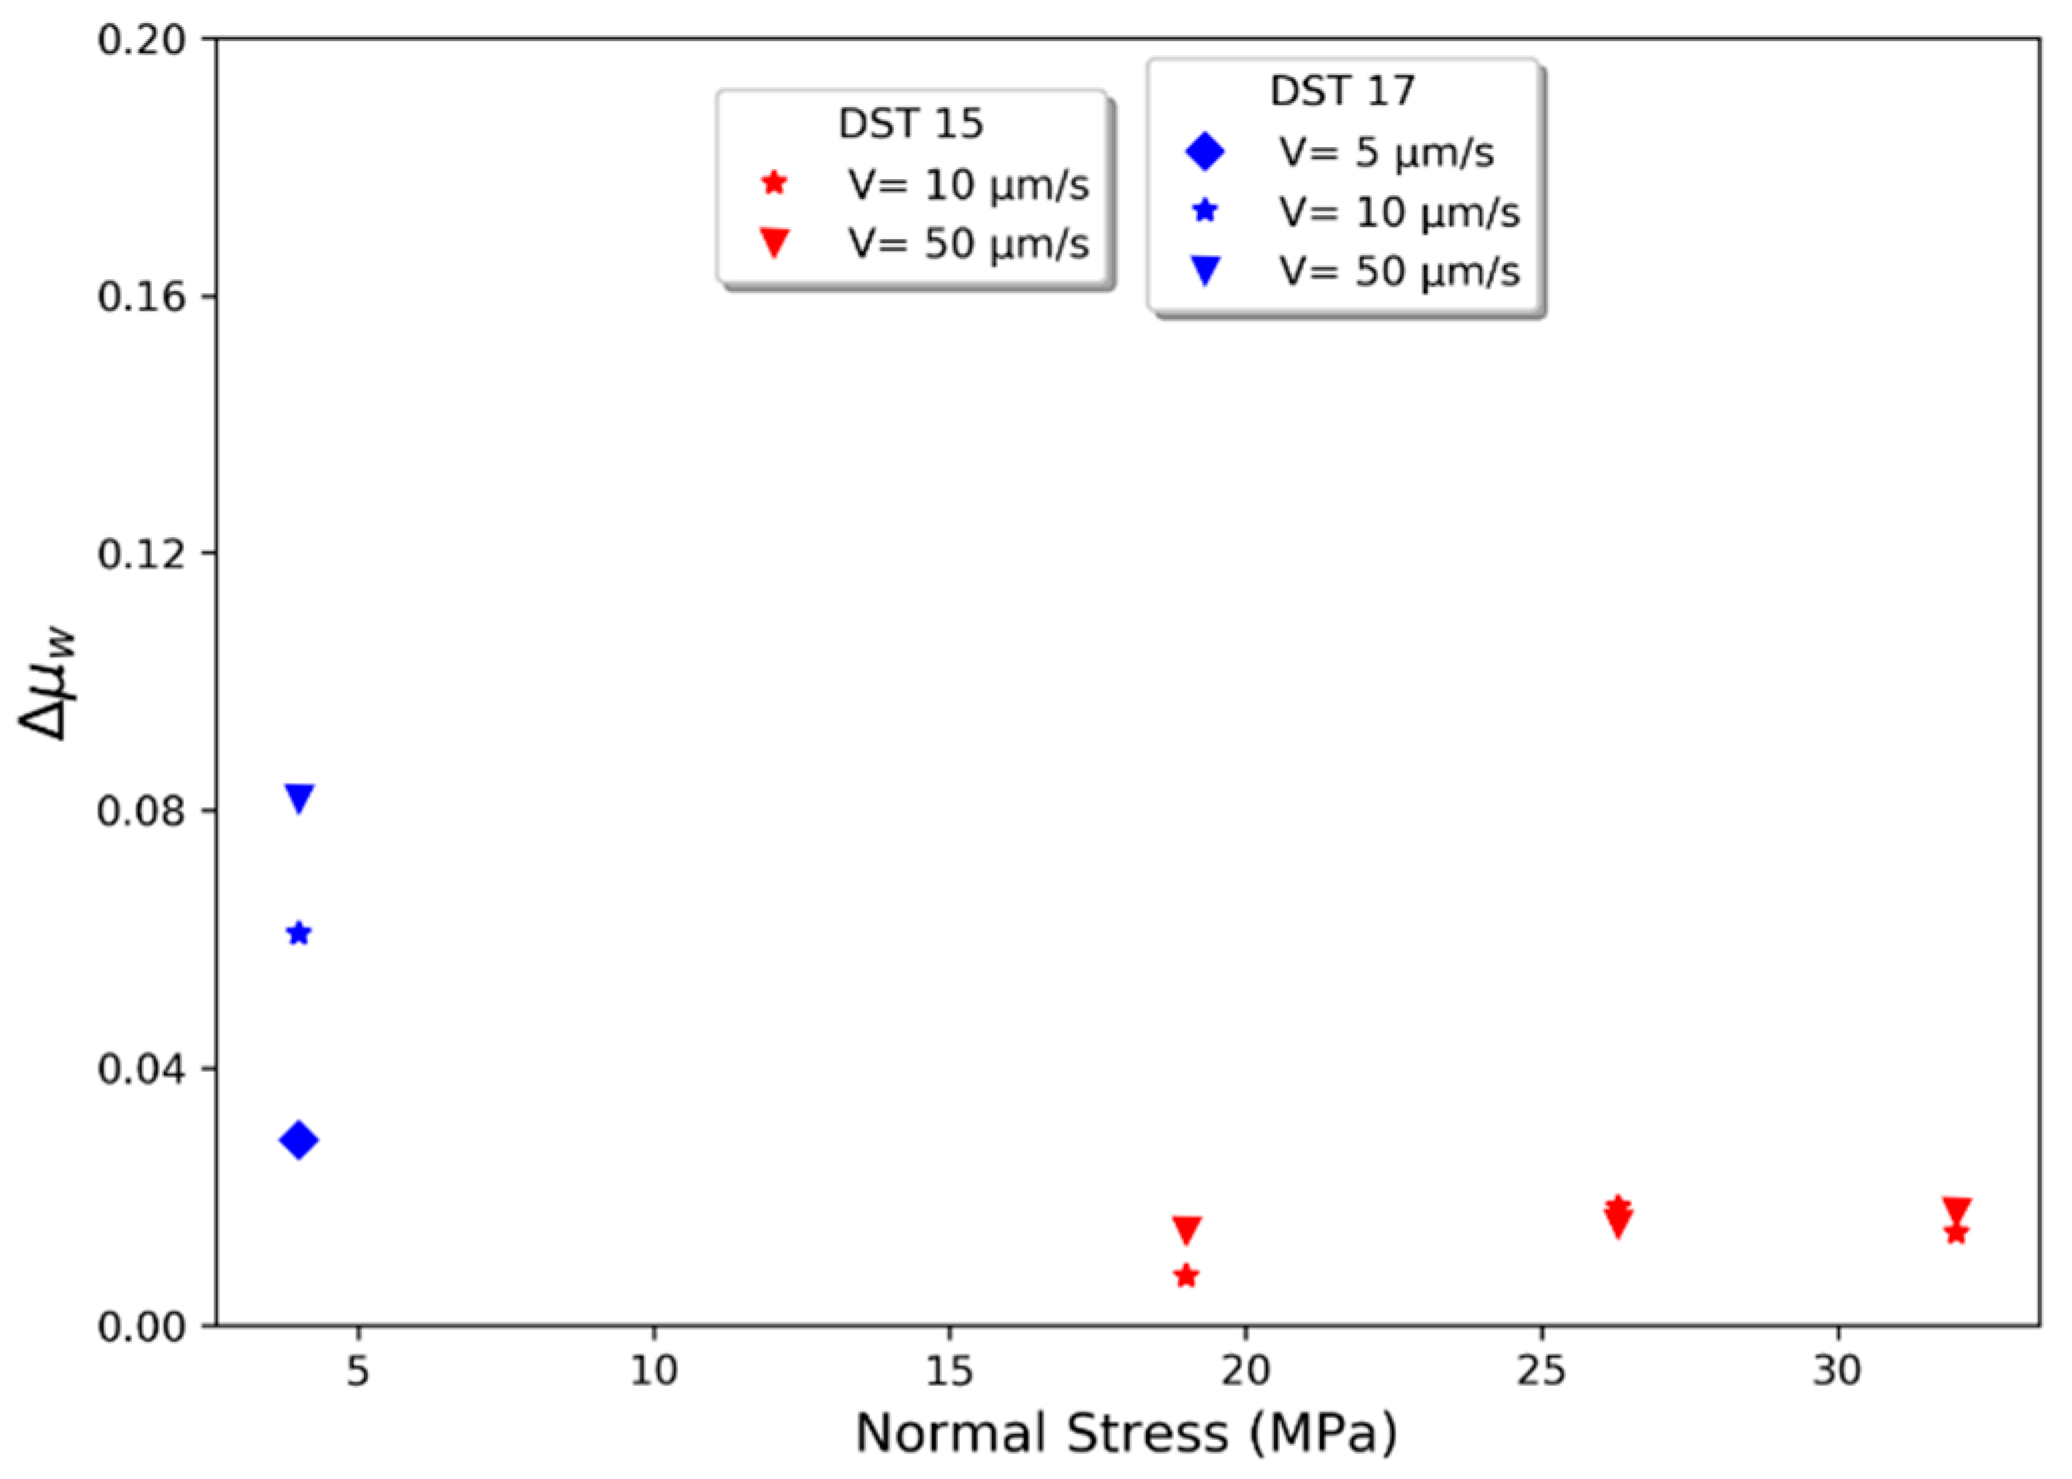
5.1. The Impact of Shear Velocity on Frictional Properties of Draupne and Rurikfjellet Shales
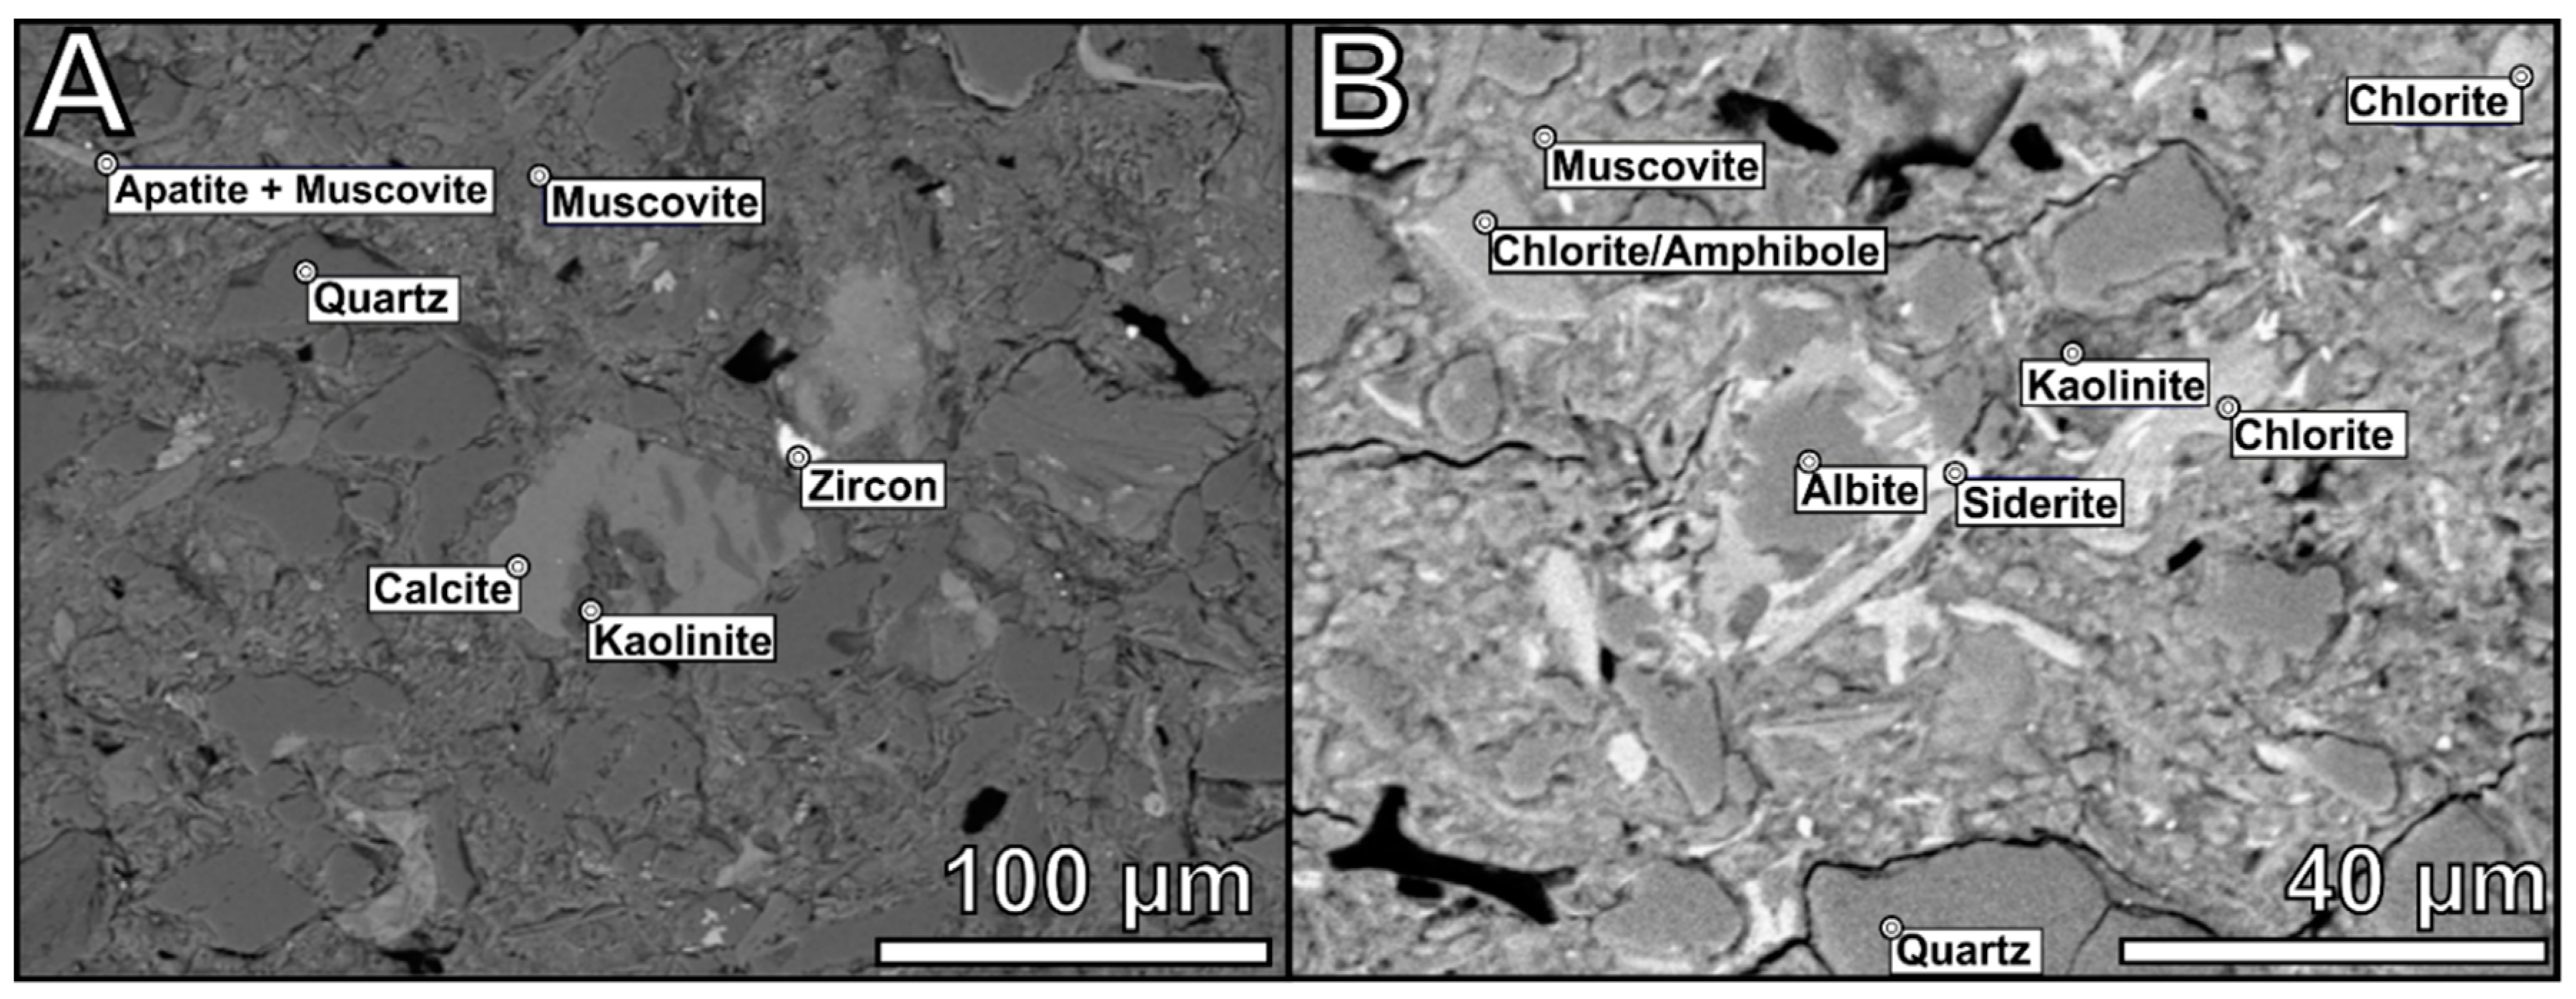
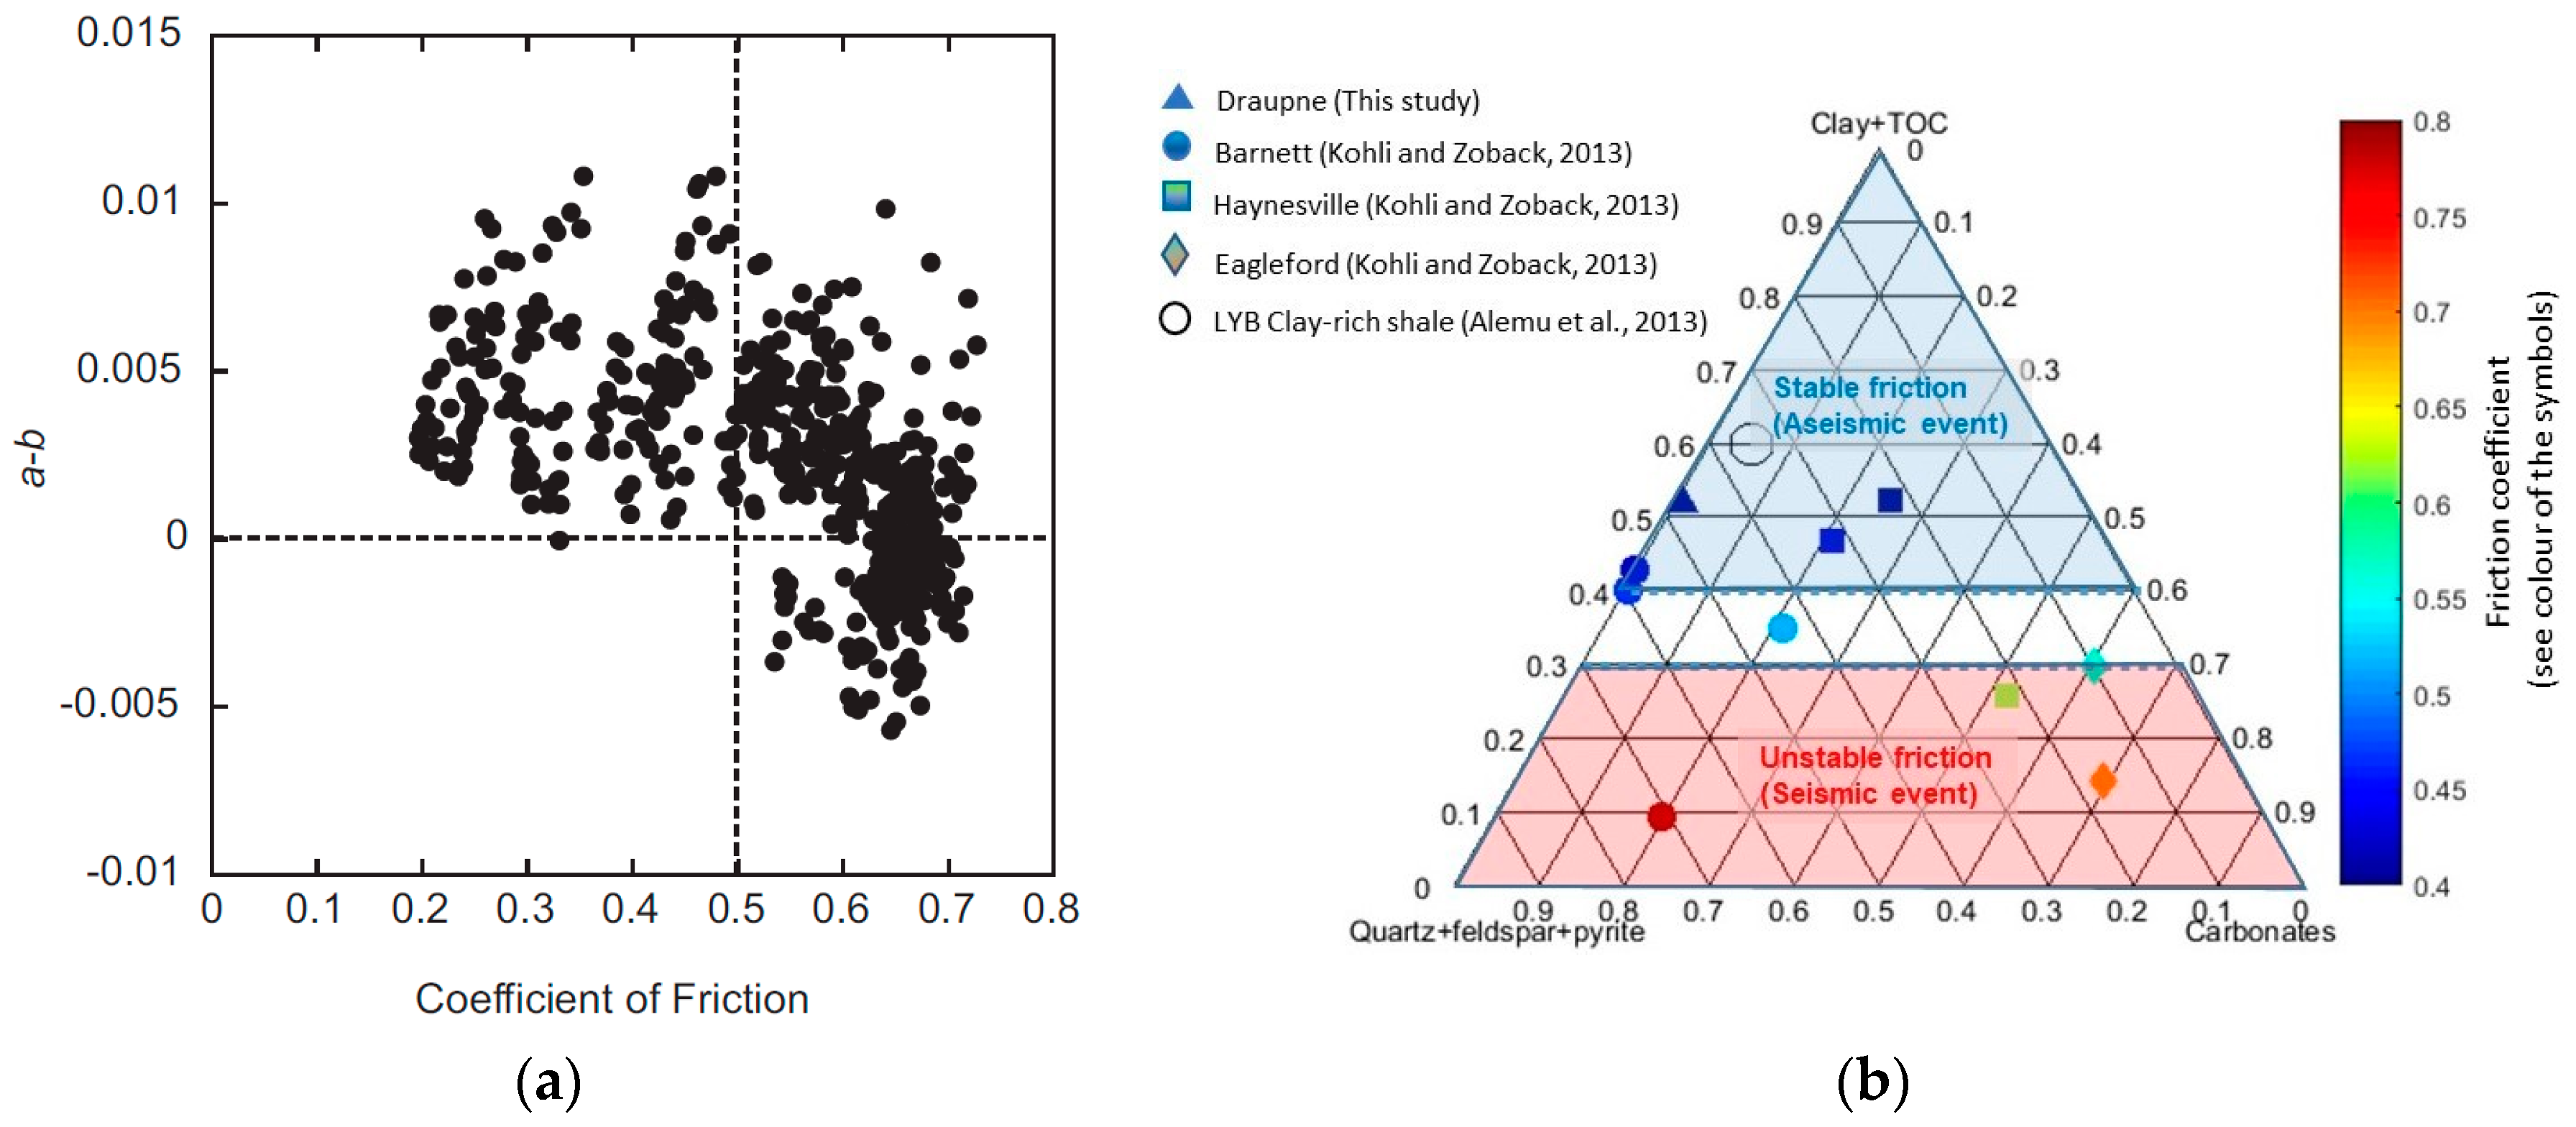
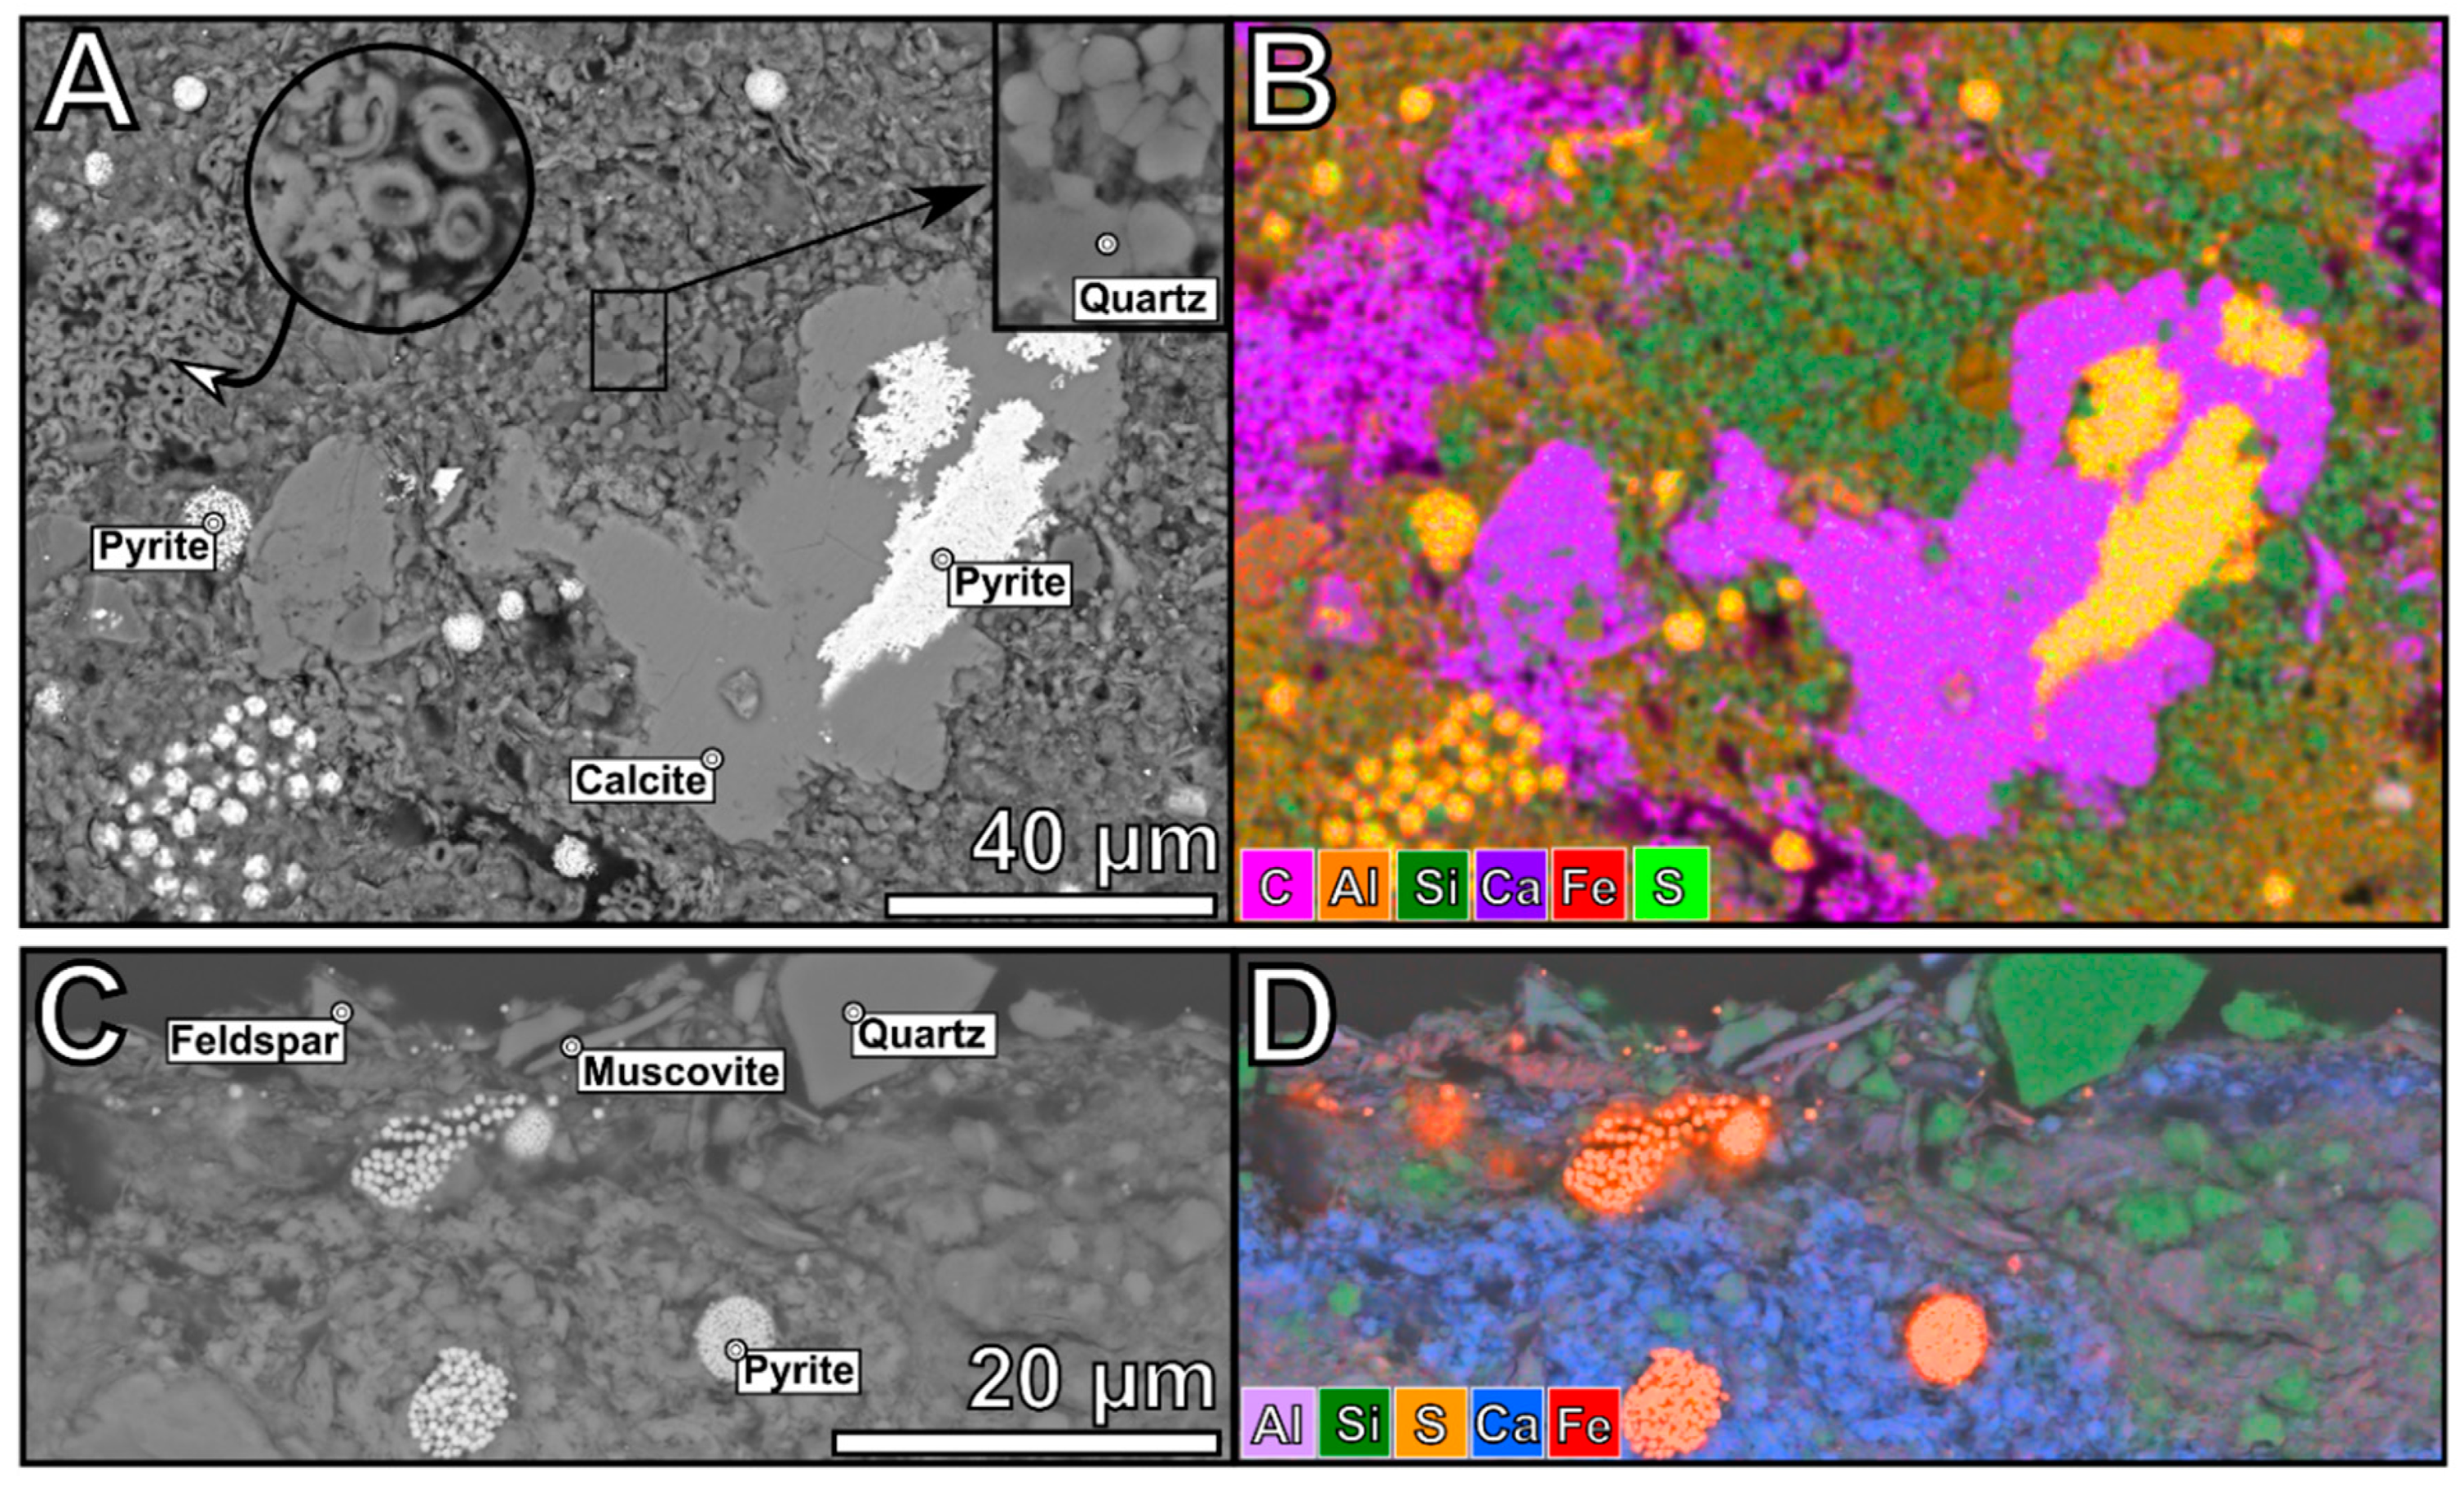
5.2. Impact of Mineralogy on Frictional Properties
5.3. Implications from Acoustic Emission Study on Draupne Shale
6. Conclusions
Author Contributions
Funding
Acknowledgments
Conflicts of Interest
References
- Rogelj, J.; Shindell, D.; Jiang, K.; Fifita, S.; Forster, P.; Ginzburg, V.; Handa, C.; Kheshgi, H.; Kobayashi, S.; Kriegler, E. Chapert 2: Mitigation pathways compatible with 1.5 c in the context of sustainable development. In Global Warming of 1.5 °C an Ipcc Special Report on the Impacts of Global Warming of 1.5 °C above Pre-Industrial Levels and Related Global Greenhouse Gas Emission Pathways, in the Context of Strengthening the Global Response to the Threat of Climate Change; Intergovernmental Panel on Climate Change: Geneva, Switzerland, 2018. [Google Scholar]
- Majer, E.L.; Baria, R.; Stark, M.; Oates, S.; Bommer, J.; Smith, B.; Asanuma, H. Induced seismicity associated with enhanced geothermal systems. Geothermics 2007, 36, 185–222. [Google Scholar] [CrossRef]
- Segall, P. Earthquakes triggered by fluid extraction. Geology 1989, 17, 942–946. [Google Scholar] [CrossRef]
- Nicol, A.; Walsh, J.; Villamor, P.; Seebeck, H.; Berryman, K. Normal fault interactions, paleoearthquakes and growth in an active rift. J. Struct. Geol. 2010, 32, 1101–1113. [Google Scholar] [CrossRef]
- Simpson, D.; Leith, W.; Scholz, C. Two types of reservoir-induced seismicity. Bull. Seismol. Soc. Am. 1988, 78, 2025–2040. [Google Scholar]
- Van Eijs, R.; Mulders, F.; Nepveu, M.; Kenter, C.; Scheffers, B. Correlation between hydrocarbon reservoir properties and induced seismicity in the netherlands. Eng. Geol. 2006, 84, 99–111. [Google Scholar] [CrossRef]
- Hubbert, K.K.; Rubey, W.W. Role of fluid overpressure in mechanics of overthrust faulting. Geol. Soc. Am. Bull. 1970, 70, 583–586. [Google Scholar]
- Pluymakers, A.M.; Samuelson, J.E.; Niemeijer, A.R.; Spiers, C.J. Effects of temperature and CO2 on the frictional behavior of simulated anhydrite fault rock. J. Geophys. Res. Solid Earth 2014, 119, 8728–8747. [Google Scholar] [CrossRef]
- Samuelson, J.; Spiers, C.J. Fault friction and slip stability not affected by CO2 storage: Evidence from short-term laboratory experiments on north sea reservoir sandstones and caprocks. Int. J. Greenh. Gas Control 2012, 11, S78–S90. [Google Scholar] [CrossRef]
- Ikari, M.J.; Carpenter, B.M.; Marone, C. A microphysical interpretation of rate-and state-dependent friction for fault gouge. Geochem. Geophys. Geosyst. 2016, 17, 1660–1677. [Google Scholar] [CrossRef] [Green Version]
- Hunfeld, L.; Niemeijer, A.; Spiers, C. Frictional properties of simulated fault gouges from the seismogenic groningen gas field under in situ p–t-chemical conditions. J. Geophys. Res. Solid Earth 2017, 122, 8969–8989. [Google Scholar] [CrossRef]
- Chen, J.; Verberne, B.A.; Spiers, C.J. Effects of healing on the seismogenic potential of carbonate fault rocks: Experiments on samples from the longmenshan fault, sichuan, china. J. Geophys. Res. Solid Earth 2015, 120, 5479–5506. [Google Scholar] [CrossRef]
- Carpenter, B.; Marone, C.; Saffer, D. Weakness of the San Andreas fault revealed by samples from the active fault zone. Nat. Geosci. 2011, 4, 251–254. [Google Scholar] [CrossRef]
- Carpenter, B.M.; Ikari, M.J.; Marone, C. Laboratory observations of time-dependent frictional strengthening and stress relaxation in natural and synthetic fault gouges. J. Geophys. Res. Solid Earth 2016, 121, 1183–1201. [Google Scholar] [CrossRef] [Green Version]
- Collettini, C.; Niemeijer, A.R.; Viti, C.; Smith, S.A.; Marone, C. Fault structure, frictional properties and mixed-mode fault slip behavior. Earth Planet. Sci. Lett. 2011, 311, 316–327. [Google Scholar] [CrossRef]
- Niemeijer, A.R.; Collettini, C. Frictional properties of a low-angle normal fault under in situ conditions: Thermally-activated velocity weakening. Pure Appl. Geophys. 2014, 171, 2641–2664. [Google Scholar] [CrossRef]
- Dieterich, J.H. Modeling of rock friction: 1. Experimental results and constitutive equations. J. Geophys. Res. Solid Earth 1979, 84, 2161–2168. [Google Scholar] [CrossRef]
- Ruina, A. Slip instability and state variable friction laws. J. Geophys. Res. Solid Earth 1983, 88, 10359–10370. [Google Scholar] [CrossRef]
- Marone, C. Laboratory-derived friction laws and their application to seismic faulting. Annu. Rev. Earth Planet. Sci. 1998, 26, 643–696. [Google Scholar] [CrossRef] [Green Version]
- Kohli, A.H.; Zoback, M.D. Frictional properties of shale reservoir rocks. J. Geophys. Res. Solid Earth 2013, 118, 5109–5125. [Google Scholar] [CrossRef]
- Marone, C.; Vidale, J.E.; Ellsworth, W.L. Fault healing inferred from time dependent variations in source properties of repeating earthquakes. Geophys. Res. Lett. 1995, 22, 3095–3098. [Google Scholar] [CrossRef] [Green Version]
- Scholz, C.H. Earthquakes and friction laws. Nature 1998, 391, 37–42. [Google Scholar] [CrossRef]
- He, C.; Wang, Z.; Yao, W. Frictional sliding of gabbro gouge under hydrothermal conditions. Tectonophysics 2007, 445, 353–362. [Google Scholar] [CrossRef]
- Zoback, M.; Kohli, A.; Das, I.; Mcclure, M. The Importance of Slow Slip on Faults during Hydraulic Fracturing Stimulation of Shale Gas Reservoirs. In Proceedings of the SPE Americas Unconventional Resources Conference, Pittsburgh, PA, USA, 5–7 June 2012. [Google Scholar]
- Das, I.; Zoback, M.D. Long-period, long-duration seismic events during hydraulic stimulation of shale and tight-gas reservoirs—Part 1: Waveform characteristicslpld events: Waveform characteristics. Geophysics 2013, 78, KS107–KS118. [Google Scholar] [CrossRef] [Green Version]
- Warpinski, N.R.; Du, J.; Zimmer, U. Measurements of hydraulic-fracture-induced seismicity in gas shales. Spe Prod. Oper. 2012, 27, 240–252. [Google Scholar]
- Dieterich, J.H. Time-dependent friction and the mechanics of stick-slip. Pure Appl. Geophys. 1978, 116, 790–806. [Google Scholar] [CrossRef]
- Pluymakers, A.M. Frictional and Sealing Behavior of Simulated Anhydrite Fault Gouge Effects of CO2 and Implications for Fault Stability and Caprock Integrity. Utrecht Series of Earth Sciences. Ph.D. Thesis, Utrecht University, Utrecht, The Netherlands, 2015. [Google Scholar]
- Marone, C. The effect of loading rate on static friction and the rate of fault healing during the earthquake cycle. Nature 1998, 391, 69–72. [Google Scholar] [CrossRef]
- Tadokoro, K.; Ando, M. Evidence for rapid fault healing derived from temporal changes in s wave splitting. Geophys. Res. Lett. 2002, 29, 6-1–6-4. [Google Scholar] [CrossRef]
- Faleide, J.I.; Bjørlykke, K.; Gabrielsen, R.H. Geology of the norwegian continental shelf. In Petroleum Geoscience; Springer: Berlin/Heidelberg, Germany, 2010; pp. 467–499. [Google Scholar]
- Mulrooney, M.J.; Osmond, J.L.; Skurtveit, E.; Faleide, J.I.; Braathen, A. Structural analysis of the smeaheia fault block, a potential CO2 storage site, northern horda platform, north sea. Mar. Pet. Geol. 2020, 121, 104598. [Google Scholar] [CrossRef]
- Skurtveit, E.; Grande, L.; Ogebule, O.; Gabrielsen, R.; Faleide, J.; Mondol, N.; Maurer, R.; Horsrud, P. Mechanical testing and sealing capacity of the upper jurassic draupne formation, north sea. In Proceedings of the 49th US Rock Mechanics/Geomechanics Symposium, San Francisco, CA, USA, 28 June–1 July 2015; American Rock Mechanics Association: Alexandria, VA, USA, 2015. [Google Scholar]
- Zadeh, M.K. Compaction and Rock Properties of Siliciclastic Sediments-Implications for Reservoir Characterization, Velocity Anisotropy and Buildup of Abnormal Pore Pressure. Ph.D. Thesis, University of Oslo, Oslo, Norway, 2016. [Google Scholar]
- Smith, H. Engineering Parameters of Draupne Shale-Characterization of Fractured Samples and Integration with Mechanical Tests. M.Sc. Thesis, University of Oslo, Oslo, Norway, 2019. [Google Scholar]
- Braathen, A.; Balum, K.; Christiansen, H.; Dahl, T.; Eiken, O.; Elvebakk, H.; Hansen, F.; Hanssen, T.; Jochmann, M.; Johansen, T. The longyearbyen CO2 lab of svalbard, norway-initial assessment of the geological conditions for CO2 sequestration. Nor. J. Geol. 2012, 92, 353–376. [Google Scholar]
- Olaussen, S.; Senger, K.; Braathen, A.; Grundvåg, S.-A.; Mørk, A. You learn as long as you drill; research synthesis from the longyearbyen CO2 laboratory, svalbard, norway. Nor. J. Geol. 2019, 99, 157–181. [Google Scholar] [CrossRef] [Green Version]
- Abbas, M. Geomechanical Characterization of Shale Caprock of the Longyearbyen CO2 Storage Pilot. M.Sc. Thesis, University of Oslo, Oslo, Norway, 2015. [Google Scholar]
- Bohloli, B.; Skurtveit, E.; Choi, J.C.; Grande, L.; Sauvin, G.; Soldal, M.; Wilkinson, H. Determination of shear properties and evaluation of fracture reactivation for a clay-rich shale: A case study from svalbard, arctic norway. Bull. Eng. Geol. Environ. 2020, 79, 4859–4872. [Google Scholar] [CrossRef]
- ASTM. Astm d5607-16 Standard Test Method for Performing Laboratory Direct Shear Strength Tests of Rock Specimens under Constant Normal Force; ASTM International: West Conshohocken, PA, USA, 2016. [Google Scholar]
- Niemeijer, A.; Spiers, C. Velocity dependence of strength and healing behaviour in simulated phyllosilicate-bearing fault gouge. Tectonophysics 2006, 427, 231–253. [Google Scholar] [CrossRef]
- Lowe, D.G. Distinctive image features from scale-invariant keypoints. Int. J. Comput. Vis. 2004, 60, 91–110. [Google Scholar] [CrossRef]
- Bretar, F.; Arab-Sedze, M.; Champion, J.; Pierrot-Deseilligny, M.; Heggy, E.; Jacquemoud, S. An advanced photogrammetric method to measure surface roughness: Application to volcanic terrains in the piton de la fournaise, reunion island. Remote Sens. Environ. 2013, 135, 1–11. [Google Scholar] [CrossRef]
- Rupnik, E.; Daakir, M.; Deseilligny, M.P. Micmac—A free, open-source solution for photogrammetry. Open Geospat. DataSoftw. Stand. 2017, 2, 1–9. [Google Scholar] [CrossRef]
- Barton, N.; Choubey, V. The shear strength of rock joints in theory and practice. Rock Mech. 1977, 10, 1–54. [Google Scholar] [CrossRef]
- Tse, R.; Cruden, D.M. Estimating joint roughness coefficients. Int. J. Rock Mech. Min. Sci. Geomech. Abstr. 1979, 16, 303–307. [Google Scholar] [CrossRef]
- Tatone, B.S.; Grasselli, G. A new 2d discontinuity roughness parameter and its correlation with jrc. Int. J. Rock Mech. Min. Sci. 2010, 47, 1391–1400. [Google Scholar] [CrossRef]
- Ikari, M.J.; Marone, C.; Saffer, D.M. On the relation between fault strength and frictional stability. Geology 2011, 39, 83–86. [Google Scholar] [CrossRef] [Green Version]
- Griffiths, L.; Dautriat, J.; Rodriguez, I.A.V.; Iranpour, K.; Sauvin, G.; Park, J.; Sarout, J.; Soldal, M.; Grande, L.; Oye, V. Inferring microseismic source mechanisms and in situ stresses during triaxial deformation of a north-sea-analogue sandstone. Adv. Geosci. 2019, 49, 85–93. [Google Scholar] [CrossRef] [Green Version]
- Ogata, K.; Senger, K.; Braathen, A.; Tveranger, J.; Olaussen, S. Fracture systems and mesoscale structural patterns in the siliciclastic mesozoic reservoir-caprock succession of the longyearbyen CO2 lab project: Implications for geological CO2 sequestration in central spitsbergen, svalbard. Nor. J. Geol. Nor. Geol. Foren. 2014, 94, 121–154. [Google Scholar]


| Sample | Smectite | Kaolinite | Chlorite | Mica/Illite | Pyrite | Quartz | Feldspar | Calcite | Dolomite | TOC a |
|---|---|---|---|---|---|---|---|---|---|---|
| Draupne b ID: DST15 & DST17 | 9.13 | 31.50 | 0.35 | 9.78 | 7.70 | 22.40 | 17.80 | 0.70 | 1.20 | ~7 c |
| Rurikfjelle d ID: LYB22 | - | 12.56 | 9.70 | 21.57 | 0.81 | 40.19 | 6.92 | 8.24 e | - | ~1.5 |
Publisher’s Note: MDPI stays neutral with regard to jurisdictional claims in published maps and institutional affiliations. |
© 2020 by the authors. Licensee MDPI, Basel, Switzerland. This article is an open access article distributed under the terms and conditions of the Creative Commons Attribution (CC BY) license (http://creativecommons.org/licenses/by/4.0/).
Share and Cite
Bohloli, B.; Soldal, M.; Smith, H.; Skurtveit, E.; Choi, J.C.; Sauvin, G. Frictional Properties and Seismogenic Potential of Caprock Shales. Energies 2020, 13, 6275. https://doi.org/10.3390/en13236275
Bohloli B, Soldal M, Smith H, Skurtveit E, Choi JC, Sauvin G. Frictional Properties and Seismogenic Potential of Caprock Shales. Energies. 2020; 13(23):6275. https://doi.org/10.3390/en13236275
Chicago/Turabian StyleBohloli, Bahman, Magnus Soldal, Halvard Smith, Elin Skurtveit, Jung Chan Choi, and Guillaume Sauvin. 2020. "Frictional Properties and Seismogenic Potential of Caprock Shales" Energies 13, no. 23: 6275. https://doi.org/10.3390/en13236275
APA StyleBohloli, B., Soldal, M., Smith, H., Skurtveit, E., Choi, J. C., & Sauvin, G. (2020). Frictional Properties and Seismogenic Potential of Caprock Shales. Energies, 13(23), 6275. https://doi.org/10.3390/en13236275