Article

Reversible Molten Catalytic Methane Cracking Applied to Commercial Solar-Thermal Receivers

1
Chemical & Biochemical Engineering, University of Colorado Boulder, Boulder, CO 80309, USA
2
Chemical Engineering, Florida State University, Tallahasse, FL 32306, USA
*
Author to whom correspondence should be addressed.
Energies 2020, 13(23), 6229; https://doi.org/10.3390/en13236229
Submission received: 24 October 2020 / Revised: 22 November 2020 / Accepted: 23 November 2020 / Published: 26 November 2020
(This article belongs to the Special Issue Concentrating Solar Power Systems)

Abstract

:
When driven by sunlight, molten catalytic methane cracking can produce clean hydrogen fuel from natural gas without greenhouse emissions. To design solar methane crackers, a canonical plug flow reactor model was developed that spanned industrially relevant temperatures and pressures (1150–1350 Kelvin and 2–200 atmospheres). This model was then validated against published methane cracking data and used to screen power tower and beam-down reactor designs based on “Solar Two,” a renewables technology demonstrator from the 1990s. Overall, catalytic molten methane cracking is likely feasible in commercial beam-down solar reactors, but not power towers. The best beam-down reactor design was 9% efficient in the capture of sunlight as fungible hydrogen fuel, which approaches photovoltaic efficiencies. Conversely, the best discovered tower methane cracker was only 1.7% efficient. Thus, a beam-down reactor is likely tractable for solar methane cracking, whereas power tower configurations appear infeasible. However, the best simulated commercial reactors were heat transfer limited, not reaction limited. Efficiencies could be higher if heat bottlenecks are removed from solar methane cracker designs. This work sets benchmark conditions and performance for future solar reactor improvement via design innovation and multiphysics simulation.

1. Introduction

Unlike prior hydrocarbons-to-hydrogen chemistries that produce greenhouse gases [1,2], catalytic methane cracking makes solid carbon for sequestration or reuse [3]. When driven with solar heat, this reaction can generate greenhouse-neutral hydrogen fuel from carbonaceous feedstocks, a transitional technology towards fully sustainable infrastructure [4,5,6,7,8,9,10,11,12,13]. Figure 1 shows the concept, wherein a macroscopic reactor harbors microscopic reaction. Within this regime methane bubbles through a melt of liquid bismuth and catalytic nickel:
C H 4 ( g ) 27 % N i ( l ) , 73 % B i ( l ) 2 H 2 ( g ) + C ( s )
As the bubbles rise heat drives endothermic methane conversion to hydrogen gas and graphitic carbon, a chemistry pioneered within an indirectly heated tubular bubbler [3]. Commercial solar-thermal technologies, exemplified by the Solar Two pilot plant [14], similarly heat fluids indirectly within tubes, tubes that intercept concentrated sunlight from heliostats. However, current solar thermal facilities operate at 500 °C [15], whereas molten catalytic methane cracking occurs at higher temperatures (>1000 °C). Higher temperatures can only magnify the radiative and convective heat losses observed in a Solar Two design [15,16]. Thus, although the “Solar Two” approach is mature, its feasibility for molten catalytic methane cracking is unclear.
Recently, an alternative to Solar Two power tower designs premiered at commercial scale [17]. Figure 2 compares Solar Two to the new configuration, which places the tubular receiver at or below the heliostat field. This beam-down receiver is exposed to the environment only through an open aperture that accepts light from a suspended reflector. Compared to a fully exposed Solar Two power tower, this nested receiver can reduce convective and emissive heat losses. However, new losses are associated with light reflection and redirection into the beam-down aperture [17]. Potential solar performance improvements with a beam-down, versus established power tower design, is explored herein.
Tractable solar driven methane cracking with a power tower or beam-down design likely lies within the large range of reaction temperatures and pressures common in industrial practice, which can reach 1100° Celsius and 400 atmospheres [18]. Over these extreme conditions reaction may be reversible, a facet omitted from recent studies of catalytic methane cracking [3,19,20,21,22]. Catalytic molten methane kinetics were revisited to evaluate reactor performance over these expansive conditions and explore likely reaction reversibility in industrial implementations.

2. Materials and Methods

2.1. Reversible Catalytic Molten Methane Cracking Kinetics

In prior reactor design and economics, authors have assumed that methane cracking is irreversible [3,19,20,21,22]. However, heterogeneous and noncatalytic methane decomposition is reversible and inhibited by high pressure [23,24,25,26,27,28,29,30], an effect that can cause the thermodynamic limitation of hydrogen production [31]. Thus, to evaluate the performance of a multitube solar receiver across industrially relevant conditions, catalytic methane cracking kinetics were expanded to feature reaction reversion at extreme temperatures and pressures. Specifically, a kinetics model was proposed based on the batch surface catalyzed decomposition of methane in a spherical isothermal bubble [3,32]:
d n C H 4 d t = A b u b b l e r a t e
d n C d t = A b u b b l e r a t e
d n H 2 d t = 2 A b u b b l e r a t e
A b u b b l e = 4 π r b u b b l e 2
A table of variable definitions is available in Appendix A. Here, Abubble is the bubble surface area based on bubble radius rbubble. Changes in carbon nC, methane nCH4, and hydrogen nH2 moles depend on the reaction rate, which conformed to literature-established Arrhenius expressions for reversible methane decomposition [23,24,25,26,27,28,29,30]:
r a t e = k f e E f R T C C H 4 k r e E r R T C H 2 2
The expansion of bubble surface and size is strongly influenced by pressure, which varies with elevation within a dense molten metal [33,34]:
P ( z ) = P i n l e t ρ g z
Specifically, positional pressure P(z) depends on the reactor inlet pressure Pinlet, the temperature-dependent liquid metal density ρ, the acceleration of gravity g, and elevation z within a reactor tube. Appendix B lists property correlations, including the expression for liquid metal catalyst density ρ. Like pressure, volumetric flow through a reactor is similarly elevation dependent, but dictated by reactor material conservation at steady state:
Q ˙ ( z ) = [ n ˙ C H 4 ( z ) + n ˙ H 2 ( z ) ] Z R T P ( z ) = n ˙ ( z ) ρ ( z )
Here, solid carbon contributes negligible volumetric flow, but the volumetric flows of gaseous methane n ˙ CH4 and hydrogen n ˙ H2 are assumed substantial. Thus, the positional volumetric flow is a function of isothermal reaction temperature T, pressure P(z), and gas mole flows. Compressibility Z was calculated via the SRK equation of state with Kay’s rule [35]. Effective bubble area can be modeled from volumetric flow at a given elevation if the rate of bubble emanation b ˙ (bubbles/second) is known:
Q ˙ ( z ) = b ˙ V b u b b l e = b ˙ 4 π r b u b b l e 3 3 , r b u b b l e = ( A b u b b l e ( z ) 4 π ) 1 / 2
Combining these two equations gives the approximate elevation-dependent bubble catalytic surface in a molten metal:
A b u b b l e ( z ) = ( 6 π 1 / 2 Q ˙ ( z ) b ˙ ) 2 / 3
This equation assumes insubstantial bubble coalescence, a phenomena that would alter bubble area Abubble. Sieve plates and/or impellers can disaggregate and avert bubble coalescence, as is common in extractive distillation [36,37,38].
These equations combine to yield a differential-algebraic system for analyzing a single isothermal molten catalytic methane bubbler:
P ( z ) = P i n l e t ρ g z
Q ˙ ( z ) = [ n ˙ C H 4 ( z ) + n ˙ H 2 ( z ) ] Z R T P ( z )
A b u b b l e ( z ) = ( 6 π 1 / 2 Q ˙ ( z ) b ˙ ) 2 / 3
y C H 4 = n ˙ C H 4 ( z ) n ˙ C H 4 ( z ) + n ˙ H 2 ( z )
y H 2 = n ˙ H 2 ( z ) n ˙ C H 4 ( z ) + n ˙ H 2 ( z )
C C H 4 = y C H 4 P ( z ) Z R T
C H 2 = y H 2 P ( z ) Z R T
r a t e = k f e E f R T C C H 4 k r e E r R T C H 2 2
d n ˙ C H 4 d z = b A b u b b l e r a t e
d n ˙ C d z = b A b u b b l e r a t e
d n ˙ H 2 d z = 2 b A b u b b l e r a t e
where y is mole fraction and C is the concentration of the respective subscripted species. Notably, a tubular reactor could contain multiple bubblers (b > 1). The rate of bubble emanation is then dependent on the feed flowrate n ˙ inlet and bubble inlet orifice radius rbubble,inlet:
b ˙ = n ˙ i n l e t ρ i n l e t V b u b b l e , i n l e t = n ˙ i n l e t ( P i n l e t / ( Z R T ) ) ( 4 π r b u b b l e , i n l e t 3 / 3 )
The feed flowrate is determined by the velocity of bubbles at the inlet temperature and pressure, which was calculated via the work of Davies and Taylor (1950) [39]:
n ˙ i n l e t = ρ g a s V ˙ = P i n l e t Z R T ( A b u b b l e r s v b u b b l e r ) = P i n l e t Z R T ( A b u b b l e r s 2 3 g r b u b b l e , i n l e t )
Abubblers refers to the active bubbling area of a reactor gas distributor, which was 25% of the reactor floor, as is common in distillation [36]. Thus, the number of bubblers in a tubular reactor was:
A b u b b l e r s = 0.25 A t u b e , b = A b u b b l e r s π r b u b b l e , i n l e t 2
where Atube is the tubular reactor cross-sectional area. An initial bubble size of rbubble,inlet = 0.5 cm was adopted, which conforms to the work of Upham et al. 2017 [3] and lumps bubble internal diffusion into the overall kinetic model.

2.2. Thermal Reactor Model

Exterior solar illumination must trespass multiple thermal barriers to heat reacting methane (Figure 1), barriers that limit solar energy ingress [15]. Such indirect solar heating is known to be limiting in solar reactor and thermal systems [40,41]. Conversely, bubbling molten metals rapidly transport thermal energy through strong convection and conduction (Metals, 1954). Thus, temperature was considered isothermal in the liquid metal catalyst, but likely barriers to solar heat were modeled in the reactor geometry presented in Figure 1. Specifically, Solar Two was a ø5.1 m circular receiver lined with Inconel tubes and we adopt the same configuration here [14], but vary reaction tube radius from 1 cm to the maximal extrusions considered feasible in Inconel piping manufacture (0.5 m) [42]. In the beam-down configuration, tubes were heated from cavity internal surfaces, versus externally in the original Solar Two power tower design. Losses through natural convection to ambient air around the receiver exterior surface S were modeled as previously described for concentrated solar facilities [43]:
Q c o n v e c t i o n = h S ( T s T a m b )
where h was calculated as shown in Boehm et al. 1987 for natural convection from a power tower or cavity receiver (Appendix B). The heated receiver surface S in m2 was simulated at temperature Ts relative to an ambient condition of Tamb = 298.15 Kelvin. Energy transfer between reactor tubular walls and molten metal was similarly driven by a heat transfer coefficient hwall, but for a constant Nusselt number of 4.8 typical of liquid metals [44] (Appendix B):
Q w a l l = h w a l l S ( T w a l l T )
where T is the isothermal reaction temperature (Figure 1). The overall heated reactor surface S is dictated by the number of tubular reactors n in a receiver manifold, the arc each tube presented to the environment ϕ, the tube height H, and the outer tube radius ℜ + w:
S = n ϕ H ( + w )
The tube radius was assessed from 0.01 to 0.5 m in all reactor designs, where extruded tubes larger than Ø1 m were considered infeasible [42]. Bubbler Inconel wall thickness and wall temperature profiles were found through simultaneous solution of the hoop stress formula and Fourier’s law [45,46] (Appendix B):
+ w N ( r ) d r = T w T s k ( T ) d T
σ Y S ( T s ) w = ( + w ) P i n l e t
where the Inconel temperature dependent thermal conductivity, yield stress σYS(Ts), and heat flux N(r) were evaluated at their radial or extremum values.
Heliostats that direct light onto a receiver can be only 65% efficient [47,48,49]. Thus, only 65% of 800 W/m2 sunlight incident on a heliostat field reached the reactor. The effective absorptivity and emissivity of corrugated receiver surfaces were determined by 2D Monte Carlo ray tracing in CUtrace [50], an opensource ray tracer, for uniformly radial incoming receiver irradiance, diffuse reflection, and diffuse emission (Appendix B). In traces, native reactor Inconel reflectivity was 5%, emissivity was 95%, and absorptivity was 95%, values that conform to prior experimental work with nickel alloy tubes [51]. Diffuse reflection and radiative emission from the beam-down reactor cavity were calculated via analytical view factors [16] (Appendix B), where ultimate emissive losses from a receiver were given by the Stefan–Boltzmann Law:
Q r a d i a t i v e = ε σ F S T s 4
where ε is the effective surface emissivity from ray tracing, σ the Stefan–Boltzmann constant, and F is the view factor if relevant (Appendix B).
For power tower designs necessary irradiance onto the heliostat field (facility power Qfield) was found from the overall energy balance given radiative losses, convective losses, and energy sunk into endothermic methane cracking:
0.65 α Q f i e l d solar energy intercepted by the heliostat field = n Δ H r x n n ˙ i n l e t X e n e r g y c o n s u m e d b y r e a c t i o n + Q c o n v e c t i o n e n e r g y l o s t t o a i r c o n v e c t i o n + Q r a d i a t i v e e n e r g y l o s t t o r e r a d i a t i o n
where the effective receiver absorptivity α was found from 2D Monte Carlo ray tracing. The 0.65 multiplicand originated from heliostat field efficiency [47,48,49]. For beam-down designs, this field efficiency was 10% lower to account for the redirection of light from a suspended reflector [52,53]:
0.585 α Q f i e l d solar energy intercepted by the heliostat field = n Δ H r x n n ˙ i n l e t X e n e r g y c o n s u m e d b y r e a c t i o n + Q c o n v e c t i o n e n e r g y l o s t t o a i r c o n v e c t i o n + Q r a d i a t i v e e n e r g y l o s t t o r e r a d i a t i o n
Additionally, reactor absorptivity was modified by view factors for diffuse reflection from the beam-down cavity. Reactor efficiency, the fractional energy sunk into hydrogen production versus overall sunlight collected, is:
η = n Δ H r x n n ˙ i n l e t X Q f i e l d = energy into reaction solar energy into facility

3. Results

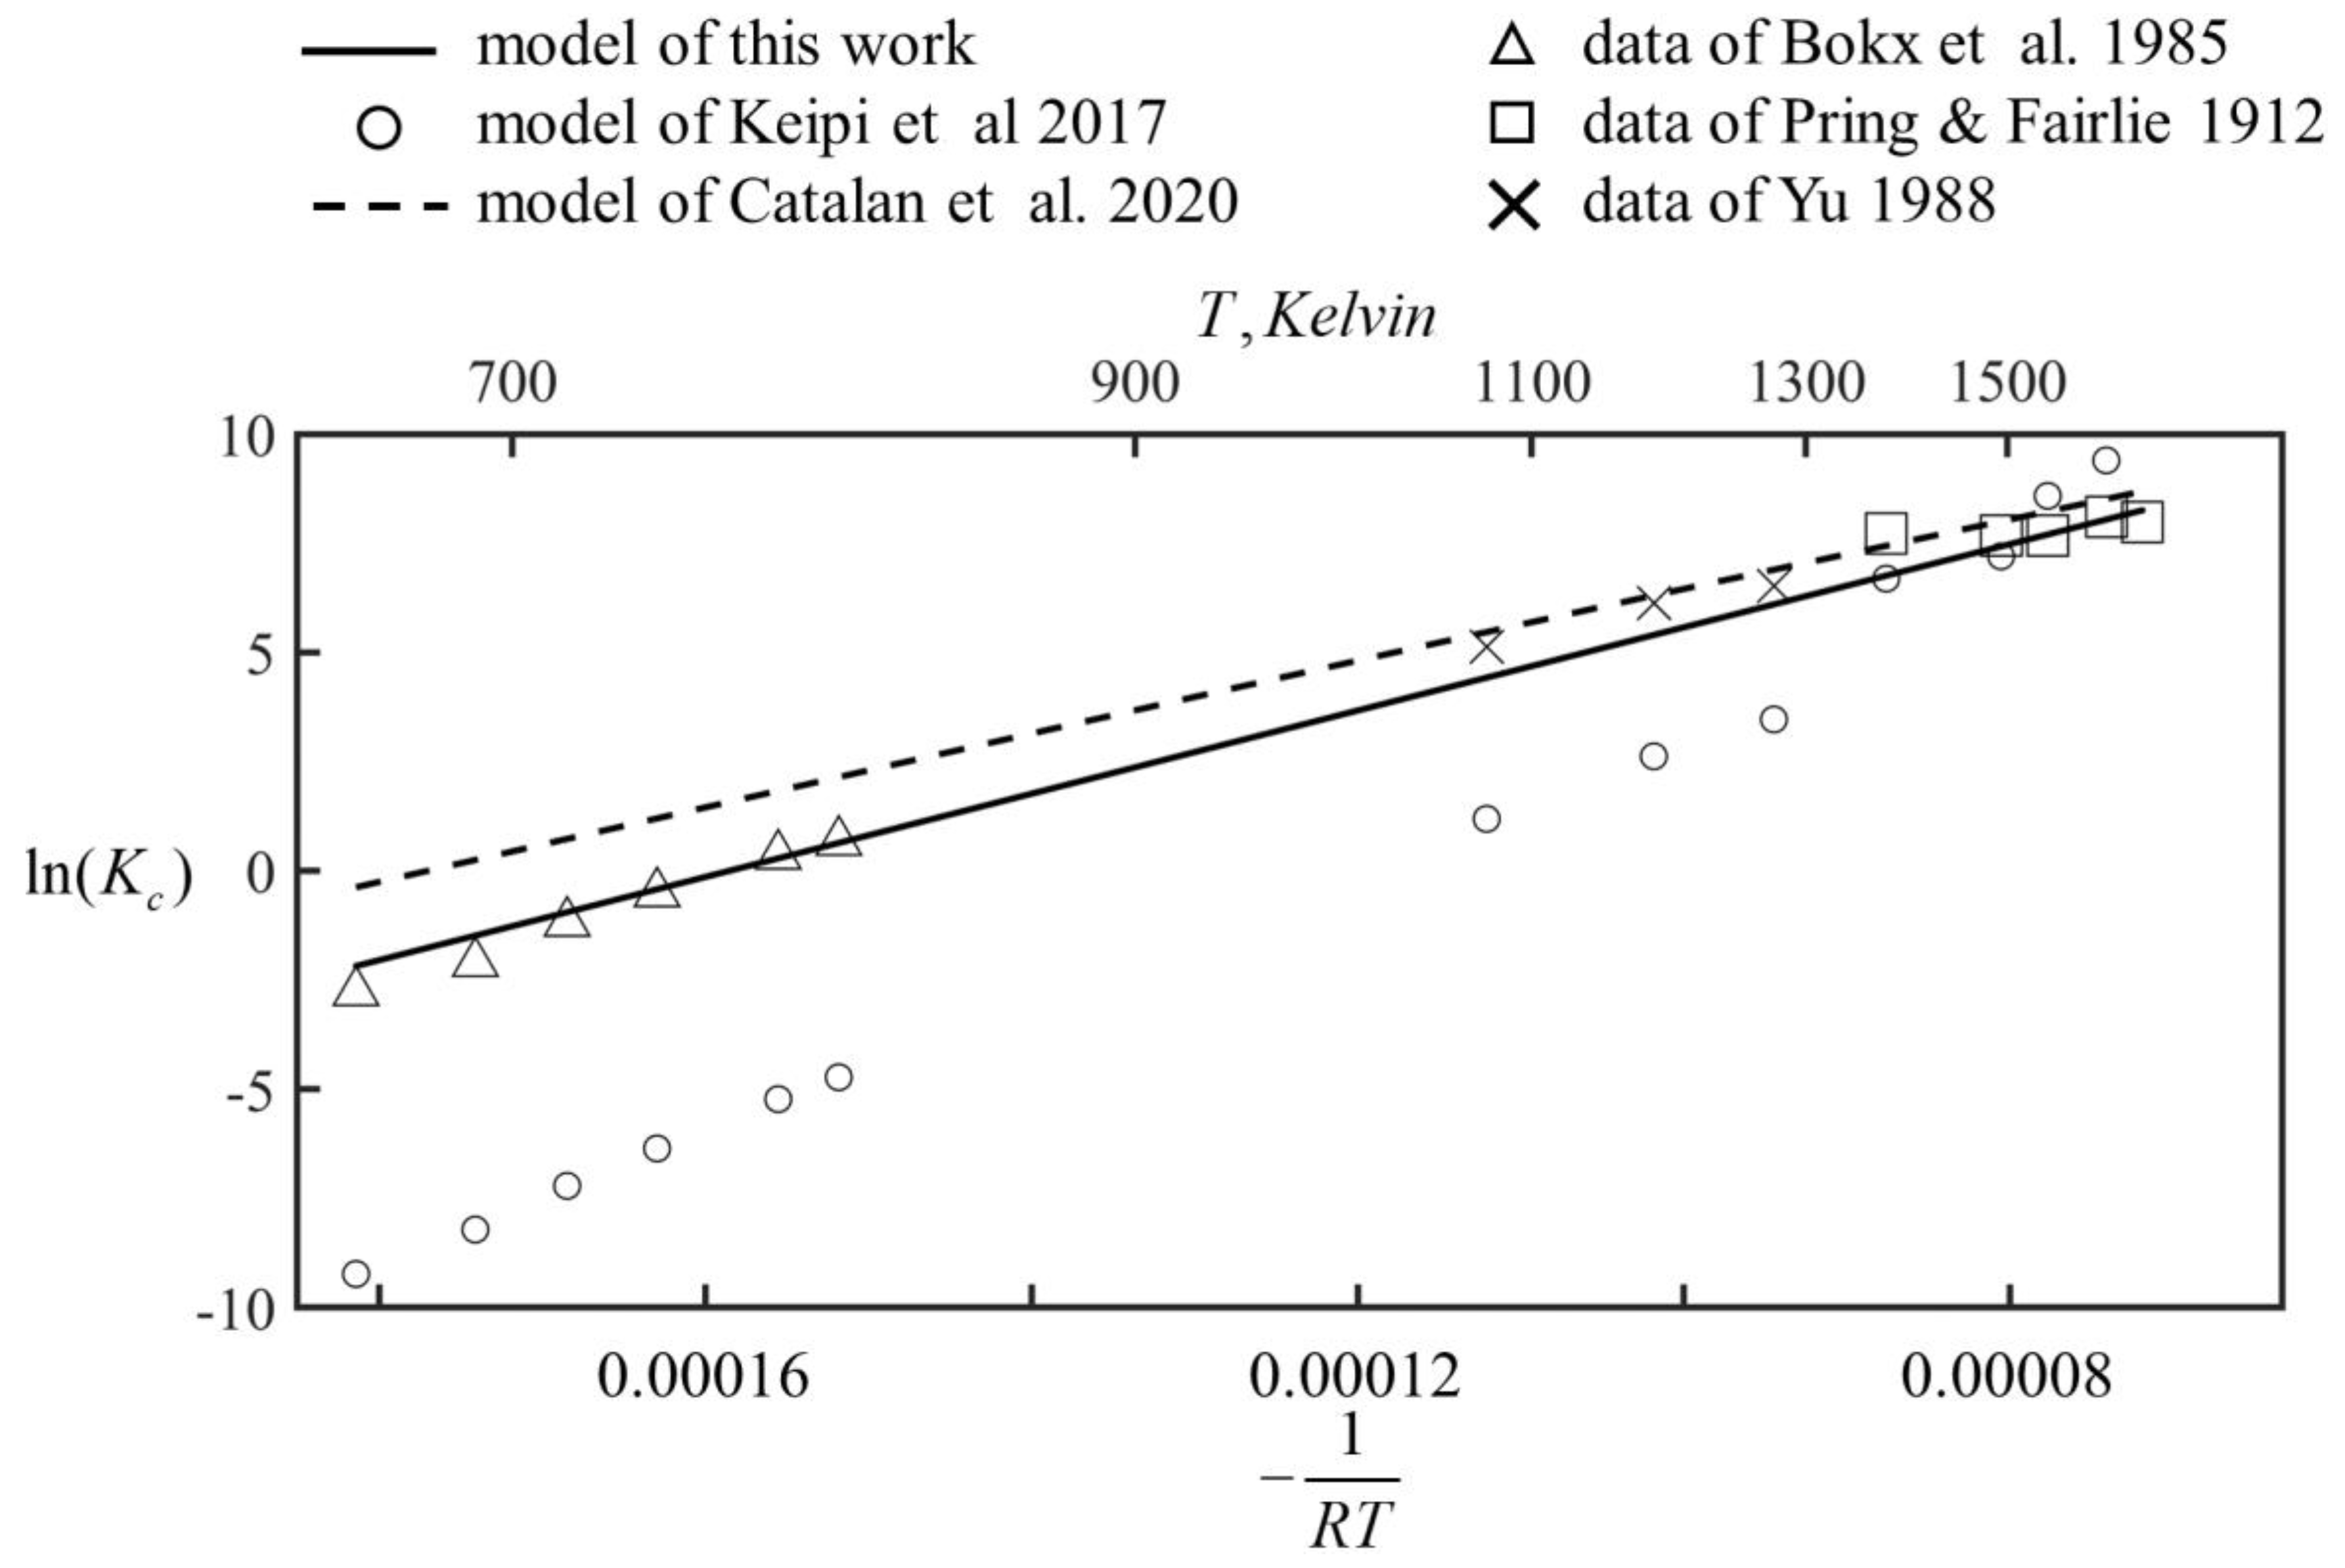
3.1. Validation of Reversible Catalytic Molten Methane Cracking Kinetics

To validate the proposed kinetics, especially the use of reactor material conservation for catalytic area calculation, Equation (5) Arrhenius coefficients k1, k2, Ef, and Er were fit to data from Upham et al. 2017 [3]. This isothermal molten methane bubbler, filled with 27% nickel and 73% bismuth, operated at low pressure (200 kPa) and high temperature (1040 °C) where forward reaction dominates. Thus, nonlinear regression was initialized with the activation energy and Arrhenius preexponential of Upham et al. 2017 (Ef = 208 kJ/mol, kf = 78,813 m/sec). However, that work provided no Arrhenius kr and Er for reversible kinetics. Thus, a preexponential and activation energy for reverse reaction were inferred from transition-state theory and van ’t Hoff equation predictions [31,54] (Appendix B):
E r E f Δ H r x n ( T )
ln ( K c ) ln ( k f e E f / R T k r e E r / R T ) Δ H r x n ( T ) R T
Subsequent nonlinear regression refined initial parameter estimates with equilibrium decomposition data from the literature [28,55,56]. Figure 3 and Figure 4 show that discovered parameters for the new kinetics model predicted experimental data from Upham et al. 2017 and published methane equilibria [3,28,55,56]. Table 1 compares the discovered kinetic coefficients kf, kr, Ef, and Er for catalytic methane cracking to prior work for noncatalytic reaction [29,30]. The discovered activation barrier for catalytic hydrogen production (kf = 209 kJ/mol) was substantially lower than values from noncatalytic work (Ef = 284 kJ/mol and Ef = 337 kJ/mol) [29,30], consistent with catalysis. Disparate kf and kr preexponentials, which result from attempts to match methane decomposition equilibria, were evident in all reversible kinetic models (Table 1). Figure 4 shows that the new reversible kinetic model fit published methane decomposition equilibrium data Kc better than prior studies [28,29,30,55,56].
The reversible models in Table 1 differ from previous work that relied only on kf and Ef [3,19,20,21,22]. These irreversible kinetic models set kr = 0, which disallows the prediction of reaction equilibria. Thus, eliminating kr likely yields an insufficient parameterization for accurate kinetics at extreme industrial reactor conditions [31]. Here, omitting kr visibly and persistently inflated results at methane conversions larger than 60% (Figure 3). Thus, although there was substantial uncertainty in the reverse Arrhenius preexponential (kr, Table 1), even at mild pressure (Figure 3, 200 kPa) the known reversibility of methane cracking had effects (Figure 3) [23,24,25,26,27,28,29,30].
The reversible catalytic methane kinetics discovered (Table 1, Equation (5)) have implications for reactor design. These reaction effects are summarized as a three-dimensional Levenspiel plot in Figure 5 [57]. Figure 5 shows that low pressure and high temperature enhance reaction rate and hydrogen production. However, dilute gas conditions at these conditions impede dense and productive reactor throughput. Conversely, high pressures support rate and allow dense reactor throughout, but limit maximal methane conversion via Le Chatelier’s principle. Thus, high pressure constrains maximal reaction extent. Figure 5 overlays these and other tradeoffs that result from reaction equilibrium.

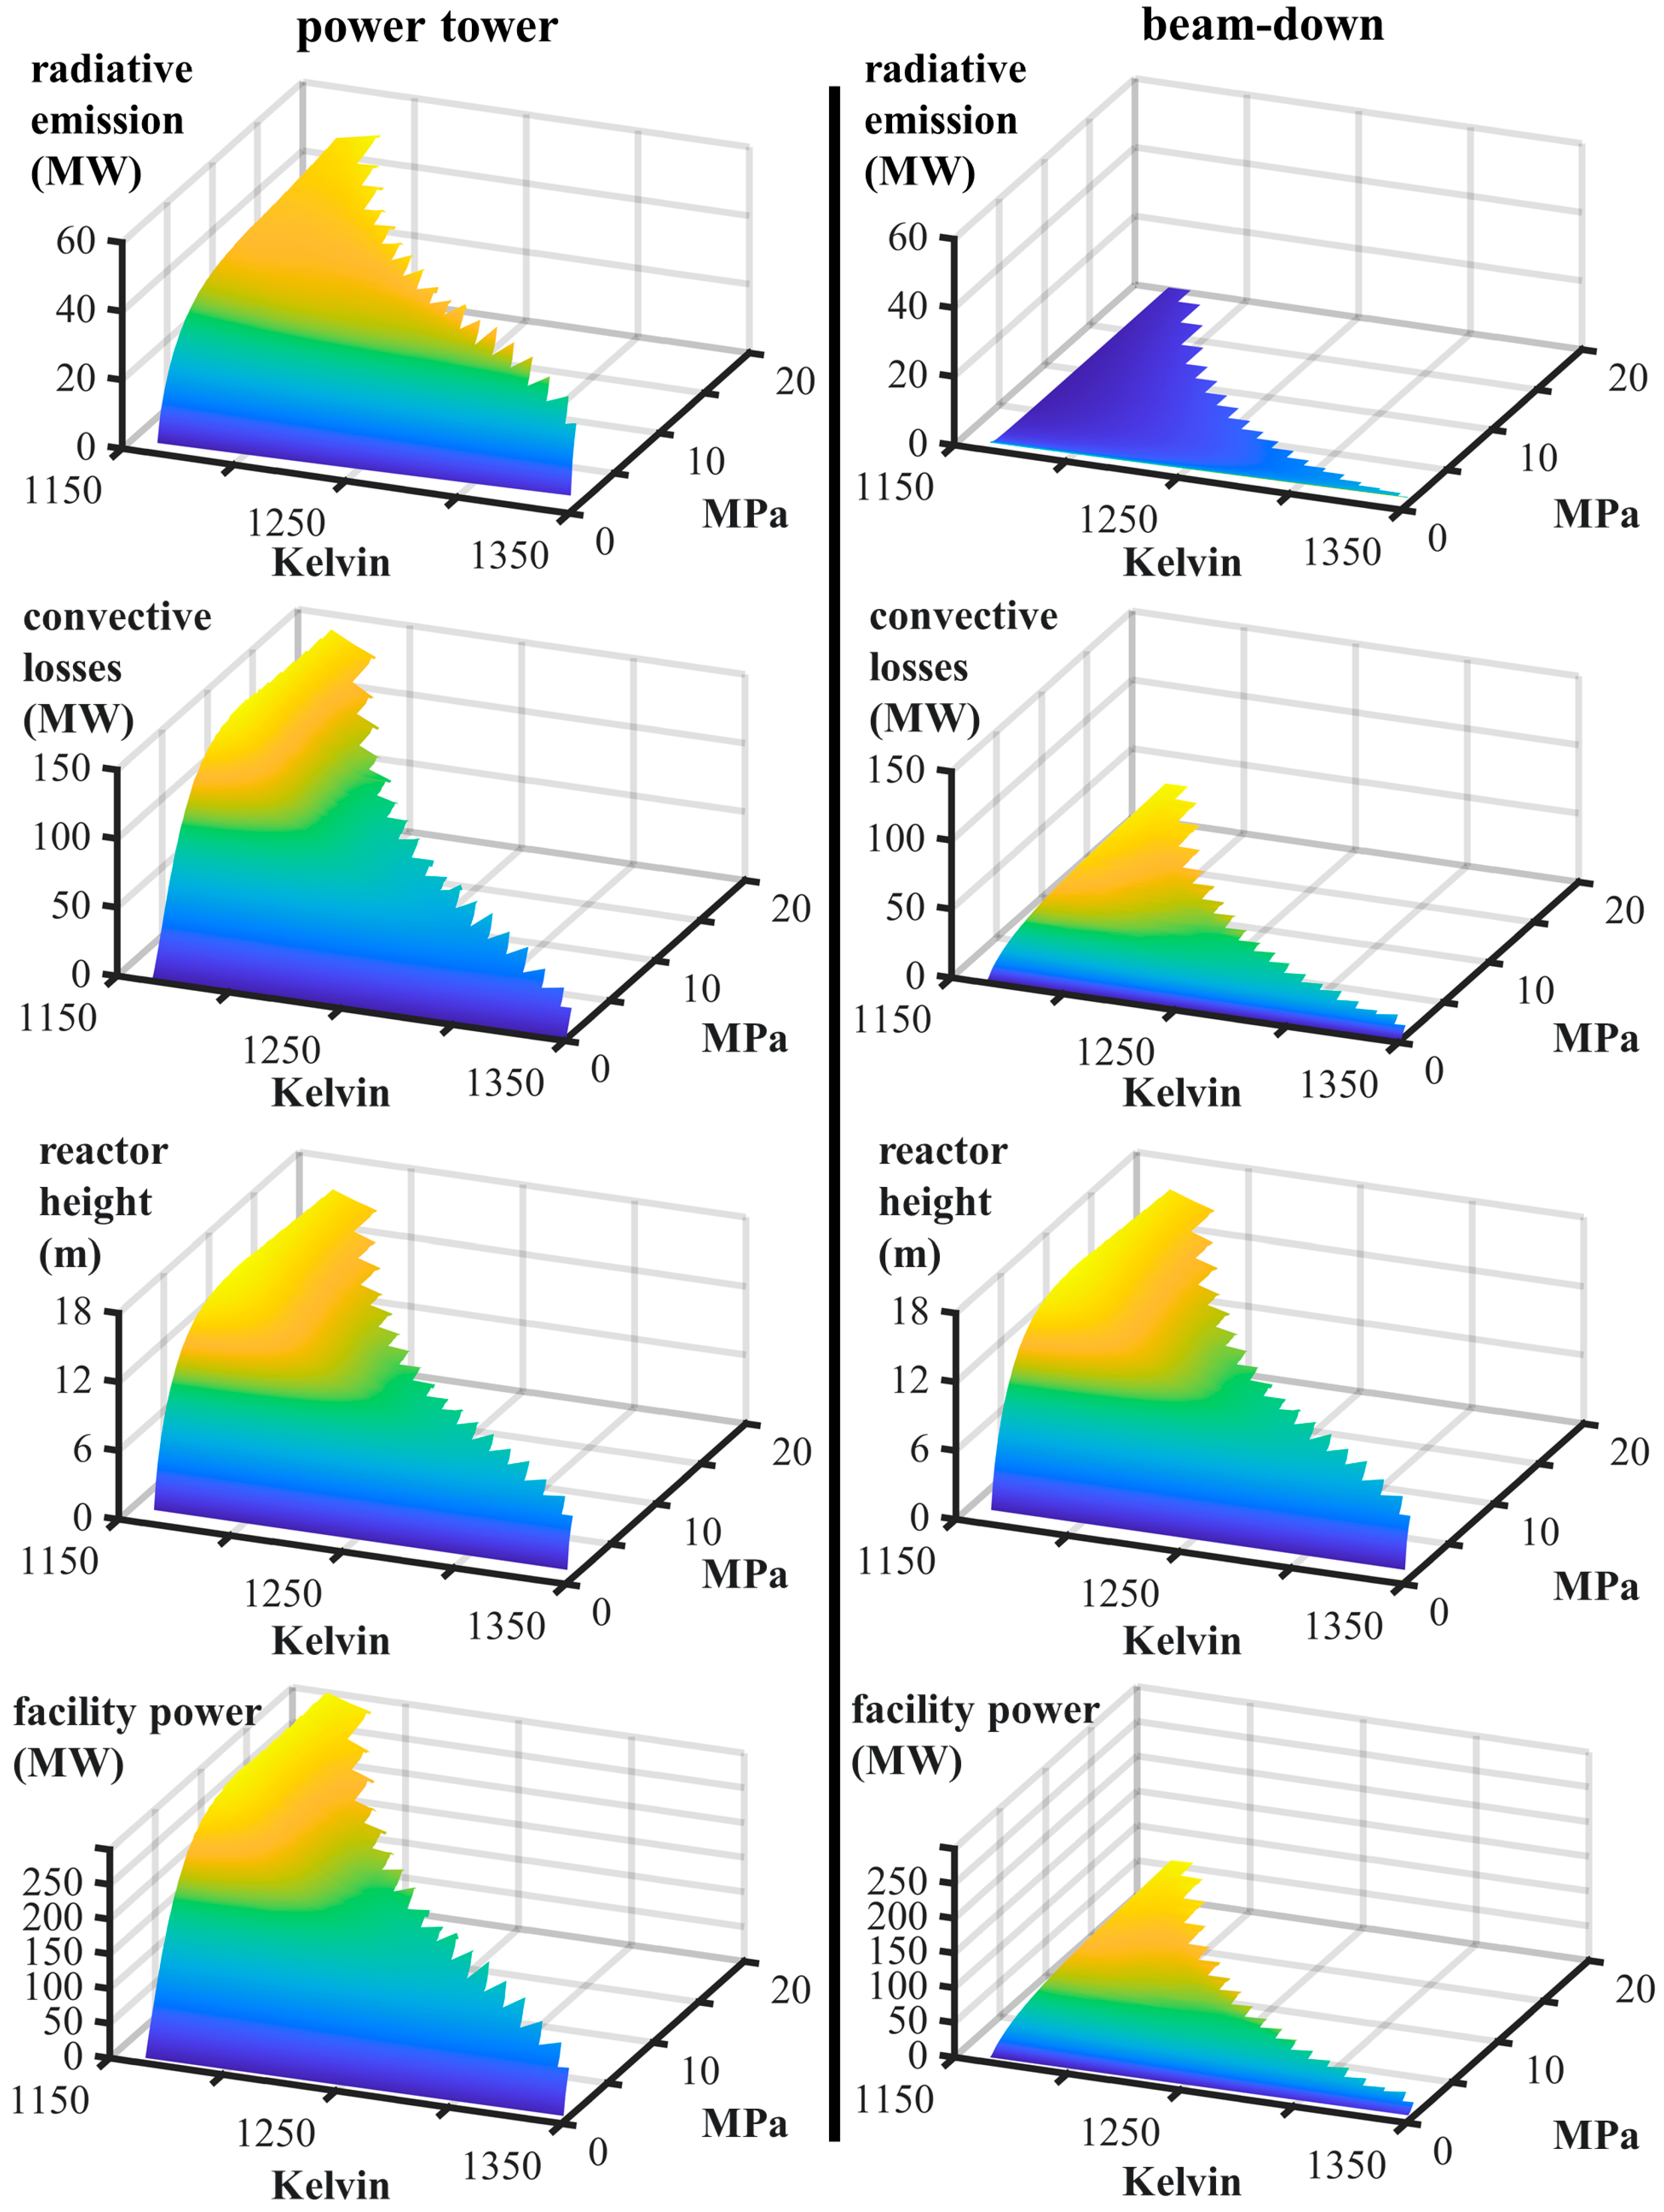
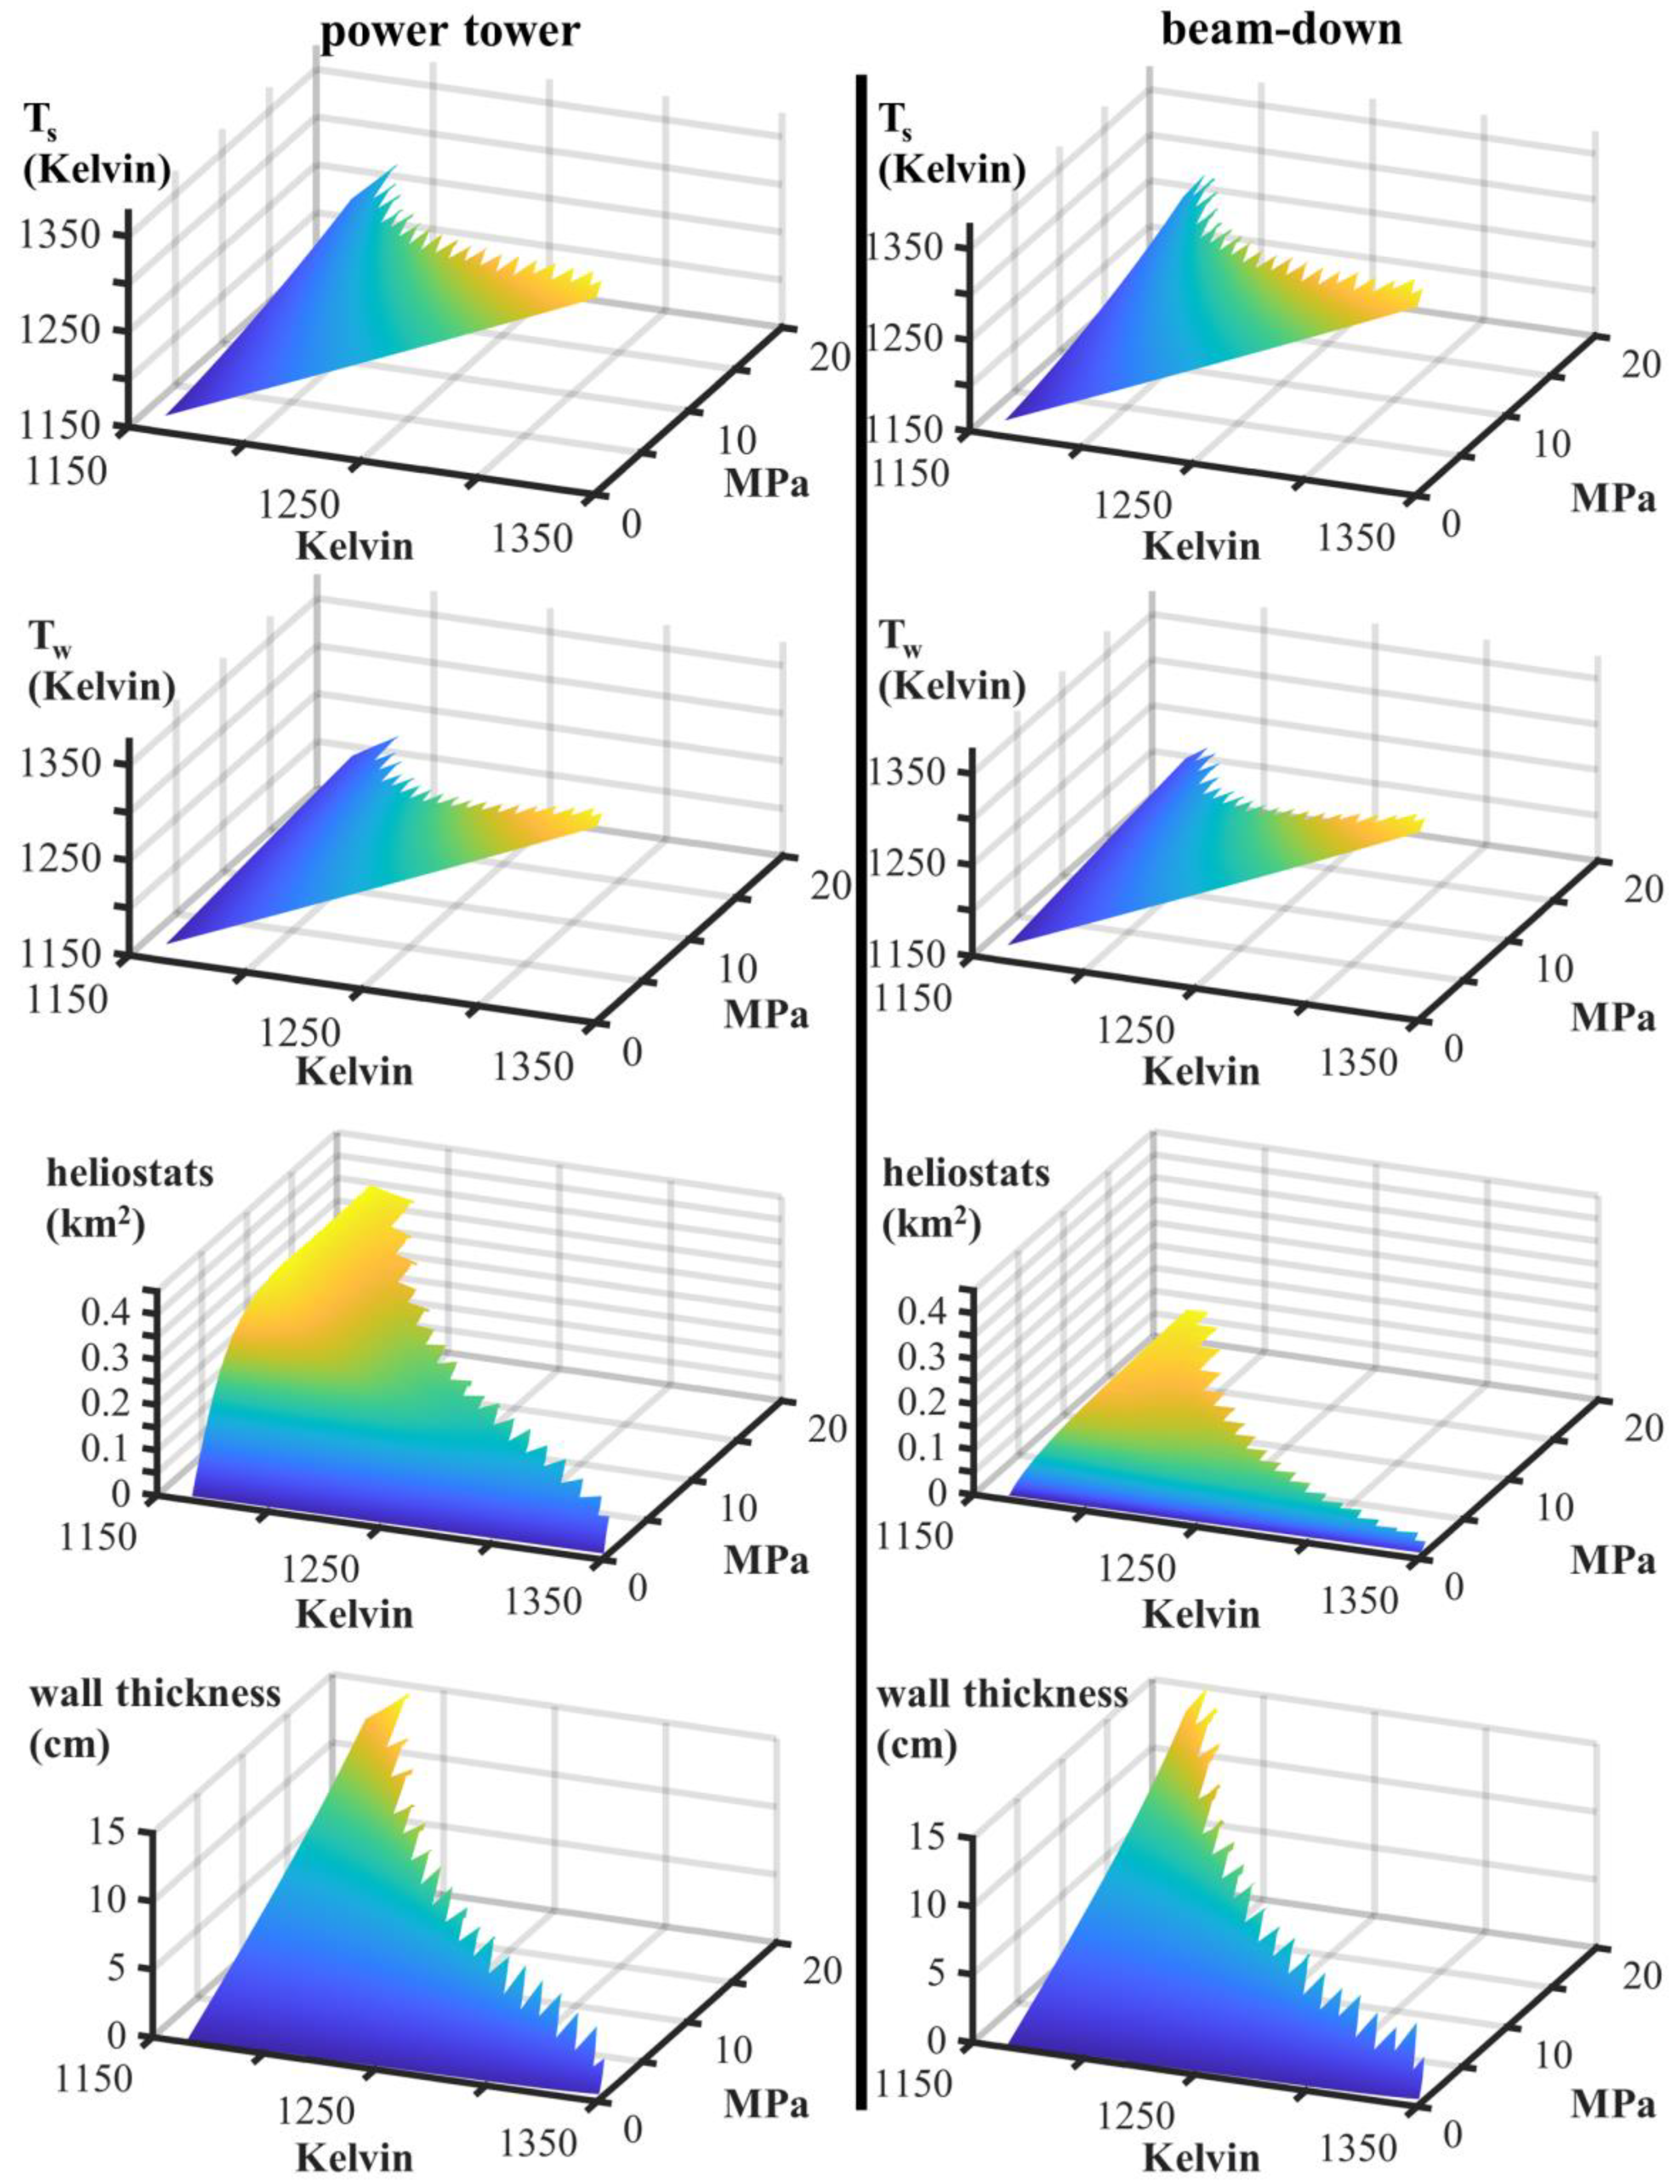
3.2. Solar Reactor Screening and Evaluation

Solar methane crackers were simulated for inlet reactant pressures from 2 to 200 atmospheres and isothermal reaction temperatures from 1150 to 1350 Kelvin, reasonable conditions in industrial practice [18,31]. Figure 6 shows simulation results after program execution on an 84 core computer. Where extreme conditions caused meltdown of the Inconel receiver, data is absent in this and subsequent figures. Solar receivers were evaluated for a pure methane feed and reactor tube radii from 0.01 to 0.5 m [42,58]. A reactor (bubbler) height was selected at each condition that maximized the multiplicand of efficiency and conversion ηX. This objective insured that reactor height H maximized energy use, but also converted substantial methane into hydrogen product:
H = arg min η X
As anticipated, efficiency was substantially higher in the beam-down reactor configuration. A maximum beam-down efficiency of 9% was discovered, whereas the most efficient power tower design was 1.7% efficient. Table 2 summarizes characteristics of the best designs on an objective or efficiency basis. Inefficiency of the power tower designs, which reemitted maximally 60 MW of radiation back to the environment, owed their exposed receivers. Conversely the cavity beam-down configuration, which approaches a blackbody as aspect ratio exceeds 4:1 [50,59,60,61], reemitted maximally 4.5 MW of radiation. These results are summarized in Figure 7. Convective power tower losses, modeled via validated semiempirical relations [43], were even higher. Power tower convection from the naked receiver approached 150 MW, while the nested beam-down receiver lost maximally 28 MW. This magnitude decrease in beam-down losses manifested as a magnitude increase in methane cracking efficiency. Relative to beam-down reactors, ineffective power tower energy use entailed large heliostat fields (Figure 8) despite the uniformity of other physical characteristics between the competing designs. Overall, results showed that power towers, despite their established use in electrical production, are unsuited to methane cracking for renewable hydrogen production.

4. Discussion

Power tower designs showed poor energy efficiency in methane reaction for hydrogen production. This approach directed only 1.7% of incident solar radiation into fungible chemical fuel (H2). Conversely, beam-down reactors achieved 9% efficiency. Although power tower and beam-down receivers were largely uniform in their reaction and physical characteristics (Figure 6, Figure 7 and Figure 8), including ultimate reactant conversion to H2 product, power towers showed radiative and convective energy losses a magnitude larger than beam-down designs (Figure 6). Overall power tower receivers, versus buried beam-down receivers, suffered from exposure and energy losses to the environment through convection and radiative emission. Poor power tower energy performance was highlighted by the large heliostat field a Solar Two tower would require (Figure 8). Figure 8 shows that although receiver temperatures and wall thicknesses were similar across facility operating conditions, the best power tower design demands a heliostat field of 0.18 km2 to overcome radiative and convective losses. Conversely, the best beam-down heliostat field was 0.04 km2, which likely entails lower facility capital and maintenance costs. Notably, 30–50% of solar facility costs are sunk in heliostat fields, which parasitically consume 3.8% of facility power and require persistent calibration [48,49,62,63,64].
All the simulated solar reactors showed low reactant methane conversion into hydrogen (X < 30%, Figure 6). Conversion can be constrained by thermodynamics, kinetics, or heat transport [32]. To explore potential limitations Figure 9 plots the theoretical maximum conversion of methane at reactor effluent conditions against simulated conversion. Although Figure 9 shows regions where theoretical and simulated conversion converge or diverge, suggestive of thermodynamic or kinetic limitation, respectively, the best designs discovered were likely heat transport constrained. As shown in Table 2, heat movement drove large temperature gradients within the best discovered reactors. Although reaction occurred at 1255–1325 Kelvin, exterior receiver conditions were on the threshold of Inconel meltdown (1316–1365 Kelvin) under pressurized conditions (21.71–69.10 atm).
Higher external temperatures, which would drive added heat into reaction through larger conductive gradients, were constrained by Inconel’s strength. Larger heat transfer area, which would open added paths for reaction heat, were constrained by receiver geometry. Thus, Solar Two commercial reactor concepts are likely thermally limited by Inconel physics and receiver geometry, not reaction thermodynamics or kinetics. Although power tower and beam-down receiver designs are mature in electrical generation [15], new solar designs are needed to fully realize the potential of methane cracking for hydrogen production. Ideally, a solar methane cracker is reaction-limited by thermodynamics or kinetics, not constrained by the ingress of solar heat. Under heat constraints, improvements in reaction catalysis may go unrealized. Recently, reaction catalysis with molten MnCl2–KCl lowered the activation barrier for methane cracking to 160 kJ/mol [65], versus the 209 kJ/mol explored here. However, to fully leverage this breakthrough heat bottlenecks should be overcome with design innovation.
The new reactor model relied on assumptions common in chemical engineering practice, including well-mixed isothermal reaction and heat transfer via semiempirical Nusselt correlations (Appendix B) [18,31,32,43,44,66]. The Nusselt correlations were drawn from validated and published results [43,44,66]. Furthermore, presumably liquid metal catalysts bubble and vigorously mix to collapse thermal and material gradients. However, deeper multiphysics modeling and/or pilot plant experimentation is needed to test these assumptions. This work establishes solar methane cracking feasibility and facility conditions that can inform future rigorous multiphysics simulation and pilot plant operation. Future modeling, which appears worthwhile given results here that show hydrogen production efficiencies comparable to energy capture by photovoltaics [67], can explore the limitations of isothermal and Nusselt approximations.

5. Conclusions

Unlike prior work [3,19,20,21,22], here catalytic methane cracking explored expansive industrial conditions with a reversible kinetic model, a model that fit published data (Figure 3 and Figure 4, Table 1). The model conformed to plug flow approximations used widely in chemical reactor design [18,31,32], yet still depended on catalytic surface [3]. Performance metrics and conditions were established for the future detailed multiphysics simulation of solar catalytic methane crackers. Contrary to previous analysis [68], a beam-down reactor, versus a power tower, was most feasible. The best discovered beam-down design was 9% efficient after radiative, convective, and heliostat losses. However, this mature commercial design was heat transfer limited, not reaction limited, which motivates research for new receiver configurations. Higher facility efficiencies are likely possible in solar reactors if heat debottlenecking realizes maximal reaction kinetics. Feasible solar hydrogen from established or new reactor concepts can be further converted to liquid ammonia for transportation use or burned directly in fuel cells [69]. Thus, clean solar catalytic molten hydrogen production is a promising transitional technology towards decarbonization [13]. Further studies that more deeply explore beam-down methane cracking physics, development, and heat transfer appear warranted.

Author Contributions

Conceptualization, A.W.W.; investigation, S.C.R.; supervision T.A.A. and J.T.E.S.; review and editing K.M.W. All authors have read and agreed to the published version of the manuscript.

Funding

This research received no external funding.

Conflicts of Interest

The authors declare no conflict of interest.

Appendix A

Appendix A.1. Greek Variable Definitions

αfractionaleffective absorptivity of a receiver surface from ray tracing
εfractionaleffective emissivity of a receiver surface from ray tracing
η%energy efficiency of a solar receiver in hydrogen production
ømetersdiameter of a vessel.
ρkg/m3density of molten 27% nickel, 73% bismuth [33,34]
ρgaskg/m4gas density
ρinletkg/m5gas density at a reactor tube inlet temperature and pressure
σW/(m2K4)Stefan–Boltzmann constant [5.67…×10–8 W/(m2K4)]
σYS(T)PaInconel temperature-dependent yield strength [46]

Appendix A.2. English Variable Definitions

Abubblem2area of bubble
Abubblersm2area of gas emanation on a gas distributor
Atubem2cross-sectional area of a bubbler (reactor) tube
bbubblesnumber of bubbles initiated by a gas distributor
bubbles/secrate of bubble emanation from a gas distributor
Cp,iJ/(mol·Kelvin)heat capacity of chemical species i
EfJ/molforward reaction activation energy (Table 1)
ErJ/molreverse reaction activation energy (Table 1)
Ffractionalview factor [16]
gm/s2acceleration of gravity (9.81 m/s2)
GrunitlessGrashoff number
hW/(m2Kelvin)convective heat transfer coefficient to air [43]
hwallW/(m2Kelvin)convective heat transfer coefficient to molten metal [44]
Hmetersreactor tube manifold height
ΔHrxnJ/molenthalpy of reaction
kfm/secforward Arrhenius preexponential (Table 1)
krm4/secreverse Arrhenius preexponential (Table 1)
k(T)W/(m·Kelvin)Inconel thermal conductivity at temperature T [46]
Kcmol/m3concentration equilibrium constant
nintegernumber of tubes in a receiver manifold
inletmol/secmole flow of reactor tube gaseous feed
nCmolesmoles of solid carbon
nCH4molesmoles of gaseous methane
nH2molesmoles of gaseous hydrogen
Cmol/secmole flow of solid carbon
CH4mol/secmole flow of gaseous methane
H2mol/sedmole flow of gaseous hydrogen
NuunitlessNusselt number
N(r)W/m2flux at radial coordinate r in an Inconel tube wall
PeunitlessPeclet number
PinletPascalsreactor tube feed pressure
P(z)Pascalsaxial pressure in a reactor tube at elevation z
QconvectionWattsreceiver losses to ambient air by natural convection
QfieldWattssolar energy incident on a heliostat field reflective area
QradiativeWattsreceiver emissive losses by radiation
QwallWattsenergy that trespasses a reactor tube interior wall
Q(z)m3/secvolumetric flow at elevation z in a reactor tube
rmetersradial coordinate
rbubblemetersradius of a bubble
rbubble,inletmetersinitial radius of a bubble entering a reactor tube
RJ/(mol·Kelvin)gas constant
metersinner radius of a reactor tube
Sm2surface area of a solar receiver
tsecondstime coordinate
TKelvinisothermal reaction temperature
TsKelvinouter Inconel solar receiver surface temperature
TwKelvininner Inconel reactor tube wall temperature
vbubblerm/secinitial velocity of a bubble entering a reactor tube
Vm3/secfeed volumetric flow into a reactor tube
Vbubblem3volume of a bubble
Vbubble,inletm3initial volume of a bubble entering a reactor tube
wmetersreactor tube Inconel wall thickness
X%methane conversion to hydrogen gas
yCH4fractionalmole fraction of gaseous methane
yH2fractionalmole fraction of gaseous hydrogen
zmetersaxial coordinate (elevation in a reactor tube)
Zunitlesscompressibility factor from the SRK equation of state [35]

Appendix B

Physical Property Correlations

Density of molten 73% bismuth and 27% nickel liquid alloy (composition average) [33,34]:
ρ [ k g / m 3 ] = 0.27 ( 9908 1.182 T l i q u i d n i c k e l ρ ) + 0.73 ( 10665 1.1589 T l i q u i d b i s m u t h ρ )
Properties of Inconel solid [46]:
σ Y S [ P a s c a l s ] = 733141411.067 ( 2041707.776 ) T + ( 2286.861 ) T 2 ( 0.861 ) T 3
k [ W / ( m K ) ] = 6.7439 + ( 0.0166 ) T
Determination of ΔH(T) from the van t’ Hoff equation for regression initialization [13,32,70]:
Δ H ( T ) = Δ H o ( T ) + T 298 C p , C H 4 ( T ) d T + 298 T [ C p , C ( T ) + 2 C p , H 2 ( T ) ] d T
Δ H o ( T ) = 75 k J / m o l
C p , s p e c i e s [ J / ( m o l · K e l v i n ) ] = a 1 + a 2 T + a 3 T 2 + a 4 T 3
Table A1. Coefficients for use in Equation (A6).
Speciesa1a2a3a4
CH418.3862865.470402(10−2)1.034479(10−5)−9.833387(10−9)
C−5.3946675.812952(10−2)−4.177213(10−5)−1.071678(10−8)
H228.6535177.762754(10−4)1.324842(10−7)6.664873(10−10)
Power tower convective heat transfer coefficient to the ambient air [43]:
N u = 0.052 ( G r ) 0.36
Beam-down cavity convective heat transfer coefficient to the ambient air [43]:
N u = 0.088 ( G r ) 1 / 3 ( T s / 298 ) 0.18
Molten metal convective heat transfer coefficient [44]:
N u = 4.8 + 0.025 P e 0.8
Effective emissivity of the corrugated power tower receiver surface from 2D ray tracing for a material emissivity of 0.95 [50]:
ε = 0.644 + ( 0.066 ) , [ 0.01 0.50 m e t e r s ]
where all radiative emission and reflection was assumed diffuse. Note that although the material emissivity was 0.95, light traps in receiver manifold corrugations to suppress reradiation escape.
Effective absorptivity of the corrugated power tower receiver surface from 2D ray tracing for a material absorptivity of 0.95 [50]:
α = 0.959 ( 0.002 ) , [ 0.01 0.50 m e t e r s ]
where all radiative reflection was assumed diffuse. Note that although the material absorptivity was 0.95, light traps in receiver manifold corrugations to inflate absorptivity.
Effective emissivity of the corrugated beam-down receiver surface from 2D ray tracing for a material emissivity of 0.95 [50]:
ε = 0.642 ( 0.084 ) , [ 0.01 0.50 m e t e r s ]
where all radiative emission and reflection was assumed diffuse. Note that although the material emissivity was 0.95, light traps in receiver manifold corrugations to suppress reradiation escape.
Effective absorptivity of the corrugated beam-down receiver from 2D ray tracing for a material absorptivity of 0.95 [50]:
α = 0.959 + ( 0.003 ) , [ 0.01 0.50 m e t e r s ]
where all radiative reflection was assumed diffuse. Note that although the material absorptivity was 0.95, light traps in receiver manifold corrugations to inflate absorptivity.
View factor for power tower diffuse emission to the environment:
F = 1
View factor for beam-down cavity tube manifold diffuse emission and diffuse reflection to the environment [16]:
F = 1 1 2 ( 2 + ( H 2.55 ) 2 ) 2 4 1 2 ( H 2.55 ) 2
Specifically, Equation (A15) corresponds to the Howell Catalog of Radiation View Factors entry C−80 for a disc and cylinder radius of 2.55 m, which corresponds to the Solar Two manifold diameter of 5.1 m [14].
View factor for beam-down cavity cylinder base (bottom) diffuse emission and diffuse reflection to the environment [16].
F = 1 2 ( ( H 2.55 ) 2 ( 2 ( 2.55 H ) 2 + 1 ) ( ( H 2.55 ) 2 ( 2 ( 2.55 H ) 2 + 1 ) ) 2 4 )
Specifically, Equation (A16) corresponds to the Howell Catalog of Radiation View Factors C-40 for discs of radius of 2.55 m, which corresponds to the Solar Two manifold diameter of 5.1 m [14].

References

  1. Loutzenhiser, P.G.; Muroyama, A.P. A review of the state-of-the-art in solar-driven gasification processes with carbonaceous materials. Sol. Energy 2017, 156, 93–100. [Google Scholar] [CrossRef]
  2. Palmer, C.; Upham, D.C.; Smart, S.; Gordon, M.J.; Metiu, H.; McFarland, E.W. Dry reforming of methane catalysed by molten metal alloys. Nat. Catal. 2020, 3, 83–89. [Google Scholar] [CrossRef]
  3. Upham, D.C.; Agarwal, V.; Khechfe, A.; Snodgrass, Z.R.; Gordon, M.J.; Metiu, H.; McFarland, E.W. Catalytic molten metals for the direct conversion of methane to hydrogen and separable carbon. Science 2017, 358, 917–921. [Google Scholar] [CrossRef] [PubMed] [Green Version]
  4. Henry, A.; Prasher, R.; Majumdar, A. Five thermal energy grand challenges for decarbonization. Nat. Energy 2020, 5, 635–637. [Google Scholar] [CrossRef]
  5. Ehrhart, B.D.; Muhich, C.L.; Al-Shankiti, I.; Weimer, A.W. System efficiency for two-step metal oxide solar thermochemical hydrogen production—Part 3: Various methods for achieving low oxygen partial pressures in the reduction reaction. Int. J. Hydrogen Energy 2016, 41, 19904–19914. [Google Scholar] [CrossRef] [Green Version]
  6. Ehrhart, B.D.; Muhich, C.L.; Al-Shankiti, I.; Weimer, A.W. System efficiency for two-step metal oxide solar thermochemical hydrogen production—Part 1: Thermodynamic model and impact of oxidation kinetics. Int. J. Hydrogen Energy 2016, 41, 19881–19893. [Google Scholar] [CrossRef] [Green Version]
  7. Ehrhart, B.D.; Muhich, C.L.; Al-Shankiti, I.; Weimer, A.W. System efficiency for two-step metal oxide solar thermochemical hydrogen production—Part 2: Impact of gas heat recuperation and separation temperatures. Int. J. Hydrogen Energy 2016, 41, 19894–19903. [Google Scholar] [CrossRef] [Green Version]
  8. Scheffe, J.R.; Steinfeld, A. Oxygen exchange materials for solar thermochemical splitting of H2O and CO2: A review. Mater. Today 2014, 17, 341–348. [Google Scholar] [CrossRef]
  9. Carrillo, R.J.; Scheffe, J.R. Advances and trends in redox materials for solar thermochemical fuel production. Sol. Energy 2017, 156, 3–20. [Google Scholar] [CrossRef]
  10. Bader, R.; Lipiński, W. Solar thermochemical processes. In Solar Energy; World Scientific: Hackensack, NJ, USA, 2016; pp. 345–394. [Google Scholar]
  11. Binotti, M.; Di Marcoberardino, G.; Biassoni, M.; Manzolini, G. Solar hydrogen production with cerium oxides thermochemical cycle. In Proceedings of the AIP Conference Proceedings; AIP Publishing LLC: Melville NY, USA, 2017; Volume 1850, p. 100002. [Google Scholar]
  12. Giostri, A.; Binotti, M.; Sterpos, C.; Lozza, G. Small scale solar tower coupled with micro gas turbine. Renew. Energy 2020, 147, 570–583. [Google Scholar] [CrossRef]
  13. Weger, L.; Abánades, A.; Butler, T. Methane cracking as a bridge technology to the hydrogen economy. Int. J. Hydrogen Energy 2017, 42, 720–731. [Google Scholar] [CrossRef] [Green Version]
  14. Pacheco, J.E.; Bradshaw, R.W.; Dawson, D.B.; De la Rosa, W.; Rockwell, G.; Goods, H.S.; Hale, M.J.; Jacobs, P. Final Tests and Evaluation Results from the Solar Two Project; Sandia National Labs: Albuqerque, NM, USA, 2002; pp. 1–21. [Google Scholar]
  15. Ho, C.K.; Iverson, B.D. Review of high-temperature central receiver designs for concentrating solar power. Renew. Sustain. Energy Rev. 2014, 29, 835–846. [Google Scholar] [CrossRef] [Green Version]
  16. Howell, J.R.; Menguc, M.P.; Siegel, R. Thermal Radiation Heat Transfer; CRC Press: Boca Raton, FL, USA, 2010; ISBN 1-4398-9455-8. [Google Scholar]
  17. Diago, M.; Calvet, N.; Armstrong, P.R. Net power maximization from a faceted beam-down solar concentrator. Sol. Energy 2020, 204, 476–488. [Google Scholar] [CrossRef]
  18. Turton, R.; Bailie, R.C.; Whiting, W.B.; Shaeiwitz, J.A. Analysis, Synthesis and Design of Chemical Processes; Pearson Education: London UK, 2008; ISBN 0-13-245918-3. [Google Scholar]
  19. Parkinson, B.; Tabatabaei, M.; Upham, D.C.; Ballinger, B.J.; Greig, C.; Smart, S.; McFarland, E. Hydrogen production using methane: Techno-economics of decarbonizing fuels and chemicals. Int. J. Hydrogen Energy 2018, 43, 2540–2555. [Google Scholar] [CrossRef]
  20. Trommer, D.; Hirsch, D.; Steinfeld, A. Kinetic investigation of the thermal decomposition of CH4 by direct irradiation of a vortex-flow laden with carbon particles. Int. J. Hydrogen Energy 2004, 29, 627–633. [Google Scholar] [CrossRef]
  21. Paxman, D.; Trottier, S.; Flynn, M.R.; Kostiuk, L.; Secanell, M. Experimental and numerical analysis of a methane thermal decomposition reactor. Int. J. Hydrogen Energy 2017, 42, 25166–25184. [Google Scholar] [CrossRef]
  22. Steinberg, M. Production of hydrogen and methanol from natural gas with reduced CO2 emission. Int. J. Hydrogen Energy 1998, 23, 419–425. [Google Scholar] [CrossRef]
  23. Blackwood, J.D. The kinetics of the system carbon-hydrogen-methane. Aust. J. Chem. 1962, 15, 397–408. [Google Scholar] [CrossRef]
  24. Blackwood, J.D. The reaction of Carbon with Hydrogen at High Pressure. Aust. J. Chem. 1959, 12, 14–28. [Google Scholar] [CrossRef]
  25. Gulbransen, E.A.; Andrew, K.F.; Brassart, F.A. The reaction of hydrogen with graphite at 1200° to 1650 °C. J. Electrochem. Soc. 1965, 112, 49–52. [Google Scholar] [CrossRef]
  26. Hedden, K. The formation of methane from hydrogen and carbon at high temperatures and pressures. Z. Elektrochem. Angew. Phys. Chem. 1962, 60, 125–131. [Google Scholar]
  27. Parolin, G.; Borgognga, A.; Iaquaniello, G.; Salladini, A.; Cerbelli, S. Deactivation-induced dynamics of the reaction front in a fixed-bed catalytic membrane reactor: Methane cracking as a case study. Int. J. Hydrogen Energy 2020. [Google Scholar] [CrossRef]
  28. Pring, J.N.; Fairlie, D.M. X.—The methane equilibrium. J. Chem. Soc. Trans. 1912, 101, 91–103. [Google Scholar] [CrossRef] [Green Version]
  29. Catalan, L.J.; Rezaei, E. Coupled hydrodynamic and kinetic model of liquid metal bubble reactor for hydrogen production by noncatalytic thermal decomposition of methane. Int. J. Hydrogen Energy 2020, 45, 2486–2503. [Google Scholar] [CrossRef]
  30. Keipi, T.; Li, T.; Løvås, T.; Tolvanen, H.; Konttinen, J. Methane thermal decomposition in regenerative heat exchanger reactor: Experimental and modeling study. Energy 2017, 135, 823–832. [Google Scholar] [CrossRef]
  31. Luyben, W.L. Principles and Case Studies of Simultaneous Design; Wiley: Hoboken, NJ, USA, 2011; ISBN 978-0-470-92708-3. [Google Scholar]
  32. Rawlings, J.B.; Ekerdt, J.G. Chemical Reactor Analysis and Design Fundamentals; Nob Hill Pub, LLC.: Madison WS, USA, 2002; ISBN 0-615-11884-4. [Google Scholar]
  33. Cahill, J.A.; Kirshenbaum, A.D. The density of liquid bismuth from its melting point to its normal boiling point and an estimate of its critical constants. J. Inorg. Nucl. Chem. 1963, 25, 501–506. [Google Scholar] [CrossRef]
  34. Grosse, A.V.; Kirshenbaum, A. The densities of liquid iron and nickel and an estimate of their critical temperature. J. Inorg. Nucl. Chem. 1963, 25, 331–334. [Google Scholar] [CrossRef]
  35. Soave, G. Equilibrium constants from a modified Redlich-Kwong equation of state. Chem. Eng. Sci. 1972, 27, 1197–1203. [Google Scholar] [CrossRef]
  36. Seader, J.D.; Henley, E.J.; Roper, D.K. Separation Process Principles; Wiley: New York, NY, USA, 1998; Volume 25. [Google Scholar]
  37. Eldridge, R.B.; Fair, J.R. Sieve-tray extractor continuous-phase mixing. Ind. Eng. Chem. Res. 1999, 38, 218–222. [Google Scholar] [CrossRef]
  38. Eldridge, R.B.; Humphrey, J.L.; Fair, J.R. Continuous Phase Mixing on Crossflow Extraction Sieve Trays. Sep. Sci. Technol. 1987, 22, 1121–1134. [Google Scholar] [CrossRef]
  39. Davies, R.M.; Taylor, G.I. The mechanics of large bubbles rising through extended liquids and through liquids in tubes. Proc. R. Soc. Lond. Ser. A Math. Phys. Sci. 1950, 200, 375–390. [Google Scholar]
  40. Bohn, M.S. Experimental investigation of the direct absorption receiver concept. Energy 1987, 12, 227–233. [Google Scholar] [CrossRef]
  41. Martinek, J.; Weimer, A.W. Design considerations for a multiple tube solar reactor. Sol. Energy 2013, 90, 68–83. [Google Scholar] [CrossRef]
  42. Klingensmith, L. Development of Extruded Heavy-Wall Large Diameter Nickel-Base Alloy Piping for AUSC Power Plants. In Proceedings of the Asian Coalition for Climate and Energy, Shanghai, China, 23–26 August 2011; pp. 272–298. [Google Scholar]
  43. Boehm, R.F. A Review of Convective Loss Data from Solar Central Receivers. J. Sol. Energy Eng. 1987, 109, 101–107. [Google Scholar] [CrossRef]
  44. Metals, U.S.O. of N.R.C. on the B.P. of L. Liquid-Metals Handbook; US Government Printing Office: Washington DC, USA, 1954; Volume 2.
  45. Bird, R.B.; Stewart, W.E.; Lightfoot, E.N.; Meredith, R.E. Transport phenomena. J. Electrochem. Soc. 1961, 108, 78C. [Google Scholar] [CrossRef]
  46. Incoloy Alloy 800H & 800HT; Special Metals Corporation: Huntington, WV, USA, 2004.
  47. Behar, O.; Khellaf, A.; Mohammedi, K. A review of studies on central receiver solar thermal power plants. Renew. Sustain. Energy Rev. 2013, 23, 12–39. [Google Scholar] [CrossRef]
  48. Bhargav, K.R.; Gross, F.; Schramek, P. Life Cycle Cost Optimized Heliostat Size for Power Towers. Energy Procedia 2014, 49, 40–49. [Google Scholar] [CrossRef] [Green Version]
  49. Mancini, T.R.; Gary, J.A.; Kolb, G.J.; Ho, C.K. Power Tower Technology Roadmap and Cost Reduction Plan; SAND2011-2419; Sandia National Laboratories: Albuquerque, NM, USA, 2011; p. 7.
  50. Rowe, S.C.; Groehn, A.J.; Palumbo, A.W.; Chubukov, B.A.; Clough, D.E.; Weimer, A.W.; Hischier, I. Worst-case losses from a cylindrical calorimeter for solar simulator calibration. Opt. Express 2015, 23, A1309–A1323. [Google Scholar] [CrossRef]
  51. Rowe, S.C.; Hischier, I.; Palumbo, A.W.; Chubukov, B.A.; Wallace, M.A.; Viger, R.; Lewandowski, A.; Clough, D.E.; Weimer, A.W. Nowcasting, predictive control, and feedback control for temperature regulation in a novel hybrid solar-electric reactor for continuous solar-thermal chemical processing. Sol. Energy 2018, 174, 474–488. [Google Scholar] [CrossRef]
  52. Skinrood, A.C.; Brumleve, T.D.; Schafer, C.T.; Yokomizo, C.T.; Leonard, C.M., Jr. Status Report on a High Temperature Solar Energy System; Sandia National Lab. (Albuquerque-NM): Albuquerque, NM, USA, 1974. [Google Scholar]
  53. Slocum, A.H.; Codd, D.S.; Buongiorno, J.; Forsberg, C.W.; McKrell, T.J.; Nave, J.-C.; Papanicolas, C.N.; Ghobeity, A.; Noone, C.J.; Passerini, S.; et al. Concentrated solar power on demand. Sol. Energy 2011, 85, 1519–1529. [Google Scholar] [CrossRef] [Green Version]
  54. Smith, J.M. Introduction to Chemical Engineering Thermodynamics; ACS Publications: Washington, DC, USA, 2004; ISBN 0073104450. [Google Scholar]
  55. Yu, X. Thermodynamics and Kinetics of Gasification Reactions of Metallurgical Cokes. Ph.D. Thesis, University of London, London, UK, 1988. [Google Scholar]
  56. De Bokx, P.K.; Kock, A.H.; Boellaard, E.; Klop, W.; Geus, J.W. The formation of filamentous carbon on iron and nickel catalysts: I. Thermodynamics. J. Catal. 1985, 96, 454–467. [Google Scholar] [CrossRef]
  57. Levenspiel, O. Chemical reaction engineering. Ind. Eng. Chem. Res. 1999, 38, 4140–4143. [Google Scholar] [CrossRef]
  58. Wetzel, T.; Pacio, J.; Marocco, L.; Weisenburger, A.; Heinzel, A.; Hering, W.; Schroer, C.; Muller, G.; Konys, J.; Stieglitz, R.; et al. Liquid metal technology for concentrated solar power systems: Contributions by the German research program. AIMS Energy 2014, 2, 89–98. [Google Scholar] [CrossRef] [Green Version]
  59. Sefkow, E.A.B. The Design of a Calorimeter to Measure Concentrated Solar Flux. Master’s Thesis, The University of Minnesota, Minnesota, MN, USA, 2013. [Google Scholar]
  60. Sparrow, E.M. Radiation Heat Transfer; Routledge and CRC Press: Boca Raton, FL, USA, 2018; ISBN 1-351-42010-0. [Google Scholar]
  61. Sarwar, J.; Georgakis, G.; Kouloulias, K.; Kakosimos, K.E. Experimental and numerical investigation of the aperture size effect on the efficient solar energy harvesting for solar thermochemical applications. Energy Convers. Manag. 2015, 92, 331–341. [Google Scholar] [CrossRef]
  62. Berenguel, M.; Rubio, F.R.; Valverde, A.; Lara, P.J.; Arahal, M.R.; Camacho, E.F.; López, M. An artificial vision-based control system for automatic heliostat positioning offset correction in a central receiver solar power plant. Sol. Energy 2004, 76, 563–575. [Google Scholar] [CrossRef]
  63. Relloso, S.; García, E.A. Tower Technology Cost Reduction Approach after Gemasolar Experience. Energy Procedia 2015, 69, 1660–1666. [Google Scholar] [CrossRef] [Green Version]
  64. Binotti, M.; De Giorgi, P.; Sánchez, D.; Manzolini, G. Comparison of Different Strategies for Heliostats Aiming Point in Cavity and External Tower Receivers. J. Sol. Energy Eng. 2016, 138, 021008. [Google Scholar] [CrossRef]
  65. Kang, D.; Rahimi, N.; Gordon, M.J.; Metiu, H.; McFarland, E.W. Catalytic methane pyrolysis in molten MnCl2-KCl. Appl. Catal. B Environ. 2019, 254, 659–666. [Google Scholar] [CrossRef]
  66. Kuipers, J.A.M.; Van Swaaij, W.P.M. Application of computational fluid dynamics to chemical reaction engineering. Rev. Chem. Eng. 1997, 13, 1–118. [Google Scholar] [CrossRef]
  67. Roeb, M.; Neises, M.; Monnerie, N.; Sattler, C.; Pitz-Paal, R. Technologies and trends in solar power and fuels. Energy Environ. Sci. 2011, 4, 2503–2511. [Google Scholar] [CrossRef]
  68. Vant-Hull, L. Issues with Beam-down Concepts. Energy Procedia 2014, 49, 257–264. [Google Scholar] [CrossRef] [Green Version]
  69. Christensen, C.H.; Johannessen, T.; Sørensen, R.Z.; Nørskov, J.K. Towards an ammonia-mediated hydrogen economy? Catal. Today 2006, 111, 140–144. [Google Scholar] [CrossRef]
  70. Linstrom, P.J.; Mallard, W.G. The NIST Chemistry WebBook: A Chemical Data Resource on the Internet. J. Chem. Eng. Data 2001, 46, 1059–1063. [Google Scholar] [CrossRef]
Figure 1. Multiscale characteristics of solar catalytic molten methane cracking in a “Solar Two” configuration [14].
Energies 13 06229 g001
Figure 2. Characteristics of solar catalytic molten methane cracking in a “Solar Two” [14] configuration or an analogous beam-down configuration.
Energies 13 06229 g002
Figure 3. The application of reversible molten methane cracking kinetics to data from Upham et al. 2017 [3].
Energies 13 06229 g003
Figure 4. An Arrhenius plot of reaction equilibrium constant Kc predictions from reversible methane cracking kinetic models compared to published equilibrium data from experiments [28,29,30,55,56].
Energies 13 06229 g004
Figure 5. Reactor design implications given reversible catalytic molten methane cracking.
Energies 13 06229 g005
Figure 6. Performance metrics of alternative solar facilities for H2 production.
Energies 13 06229 g006
Figure 7. Losses and their contributing factors in alternative solar facilities for H2 production.
Energies 13 06229 g007
Figure 8. Characteristics of alternative solar facilities for H2 production.
Energies 13 06229 g008
Figure 9. Approach to equilibrium in the power tower and beam-down reactor designs. The upper surface shows maximum theoretical conversion X at reactor effluent temperature and pressure. The lower surface shows actual conversion in the effluent of simulated reactors.
Energies 13 06229 g009
Table 1. Fitted kinetic parameters for reversible catalytic molten methane cracking with 95% confidence intervals compared to prior models of noncatalytic methane cracking [29,30]. Prior models from Keipi et al. 2017 and Catalan et al. 2020 were rearranged into identifiable forward and reverse Arrhenius expressions.
Energies 13 06229 i001
Table 2. The best simulated power tower and beam-down reactor designs across potential operating pressures from 2 to 200 atmospheres and 1150 to 1350 Kelvin.
Power TowerBeam-Down
Best ObjectiveBest EfficiencyBest ObjectiveBest Efficiency
objective, ηX%23322152102
efficiency, η%1.41.77.229
conversion X%23.612.921.111.3
isothermal reaction, TKelvin1325126513151255
inlet pressure, Pinletatm21.7165.1324.6769.10
facility power, QfieldMW144.3190.024.734.1
convective losses, QconvectiveMW39.672.510.515.22
radiative losses, QradiativeMW38.142.41.41.00
H2 producedmol/sec44.8873.7339.2364.31
reactor height, Hmeters8.510.48.510.4
tube radius, ℜmeters0.480.480.410.45
surface temperature, TsKelvin1365133013481318
wall temperature, TwKelvin1350130013371289
wall thickness, wcm6.108.403.857.47
heliostat area, Amirrorskm20.180.240.030.04
Publisher’s Note: MDPI stays neutral with regard to jurisdictional claims in published maps and institutional affiliations.

