Article

Optimal Placement and Sizing of DGs in Distribution Networks Using MLPSO Algorithm

by
Eshan Karunarathne
1,*,
Jagadeesh Pasupuleti
1,
Janaka Ekanayake
2 and
Dilini Almeida
1
1
Institute of Sustainable Energy, Universiti Tenaga Nasional (UNITEN), Kajang, Selangor 43000, Malaysia
2
Department of Electrical and Electronic Engineering, University of Peradeniya, Peradeniya 20400, Sri Lanka
*
Author to whom correspondence should be addressed.
Energies 2020, 13(23), 6185; https://doi.org/10.3390/en13236185
Submission received: 19 October 2020 / Revised: 17 November 2020 / Accepted: 19 November 2020 / Published: 25 November 2020
(This article belongs to the Section F: Electrical Engineering)

Abstract

:
In today’s world, distributed generation (DG) is an outstanding solution to tackle the challenges in power grids such as the power loss of the system that is intensified by the exponential increase in demand for electricity. Numerous optimization algorithms have been used by several researchers to establish the optimal placement and sizing of DGs to alleviate this power loss of the system. However, in terms of the reduction of active power loss, the performance of these algorithms is weaker. Furthermore, the premature convergence, the precision of the output, and the complexity are a few major drawbacks of these optimization techniques. Thus, this paper proposes the multileader particle swarm optimization (MLPSO) for the determination of the optimal locations and sizes of DGs with the objective of active power loss minimization while surmounting the drawbacks in previous algorithms. A comprehensive performance analysis is carried out utilizing the suggested approach on the standard IEEE 33 bus system and a real radial bus system in the Malaysian context. The findings reveal a 67.40% and an 80.32% reduction of losses in the two systems by integrating three DGs with a unity power factor, respectively. The comparison of the results with other optimization techniques demonstrated the effectiveness of the proposed MLPSO algorithm in optimal placement and sizing of DGs.

1. Introduction

The exponential growth of energy demand has been witnessed during the last few decades owing to the complicated life cycle of human beings, and consequently the power losses and the voltage drops of the distribution systems have increased. The majority of these systems are either radial or weakly meshed systems. As a result, the line loss and the voltage drop associated with the feeder ends of these distribution systems are more significant owing to the inherited high R/X ratio of distribution systems [1]. Besides, these networks are centralized with unidirectional power flow and energized by fossil fuels. Therefore, they significantly contribute to environmental pollution and global warming by the emission of harmful gases [2]. Thus, distributed generation (DG) technology has been introduced to the distribution systems as an immediate solution in overwhelming these technical and environmental issues related to the distribution systems while accommodating the extensive load growth. In [3], DGs are defined as power generation units with a maximum capacity of 50–100 MW which are typically connected to the distribution network and that are neither centrally planned or dispatched. There are different types of technical environmental and economic benefits of the DGs that can maintain the quality of the system [4,5,6]. However, the non-optimized sitting and sizing of DGs can cause numerous challenges to the distribution systems such as higher line losses, voltage limit infringements, increment in short circuit levels, and eventually the degradation of system performance [7,8,9]. To reap these benefits of DGs to the greatest possible extent, these power generation units should be systematically sized and placed in a distribution system [10,11,12].
In the existing literature, various optimization approaches have been used to determine optimal placement and sizing of DGs and mainly they could be categorized into classic and artificial intelligent algorithms [13]. Classic algorithms employ fundamental mathematics to seek the best solution while artificial intelligence algorithms are concentrated on sophisticated computations based on evolutionary and nature-inspired techniques. There are different kinds of classic algorithms and the analytical approach is one of them. In [14], analytical expressions have been developed to determine the optimal sizes and the locations of DGs considering the minimization of power loss, and four different power loss formulas have been employed to calculate the power loss of the system. Concerning the minimization of power loss as the objective, an analytical technique centered on a loss sensitivity factor is utilized in finding the optimal sitting and sizing in [15] and the produced results have been compared with another two analytical methods. A simplified analytical technique has been proposed in [16] to optimally integrate DGs to alleviate the power loss in distribution networks and the power loss reduction results have been analyzed with another four methods for one, two, and three DGs. In [17], the exact loss equation-based analytical technique has been used to find the optimal size and the location of a single DG in three different distribution networks. The mixed-integer linear programming (MILP) approach has been used in [18] to determine the optimal placement and sizing of DGs in radial distribution systems. The authors in [19] have used the mixed-integer nonlinear programming (MINLP) technique to identify optimal placement and sizing of DGs with the intention of minimization of network power loss. Furthermore, the authors in [19] have simplified the problem by dividing the method into two sections, namely the siting model and capacity model to reduce the computational time. The authors in [20] have analyzed the impact of DGs on the power loss and the voltage profile of the system by integrating DGs at selected candidate locations. The authors of [21] have used a decision-making algorithm that has been developed on a radial distribution system to determine the optimal size and placement of two different types of DGs in distribution networks, based on the improvement of voltage profile and the reduction of the network’s total power losses. The results have been compared with several previous approaches and it has shown the efficiency of the decision-making algorithm.
Many research works that use artificial algorithms could also be found in the field of optimal placement and sizing of DGs. Genetic algorithms (GA) come under artificial intelligence algorithms and many researchers have employed this on optimal placement and sizing of distributed generation. In [22], GA has been used in determining optimal placement and size of DGs with the aim of energy loss minimization while satisfying voltage and line loading constraints. This methodology has been tested on three different distribution systems and the results were used to show the effectiveness of the proposed method. The authors in [23] have applied GA to find the optimal locations and the sizes of DGs for the minimization of technical and economic factors of the distribution system. The GA has been applied in [24] for the scaling of DGs to enhance the voltage stability of the distribution system and the optimal placements of DGs have been identified by a stability index. Furthermore, the authors in [25] have suggested GA for optimizing the DG planning to maximize the savings in the cost of energy loss, and system upgrade. Tabu-Search (TS) has been applied in [26] to optimally place and size the DGs concerning the power loss minimization of the system. The authors in [27] have used the intelligent water drop (IWD) approach for optimal sizing of DGs to minimize the line loss of the system and the placement of the DGs of this study has been determined using a loss sensitivity index. The bat algorithm (BA) has been employed in [28] to optimally place and size solar-based DGs to reduce the network power loss. Moreover, in [29], a bat-inspired algorithm has been used to optimally locate and scale DGs in radial distribution networks. The shuffled frog leap algorithm (SFLA) has been employed in [30] to solve the DG placement problem for minimization of power loss and the improvement of voltage stability index. This approach was tested under different scenarios. The bacterial foraging algorithm has been proposed in both [31,32] for optimal planning of DGs to improve the bus voltage and to reduce the total loss in the system. The bio-geography-based optimization algorithm (BBO) has been used in [33] for optimal sitting and sizing of DG units with an effective power factor to minimize the network loss. Results have shown the improvement in loss reduction of the DGs with lagging power factors. To reduce the line losses and the voltage drop of the system, the authors in [34] have used the cuckoo search algorithm (CSA) to optimally allocate the DGs. In [35], the authors have focused on active power loss reduction and voltage profile improvement by optimal placement and sizing of DGs using particle swarm optimization (PSO), and the method was tested with a single DG on two systems. Furthermore, a hybrid PSO and a loss sensitivity analysis have been used in [36] to determine the candidate buses and the sizes of DGs to alleviate the system loss in the network. The optimization was focused on both technical and economic benefits and was subjected to several constraints. In [37], a comprehensive learning PSO (CLPSO) has been employed to find the optimal placement and sizing with the intention of power loss minimization and the results have been compared with the PSO algorithm.
In the perspective of optimization algorithms, the convergence is not taken into consideration as a consequence of the noniterative nature of the analytical optimization techniques that comes under classic optimization approaches. Nevertheless, in the context of complicated problems, these computational methods may not be appropriate due to the lack of accuracy. Moreover, the MILP would offer similar less reliable solutions owing to the linearization that is included in the algorithm. However, MINLP has addressed the linearization error of MILP with better precision in the solutions. GAs are computationally incapable of dealing with complicated optimization problems and easily reach the state of premature convergence by curtailing its exploration. TS is appropriate for substantially large optimization problems. Nevertheless, the multiple iterative parameters in the optimization process are constantly engaged in an algorithm and that enhances the computational cost and degrades the computational performance. Even though the BA is comparatively simple and flexible, the accuracy of the algorithm is limited and converges quickly at the early stages. IWD may not give the optimal solution since it depends on the probability of selecting the next node in the algorithm which is calculated by a fitness proportionate method. In comparison, SFLA has the drawbacks of slower convergence and the ability to trap into the local optimal solution. Both the BBO and CSA algorithms have the disadvantage of effortless falling into the local optimal solution and in addition to that, CSA has a slow rate of convergence. Moreover, these artificial algorithms have a high computational burden due to the iterative aspect of the optimization approaches. A lower number of iterations are used in the PSO algorithms than in GA and TS algorithms. Thus, the numerical pressure of the PSO algorithms is comparatively less and easy to implement relative to the other artificial intelligence optimization approaches. Additionally, preconditions such as continuity or differentiability of objective functions do not associate with the PSO algorithms and a fast convergence could be accomplished by fewer control parameters. Nevertheless, all the swarm particles in the PSO extremely attract and travel towards one swarm leader and the algorithm could be converged the system without ample exploration over the search space. Besides, if the particles are stuck into a region including a local optimum, they would simply cease their exploration as they are not able to escape from that region. Many researchers have contributed to overcome these drawbacks of the PSO by modifying topology structures [38,39], hybridizing PSO with other approaches [40,41], and utilizing cooperative approaches [42].
Considering the above factors, a multileader particle swarm optimization (MLPSO), which allows to dynamically choose the leaders of each particle, is employed to address the simultaneous optimal placement and sizing of DGs in a distribution network to minimize the active power loss. The MLPSO algorithm is premised on the simulation of the social behavior of the birds within a flock, and it is a variant of PSO introduced by Kennedy and Eberhart in 1995 [43]. This algorithm has the capability of surmounting the weak exploration capability of PSO that leads to premature convergence. Furthermore, the complexity, computational cost, and precision errors attributed to other optimization techniques that are used for the optimal placement and sizing problems have overwhelmed. The voltage stability index (VSI) based methodology has been employed to determine the optimal placement of DGs.
The rest of the paper is organized as follows. Section 2 describes the problem formulation including objective function and the subjected constraints. Section 3 presents the optimization framework. Section 4 presents the simulation results and the discussion is given in Section 5. Finally, Section 6 presents our conclusions.

2. Problem Formulation

For an efficient power system operation, an important necessity in the system is to reduce the real power loss to the greatest extent possible. Therefore, the minimization of the system’s active power loss ( P L o s s ) was considered as the objective function of this optimization architecture and it was calculated utilizing the branch current and the branch resistance. The objective function was defined as follows.
Minimize   f = m = 1 M P l o s s , m = m = 1 M I m 2 × R m ;   for   m = [ 1 , 2 , 3 , , M ]
where P l o s s , m , I m , R m , M are the active power loss of the m th branch, the m th branch current, the m th branch resistance, and the number of branches in the network, respectively.
Even though there are different methods of calculating power loss in the network, the branch current formula given in Equation (1) was selected in this study to alleviate the complexity and the computational burden of the optimization process. The objective function given in Equation (1) should be minimized and subjected to the following inequality and equality constraints.
  • Voltage constraint
The absolute value of the voltage magnitude at each node must be stationed within their admissible ranges to maintain the system’s power quality. It is defined as below.
| V _ | V n | V ¯ | ;   n [ 1 , 2 , , N ]
where V _ , V ¯ , V n , and N are the lower voltage limit, the upper voltage limit, the voltage of n th node, and the total nodes in the network respectively.
2.
Thermal constraint
All the branch currents of the network must be well within the maximum thermal capacity of the conductor and can be defined as follows.
I m I r a t e d ;   m [ 1 , 2 , , M ]
where I m is the m th branch current and I r a t e d is the maximum allowable branch current.
3.
DG capacity constraint
The total generation of the active power of every integrated DG unit must be less than the total active power demand of the network, as the infringement of the constraint results in a reverse power flow in the system. This constraint is expressed as follows.
0 i = 1 N P D G , i i = 1 N P L , i ;   for i = [ 1 , 2 , 3 , , N ]
where P D G , i and P L , i are the active power injection and load connected to the i th node respectively.
4.
Nodal power balance constraint
The active and reactive nodal power balances of the network are defined as follows.
j ϕ ( i ) ( P j i I b r , j i 2 R j i ) + P D G , i P L , i = k ψ ( i ) P i k ;   i , j , k [ 1 , 2 , 3 , , N ]
j ϕ ( i ) ( Q j i I b r , j i 2 X j i ) Q L , i = k ψ ( i ) Q i k ;   i , j , k [ 1 , 2 , 3 , , N ]
where j ϕ ( i ) denotes the set of all parents of node i and k ψ ( i ) denotes the set of all children of node i . Subscripts j i and i k represent the current flowing directions of j to i and i to k , respectively. P j i is the active power flowing from j th node to i th node. R j i and I b r , j i are resistance and the branch current of the line which connects i th and j th nodes. P D G , i and P L , i are active power injection at i th node and the active load connected to i th node, respectively. Similarly, Q j i , X j i , and Q L , i are reactive power flow of j th node to i th node, the reactance of i j branch, and the reactive load connected to i th node, respectively.
For the purpose of minimizing the objective function whilst complying with the constraints Equations (2)–(6), the penalty functions were incorporated. The fundamental principle of these penalty functions is that an optimal DG size (i.e., the optimal solution) seeks the constraints to be engaged, thus optimal solution exists within the permissible regions for voltage magnitudes, thermal limits, DG sizes, and nodal power balance. To enforce this, a cumulative penalty was imposed on the solutions in situations where constraints are not fulfilled. Therefore, the objective function defined by Equation (1) was revised and modified as Equation (7),
f p = m = 1 M P L o s s , m + P L , b ( n = 1 N V p , n + m = 1 M T p , m + D G p + P B p )
where the penalty function for the p.u. nodal voltage is given by V p , n ,
V p , n = { | V n V _ | ;   V n < V _ 0 ;   V _ < V n < V ¯ ( V n V ¯ ) ;   V n > V ¯   for   n = [ 1 , 2 , 3 , , N ]
the penalty function for the thermal limit is given by T p , m ,
T p , m = { ( I m I r a t e d I r a t e d ) ;   I m > I r a t e d 0 ;   I m < I r a t e d   for   m = [ 1 , 2 , 3 , , M ]
the penalty function for the DG capacity is given by D G p ,
D G p = { 1 ; i = 1 N P D G , i > i = 1 N P L , i 0 ; i = 1 N P D G , i < i = 1 N P L , i ;   for   i = [ 1 , 2 , 3 , , N ]
the penalty function for the nodal power balance of the network is given by P B p ,
P B p = { 1 ;   LHS ( 6 ) RHS ( 6 ) LHS ( 7 ) RHS ( 7 ) 0 ;   LHS ( 6 ) = RHS ( 6 ) LHS ( 7 ) = RHS ( 7 )
The corresponding penalty functions for the constraints defined in Equations (2)–(6) are presented in Equations (8)–(11). P L , b is the penalty constant imposed on the penalty functions. The graphical representation of the penalty functions for voltage magnitude, thermal limit, and the DG size constraints are shown in Figure 1.

3. Optimization Framework

3.1. Optimal Placement of Generators

The problems concerning the optimal placement and sizing of distributed generation could be divided into two groups [44]. In the first group, the optimal locations are randomly identified from the nodes of the network, while the second group uses an index to find the most appropriate node for the DG integration. The voltage stability index (VSI) is one of the popular indexes that is used to determine the weakest bus in the system. However, the requirement in several locations for simultaneous multiple DG integration could not be addressed, as the second method only gives a single node of integration. Therefore, in this paper, a VSI based methodology is used to recognize the most suitable nominee locations in the network which enables simultaneous DG integrations. In addition, this method improves the voltage stability of the network rather than a random selection of nodes to integrate DGs.
The VSI term was developed using the parameters given in Figure 2 and given in Equation (12). The derivation of this term is given in Appendix A.
V S I = 2 | V l | 2 | V k | 2 | V l | 4 2 | V l | 2 { P l R k l + Q l X k l } | z k l | 2 { P l 2 + Q l 2 }
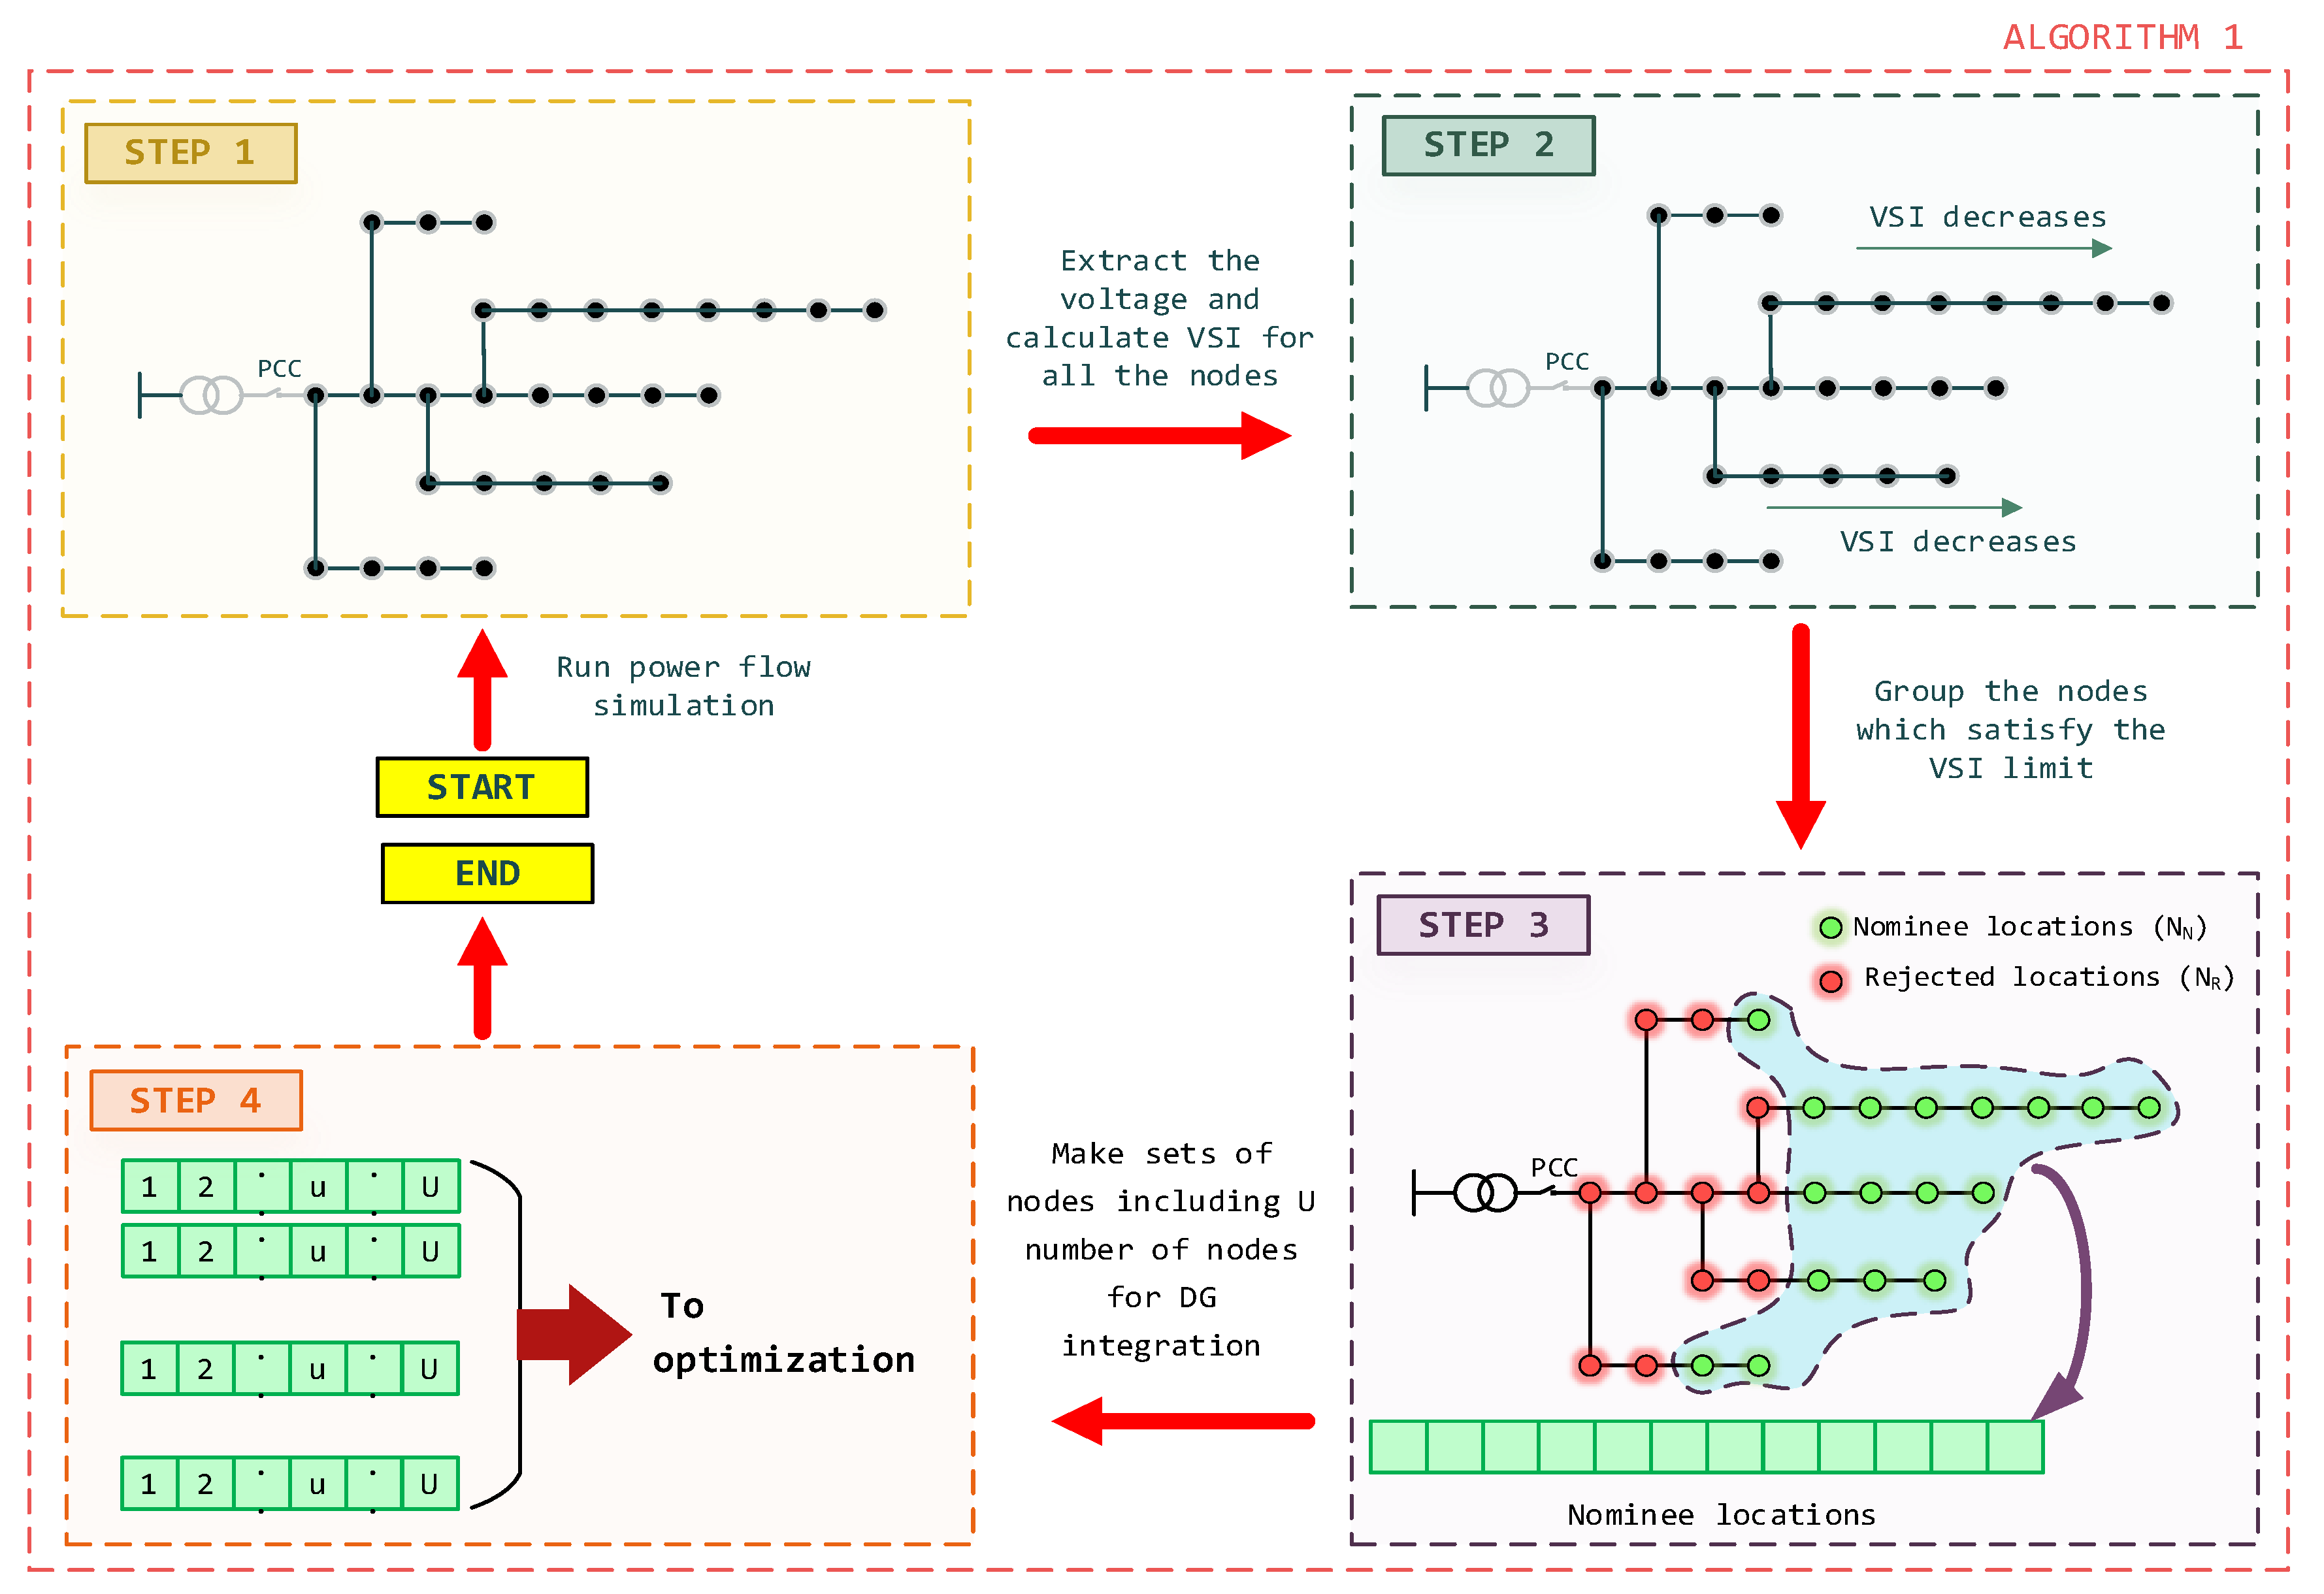
VSI computes the proximity of the nodes to a voltage collapse in the test system. Low VSI values are more prone to collapse. Thus, in this method, the nodes which have a VSI less than a predefined value ( V S I l i m ) are considered as the nominee locations. The algorithm of identification of nominee locations for DG integration is given in Algorithm 1 and the graphical representation of the steps involved in the algorithm is given in Figure 3.
Algorithm 1. Identification of nominee locations for DG integration.
Input:Network data of the considered network system.
Step 1:Read the data of the network system and perform the load flow analysis.
Step 2:Extract the voltages of all the nodes and calculate VSI using Equation (12).
Step 3:Group the nodes which satisfy the VSI limit ( V S I l i m ).
Step 4:Make sets of nodes including U number of nodes (i.e., 1 × U vectors) for DG integration from the grouped nodes ( U is the number of DGs connecting to the system).
Output:DG integration location sets.
Consider a network having N ( \ N s ; where N s is the node at the substation) number of nodes. The nominee nodes ( N N —green color nodes) which are selected after applying VSI (in step 3), are used to generate the sets of DG integrating locations (in step 4). Each generated set of location claims to have dissimilar nominee nodes for the sitting of DGs. In the final step, the generated location sets are passed to the optimization process. This procedure of multiple selections of nominee nodes gives the ability of the placement of multiple DGs rather than selecting one location compared to other methods and also will help to reduce the search space of sitting locations of a single DG by ( 1 N R N ) % value, where N R is the rejected node-set (red color nodes in Figure 3 where V S I > V S I l i m ).

3.2. Optimal Sizing of Generators

As discussed before, in this study, the MLPSO algorithm is introduced to optimally size the DGs.

3.2.1. Concept and Flight Equations of MLPSO

A group of birds (i.e., particles in a swarm) will arbitrarily search for food (i.e., optimal solution) in a confined area during the searching phase. There is only one piece of food in the area being searched. All the birds do not know the location of food. However, a few birds are closer to the food (i.e., leaders) and others follow these leader birds to find the food quickly and effectively. This stochastic algorithm works in parallel with particles to examine appropriate regions in a multidimensional environment, where the optimal solution is sought. The particles are with zero mass and volume. The dimension (superscript d ) of the particle represents the number of decision variables. The population is referred to as the swarm and each particle in the swarm travels towards the optimal solution with an adaptive velocity adjustment throughout the process. The velocity ( V i d ) and the position ( X i d ) are updated in the flight equations given in Equations (13) and (14).
V i ( u p d a t e d ) d ω k V i d + c 1 r a n d i d ( X i , p b e s t d ¯ X i d ) + c 2 r a n d i d ( X L , j , g b e s t d ¯ X i d )
X i ( u p d a t e d ) d X i d + V i ( u p d a t e d ) d
ω = ( ω m a x ω m i n ) I T E m a x × i t e
where V i d , X i d , X i , p b e s t d ¯ , X L , j , g b e s t d ¯ , are the i th particle’s velocity in d th dimension, the i th particle’s position in d th dimension, mean value of i th particle’s personal best in d th dimension, mean value of assigned j th leader’s global best in d th dimension, respectively. c 1 and c 2 are the weightings of stochastic acceleration coefficients and r a n d i d is a random number generated in the range of [0,1]. ω is the inertia weight and it balances the global and local searching capability. It varies according to Equation (15) in between minimum ( ω m i n ) and maximum ( ω m a x ) values. All the particles attempt to improve the MLPSO’s performance by updating their velocities and positions according to the mean personal best and the assigned leaders mean personal best, plus varying the other parameters in different acceptable regions.

3.2.2. Leader Assignment Process

During the optimization, the number of leader particles ( k ) is kept unchanged while a reward-based method is employed to assign leaders to the particles. Each leader is rewarded by all the particles depending on the discrepancy between the leader and the particle where the reward is directly proportional to the discrepancy. The particles choose their respective leader according to the highest reward and the reward scheme is computed as in Equations (16) and (17).
D i s s i m i = { d | X L , j , d g b e s t X i , d p b e s t ¯ | m a x k { d | X L , d g b e s t X i , d p b e s t ¯ | } ;   m a x k { d | X L , d g b e s t X i , d p b e s t ¯ | } 0 0 ;   m a x k { d | X L , d g b e s t X i , d p b e s t ¯ | } = 0
R e w k , i = D i s s i m i k D i s s i m i + g a u s s i a n ( μ , σ 2 ) × e ( τ × I t e I t e m a x )
where X L , j , d g b e s t , X i , d p b e s t ¯ ,   X L , d g b e s t X i , d p b e s t ¯ ,   D i s s i m i ,   i t e ,   I T E m a x , τ ,   R e w k , i are the j th leader’s global best in d th dimension, i th particle’s mean personal best in d th dimension, the difference between any leader’s global best in d th dimension and the i th particle’s mean personal best in d th dimension, i th particle’s discrepancy value, index of iteration number, the maximum number of iterations, noise attenuation, and the k th leader’s reward value given by the i th particle, respectively. Gaussian noise is imposed on the computed reward value to increase the randomness.

3.2.3. Self-Learning Process

In order to enhance the quality of the selected set of leader particles during the optimization process, the set of leader particles are subject to three mutation processes namely; Gaussian mutation, opposition-based mutation, and differential evolution (DE) based mutation. After each mutation process, the mutated values are evaluated and if the objective function for the mutated value is better than the current objective function value, the respective leader particles’ positions are replaced by the obtained mutated values. The mutation processes are expressed in Equations (18)–(20).
  • Gaussian mutation;
    X L , b e s t ( G ) ( d ) = ( X L , m a x ( d ) + X L , m i n ( d ) X L , b e s t ( d ) ) × ( 1 + G a u s s i a n ( μ , σ G D ) )
  • Opposition based mutation;
    X L , i ( O B ) ( d ) = X L , m a x ( d ) + X L , m i n ( d ) X L , i ( d )
  • DE based mutation;
    X L , i ( D E ) ( d ) = { X L , i ( d ) + F ( X s ( d ) X r ( d ) ) ; O b j s > O b j r X L , i ( d ) F ( X s ( d ) X r ( d ) ) ; O b j s < O b j r
    where X L , b e s t ( G ) ( d ) , X L , i ( O B ) ( d ) , X L , i ( D E ) ( d ) , X L , m a x ( d ) , X L , m i n ( d ) , X L , b e s t ( d ) , X L , i ( d ) , F are the best leader’s position value in d th dimension after the Gaussian mutation, the leader’s position value in d th dimension after the opposition based mutation, the leader’s position value in d th dimension after the DE based mutation, the maximum position value of all the leaders in d th dimension, the minimum position value of all the leaders in d th dimension, best leader’s position in d th dimension, i th leader’s position in d th dimension, and scale factor, respectively. s and r are two randomly generated numbers. ( s r < k ). The algorithm of the self-learning process is given in Algorithm 2.
Algorithm 2. Leaders’ self-learning procedure
Input:Number of leaders, initial standard deviation of Gaussian distribution, the updated swarm of particles.
Step 1:Calculate the standard deviation for the i t e th iteration.
Step 2:Sort all the particles in the swarm in ascending order considering the objective function value of the particles ( f p ).
Step 3:Choose the L number of leaders from the sorted list of particles.
Step 4:Select the best leader and apply Gaussian mutation for all the dimensions of the position vector and evaluate the objective function value ( f p , G ).
Step 5:If the objective function value obtained from the mutated values is better than the current objective function value, replace the values of all dimensions of the position vector with the mutated values.
Step 6:Else keep the current values of the position vector.
Step 7:Apply DE-based mutation upon whole leader set and evaluate the objective function values ( f p , D E ).
Step 8:If the objective function value obtained from the mutated values is better than the current objective function value, replace the values of all dimensions of the position vector with the mutated values.
Step 9:Else keep the current values of the position vector.
Step 10:Apply opposition-based mutation upon whole leader set and evaluate the objective function values ( f p , O B ).
Step 11:If the objective function value obtained from the mutated values is better than the current objective function value, replace the values of all dimensions of the position vector with the mutated values.
Step 12:Else keep the current values of the position vector.
Output:Improved leaders.

3.2.4. Mapping of the Terms of the Optimization Process

The mapping of the terms in the optimal sizing of the DGs problem and the MLPSO problem are shown in Table 1.

3.2.5. Implementation of MLPSO Algorithm

(a) The complete structure of the MLPSO algorithm
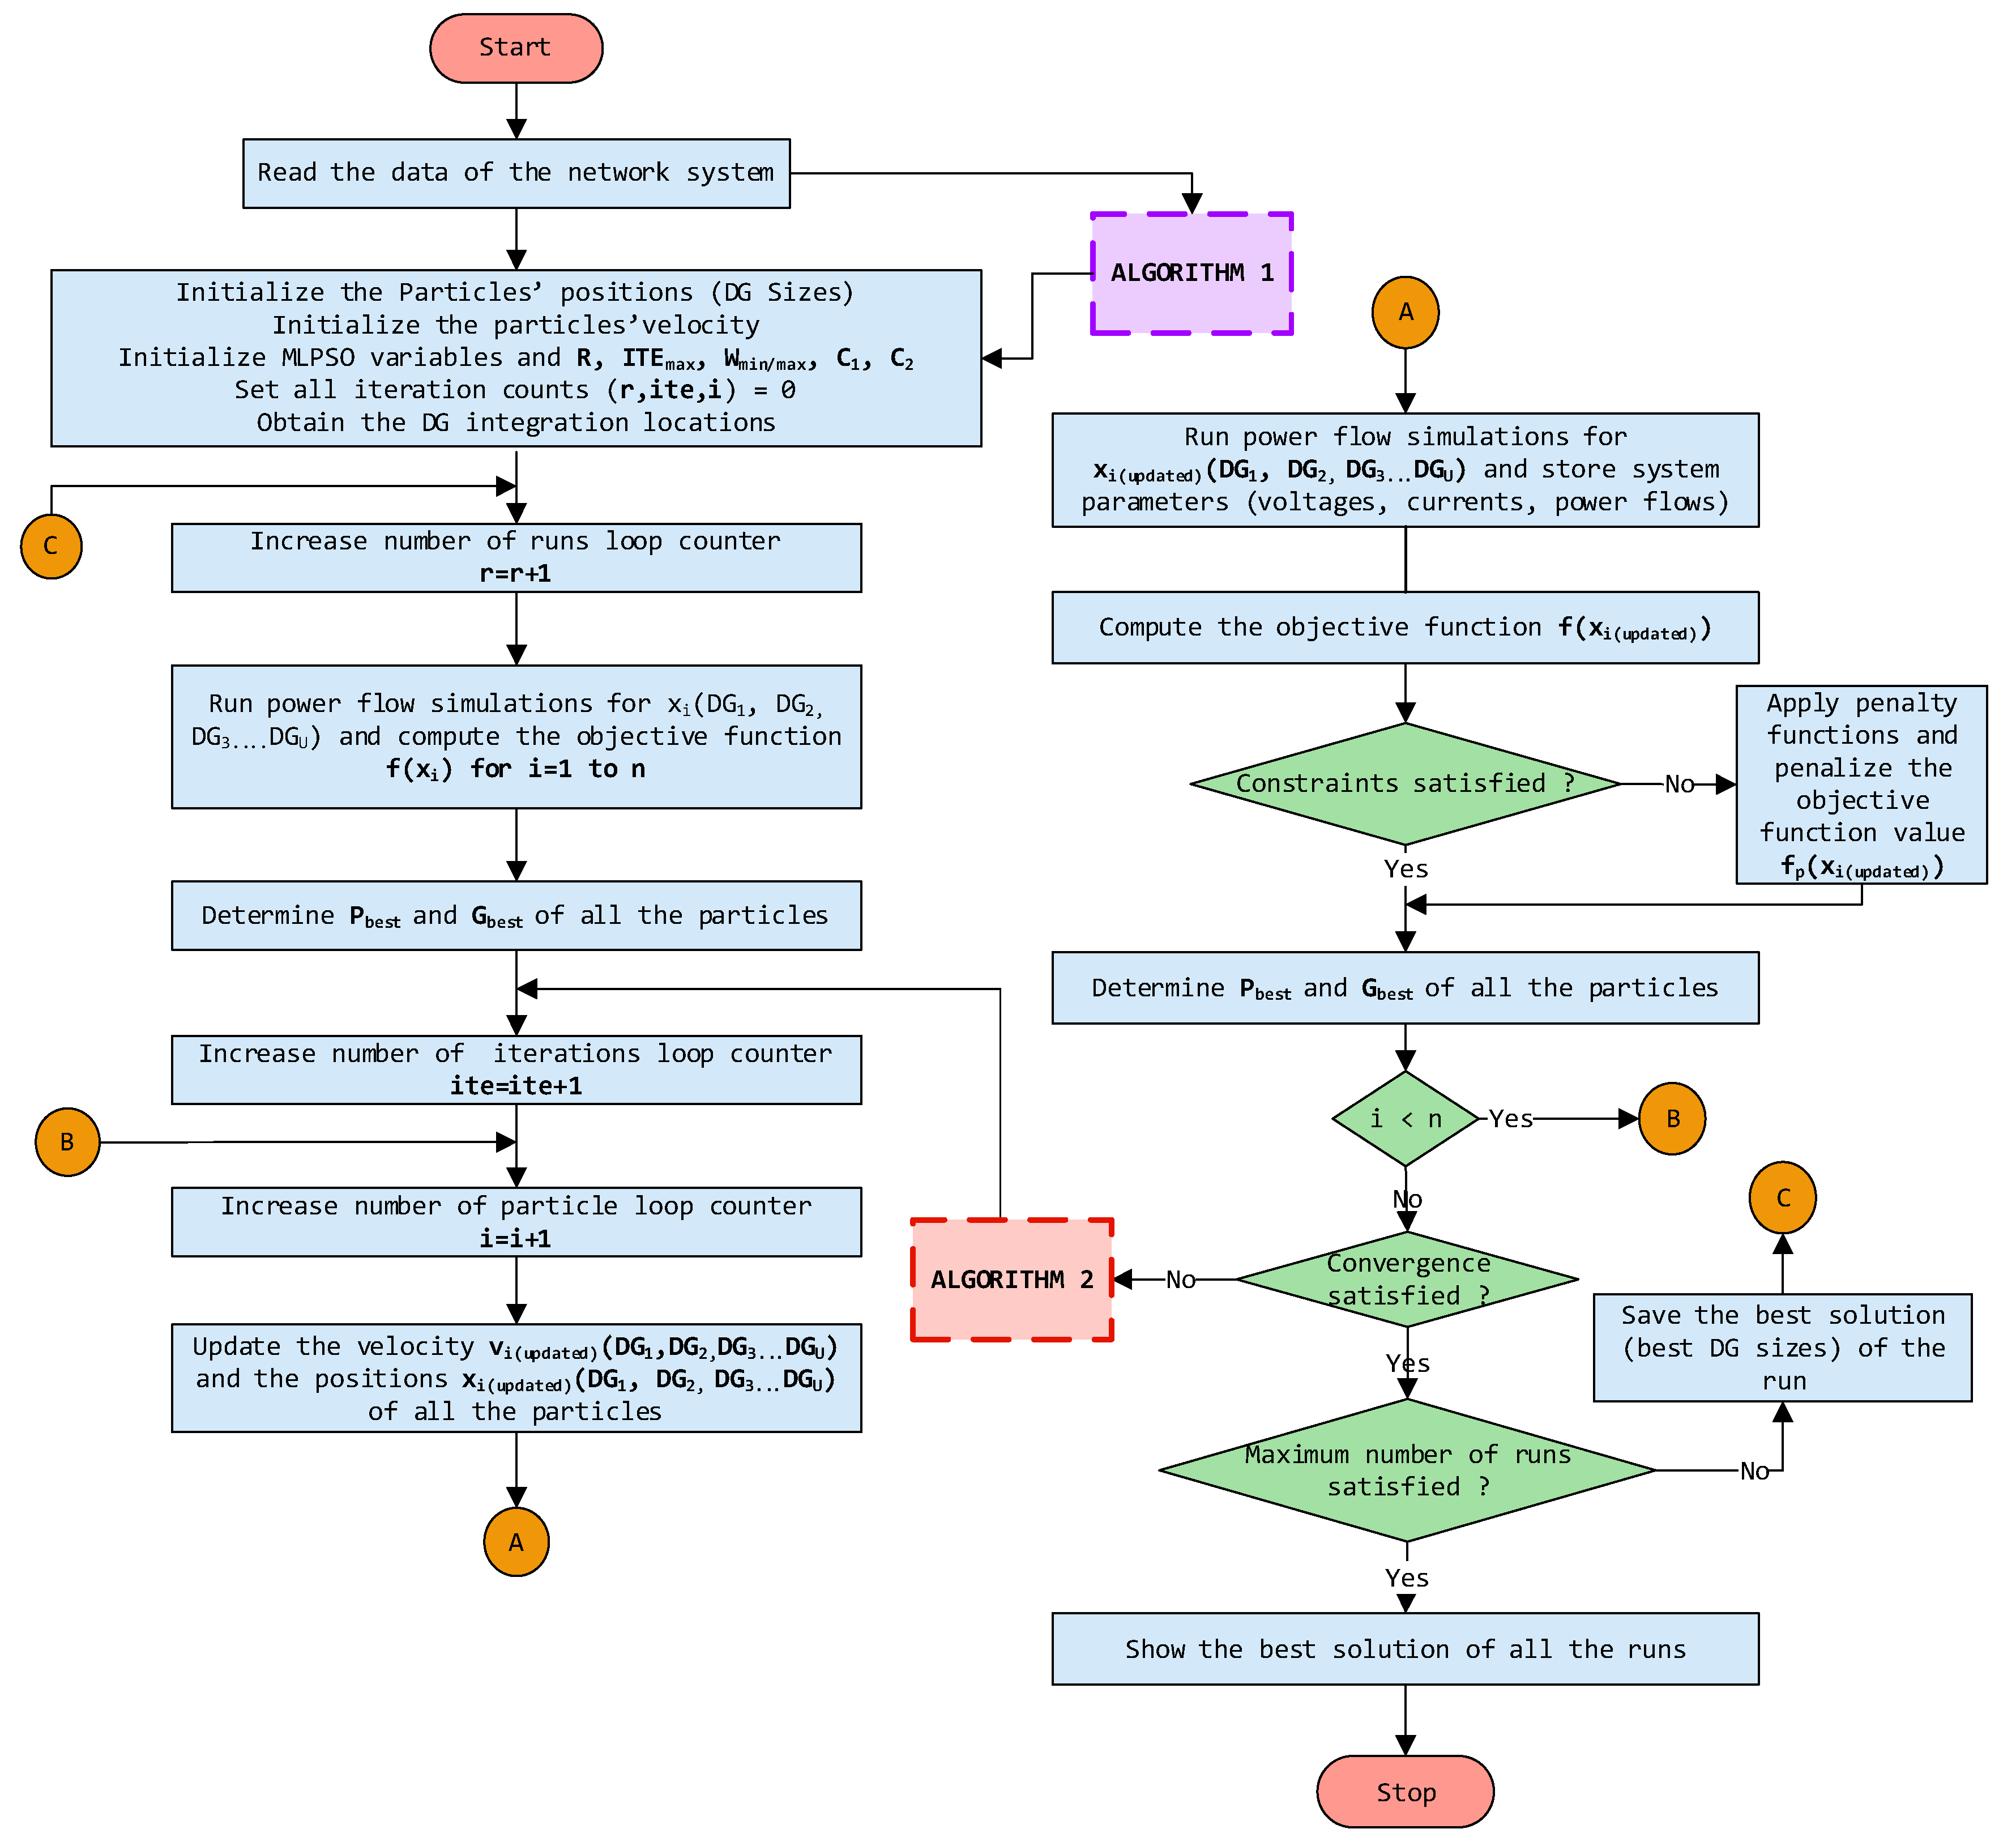
Figure 4 depicts the complete structure of the proposed MLPSO algorithm. In this flowchart, Algorithms 1 and 2 are shown as sub-blocks.
(b) The parameters of the MLPSO algorithm
In this study, the initial positions of particles were generated by considering the total DG size that is allowed to be connected to the system (i.e., i = 1 N   P D G , i < i = 1 N P L , i ,   for   i = [ 1 , 2 , 3 , , N ] ). The main reason behind this is to reduce the computational time of the algorithm rather than a random selection. Therefore, the MLPSO algorithm initializes the particle positions according to Equation (21).
d = 1 D x i d n = 1 N P L , n for     i s
where D is the dimensions of the i th particle.
The parameter values used in the MLPSO algorithm are given in Table 2.

4. Results

The backward forward sweep method was used for power flow simulations with the proposed MLPSO algorithm to determine the optimal locations and the scale of the DGs on the standard IEEE 33 bus system and a Malaysian MV bus system. The complete system was implemented on MATLAB R2018b version installed on a 64-bit, Core-i5 processor, with an 8GB RAM.

4.1. Standard IEEE 33 Bus System

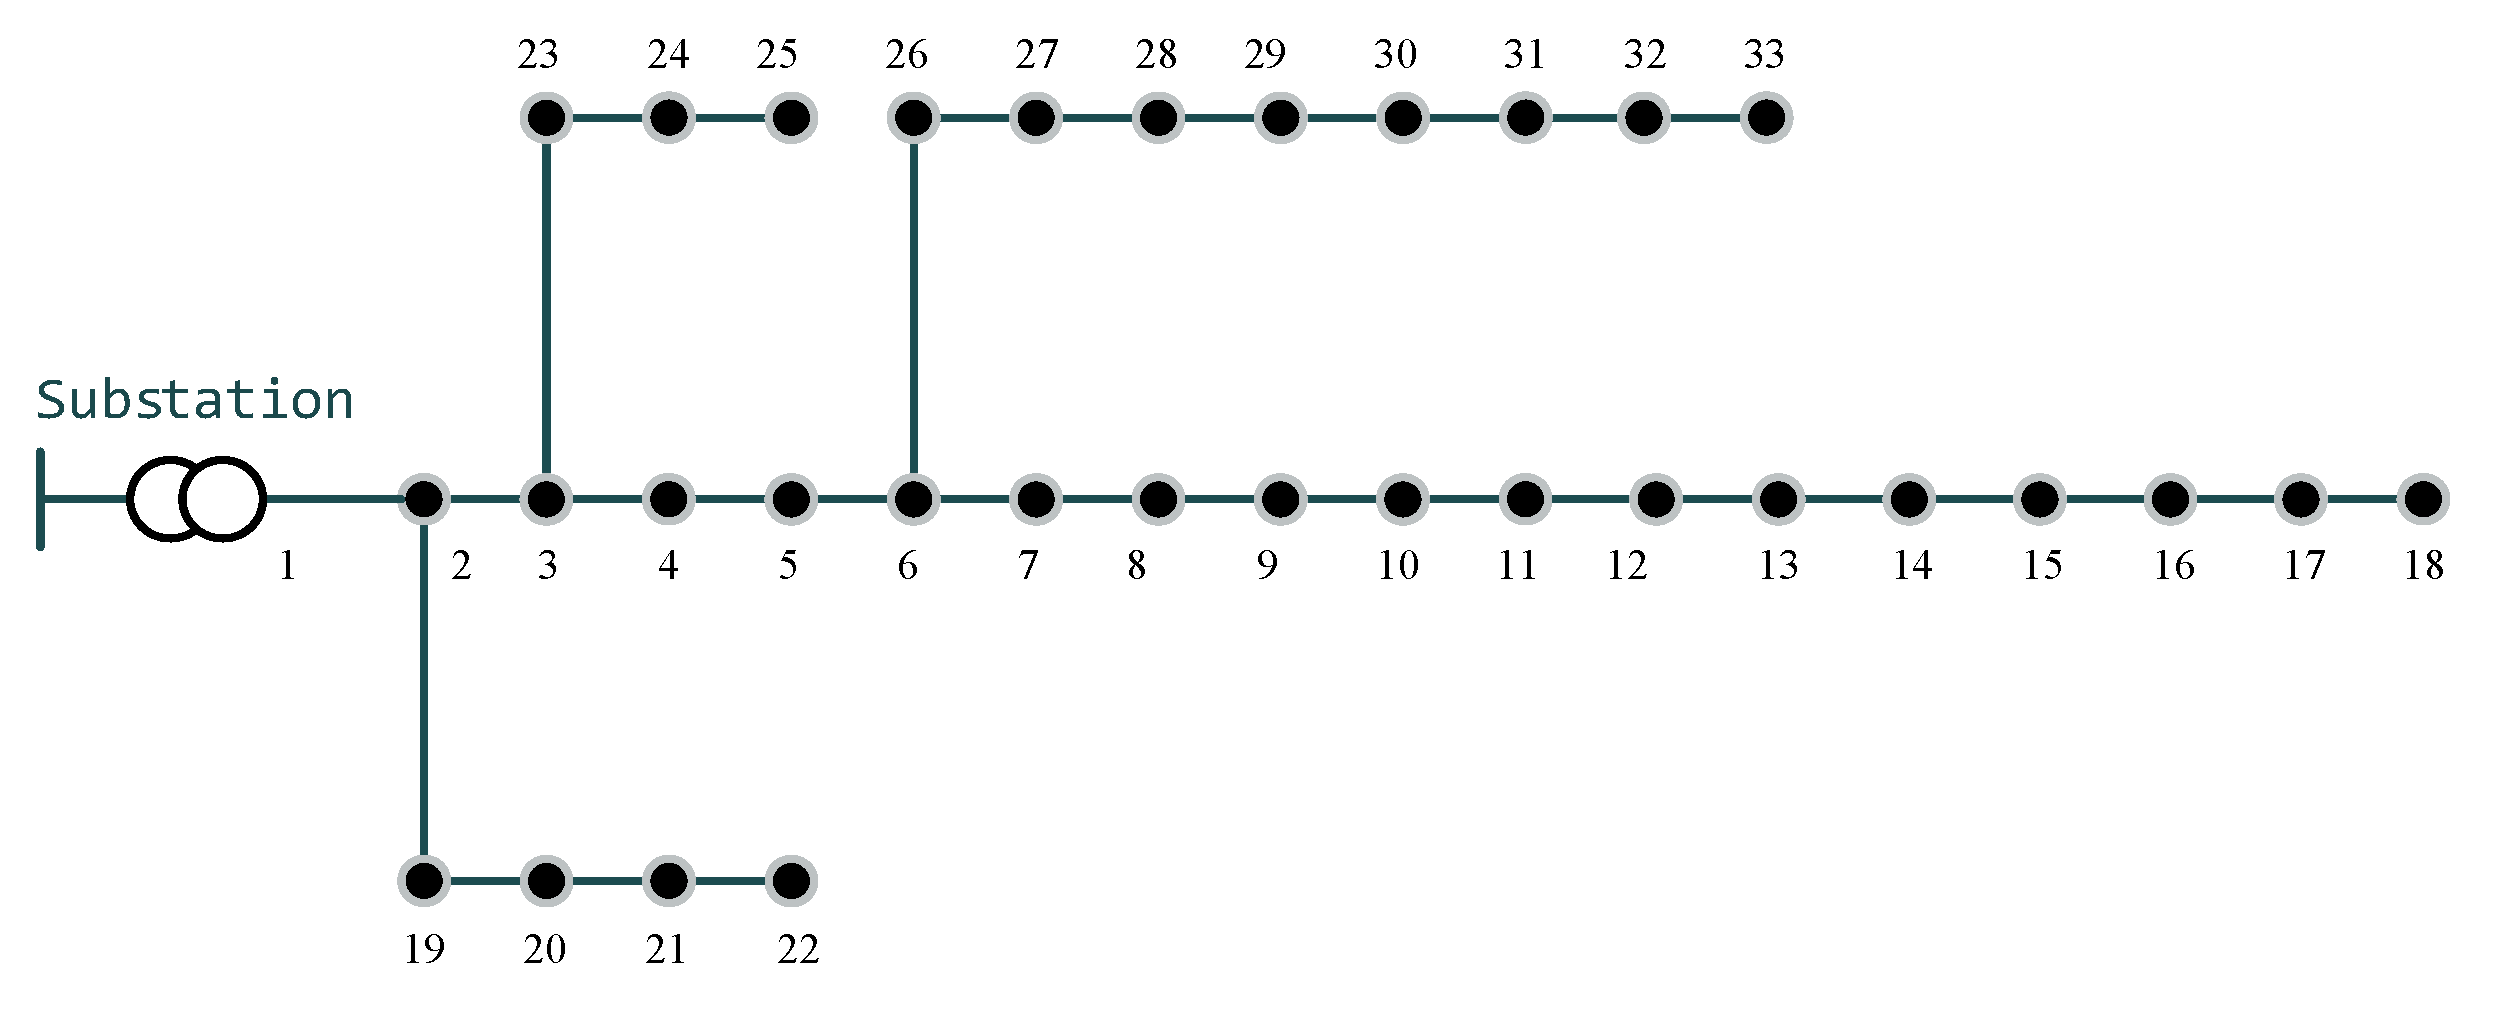
The Standard IEEE 33 bus system is a radial distribution network and it is rated at 12.66 kV. The total connected active power load and the reactive power load demands are 3.715 MW and 2.300 Mvar, respectively. It was assumed that this radial distribution network is three-phase and balanced. As per the statutory limits for the voltages in MV networks, the maximum and minimum voltage levels were defined as 1.05 and 0.95 p.u. and the thermal limit of all the branches was set to 300 A. Figure 5 shows the single line diagram of the standard IEEE 33 bus system.
In this study, three DGs were integrated into the standard IEEE 33 bus system using the proposed optimization method under three scenarios namely; (a) a single DG integration, (b) two DGs integration, and (c) three DGs integration. In addition, another two optimization approaches (PSO and CLPSO) were used and obtained the simulation results to compare the outcomes. For all the simulations, several assumptions were made. They are (1) the power factor of the integrated DGs is unity, (2) the swarm size and other parameters (i.e., runs, iterations, acceleration coefficients, voltage, and thermal limits) for all the algorithms are the same, and (3) the network conditions and the load flow method of the algorithms are the same. In Table 3, L and S represent the location and the size of the respective DG. The best-fitted solutions were obtained with a fixed population size of 40, by selecting the best out of 10 runs. The results of the standard IEEE 33 bus system for optimal siting and sizing in each scenario under three different optimization approaches (PSO, CLPSO, and MLPSO) were described in Table 3.
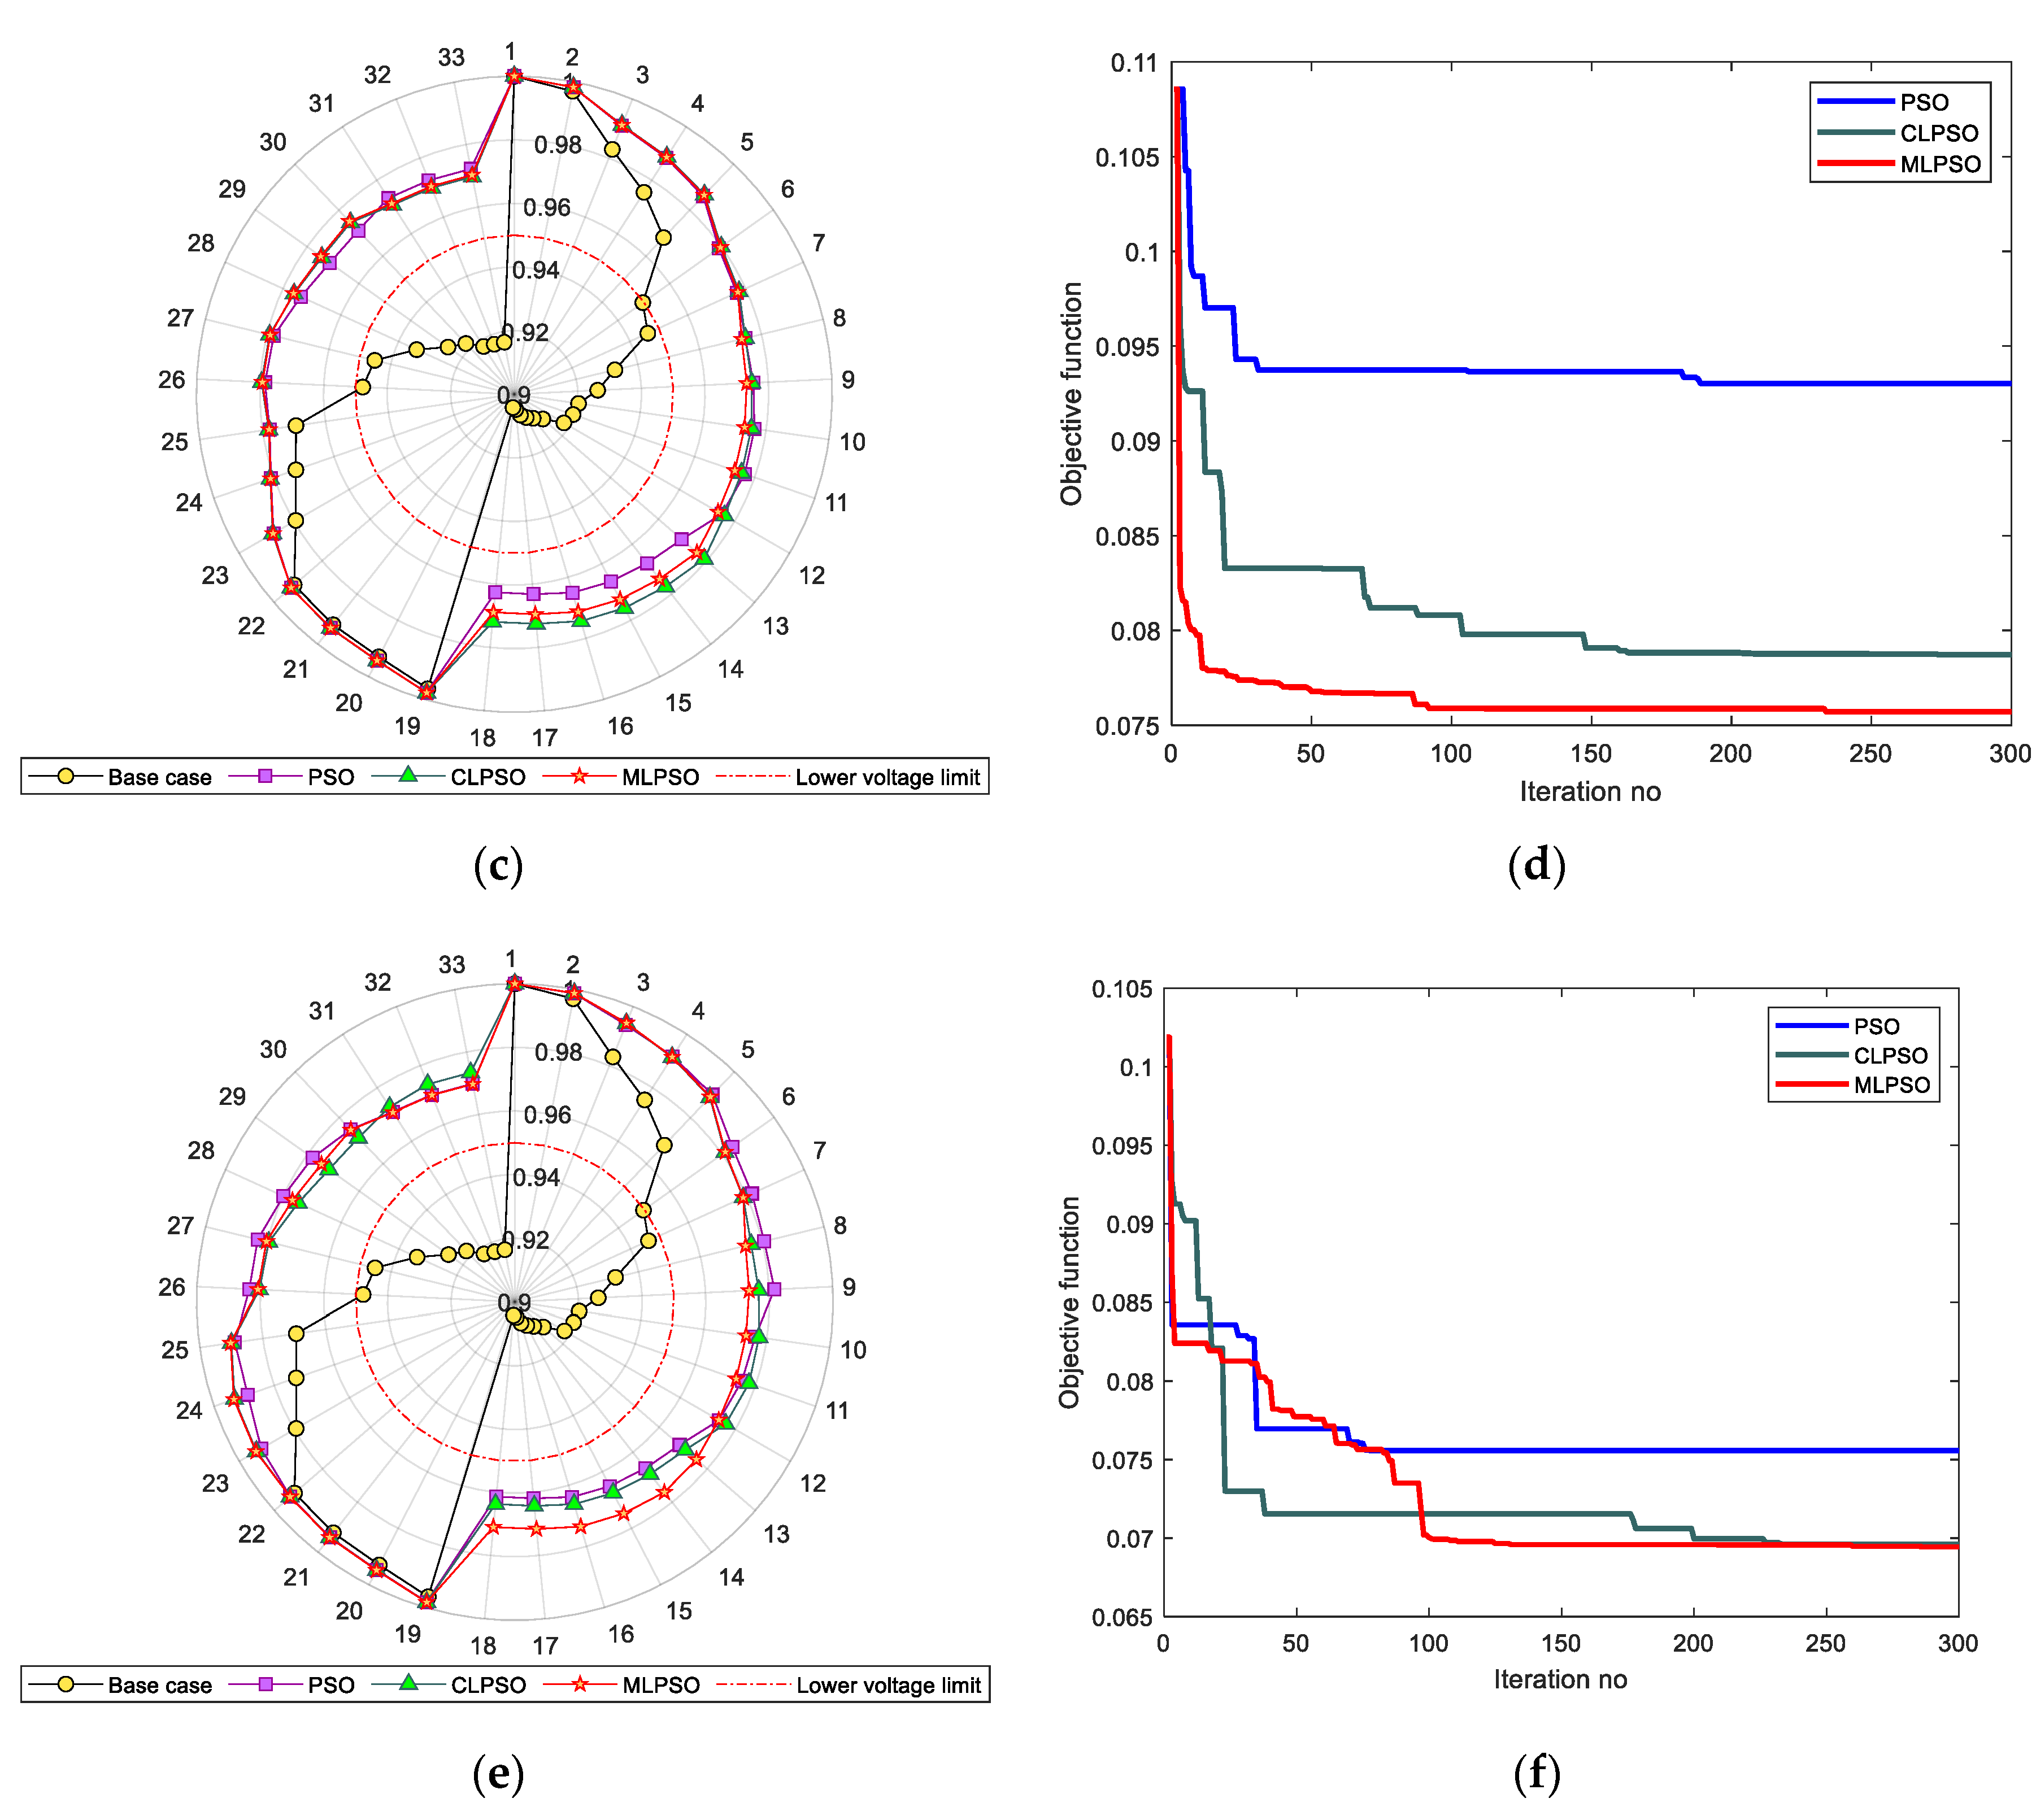
Figure 6 shows the variation of active power loss reduction of all optimization algorithms. The voltage profiles obtained after the simultaneous sizing and siting of DGs in the standard IEEE 33 bus system for each scenario were plotted in radar plots as shown in Figure 7a,c,e. In radar plots, the lower voltage statutory limit (0.95 p.u.) was shown in a dashed red line for a clear demonstration of the voltage profile improvement. The node numbers (i.e., equiangular spokes of the radar plot) were placed radially around the origin and the p.u. voltage values were represented by the points of interception of concentric circles with the radius from 0.9 to 1.0 p.u. and the spokes. Figure 7b,d,f shows the convergence characteristics of the three scenarios considered in this study.
Table 4 shows the minimum, maximum, and mean voltages obtain in three optimization approaches for the three DGs scenario and Figure 8a depicts the variation of mean voltage improvement with the number of DGs for all optimization algorithms in the standard IEEE 33 bus system.
All the optimization algorithms were performed for 10 runs and the objective function values of each run were extracted to investigate the statistical properties of the optimization algorithm. Figure 8b shows the minimum, maximum, mean, and the calculated standard deviation values of all the runs.

4.2. Malaysian Bus System

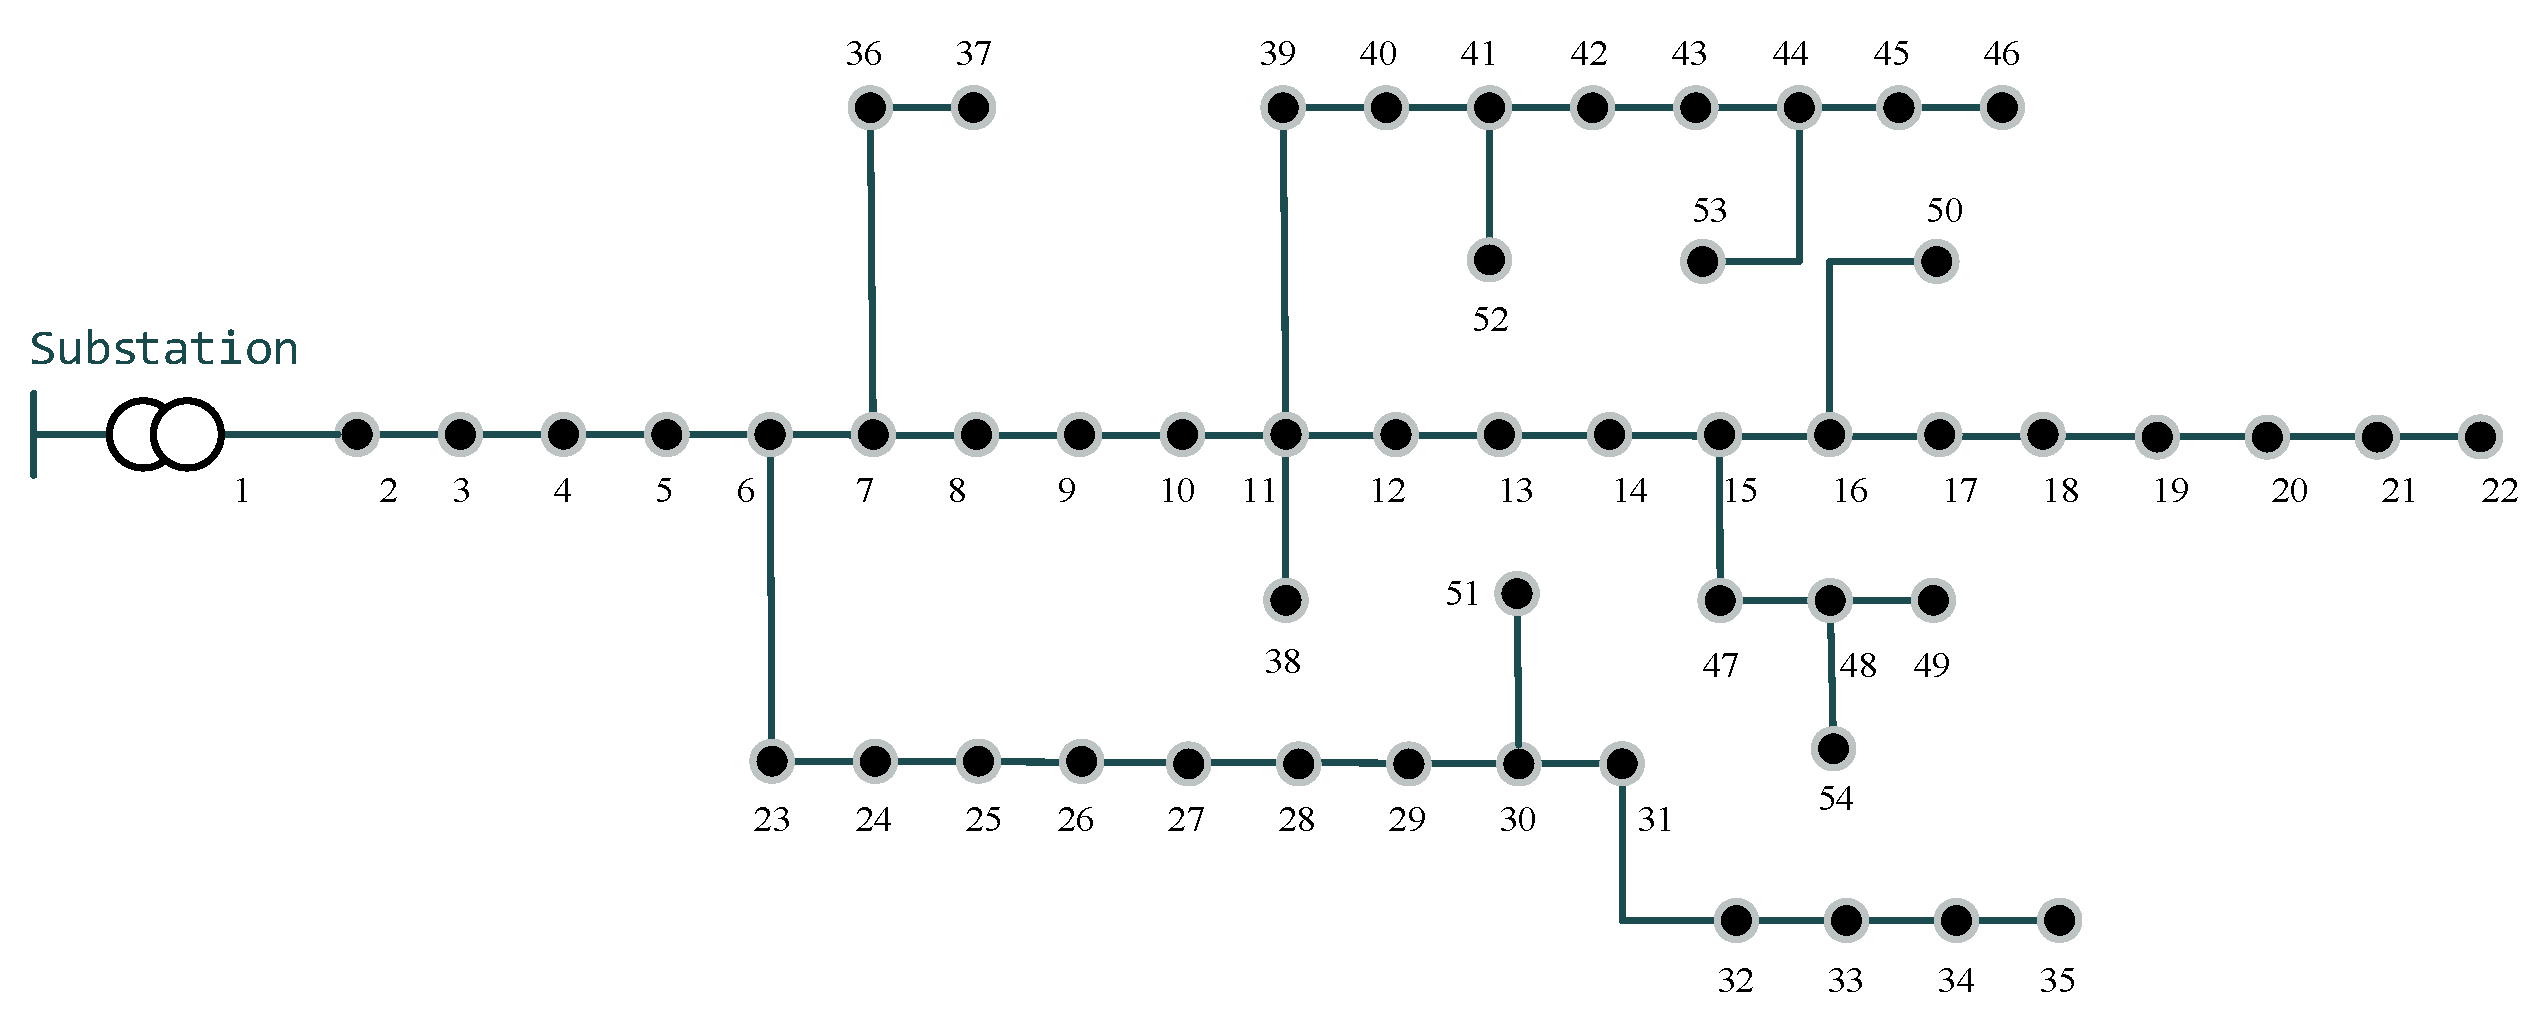
The Malaysian bus system is a radial distribution network with 54 buses as shown in Figure 9. It is rated at 11 kV and a total active load of 4.595 MW and a reactive load of 2.298 Mvar are connected to the system. As per the statutory limits for the voltages of MV networks in the Malaysian context, the maximum and minimum voltage levels were defined as 1.05 and 0.95 p.u.
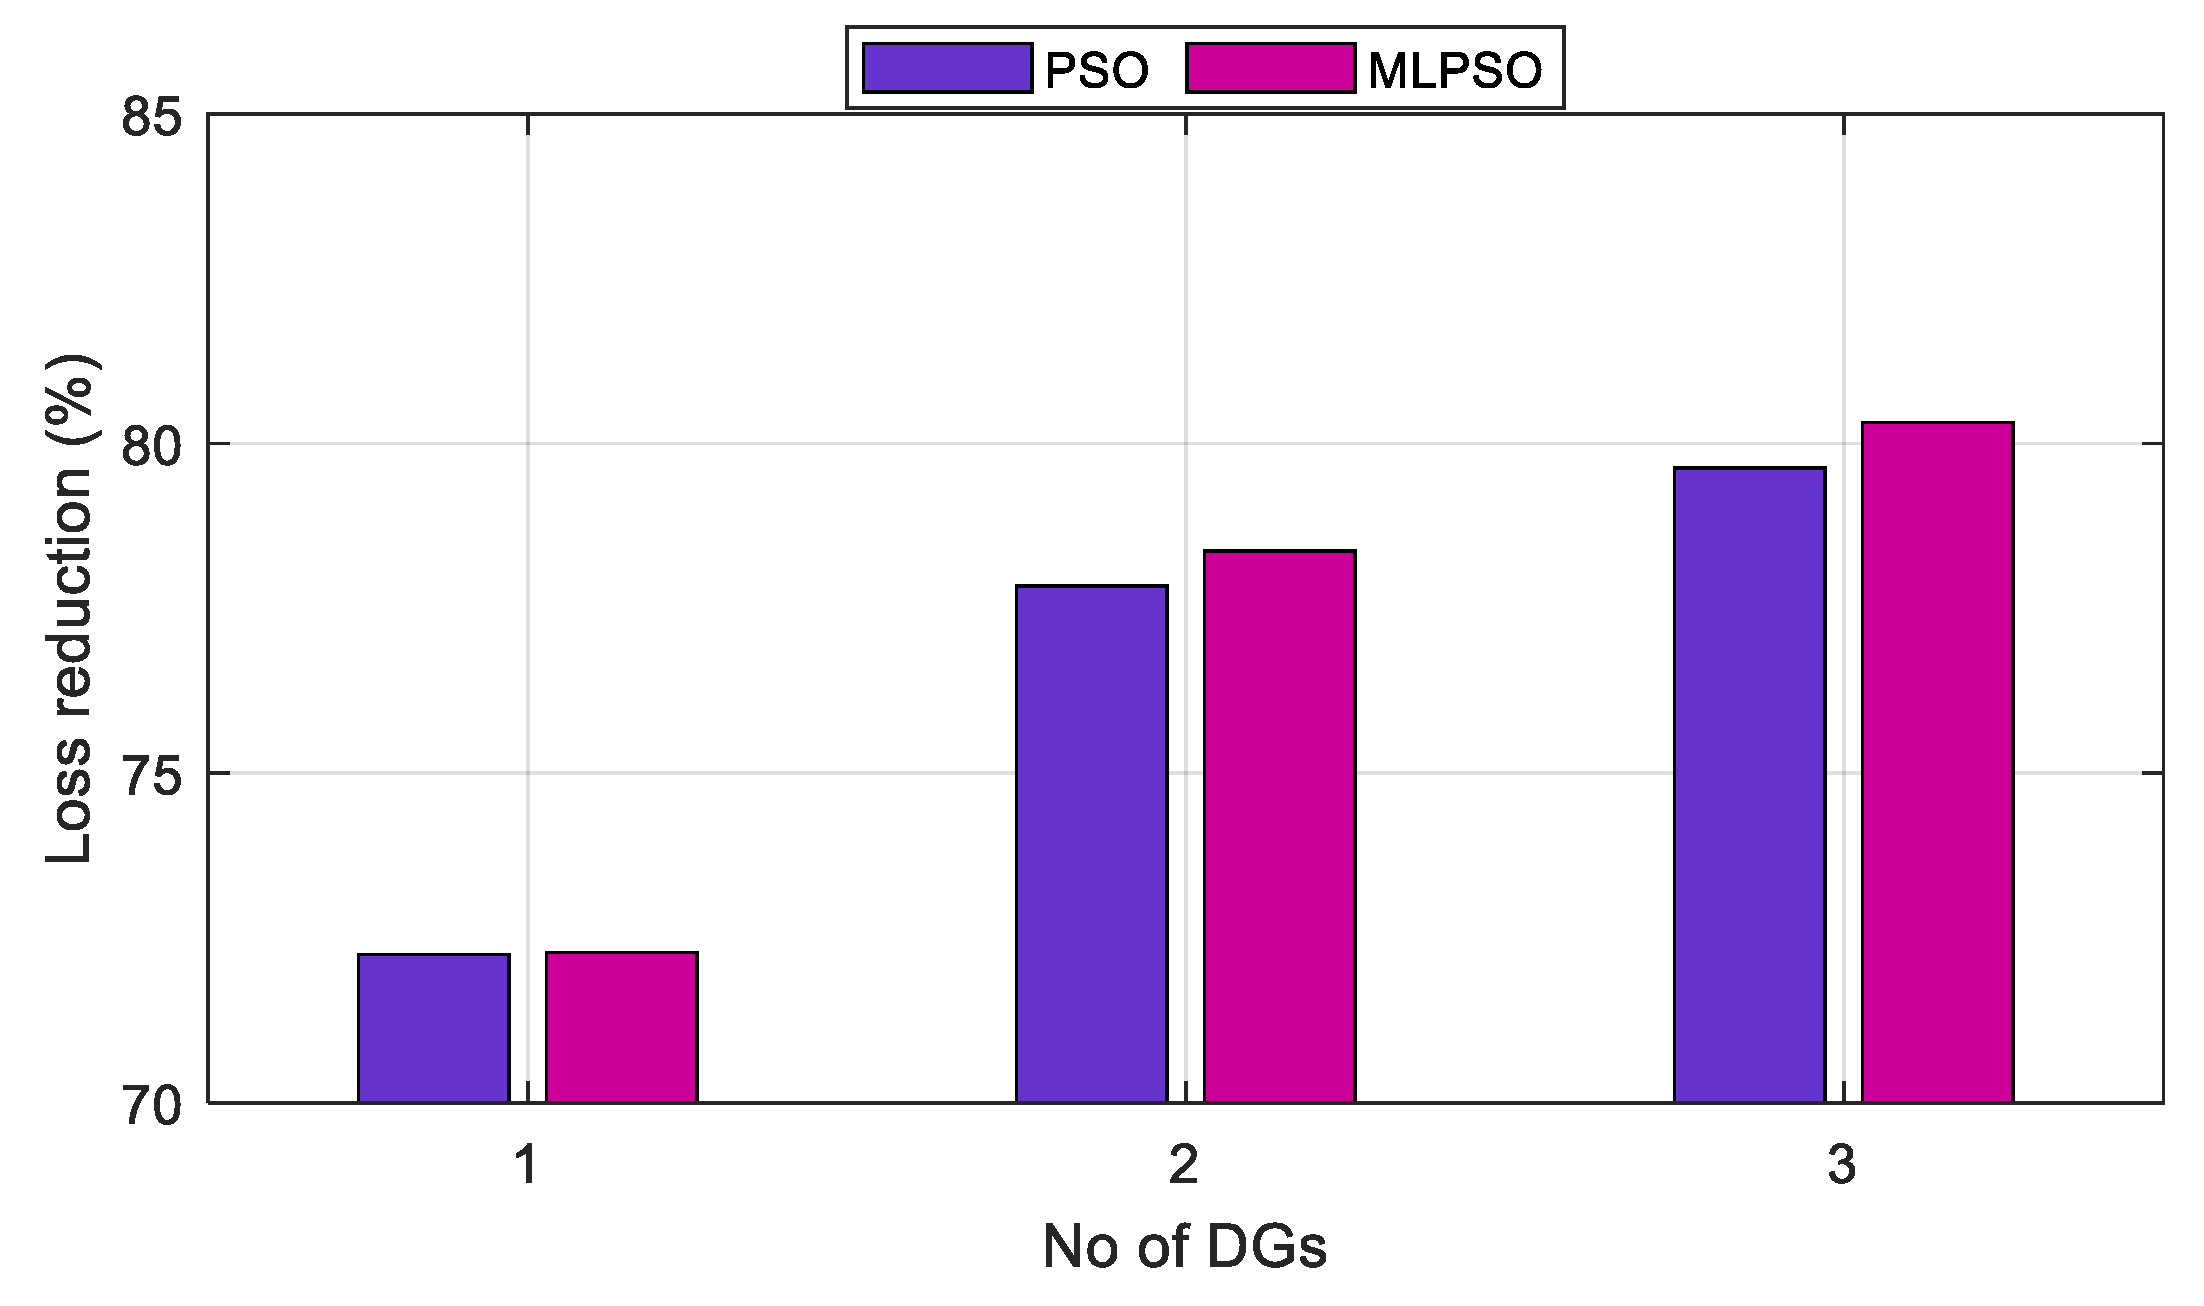
The proposed MLPSO algorithm described in the methodology was utilized to determine the optimal sizing of DGs in the Malaysian MV network. The same (a) a single DG integration, (b) two DGs integration, and (c) three DGs integration scenarios as in the above system were conducted and the obtained optimal solutions are tabulated in Table 5. Moreover, the same assumptions were employed as in IEEE 33 bus system. Figure 10 depicts the percentage of loss reductions in all the scenarios.
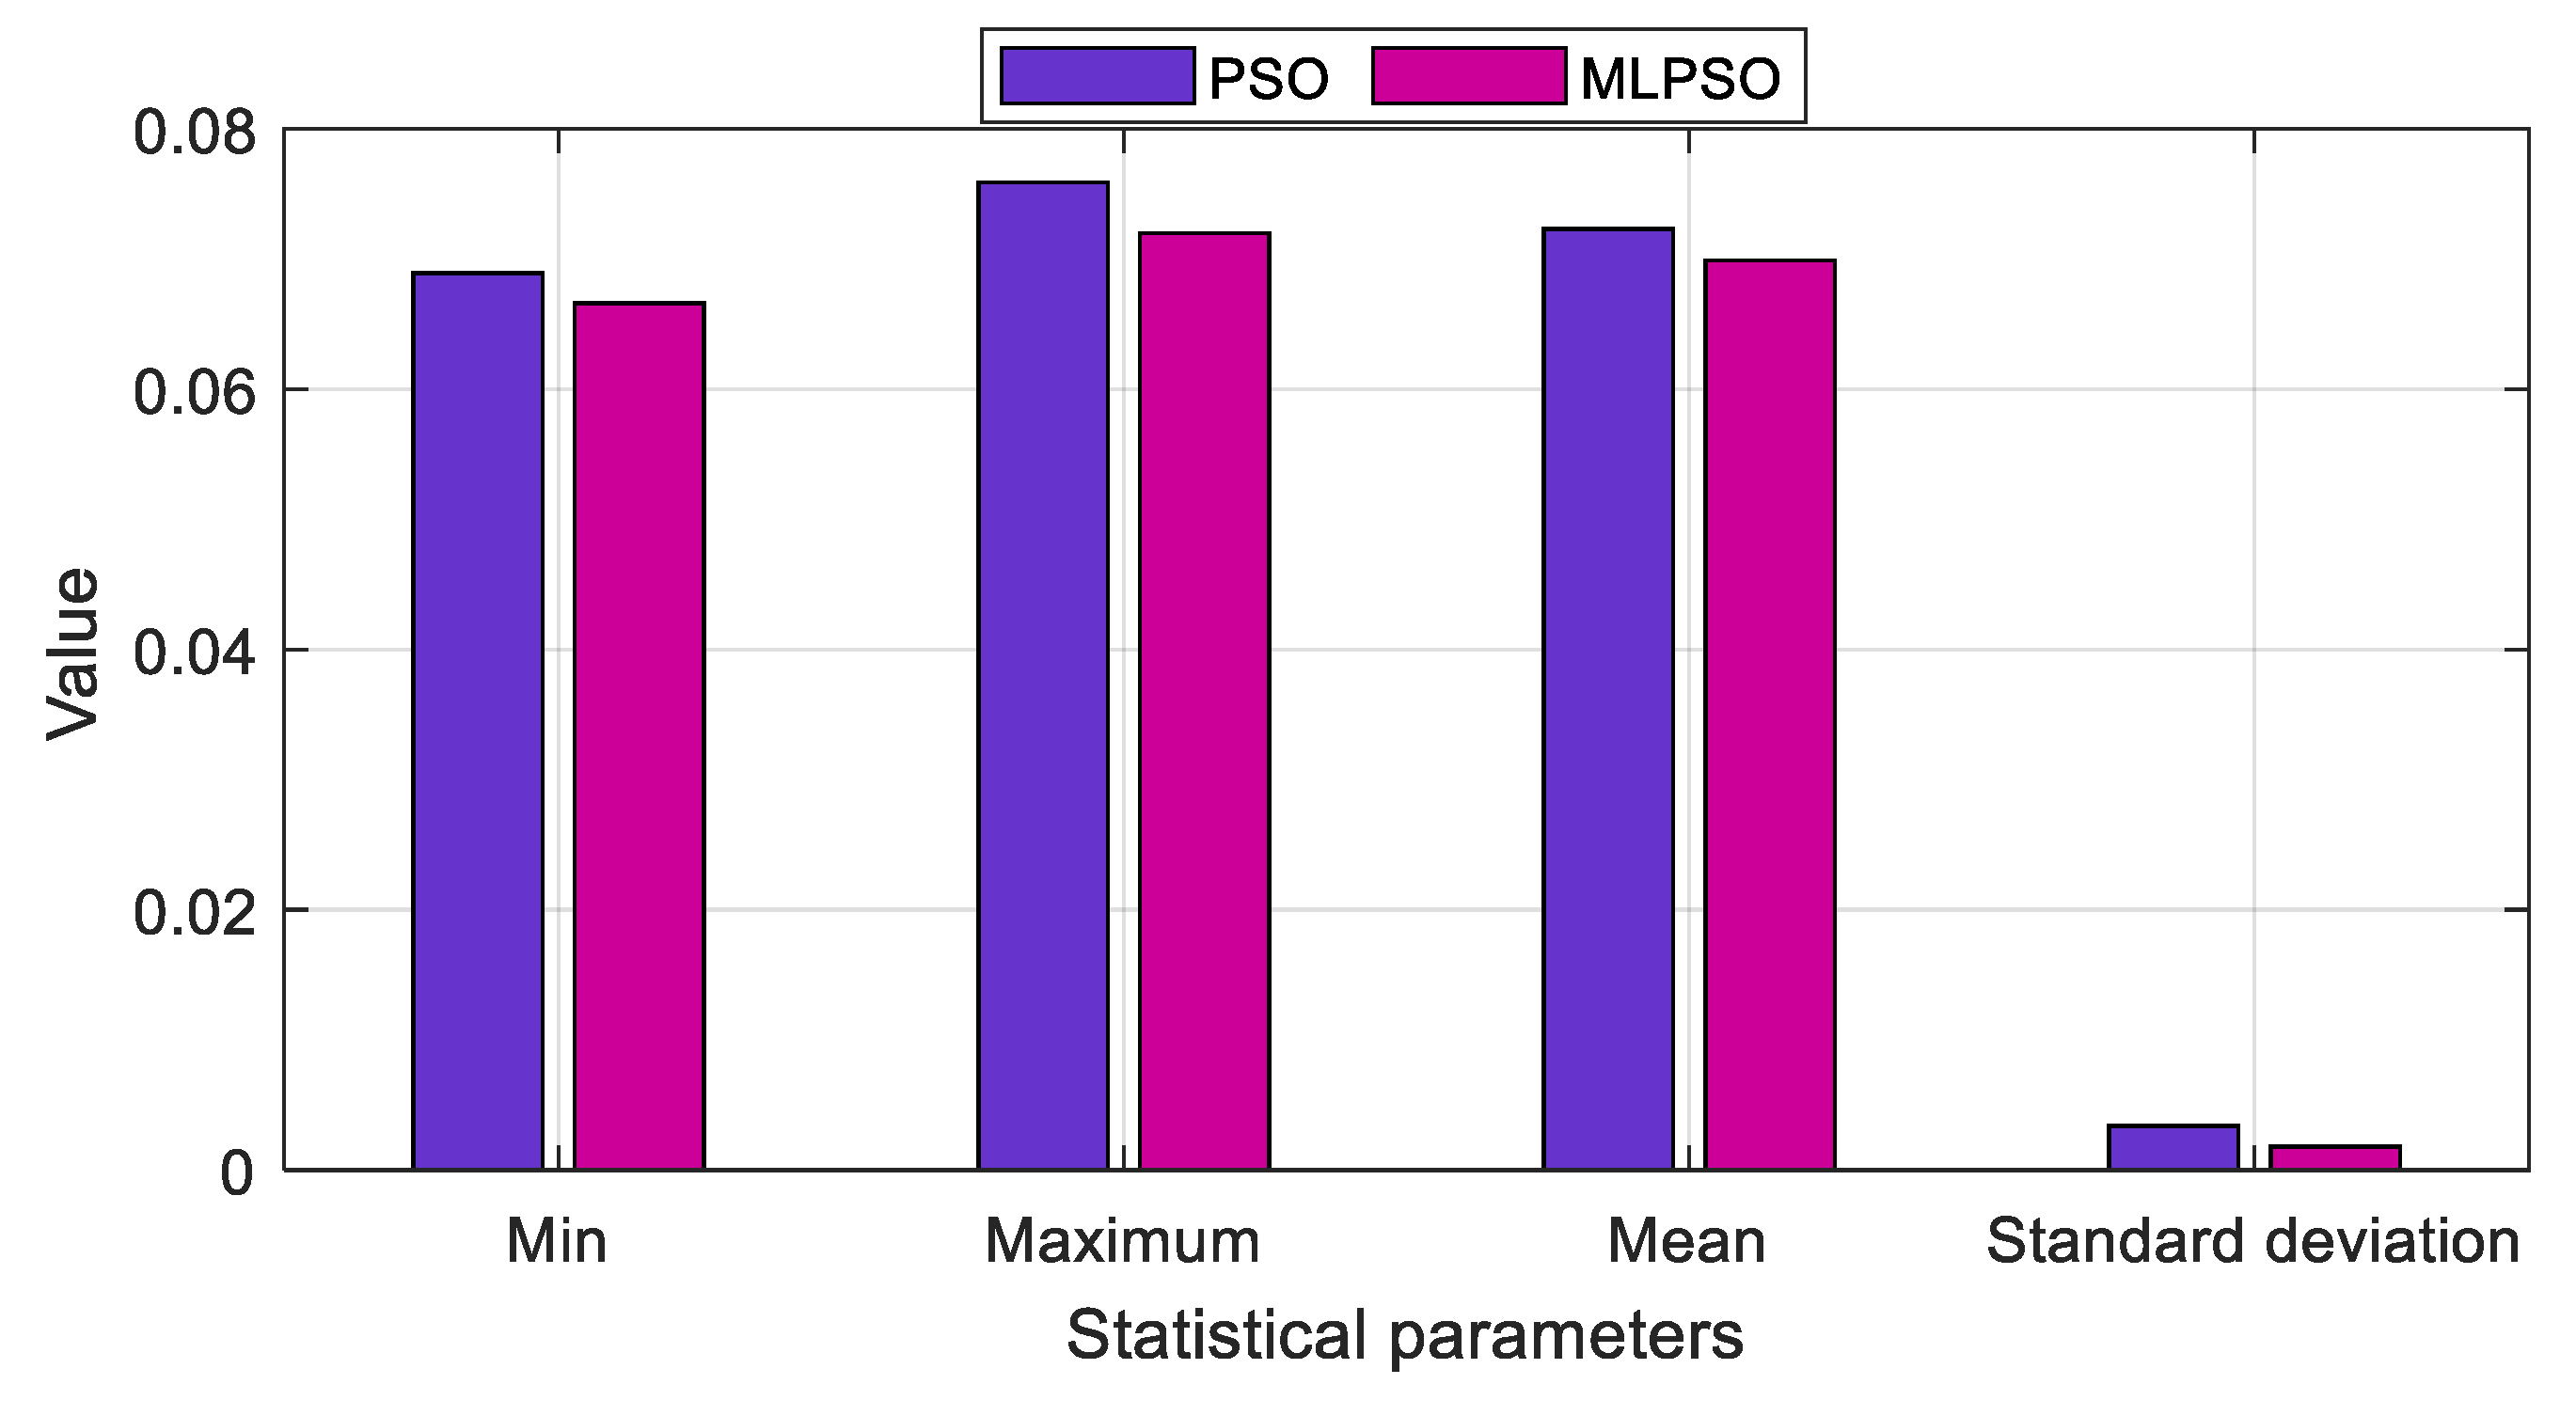
The voltage variations of the Malaysian 54 bus system for two algorithms under (a), (b), and (c) scenarios are shown in Figure 11a,c,e. Figure 11b,d,f shows the convergence characteristics of the objective function for PSO and MLPSO using blue and red colors, respectively. Table 6 presents the minimum, maximum voltages, and respective nodes and the mean voltage of the system after three DGs integration. As in the standard IEEE 33 bus system, the statistical parameters were obtained for the Malaysian test system and shown in Figure 12.

5. Discussion

5.1. Standard IEEE 33 Bus System

According to the load flow results of the original passive network, the active power loss of the standard IEEE 33 bus system is 210.0 kW and the maximum and minimum voltages are 1.0 p.u. at the 1st node and 0.9042 p.u. at the 18th node, respectively. As shown in Table 3, it could be seen alleviation of active power loss of the system in each optimization algorithm, when integrating more DGs. The highest alleviation is shown in the MLPSO algorithm while CLPSO and PSO show the next highest active power losses in the network, respectively. The MLPSO algorithm has minimized the active power loss of the system using the integration of three DGs to 68.460 kW which shows an active power loss reduction of 67.40%. From the results, it could be clearly observed that the proposed MLPSO has significantly reduced the active power loss of the system by determining the optimal locations and the sizes of the DGs.
When considering the locations of the DGs, the first DG in all three optimization approaches is located at the 6th node as it is the common node for the two feeders ending with the 18th and 33rd buses where the substantial voltage drop occurs. In the second scenario, the two DGs were placed more closely to the feeder ends of the first two longest feeders (i.e., feeder with 1–18 nodes and feeder with 26–33 nodes), and in the third scenario, two out of three DGs were placed similar to the second scenario and the third DG was placed at a feeder (consists of 23–25 nodes) which is heavily loaded.
As shown in Figure 7a,c,e, the variation of voltage profile in the original passive system has two spans of lower statutory limit violations. From the graphs related to the variation of nodal voltages with DGs, the improvement of voltage in all three scenarios could be seen. In the single DG scenario, the voltage profiles of all three optimization algorithms are similar. However, all the violations have not been eliminated. In the two and three DG scenarios, MLSPO shows the enhanced voltage variations without any violations.
In Figure 7b,d,f, the convergence of the objective function for the PSO, CLPSO, and MLPSO are shown. In all three graphs, the PSO and CLPSO algorithms show the premature convergence states while MLPSO converges at low objective values. In addition, it could see from the graphs that the convergence time increases with the number of DGs (i.e., the decision variables) optimized. All the optimization algorithms are subjected to voltage constraint which was described in the methodology and the MLPSO presents the highest improvement in mean voltage compared to the other optimization algorithms as shown in Figure 8a. According to Table 4, the minimum voltage was increased to 0.9699 p.u. using three DGs by the MLPSO algorithm and it is a significant improvement compared to the passive system.
In accordance with Figure 8b, the PSO algorithm gives the highest statistical parameters while MLPSO offers the lowest parameters. The standard deviation of the PSO and CLPSO algorithms are higher than MLPSO, and this significant reduction in the standard deviation of MLPSO depicts the uniformity and the quality of the output given by the MLPSO algorithm compared to the PSO and CLPSO. Considering all the results presented for the three optimization algorithms under the standard IEEE 33 bus system, the premature convergence, and the less uniformity of results due to having a single leader could be identified as the limitations of the PSO and CLPSO algorithms. However, the performance of the MLPSO algorithm depends on the selected parameters.

5.2. Malaysian 54 Bus System

The active power loss of the original Malaysian 54 bus system is 338.46 kW and the maximum and minimum voltages are 1.0 p.u. at the 1st node and 0.9082 p.u. at the 22nd node, respectively. As shown in Table 5, the active power loss in the network is reduced to 68.922 and 66.599 kW by PSO and MLPSO using three DG integrations, respectively. The nodes 10–16 and 34–48 could be identified as heavily loaded nodes. Thus, the DGs tend to place in those heavily loaded nodes in all the scenarios. Comparing the optimal locations and sizes in both algorithms, the results show a significant difference only in three DGs integration, and in that scenario, MLPSO has chosen the sitting locations closer to the feeder ends than in PSO.
According to Figure 10, MLPSO has the highest loss reductions under all the scenarios. The percentage reductions of power losses with three DGs correspond to 79.63%, and 80.32% for PSO and, MLPSO and the proposed algorithm leads PSO by 0.7%.
As shown by Figure 11a,c,e, the voltage variation of the original passive network has three spans of voltage violations. They are the 9–22, 31–35, and 38–54 nodes. In this network system, a single DG is sufficient to upgrade the nodal voltages above 0.95 p.u. and surmount all the voltage violations. In each scenario, MLPSO shows an enhancement in nodal voltages compared to PSO. Table 6 shows that the comparable improvement of the minimum voltage and the mean voltage of the system by integrating three DGs using the MLPSO algorithm to 0.9707 to 0.9828 p.u., respectively.
In all three graphs shown in Figure 11b,d,f, the PSO algorithm shows the premature convergence states while MLPSO converges at low objective values. Figure 12 depicts the statistical parameter values of the algorithms and it could be seen that PSO gives the highest values in all the parameters while MLPSO offers the minimum values. This could be used to demonstrate better performance and the quality of the MLPSO algorithm compared to the PSO algorithm.

5.3. Comparison of the Results for the Standard IEEE 33 Bus System with Other Optimization Algorithms

The standard IEEE 33 bus system is a widely used test system especially for the studies related to optimal placement and sizing. Table 7 comprises the outcomes that were obtained from various literature for the same network with the objective of power loss minimization. In any literature, a normalization process was not undertaken to obtain the results. However, in some references, only the loss value was presented, and the percentage loss reduction values were computed. It apparently shows the effectiveness and the performance of the MLPSO algorithm by achieving the highest loss reduction percentage.

5.4. Effect of the Selected Optimization Parameters

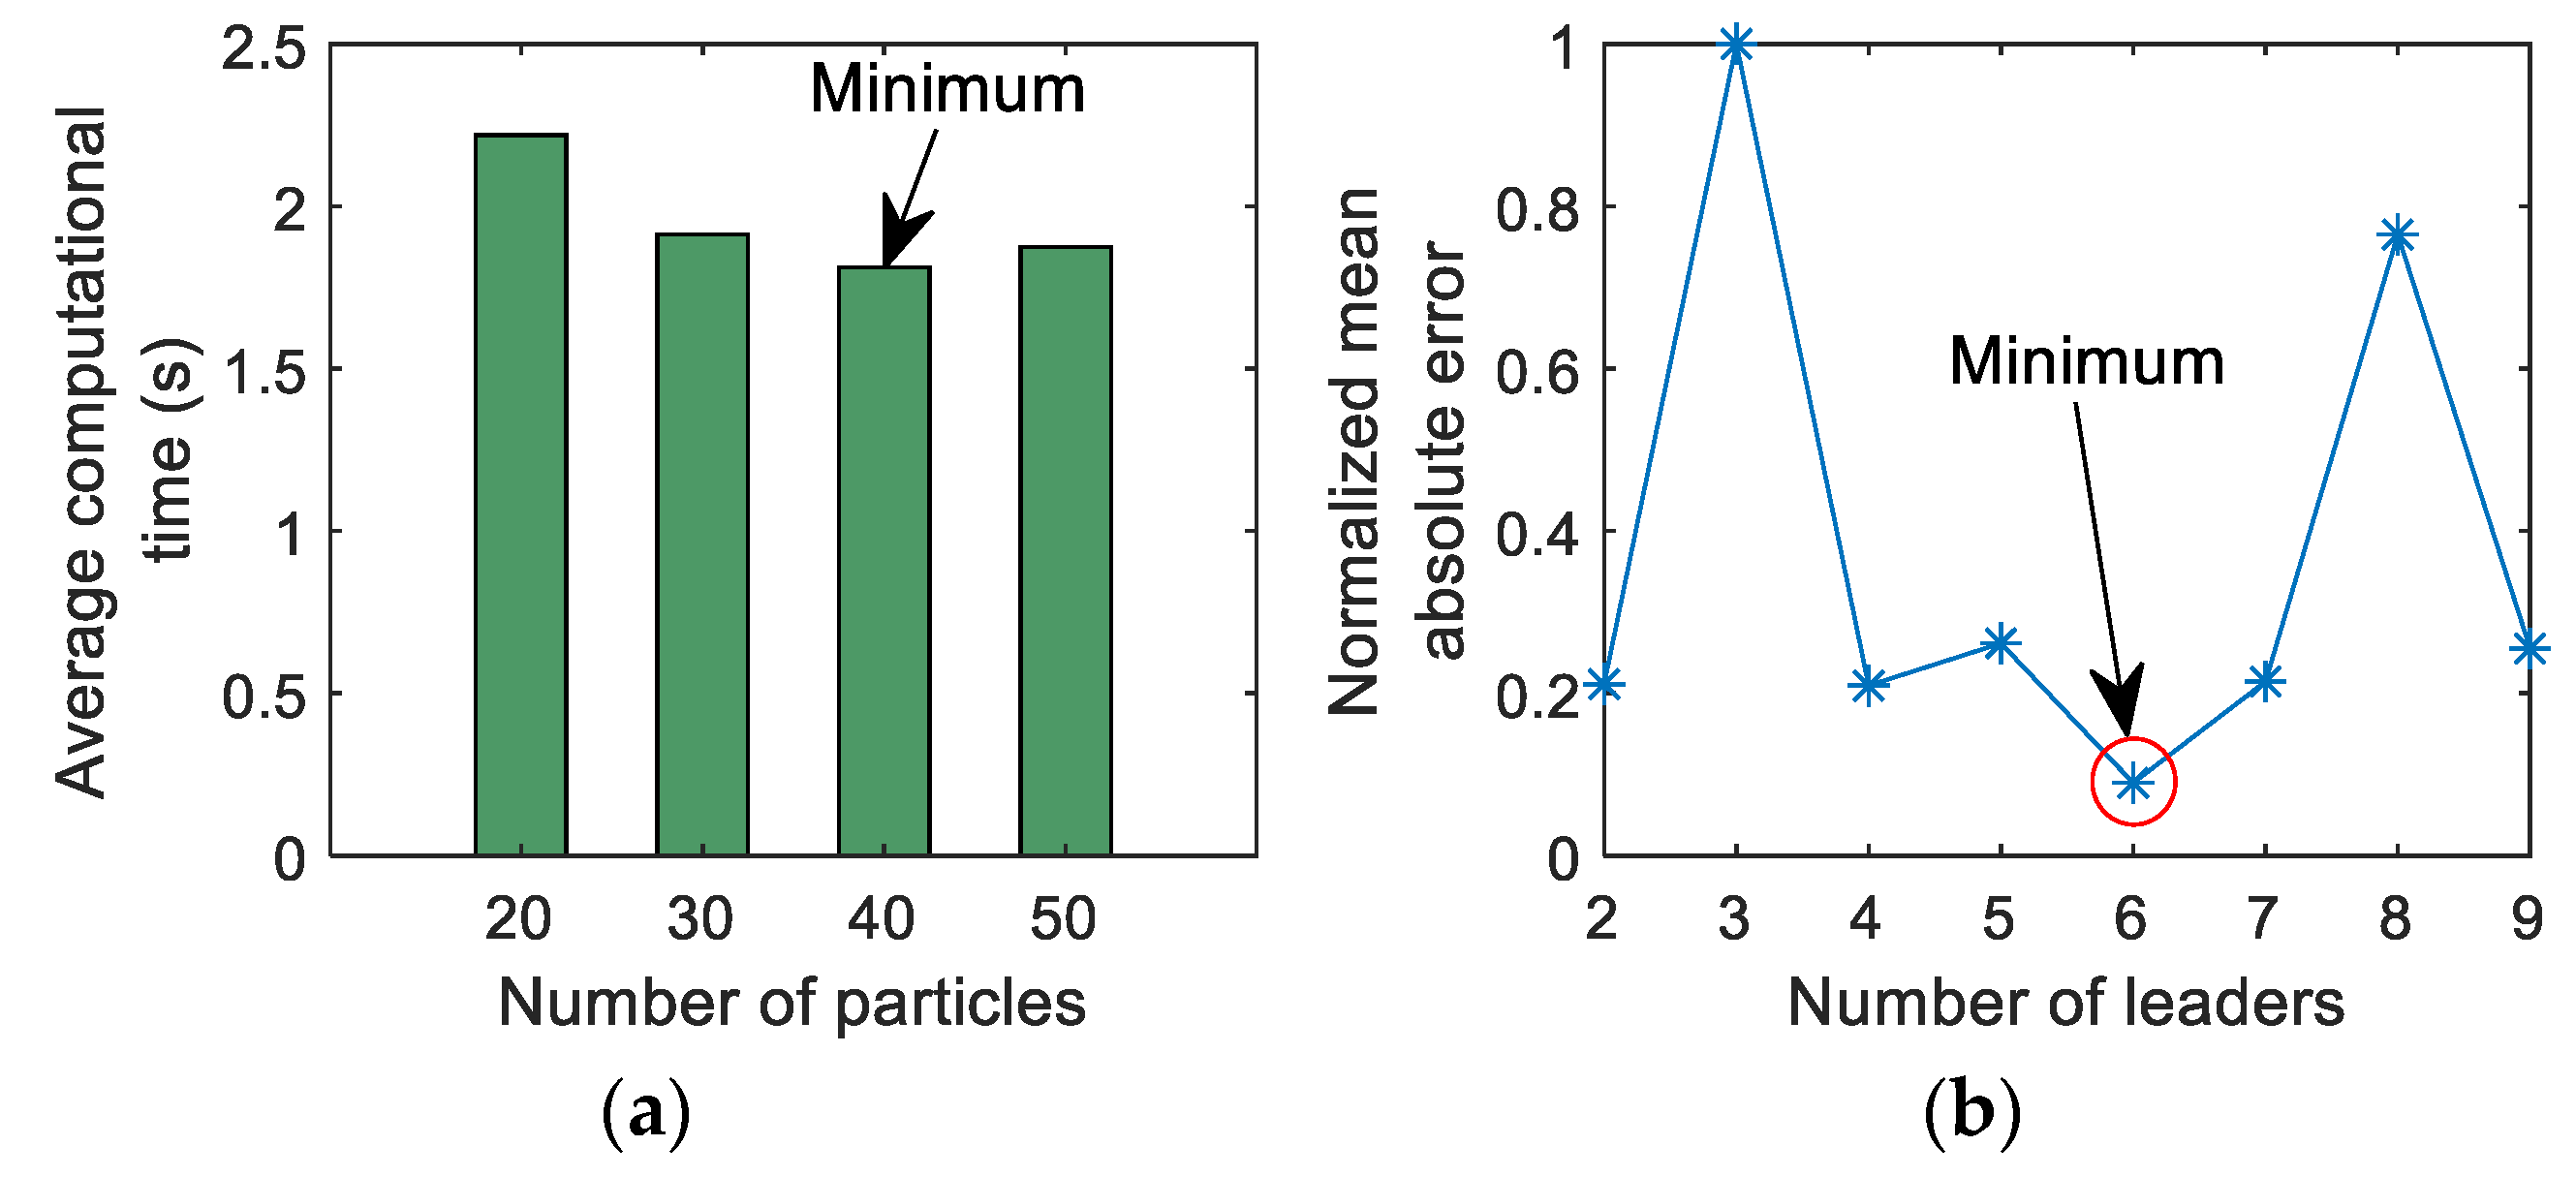
In practice, the cognitive ( C 1 ) and social ( C 2 ) coefficients usually vary from 1.5 to 2.5 for PSO variants. However, it has been proved that C 1 = C 2 = 2 generates better solutions [61]. Therefore, in this study C 1 = C 2 = 2 conditions are used. Usually, the swarm size is limited to 20-50 in most of the PSO variants and it leads to the best results. The smaller swarm size takes more time to reach the optimal solution while the larger swarm size provides the robustness to the optimization. However, a large swarm size indirectly affects the computational burden. Figure 13a shows the average computational time for the different number of particles for the three DG integration in the IEEE 33 bus system. As 40 particles provided the minimum computational time, it was chosen as the swarm size in the study. Furthermore, the number of leaders was chosen by calculating the normalized mean absolute error of the solutions obtained for the three DG scenario of the IEEE 33 bus system. Figure 13b depicts the normalized mean absolute error for the different number of leaders and as can be seen, six leaders provided the minimum error.

5.5. Effect of the Initialization of Particles in the Swarm

As described in Section 3.2.5 (b), the initial positions of swarms are generated according to Equation (21). To investigate the effect of initialization of particles of MLPSO, it is conducted under two cases namely; (1) the swarm is initialized based on the proposed active power injection limit (i.e., the maximum DG size that can be connected to the system), and (2) the swarm is initialized randomly.
Figure 14 includes the convergence characteristics of three DG integration on the standard IEEE 33 bus system under the above (1) and (2) cases. It shows that the MLPSO has reduced the initial objective function value by 28% lower than the random initialization suggesting that the output of the optimization algorithm is closer to the optimal value. Moreover, this reduction of initial objective function value provides fewer iterations to converge compared to the random initialization of the particles. Therefore, the computational burden of the optimization algorithm can be reduced.

6. Conclusions

In this paper, a methodology was introduced to solve the simultaneous placement and sizing of DGs in distribution networks. The DG integration locations were identified using a VSI based approach and the sizing of DGs was determined by the MLPSO algorithm. The optimization provides the optimal DG integration locations and the DG sizes such that the active power loss of the network system is minimized. The analysis was performed on the standard IEEE 33 bus system and a radial Malaysian MV bus system under three scenarios; (a) one, (b) two, and (c) three DG integrations to determine the placements and sizes of DGs. In all the scenarios, the findings show that the proposed methodology has significantly reduced the power loss of the system compared to the studied other PSO variants in both test systems.
In the case study, the three DG integration under the scenario (c) conducted using the proposed optimization algorithm has offered the maximum loss reductions for both test systems. It is 67.40% for the standard IEEE bus system and 80.32% for the Malaysian MV bus system. In addition, the voltage profiles of the test systems have enhanced compared to the other optimization approaches. The elimination of the state of premature convergence is clearly depicted by converging the optimization at a low objective function value. Furthermore, the low standard deviation value of the MLPSO algorithm shows the uniformity and the quality of the output.
The proposed method was compared with another two PSO variants and also with the best results obtained by other optimization algorithms in the literature. According to the comparison of loss reduction results for the standard IEEE 33 bus system, the proposed methodology showed the improvement of loss reduction by optimally placing and sizing the DGs. Moreover, the selected parameters of the optimization process demonstrated their suitability in reducing the computational time and the increasing quality of the optimization algorithm. Furthermore, the proposed particle initialization of the MLPSO algorithm depicted the less computation burden compared to the random initializations.

Author Contributions

Conceptualization, E.K.; methodology, E.K.; software, E.K., and D.A.; writing—original draft preparation, E.K., J.P., J.E., and D.A.; writing—review and editing, E.K., J.P., J.E., and D.A.; visualization, E.K., and D.A.; supervision, J.P., and J.E.; project administration, J.P.; funding acquisition, J.P. All authors have read and agreed to the published version of the manuscript.

Funding

This research was funded by the Ministry of Education (MOE), Malaysia, grant number 20180117FRGS, and the APC was funded by Universiti Tenaga Nasional (UNITEN), Malaysia through RJO10517919/iRMC/publication.

Acknowledgments

The authors would like to thank the Ministry of Education (MOE), Malaysia, and Universiti Tenaga Nasional (UNITEN), Malaysia.

Conflicts of Interest

The authors declare no conflict of interest.

Abbreviations

ABCArtificial Bee ColonyKHAKhrill Herd Algorithm
ACOAnt Colony OptimizationkVKiloVolts
ASFLAAdaptive Shuffled Frogs Leaping AlgorithmkWKiloWatts
BABat AlgorithmLHSLeft Hand Side
BBOBiography Based OptimizationLSFLoss Sensitivity Factor
BFOABacterial Foraging Optimization AlgorithmMILPMixed Integer Linear Programing
BSOABacktracking Search Optimization AlgorithmMINLPMixed Integer Nonlinear Programing
CLPSOComprehensive Learning Particle Swarm OptimizationMLPSOMultileader Particle Swarm Optimization
CSACuckoo Search AlgorithmMOTAMultiobjective Taguchi Approach
CSCAChaotic Sine Cosine AlgorithmMvarMega Var
DEDifferential EvolutionMWMegaWatts
DGDistributed GenerationNANot Applicable
ELFExhaustive Load Flowp.u.Per Unit
EMAExchange Market AlgorithmPSOParticle Swarm Optimization
FWAFireworks AlgorithmQOCSOSQuasi-Oppositional Chaotic Symbiotic Organisms Search
GAGenetic AlgorithmRHSRight Hand Side
GAMSGeneral Algebraic Modeling SystemSASimulated Annealing
GSAGravitational Search AlgorithmSFLAShuffled Frogs Leaping Algorithm
HGWOHybrid Grey Wolf OptimizationSKHAStud Khrill Herd Algorithm
HPSOHybrid Particle Swarm OptimizationSSASlap Swarm Algorithm
HSAHarmony Search AlgorithmTMTaguchi Method
IAImproved AnalyticalTSTabu Search
IEEEInstitute of Electrical and Electronics EngineersVSIVoltage Stability Index
IWDIntelligent Water DropWCAWater Cycle Algorithm
IWOInvasive Weed Optimization

Appendix A

According to Figure 2,
P l j Q l = V k * × I k l   where   I k l = V k V l R k l + j X k l
By substituting for I k l ,
| V l | 4 { | V k | 2 2 P l R k l 2 Q l X k l } | V k | 2 + { P l 2 + Q l 2 } { R k l 2 + X k l 2 } = 0
After rearranging this,
| V l | 4 + 2 | V l | 2 { P l R k l + Q l X k l } | V l | 2 | V k | 2 + { P l 2 + Q l 2 } { R k l 2 + X k l 2 } = 0
From this equation, two quadratic equations were formed for active power and reactive power at the receiving end. The quadratic functions for active and reactive power were derived as,
a P l 2 + b p P l + c p = 0
a Q l 2 + b q Q l + c q = 0
where = { R k l 2 + X k l 2 } , b p = 2 | V l | 2 R k l , b q = 2 | V l | 2 X k l , c p = | V l | 4 + 2 | V l | 2 Q l X k l | V l | 2 | V k | 2 + Q l 2 { R k l 2 + X k l 2 } and c q = | V l | 4 + 2 | V l | 2 P l R k l | V l | 2 | V k | 2 + P l 2 { R k l 2 + X k l 2 } .
The condition of existence of a quadratic equation, the discriminant, b p / q 2 4 a c p / q 0 , For active power,
2 | V l | 2 R k l 2 4 { R k l 2 + X k l 2 } { | V l | 4 + 2 | V l | 2 Q l X k l | V l | 2 | V k | 2 + Q l 2 { R k l 2 + X k l 2 } } 0
For reactive power,
{ 2 | V l | 2 X k l } 2 4 { R k l 2 + X k l 2 } { | V l | 4 + 2 | V l | 2 P l R k l | V l | 2 | V k | 2 + P l 2 { R k l 2 + X k l 2 } } 0
By obtaining the sum of the above two equations,
ϑ = 2 | V l | 2 | V k | 2 | V l | 4 2 | V l | 2 { P l R k l + Q l X k l } | z k l | 2 { P l 2 + Q l 2 } 0
where | z k l | 2 = { R k l 2 + X k l 2 } . This equation implies that the value of ϑ will decrease with the increase of transferred power. Therefore, the VSI was defined as in (A9).
V S I = 2 | V l | 2 | V k | 2 | V l | 4 2 | V l | 2 { P l R k l + Q l X k l } | z k l | 2 { P l 2 + Q l 2 }

References

  1. Gupta, A.R.; Kumar, A. Optimal placement of D-STATCOM using sensitivity approaches in mesh distribution system with time variant load models under load growth. Ain Shams Eng. J. 2018, 9, 783–799. [Google Scholar] [CrossRef] [Green Version]
  2. Dovì, V.G.; Battaglini, A. Energy Policy and Climate Change: A Multidisciplinary Approach to a Global Problem. Energies 2015, 8, 13473–13480. [Google Scholar] [CrossRef] [Green Version]
  3. CIGRE. Impact of Increasing Contribution of Dispersed Generation on The Power System: Final Report; CIGRE: Paris, France, 1998. [Google Scholar]
  4. Akorede, M.F.; Hizam, H.; Pouresmaeil, E. Distributed energy resources and benefits to the environment. Renew. Sustain. Energy Rev. 2010, 14, 724–734. [Google Scholar] [CrossRef]
  5. Khan, Z.W.; Khan, S. Analyzing the impacts of Distributed Generation on power losses and voltage profile. In Proceedings of the 2015 International Conference on Emerging Technologies (ICET), Peshawar, Pakistan, 19–20 December 2015; IEEE: Piscataway, NJ, USA, 2015; pp. 1–4. [Google Scholar]
  6. Pepermans, G.; Driesen, J.; Haeseldonckx, D.; Belmans, R.; D’Haeseleer, W. Distributed generation: Definition, benefits and issues. Energy Policy 2005, 33, 787–798. [Google Scholar] [CrossRef]
  7. Guan, F.; Zhao, D.; Zhang, X.; Shan, B.; Liu, Z. Research on distributed generation technologies and its impacts on power system. In Proceedings of the 2009 International Conference on Sustainable Power Generation and Supply, Nanjing, China, 6–7 April 2009; IEEE: Piscataway, NJ, USA, 2009; pp. 1–6. [Google Scholar]
  8. Liu, W.; Luo, F.; Liu, Y.; Ding, W. Optimal Siting and Sizing of Distributed Generation Based on Improved Nondominated Sorting Genetic Algorithm II. Processes 2019, 7, 955. [Google Scholar] [CrossRef] [Green Version]
  9. Nguyen, T.D.T.; Ruan, J.; Nguyen, Q.N.; Le, N.G.; Tan, D.; Hu, L. Study of Economical-Technical Impacts of Distributed Generation on Medium-Voltage Grid. TELKOMNIKA Indones. J. Electr. Eng. 2014, 12, 1177–1187. [Google Scholar] [CrossRef]
  10. Aman, M.; Jasmon, G.; Mokhlis, H.; Bakar, A. Optimal placement and sizing of a DG based on a new power stability index and line losses. Int. J. Electr. Power Energy Syst. 2012, 43, 1296–1304. [Google Scholar] [CrossRef]
  11. Ehsan, A.; Yang, Q. Optimal integration and planning of renewable distributed generation in the power distribution networks: A review of analytical techniques. Appl. Energy 2018, 210, 44–59. [Google Scholar] [CrossRef]
  12. Jordehi, A.R. Allocation of distributed generation units in electric power systems: A review. Renew. Sustain. Energy Rev. 2016, 56, 893–905. [Google Scholar] [CrossRef]
  13. Haji Abbas, M.P.; Huy, P.D.; Ramachandaramurthy, V.K. A review of the optimal allocation of distributed generation: Objectives, constraints, methods, and algorithms. Renew. Sustain. Energy Rev. 2017, 75, 293–312. [Google Scholar] [CrossRef]
  14. Hung, D.Q.; Mithulananthan, N.; Bansal, R. Analytical strategies for renewable distributed generation integration considering energy loss minimization. Appl. Energy 2013, 105, 75–85. [Google Scholar] [CrossRef]
  15. Gözel, T.; Hocaoglu, M.H. An analytical method for the sizing and siting of distributed generators in radial systems. Electr. Power Syst. Res. 2009, 79, 912–918. [Google Scholar] [CrossRef]
  16. Sa’Ed, J.A.; Amer, M.; Bodair, A.; Baransi, A.; Favuzza, S.; Zizzo, G. A Simplified Analytical Approach for Optimal Planning of Distributed Generation in Electrical Distribution Networks. Appl. Sci. 2019, 9, 5446. [Google Scholar] [CrossRef] [Green Version]
  17. Acharya, N.; Mahat, P.; Mithulananthan, N. An analytical approach for DG allocation in primary distribution network. Int. J. Electr. Power Energy Syst. 2006, 28, 669–678. [Google Scholar] [CrossRef]
  18. Rueda-Medina, A.C.; Franco, J.F.; Rider, M.J.; Padilha-Feltrin, A.; Romero, R. A mixed-integer linear programming approach for optimal type, size and allocation of distributed generation in radial distribution systems. Electr. Power Syst. Res. 2013, 97, 133–143. [Google Scholar] [CrossRef]
  19. Kaur, S.; Kumbhar, G.; Sharma, J. A MINLP technique for optimal placement of multiple DG units in distribution systems. Int. J. Electr. Power Energy Syst. 2014, 63, 609–617. [Google Scholar] [CrossRef]
  20. Vita, V.; Alimardan, T.; Ekonomou, L. The Impact of Distributed Generation in the Distribution Networks’ Voltage Profile and Energy Losses. In Proceedings of the 2015 IEEE European Modelling Symposium (EMS), Madrid, Spain, 6–8 October 2015; IEEE: Piscataway, NJ, USA, 2016; pp. 260–265. [Google Scholar]
  21. Vita, V. Development of a Decision-Making Algorithm for the Optimum Size and Placement of Distributed Generation Units in Distribution Networks. Energies 2017, 10, 1433. [Google Scholar] [CrossRef] [Green Version]
  22. Singh, D.; Singh, D.; Verma, K. GA based energy loss minimization approach for optimal sizing & placement of distributed generation. Int. J. Knowl. Based Intell. Eng. Syst. 2008, 12, 147–156. [Google Scholar] [CrossRef]
  23. Biswas, S.; Goswami, S.K.; Chatterjee, A. Optimum distributed generation placement with voltage sag effect minimization. Energy Convers. Manag. 2012, 53, 163–174. [Google Scholar] [CrossRef]
  24. Hadavi, S.; Zaker, B.; Karami, H.; Arani, A.A.K.; Gharehpetian, G.B. Optimal placement and sizing of DGs considering static voltage stability. In Proceedings of the 2017 Conference on Electrical Power Distribution Networks Conference (EPDC), Semnan, Iran, 19–20 April 2017; IEEE: Piscataway, NJ, USA, 2017; pp. 12–16. [Google Scholar]
  25. Shaaban, M.F.; Atwa, Y.M.; El-Saadany, E.F. DG allocation for benefit maximization in distribution networks. IEEE Trans. Power Syst. 2012, 28, 639–649. [Google Scholar] [CrossRef]
  26. Rugthaicharoencheep, N.; Lantharthong, T.; Ratreepruk, A.; Ratchatha, J.; Rugthaichareoncheep, N. Application of Tabu Search for Optimal Placement and Sizing of Distributed Generation for Loss Reduction. Adv. Mater. Res. 2012, 433, 7190–7194. [Google Scholar] [CrossRef]
  27. Prabha, D.R.; Jayabarathi, T.; Umamageswari, R.; Saranya, S. Optimal location and sizing of distributed generation unit using intelligent water drop algorithm. Sustain. Energy Technol. Assess. 2015, 11, 106–113. [Google Scholar] [CrossRef]
  28. Sudabattula, S.K.; Kowsalya, M. Optimal allocation of solar based distributed generators in distribution system using Bat algorithm. Perspect. Sci. 2016, 8, 270–272. [Google Scholar] [CrossRef] [Green Version]
  29. Candelo-Becerra, J.E.; Riaño, H.E.H. Distributed Generation Placement in Radial Distribution Networks using a Bat-inspired Algorithm. DYNA 2015, 82, 60–67. [Google Scholar] [CrossRef]
  30. Onlam, A.; Yodphet, D.; Chatthaworn, R.; Surawanitkun, C.; Siritaratiwat, A.; Khunkitti, P. Power Loss Minimization and Voltage Stability Improvement in Electrical Distribution System via Network Reconfiguration and Distributed Generation Placement Using Novel Adaptive Shuffled Frogs Leaping Algorithm. Energies 2019, 12, 553. [Google Scholar] [CrossRef] [Green Version]
  31. Devi, S.; Geethanjali, M. Application of Modified Bacterial Foraging Optimization algorithm for optimal placement and sizing of Distributed Generation. Expert Syst. Appl. 2014, 41, 2772–2781. [Google Scholar] [CrossRef]
  32. Kowsalya, M. Optimal size and siting of multiple distributed generators in distribution system using bacterial foraging optimization. Swarm Evol. Comput. 2014, 15, 58–65. [Google Scholar] [CrossRef]
  33. Ravindran, S.; Victoire, A.A. A bio-geography-based algorithm for optimal siting and sizing of distributed generators with an effective power factor model. Comput. Electr. Eng. 2018, 72, 482–501. [Google Scholar] [CrossRef]
  34. Zaid, N.M.; Mokhtar, M.K.; Musirin, I.; Rahmat, N.A. Multi-Objective Optimization for Sizing of Distributed Generation Using Cuckoo Search Algorithm. Appl. Mech. Mater. 2015, 785, 34–37. [Google Scholar] [CrossRef]
  35. Kumari, R.V.S.L.; Kumar, G.V.N.; Nagaraju, S.S.; Jain, M.B. Optimal sizing of distributed generation using particle swarm optimization. In Proceedings of the 2017 International Conference on Intelligent Computing, Instrumentation and Control Technologies (ICICICT), Kannur, India, 6–7 July 2017; IEEE: Piscataway, NJ, USA, 2017; pp. 499–505. [Google Scholar]
  36. Tolba, M.A.; Tulsky, V.N.; Diab, A.A.Z. Optimal allocation and sizing of multiple distributed generators in distribution networks using a novel hybrid particle swarm optimization algorithm. In Proceedings of the 2017 IEEE Conference of Russian Young Researchers in Electrical and Electronic Engineering (EIConRus), St. Petersburg, Russia, 1–3 February 2017; IEEE: Piscataway, NJ, USA, 2017; pp. 1606–1612. [Google Scholar]
  37. Karunarathne, E.; Pasupuleti, J.; Ekanayake, J.; Almeida, D. Comprehensive learning particle swarm optimization for sizing and placement of distributed generation for network loss reduction. Indones. J. Electr. Eng. Comput. Sci. 2020, 20, 16–23. [Google Scholar] [CrossRef]
  38. Kennedy, J. Small worlds and mega-minds: Effects of neighborhood topology on particle swarm performance. In Proceedings of the 1999 Congress on Evolutionary Computation—CEC99 (Cat. No. 99TH8406), Washington, DC, USA, 6–9 July 1999; IEEE: Piscataway, NJ, USA, 2003; Volume 3, p. 1931. [Google Scholar]
  39. Kennedy, J.; Mendes, R. Population structure and particle swarm performance. In Proceedings of the 2002 Congress on Evolutionary Computation. CEC’02 (Cat. No.02TH8600), Honolulu, HI, USA, 12–17 May 2002; IEEE: Piscataway, NJ, USA, 2003; Volume 2, pp. 1671–1676. [Google Scholar]
  40. Long, H.X.; Xu, W.B.; Wang, X.G.; Sun, J. Using selection to improve quantum-behaved particle swarm optimization. Kongzhi yu Juece/Control Decis. 2010, 25, 1499–1506. [Google Scholar]
  41. Jordehi, A.R. Enhanced leader PSO (ELPSO): A new PSO variant for solving global optimisation problems. Appl. Soft Comput. 2015, 26, 401–417. [Google Scholar] [CrossRef]
  42. Akbari, R.; Ziarati, K. A cooperative approach to bee swarm optimization. J. Inf. Sci. Eng. 2011, 27, 799–818. [Google Scholar] [CrossRef]
  43. Kennedy, J.; Eberhart, R. 47-Particle Swarm Optimization. In Proceedings of the ICNN’95—International Conference on Neural Networks, Perth, WA, Australia, 27 November–1 December 1995; IEEE: Piscataway, NJ, USA, 1995; Volume 11, pp. 111–117. [Google Scholar]
  44. Modarresi, J.; Gholipour, E.; Khodabakhshian, A. A comprehensive review of the voltage stability indices. Renew. Sustain. Energy Rev. 2016, 63, 1–12. [Google Scholar] [CrossRef]
  45. Selim, A.; Kamel, S.; Jurado, F. Efficient optimization technique for multiple DG allocation in distribution networks. Appl. Soft Comput. 2020, 86, 105938. [Google Scholar] [CrossRef]
  46. Murty, V.V.V.S.N.; Kumar, A. Optimal DG integration and network reconfiguration in microgrid system with realistic time varying load model using hybrid optimisation. IET Smart Grid 2019, 2, 192–202. [Google Scholar] [CrossRef]
  47. Truong, K.H.; Nallagownden, P.; Baharudin, Z.; Vo, D.N. A Quasi-Oppositional-Chaotic Symbiotic Organisms Search algorithm for global optimization problems. Appl. Soft Comput. 2019, 77, 567–583. [Google Scholar] [CrossRef]
  48. Sambaiah, K.S.; Jayabarathi, T. Optimal allocation of renewable distributed generation and capacitor banks in distribution systems using salp swarm algorithm. Int. J. Renew. Energy Res. 2019, 9, 96–107. [Google Scholar]
  49. El-Ela, A.A.A.; El-Sehiemy, R.A.; Abbas, A.S. Optimal Placement and Sizing of Distributed Generation and Capacitor Banks in Distribution Systems Using Water Cycle Algorithm. IEEE Syst. J. 2018, 12, 3629–3636. [Google Scholar] [CrossRef]
  50. Daneshvar, M.; Babaei, E. Exchange Market Algorithm for Multiple DG Placement and Sizing in a Radial Distribution System. J. Energy Manag. Technol. 2018, 2, 54–65. [Google Scholar]
  51. Meena, N.K.; Swarnkar, A.; Gupta, N.; Niazi, K.R. Multi-objective Taguchi approach for optimal DG integration in distribution systems. IET Gener. Transm. Distrib. 2017, 11, 2418–2428. [Google Scholar] [CrossRef]
  52. Sanjay, R.; Jayabarathi, T.; Raghunathan, T.; Ramesh, V.; Mithulananthan, N. Optimal Allocation of Distributed Generation Using Hybrid Grey Wolf Optimizer. IEEE Access 2017, 5, 14807–14818. [Google Scholar] [CrossRef]
  53. ChithraDevi, S.; Lakshminarasimman, L.; Balamurugan, R. Stud Krill herd Algorithm for multiple DG placement and sizing in a radial distribution system. Eng. Sci. Technol. Int. J. 2017, 20, 748–759. [Google Scholar] [CrossRef] [Green Version]
  54. Kansal, S.; Kumar, V.; Tyagi, B. Hybrid approach for optimal placement of multiple DGs of multiple types in distribution networks. Int. J. Electr. Power Energy Syst. 2016, 75, 226–235. [Google Scholar] [CrossRef]
  55. Elfergany, A.A. Optimal allocation of multi-type distributed generators using backtracking search optimization algorithm. Int. J. Electr. Power Energy Syst. 2015, 64, 1197–1205. [Google Scholar] [CrossRef]
  56. Kefayat, M.; Ara, A.L.; Niaki, S.N. A hybrid of ant colony optimization and artificial bee colony algorithm for probabilistic optimal placement and sizing of distributed energy resources. Energy Convers. Manag. 2015, 92, 149–161. [Google Scholar] [CrossRef]
  57. Injeti, S.K.; Kumar, N.P. A novel approach to identify optimal access point and capacity of multiple DGs in a small, medium and large scale radial distribution systems. Int. J. Electr. Power Energy Syst. 2013, 45, 142–151. [Google Scholar] [CrossRef]
  58. Rao, R.S.; Ravindra, K.; Satish, K.; Narasimham, S.V.L. Power Loss Minimization in Distribution System Using Network Reconfiguration in the Presence of Distributed Generation. IEEE Trans. Power Syst. 2013, 28, 317–325. [Google Scholar] [CrossRef]
  59. Hung, D.Q.; Mithulananthan, N. Multiple Distributed Generator Placement in Primary Distribution Networks for Loss Reduction. IEEE Trans. Ind. Electron. 2011, 60, 1700–1708. [Google Scholar] [CrossRef]
  60. Moradi, M.; Abedini, M. A combination of genetic algorithm and particle swarm optimization for optimal DG location and sizing in distribution systems. Int. J. Electr. Power Energy Syst. 2012, 34, 66–74. [Google Scholar] [CrossRef]
  61. Suganthan, P. Particle swarm optimiser with neighbourhood operator. In Proceedings of the 1999 Congress on Evolutionary Computation, Washington, DC, USA, 6–9 July 1999; CEC 1999: Washington, DC, USA, 1999; Volume 3, pp. 1958–1962. [Google Scholar]
Figure 1. Penalty functions for (a) voltage magnitudes, (b) thermal limits, and (c) distributed generator (DG) sizes.
Energies 13 06185 g001
Figure 2. Single line diagram representation of balanced radial distribution system
Energies 13 06185 g002
Figure 3. Generation of DG integration nodes using a VSI based method—Algorithm 1.
Energies 13 06185 g003
Figure 4. The complete flow chart of the MLPSO algorithm.
Energies 13 06185 g004
Figure 5. The single line diagram of the standard IEEE 33 bus system.
Energies 13 06185 g005
Figure 6. Variation of loss reduction with number of DGs for the IEEE 33 bus system.
Energies 13 06185 g006
Figure 7. Variation of (a) voltage with a single DG, (b) convergence characteristics with a single DG, (c) voltage with two DGs, (d) convergence characteristics with two DGs, (e) voltage with three DGs, (f) convergence characteristics with three DGs for IEEE 33 bus system.
Energies 13 06185 g007aEnergies 13 06185 g007b
Figure 8. Variation of (a) mean voltage improvement with the number of DGs and, (b) statistical parameters of PSO variants for the standard IEEE 33 bus system.
Energies 13 06185 g008
Figure 9. The single line diagram of the Malaysian 54 bus system.
Energies 13 06185 g009
Figure 10. Variation of loss reduction with number of DGs for the Malaysian test system.
Energies 13 06185 g010
Figure 11. Variation of (a) voltage with a single DG, (b) convergence characteristics with a single DG, (c) voltage with two DGs, (d) convergence characteristics with two DGs, (e) voltage with three DGs, (f) convergence characteristics with three DGs for the Malaysian test system.
Energies 13 06185 g011aEnergies 13 06185 g011b
Figure 12. Variation of statistical parameters of PSO variants for the Malaysian bus system.
Energies 13 06185 g012
Figure 13. The (a) comparison of the average computational time for different number of particles ( s ) and (b) mean absolute error for different number of leaders ( L ) for the three DG scenario of IEEE 33 bus system.
Energies 13 06185 g013
Figure 14. The convergence of MLPSO algorithm for proposed and random particle initialization.
Energies 13 06185 g014
Table 1. Mapping the definitions of the problem.
VariableDefinition in Optimal SizingDefinition in MLPSO Algorithm
s Possible solutions of DG sizesNumber of particles in the swarm
U Number of DGsNumber of dimensions of the particle
B L Minimum DG capacityThe lower bound of the search space
B U Maximum DG capacityThe upper bound of the search space
R Number of DG optimization simulations Maximum number of optimization runs
I T E m a x Maximum number of iterations of an optimization simulation Maximum number of iterations per optimization run
r Incremental counter (index) for the number of runsIndex of the optimization run
i t e Incremental counter (index) for the number of iterationsIndex of the iteration of an optimization run
f The total power loss of the system with the integration of DGsThe objective function value of the optimization problem
f p The penalized total power loss of the system with the integration of DGsThe objective function value of the optimization problem with penalties
Table 2. Parameters of the MLPSO algorithm for the optimal placement and sizing.
ParameterValueParameterValue
Number of particles in the swarm ( s )40Number of leaders (L)6
Maximum number of runs ( R )10Cognitive coefficient ( C 1 )2
Maximum number of iterations ( I T E m a x )103Social coefficient ( C 2 )2
Upper bound of the inertia weight ( ω m a x )0.9Maximum allowable voltage ( V ¯ )1.05 p.u.
Lower bound of the inertia weight ( ω m i n )0.4Maximum allowable voltage ( V _ )0.95 p.u.
Table 3. Simulations results of optimal placement and sizing of DGs for PSO, CLPSO, and MLPSO algorithms—IEEE 33 bus system.
AlgorithmL1S1
(MW)
L2S2
(MW)
L3S2
(MW)
Active Power Loss
(kW)
Loss Reduction
(%)
Base------210.070-
PSO62.42----102.33051.27
110.96310.95--82.99560.49
291.08250.8591.0473.63064.94
CLPSO62.43----102.12551.40
301.10130.89--81.72061.10
110.93320.85241.0570.30066.54
MLPSO62.42----102.12051.40
301.15130.82--81.62061.15
140.76301.03241.0768.46067.40
Table 4. Variation of voltages in PSO, CLPSO, and MLPSO algorithms for three DG scenario—IEEE 33 bus system.
AlgorithmMinimum Voltage (p.u.) and NodeMaximum Voltage (p.u.) and NodeMean Voltage (p.u.)
PSO0.9613 at node 181 at node 10.9815
CLPSO0.9637 at node 181 at node 10.9816
MLPSO0.9699 at node 331 at node 10.9824
Table 5. Simulations results of optimal placement and sizing of DGs for PSO, and MLPSO algorithms—Malaysian 54 bus system.
AlgorithmL1S1
(MW)
L2S2
(MW)
L3S2
(MW)
Active Power Loss (kW)Loss Reduction
(%)
Base------338.46-
PSO144.075----93.88672.25
172.138431.885--75.00077.84
152.330251.010431.32968.92279.63
MLPSO144.074----93.79272.28
162.324431.487--73.19178.37
162.182310.562441.34266.59980.32
Table 6. Variation of voltages in PSO, and MLPSO algorithms for three DG scenarios—Malaysian 54 bus system.
AlgorithmMinimum Voltage (p.u.) and NodeMaximum Voltage (p.u.) and NodeMean Voltage (p.u.)
PSO0.9677 at node 221 at node 10.9814
MLPSO0.9707 at node 221 at node 10.9828
Table 7. Comparison of results of the standard IEEE 33 bus system.
AlgorithmRefYearDG Sizes (kW)DG LocationsReduction of Power Loss (%)Minimum Voltage (p.u.)
The proposed algorithm760, 1030, 107014, 30, 2467.400.9699
CSCA[45]2020871, 1091.47, 954.0813, 24, 3064.500.9690
CLPSO [37]2020930, 850, 105011, 32, 2466.540.9816
GSA-GAMS[46]2019801.22, 1091.31, 1053.5913, 24, 3065.640.9686
ASFLA[30]2019545.7, 993.6, 1209.424, 29, 1267.000.9781
SFLA[30]2019563.9, 318.2, 514.428, 30, 1458.860.9770
FWA[30]2019589.7, 189.5, 1014.614, 18, 3256.240.9680
QOCSOS[47]2019801.7, 1091.3, 1053.613, 24, 3065.50NA
SSA[48]2019753.6, 1100.4, 1070.613, 23, 2965.970.9686
WCA[49]2018854.6, 1101.7, 118114, 24, 2966.170.9730
EMA[50]2018976.6, 1169.09, 943.5430, 24, 1264.320.9684
TM[51]2017719.9, 719.9, 1439.715, 26, 3349.520.9960
MOTA[51]2017980, 960, 1340 7, 14, 3052.400.9986
HPSO[36]2017560, 560, 790 8, 13, 3160.260.9660
HGWO[52]2017802, 1090, 105413, 24, 3065.34NA
KHA[53]2017814.9, 750.1, 1142.4024, 14, 3065.260.9701
SKHA[53]2017801.81, 1091.3, 1053.613, 24, 3065.500.9687
PSO-Analytical[54] 2016790, 1070, 101013, 24, 3065.45NA
BA[28]2016816.3, 952.35, 952.3515, 25, 3064.420.9800
IWO[27]2016624.7, 104.9, 105614, 18, 3257.470.9716
BSOA[55]2015632, 487, 55013, 28, 3157.590.9554
ACO-ABC[56]2015754.7, 1099.9, 1071.414, 24, 3066.00NA
BFOA[32]2014652.1, 198.4, 1067.214, 18, 3257.380.9705
SA[57]20131112.4, 487.4, 867.9 6, 18, 3061.120.9676
HSA[58]2013572.4, 1070, 1046.217, 18, 3352.260.9670
LSF[59]2013720, 810, 90018, 33, 2559.72NA
IA[59]2013900, 900, 720 6, 12, 3161.62NA
ELF[59]2013900, 900, 90013, 30, 2464.83NA
GA-PSO[60]2012925, 863, 120011, 16, 3249.200.9670
Publisher’s Note: MDPI stays neutral with regard to jurisdictional claims in published maps and institutional affiliations.