Impact of Fan Airflow of IT Equipment on Thermal Environment and Energy Consumption of a Data Center


Abstract
:1. Introduction
2. Proposed Prediction Method
2.1. Overview of Airflow Performance
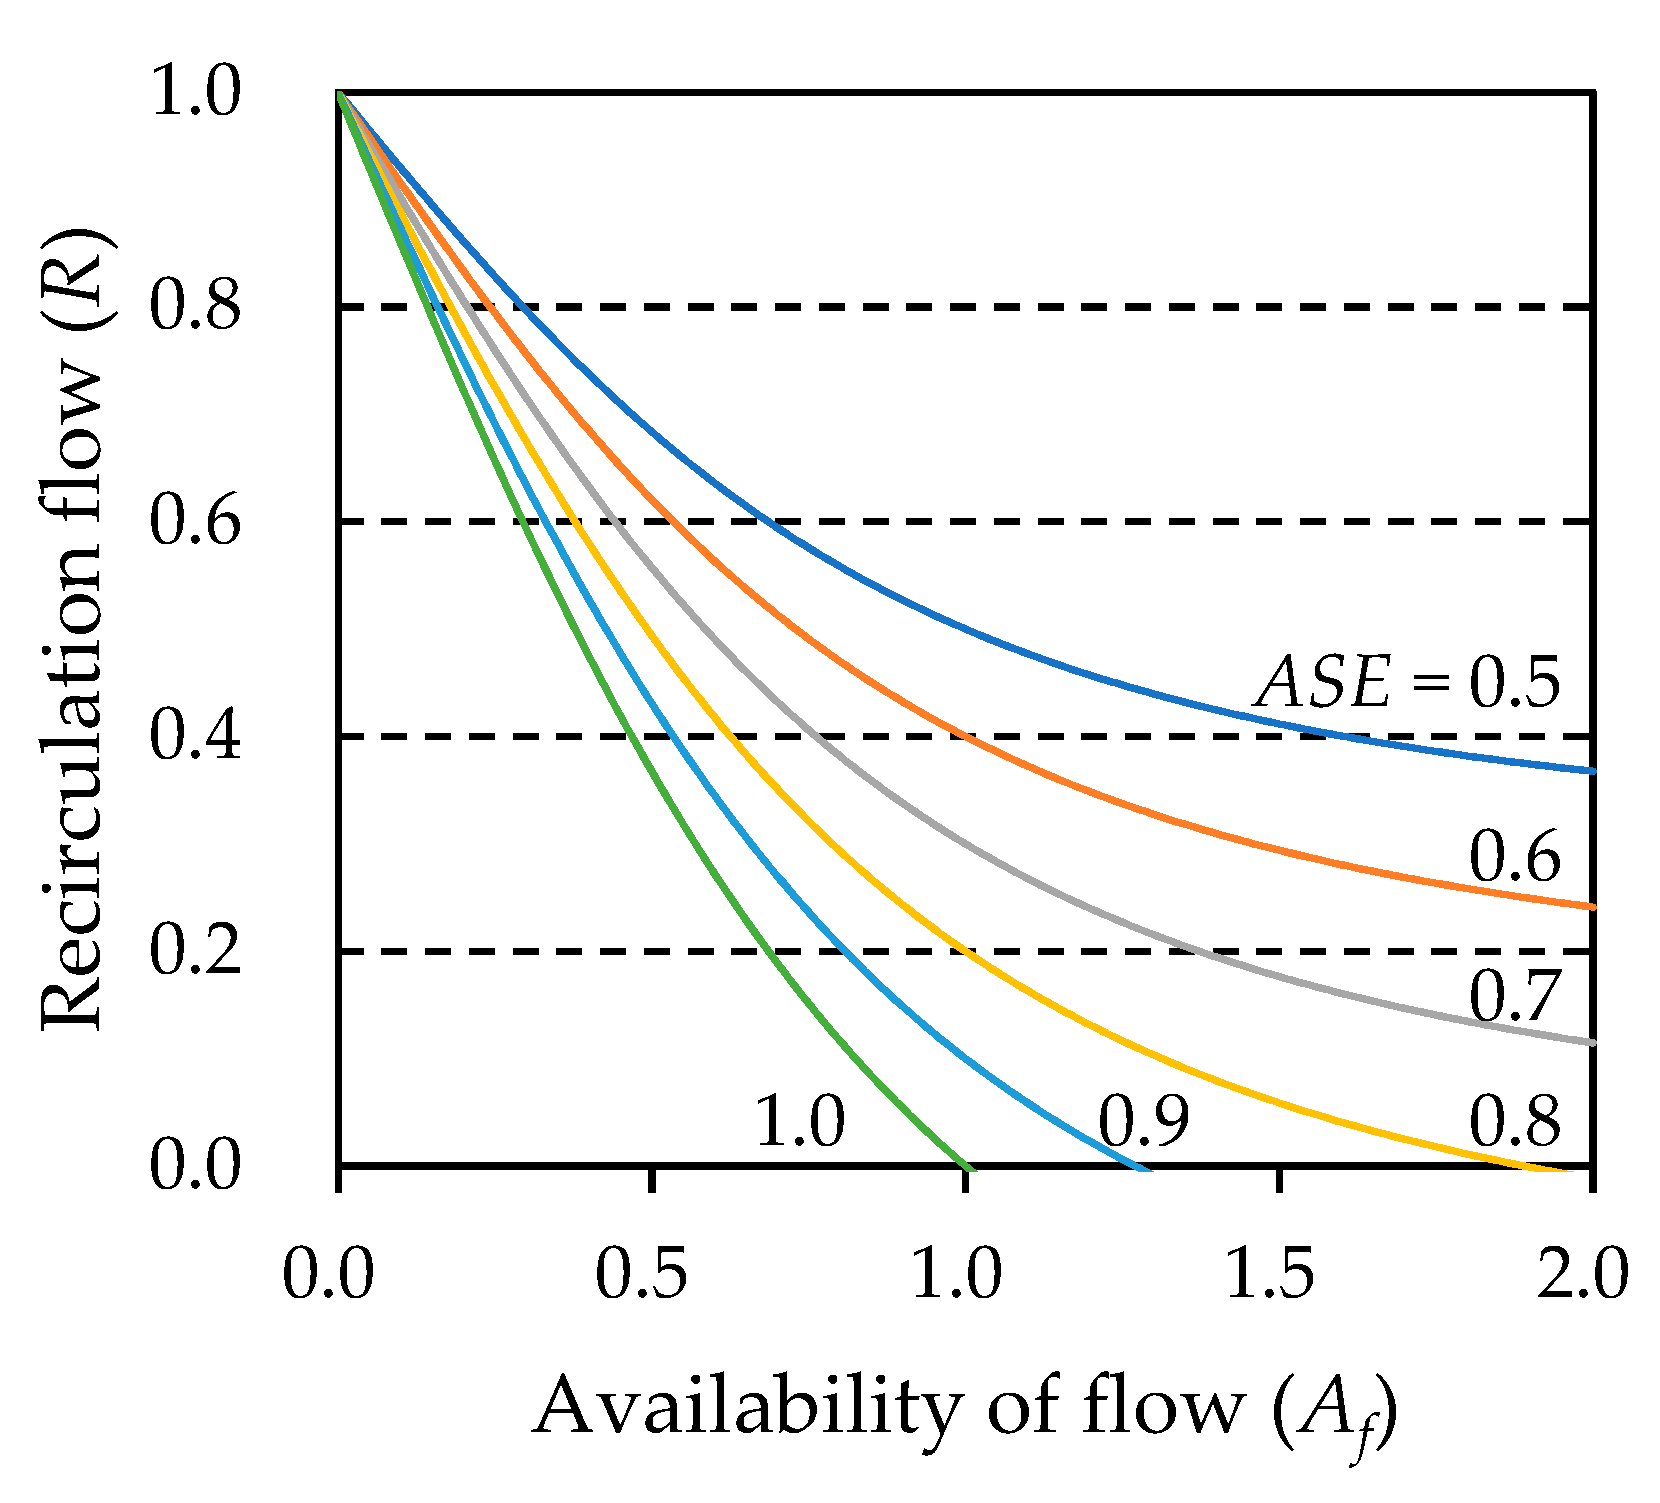
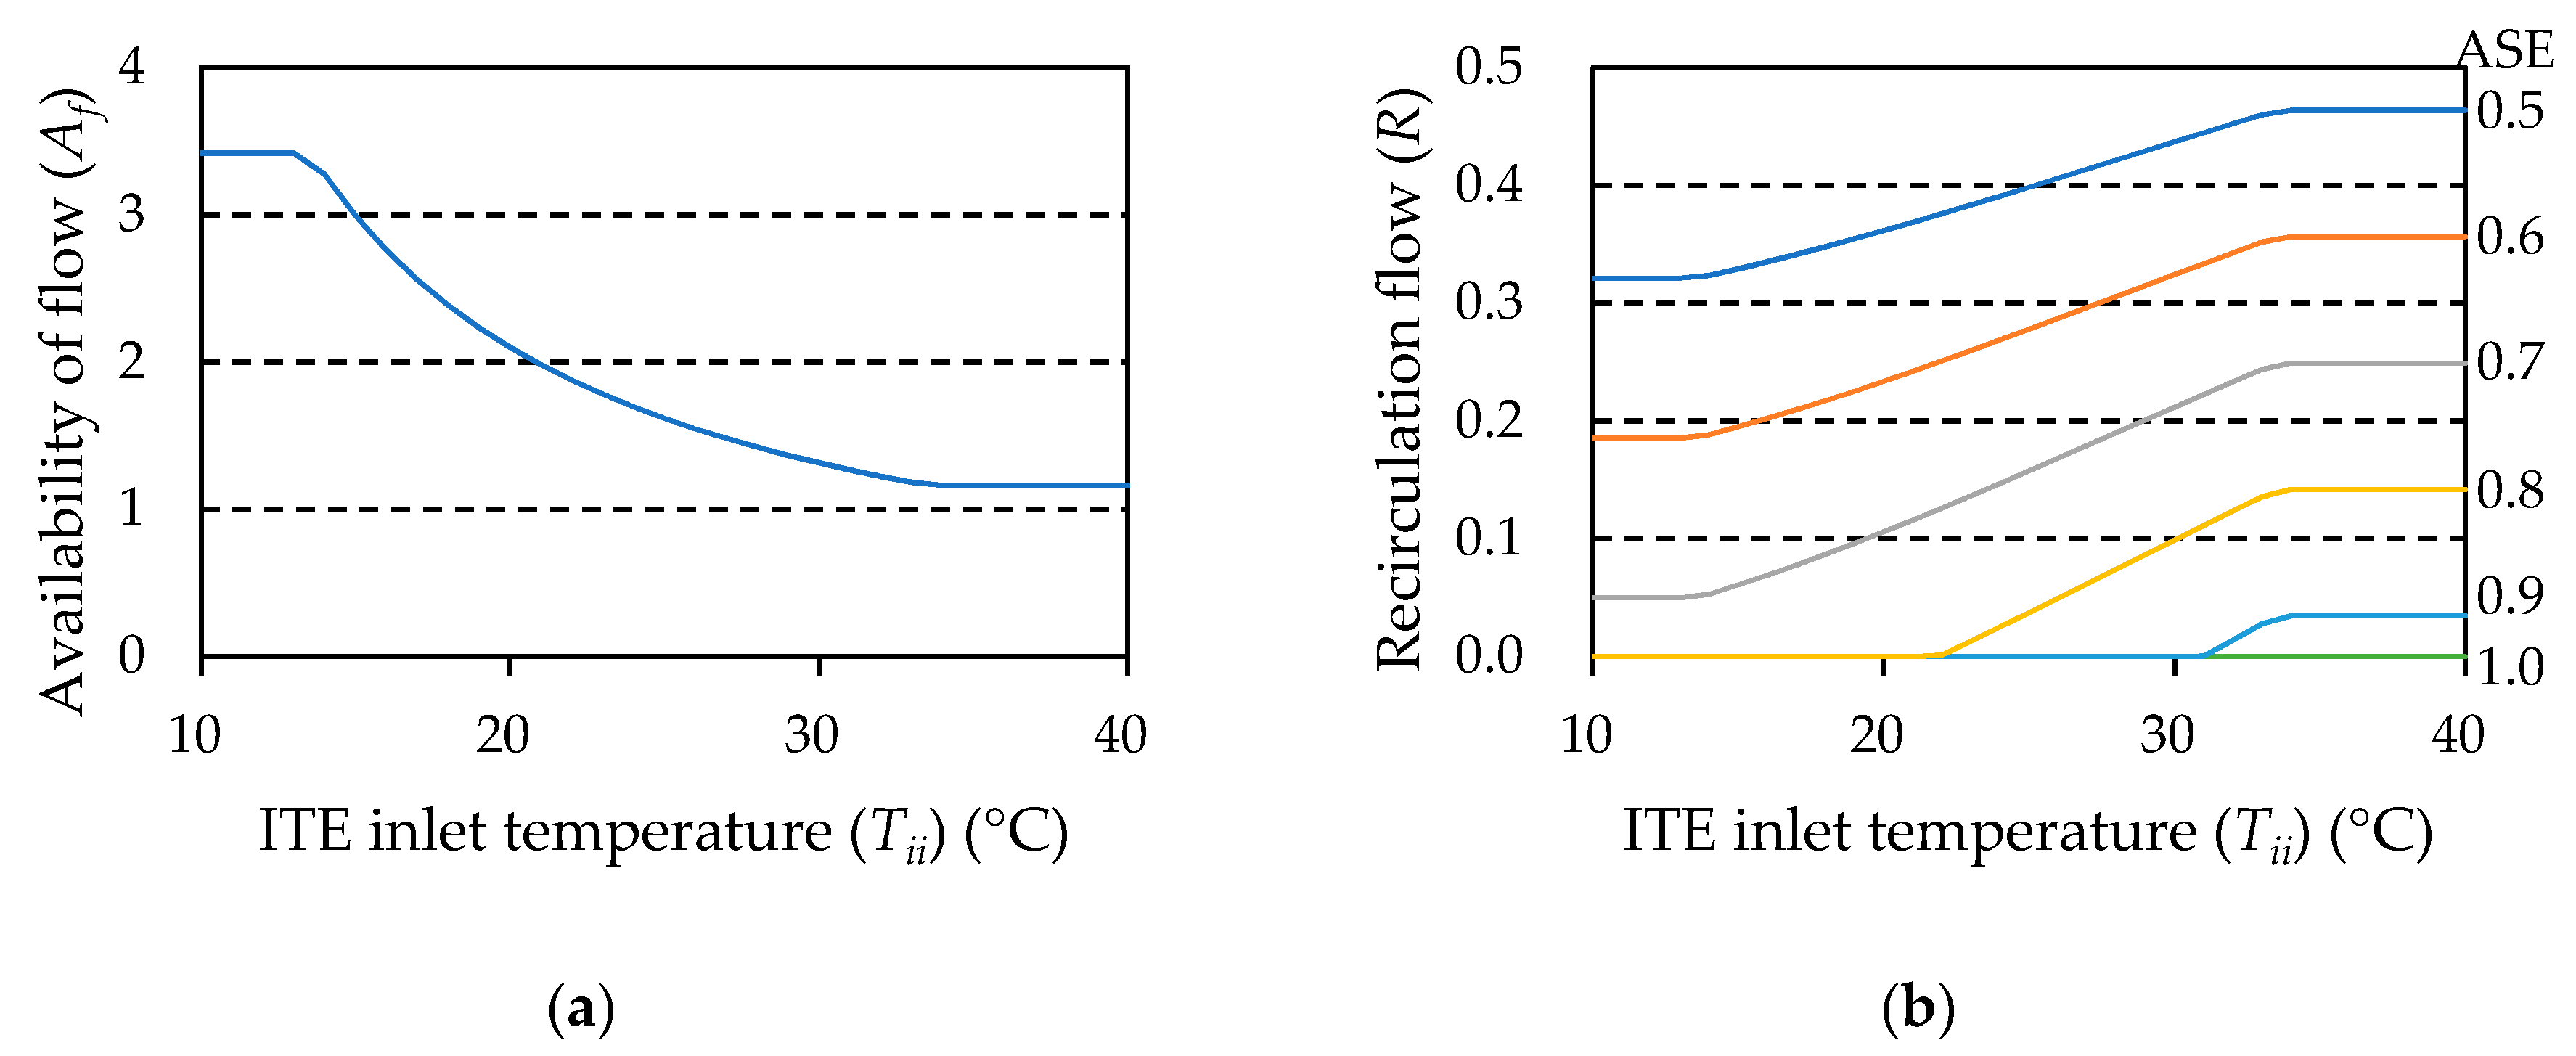
2.2. Method of Predicting R by Using ASE
2.3. Prediction Procedure
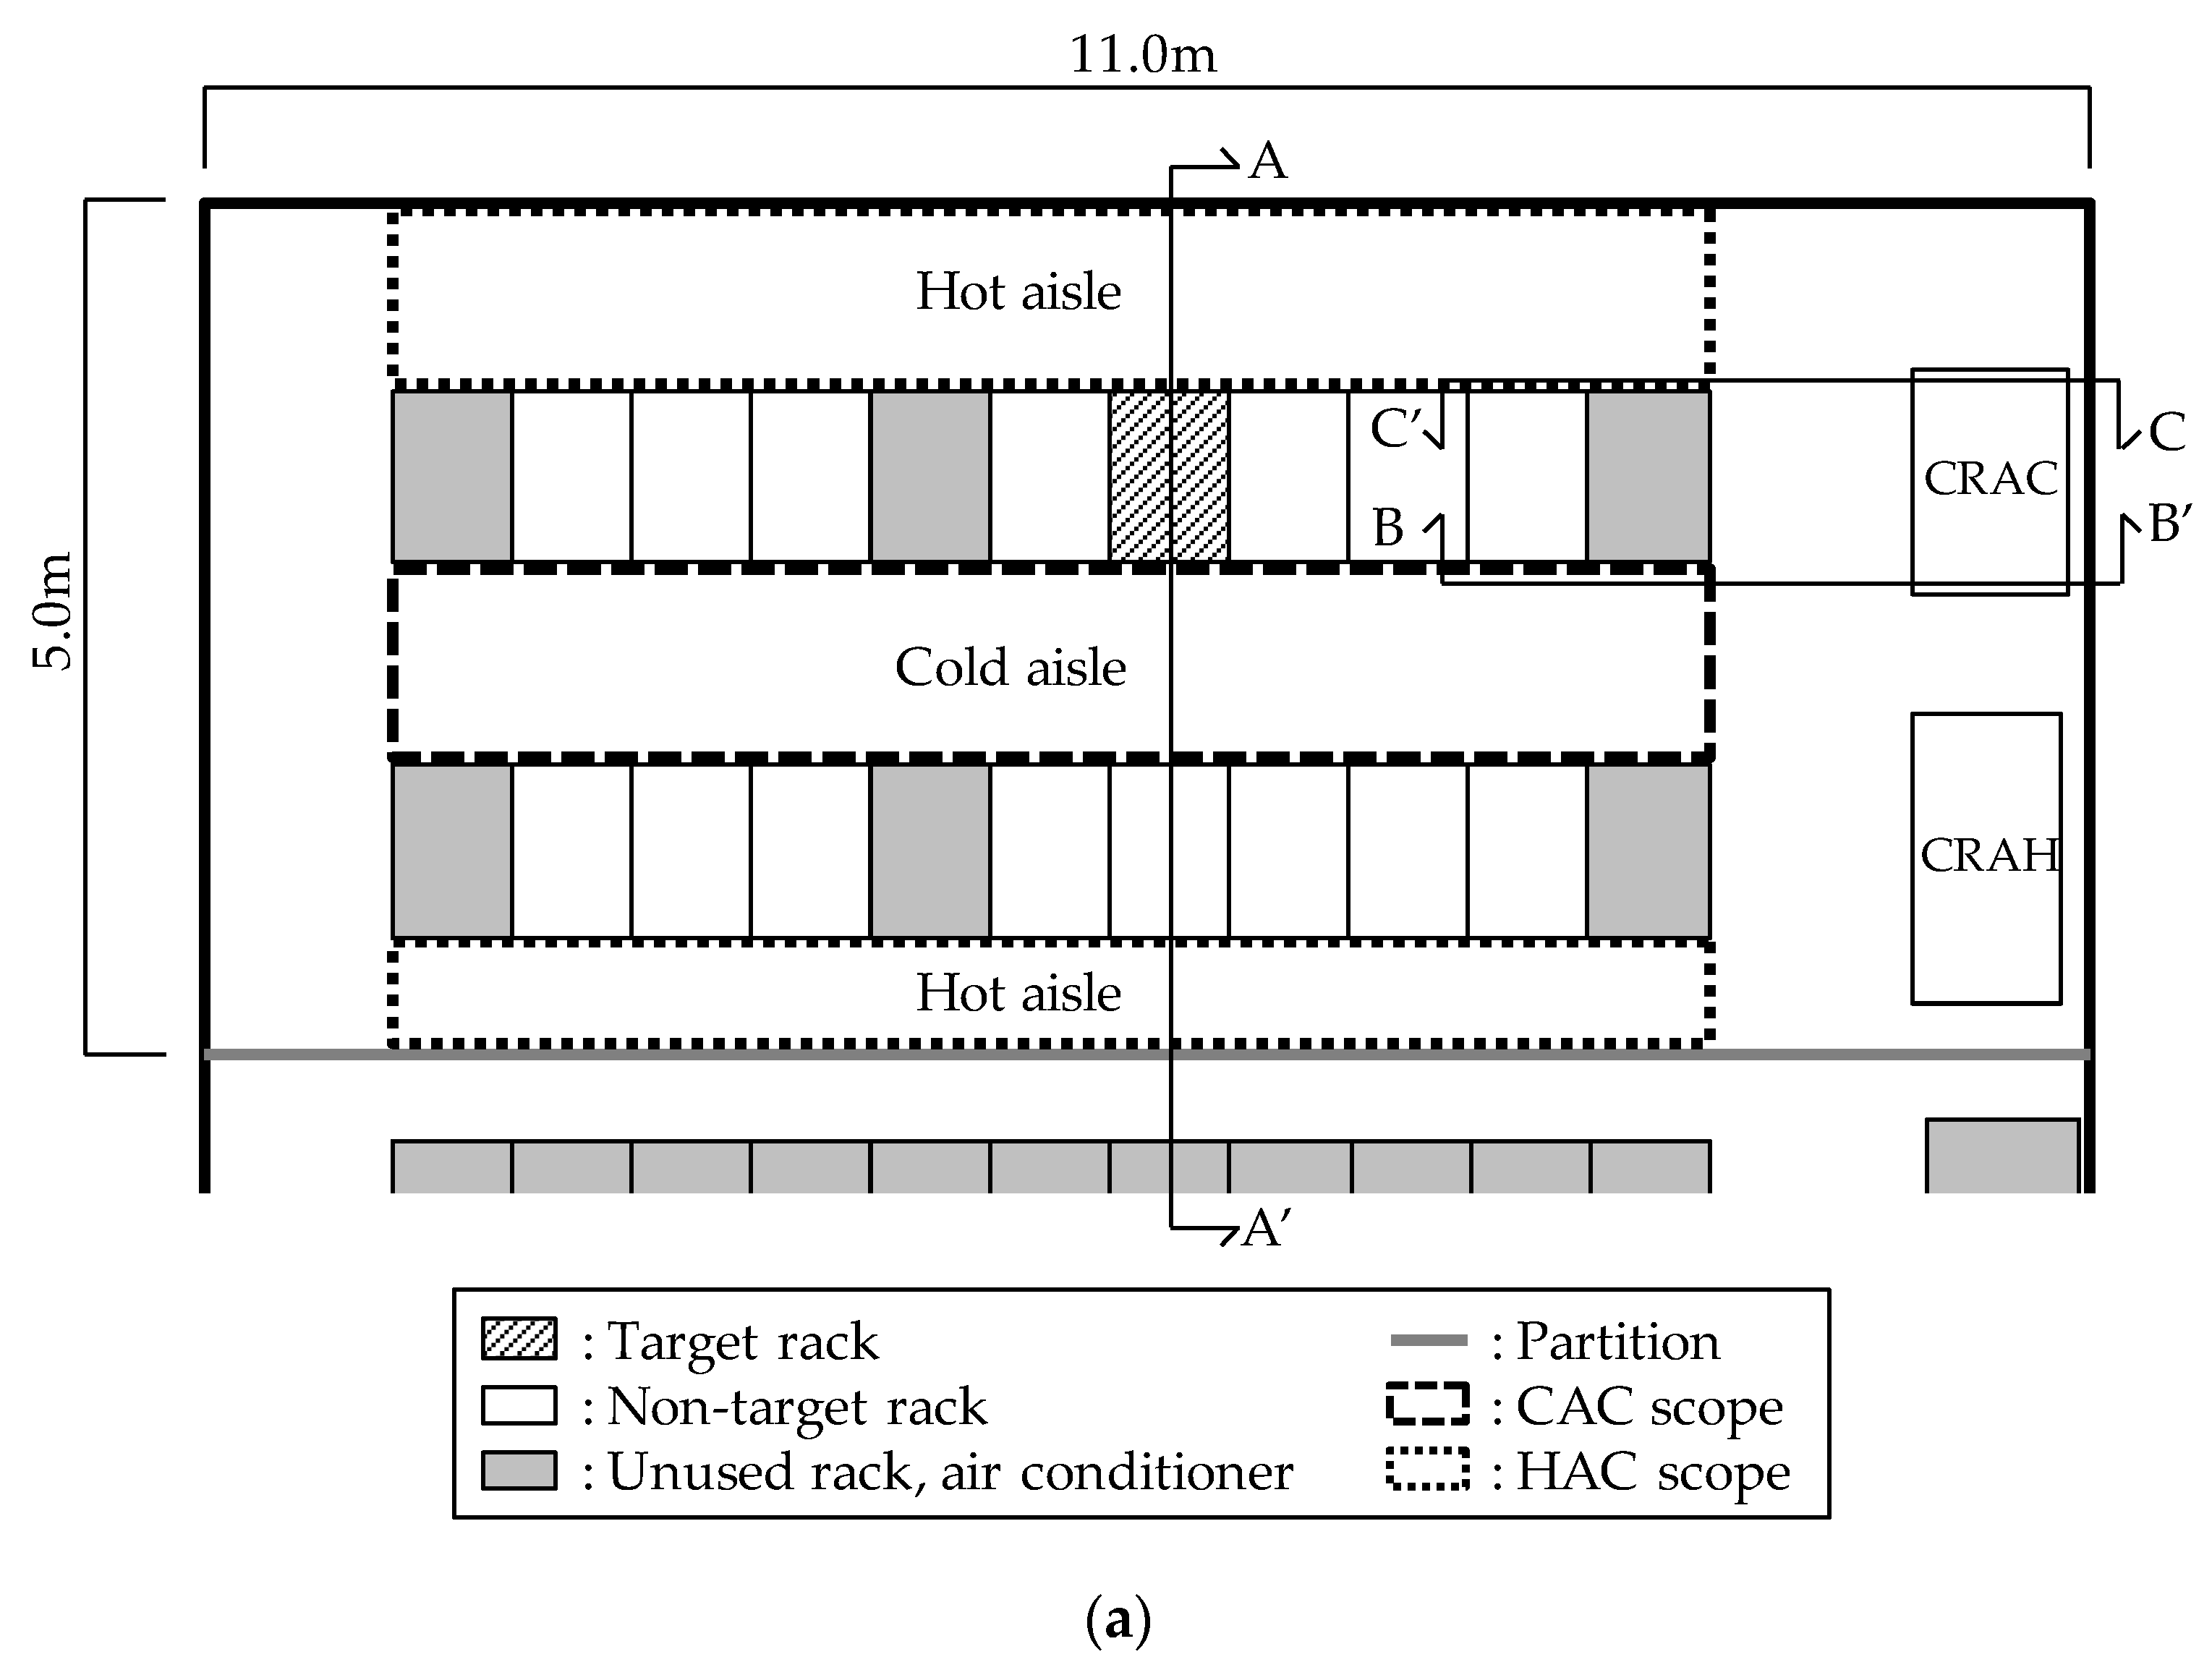
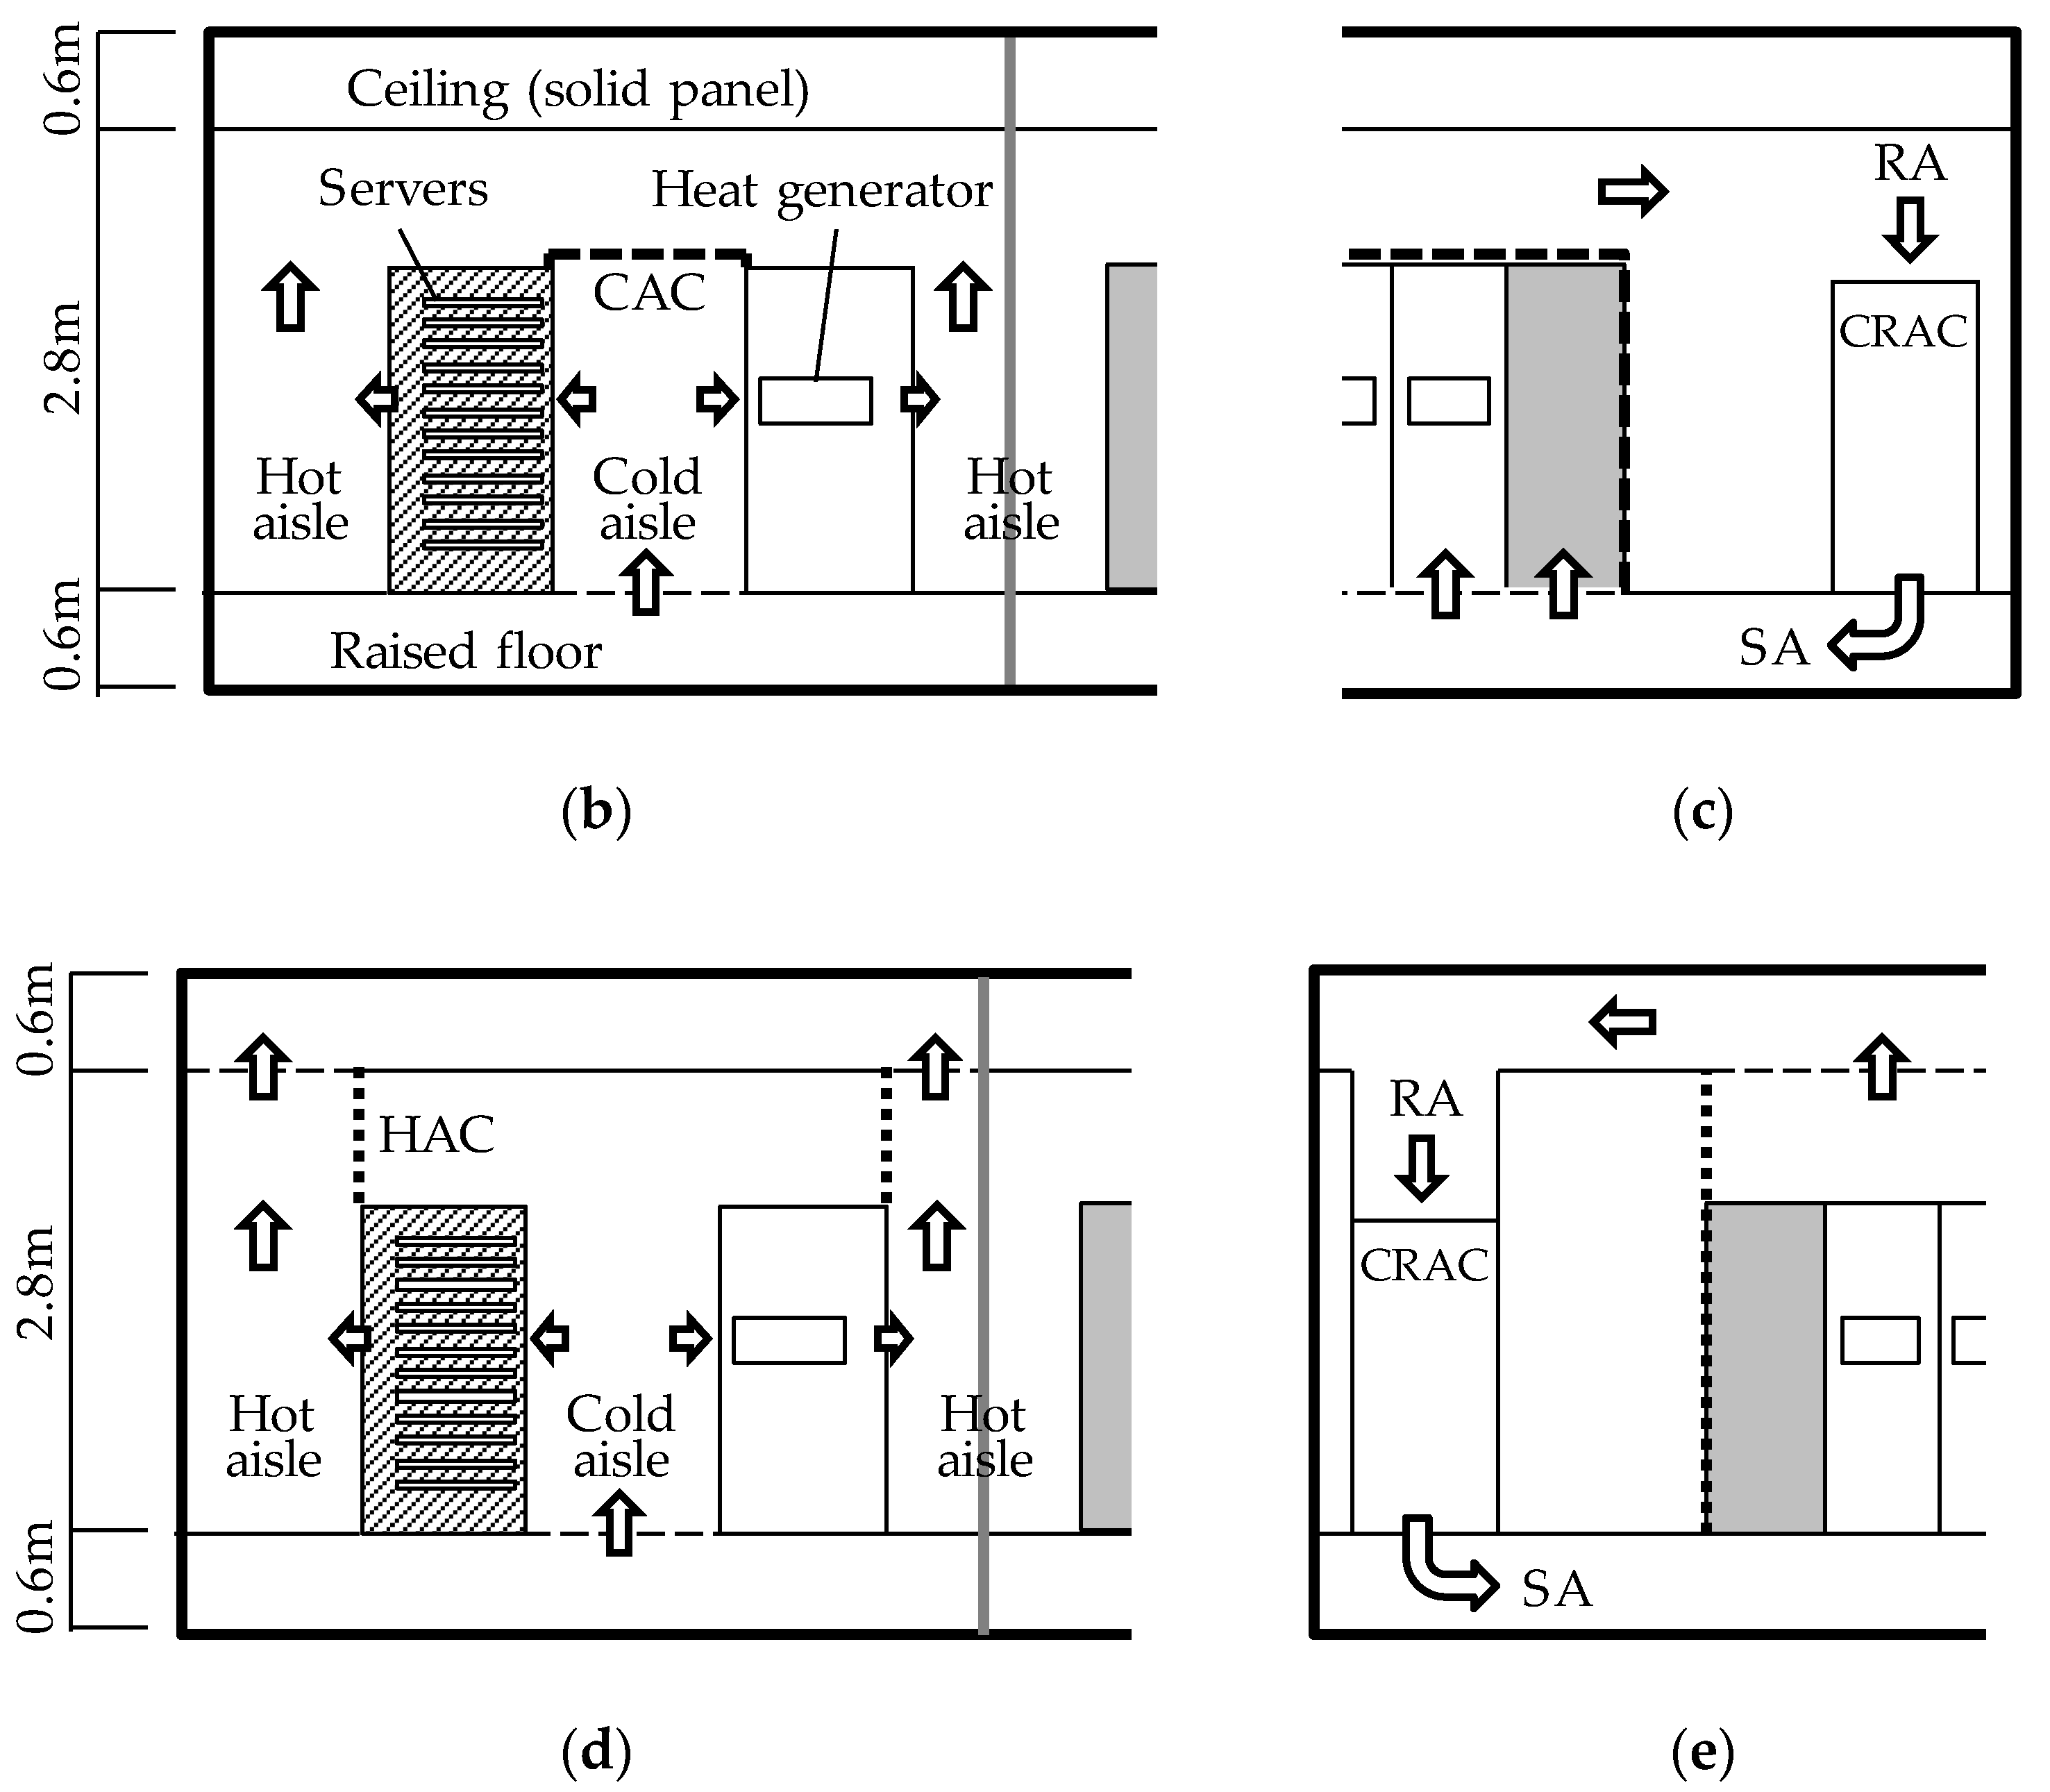
3. Overview of Experimental Verification Room
4. Understanding Characteristics of ITE
4.1. Experimental Conditions (Experiments A and B)
4.2. Results of Experiments A and B
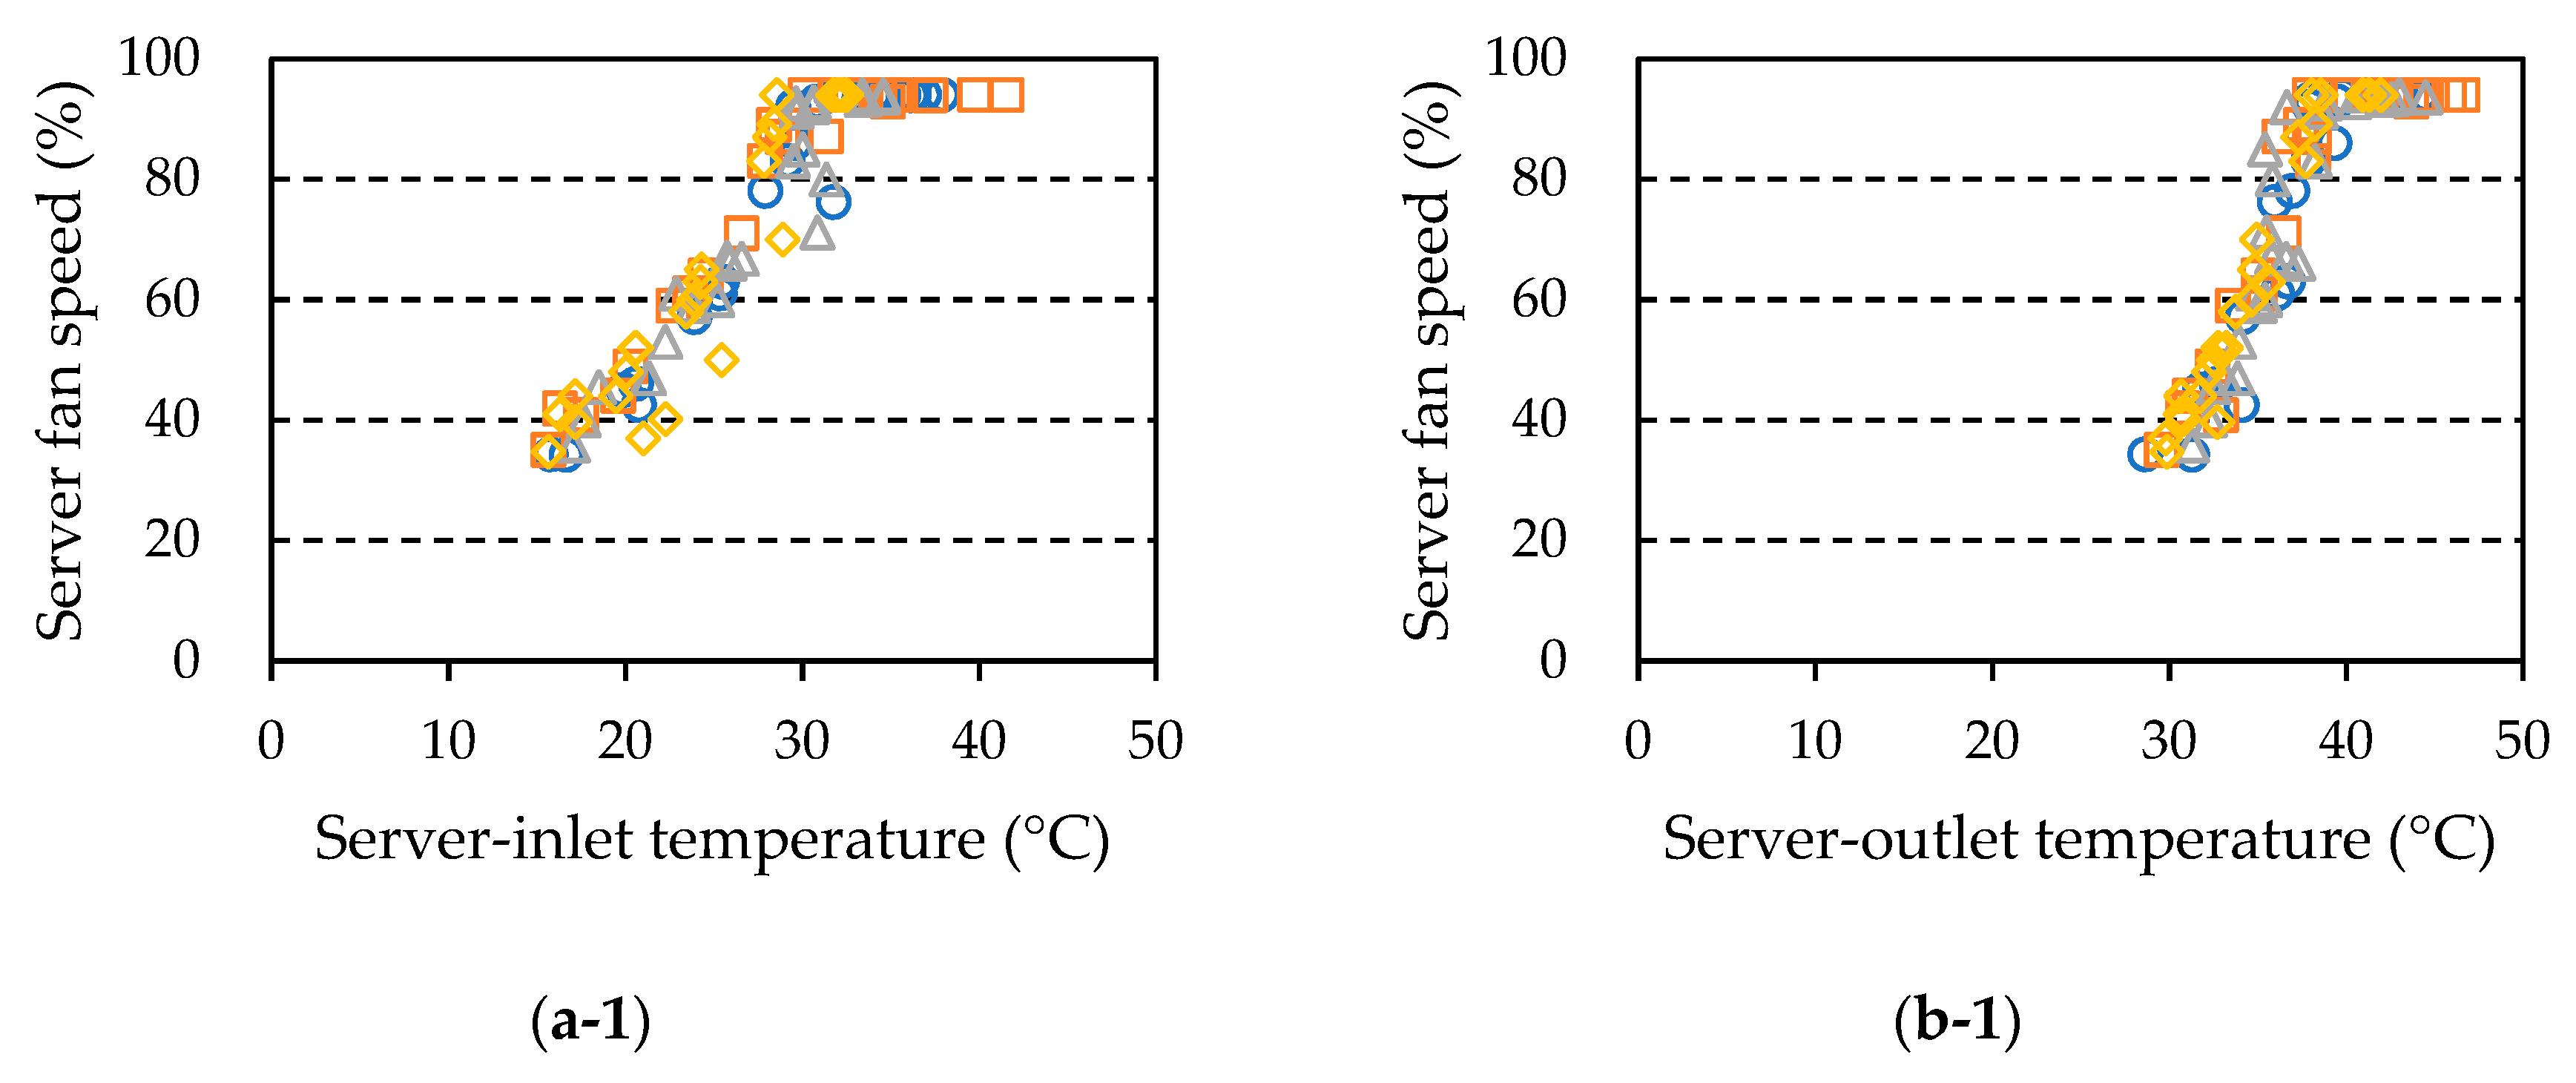
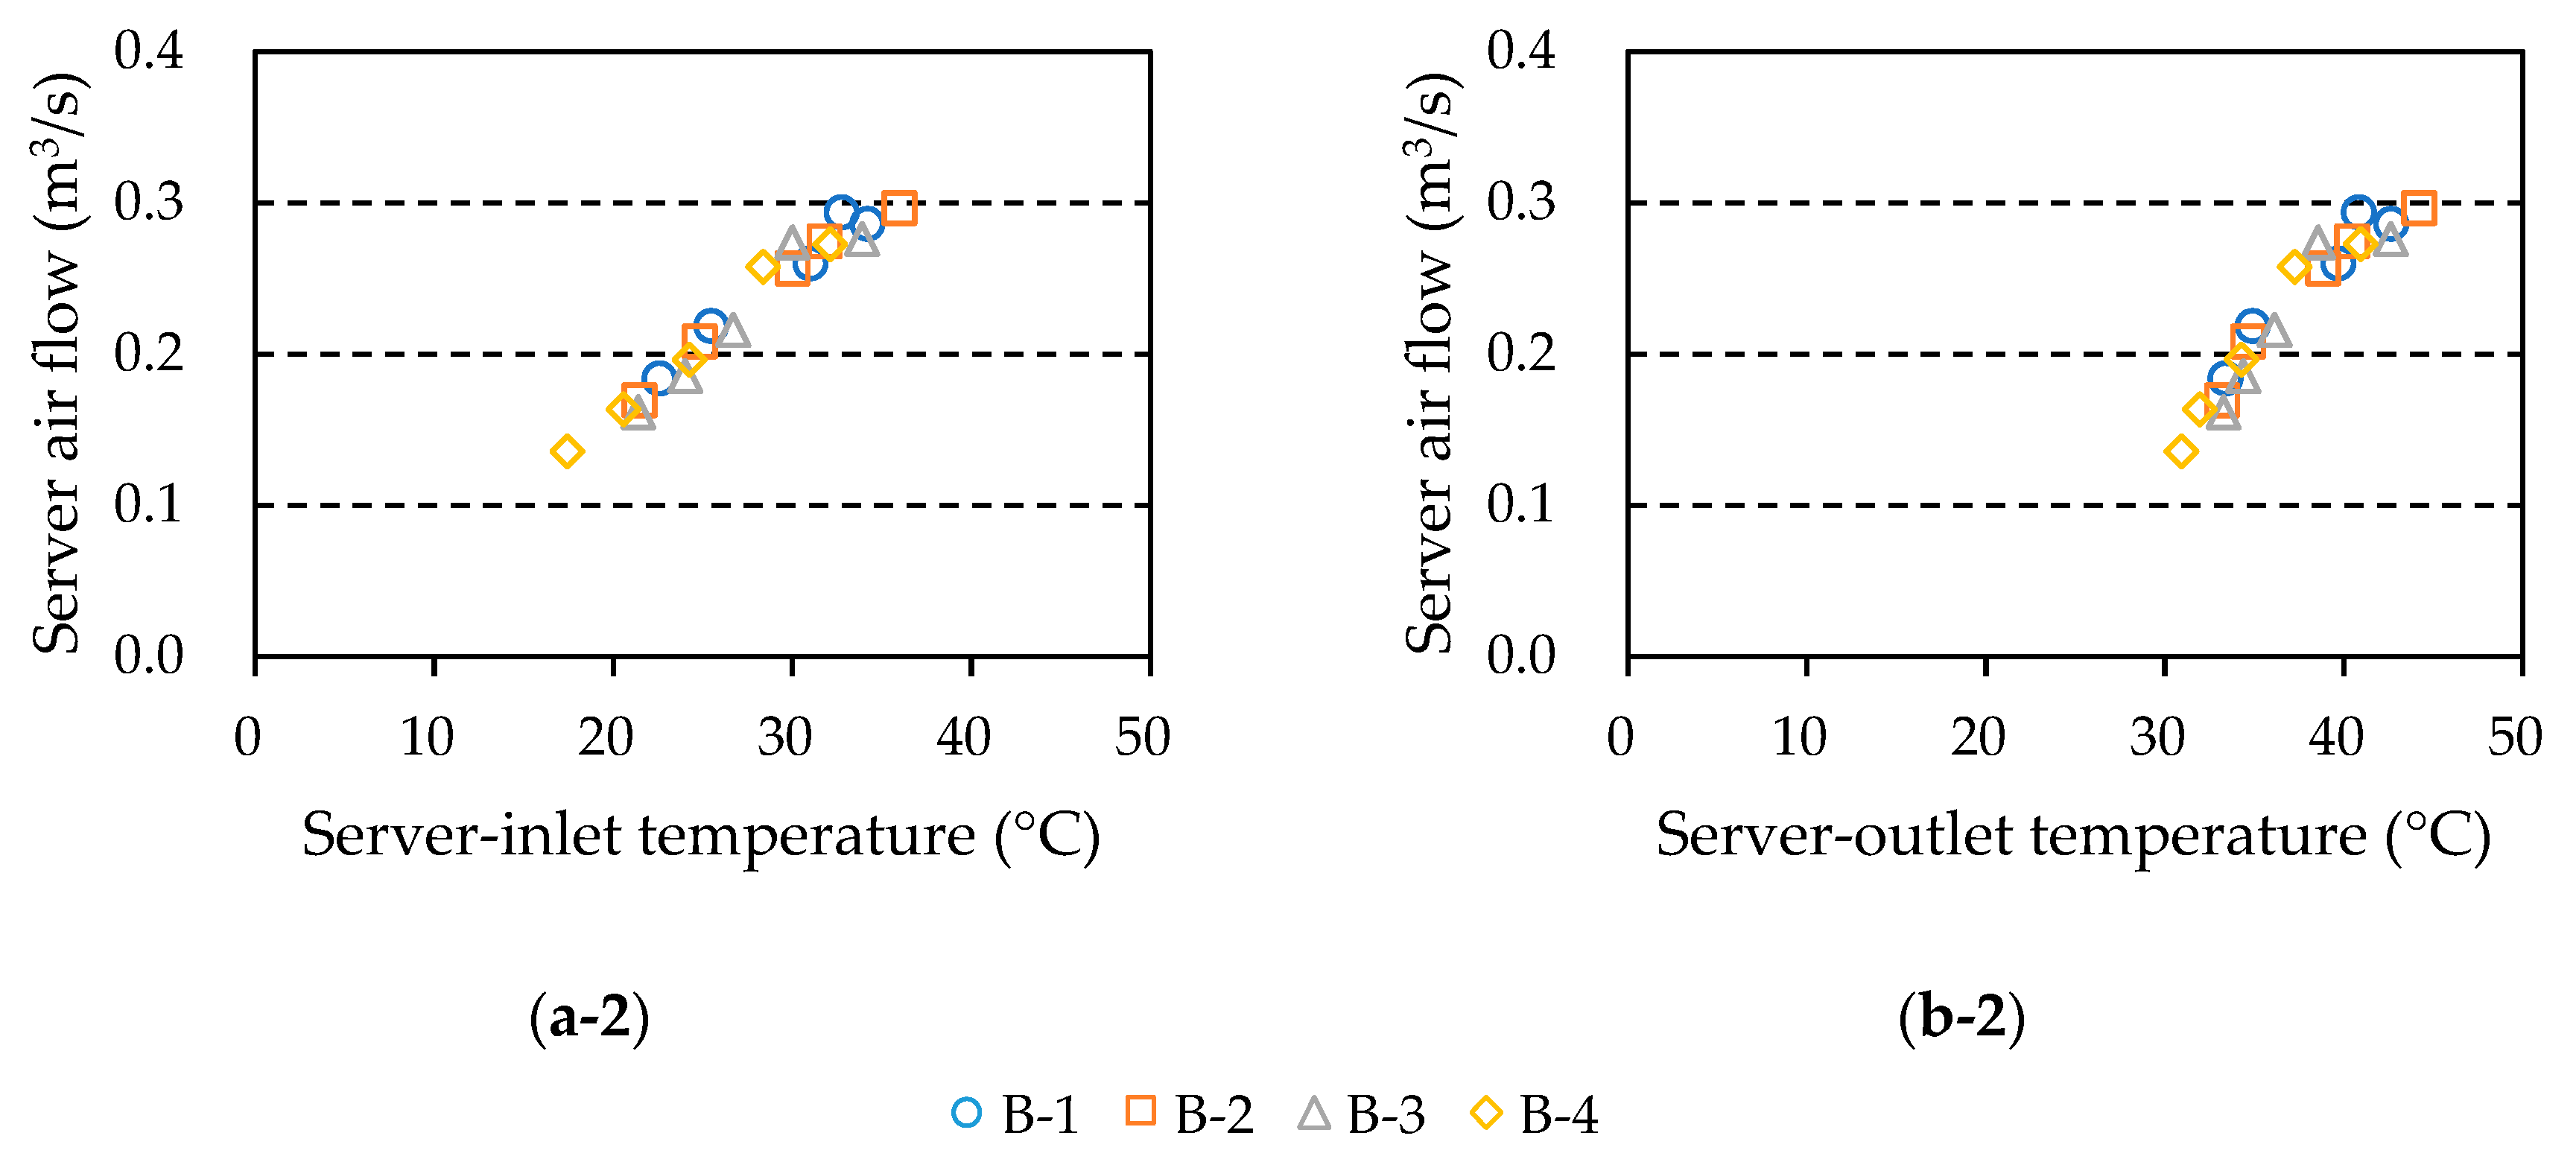
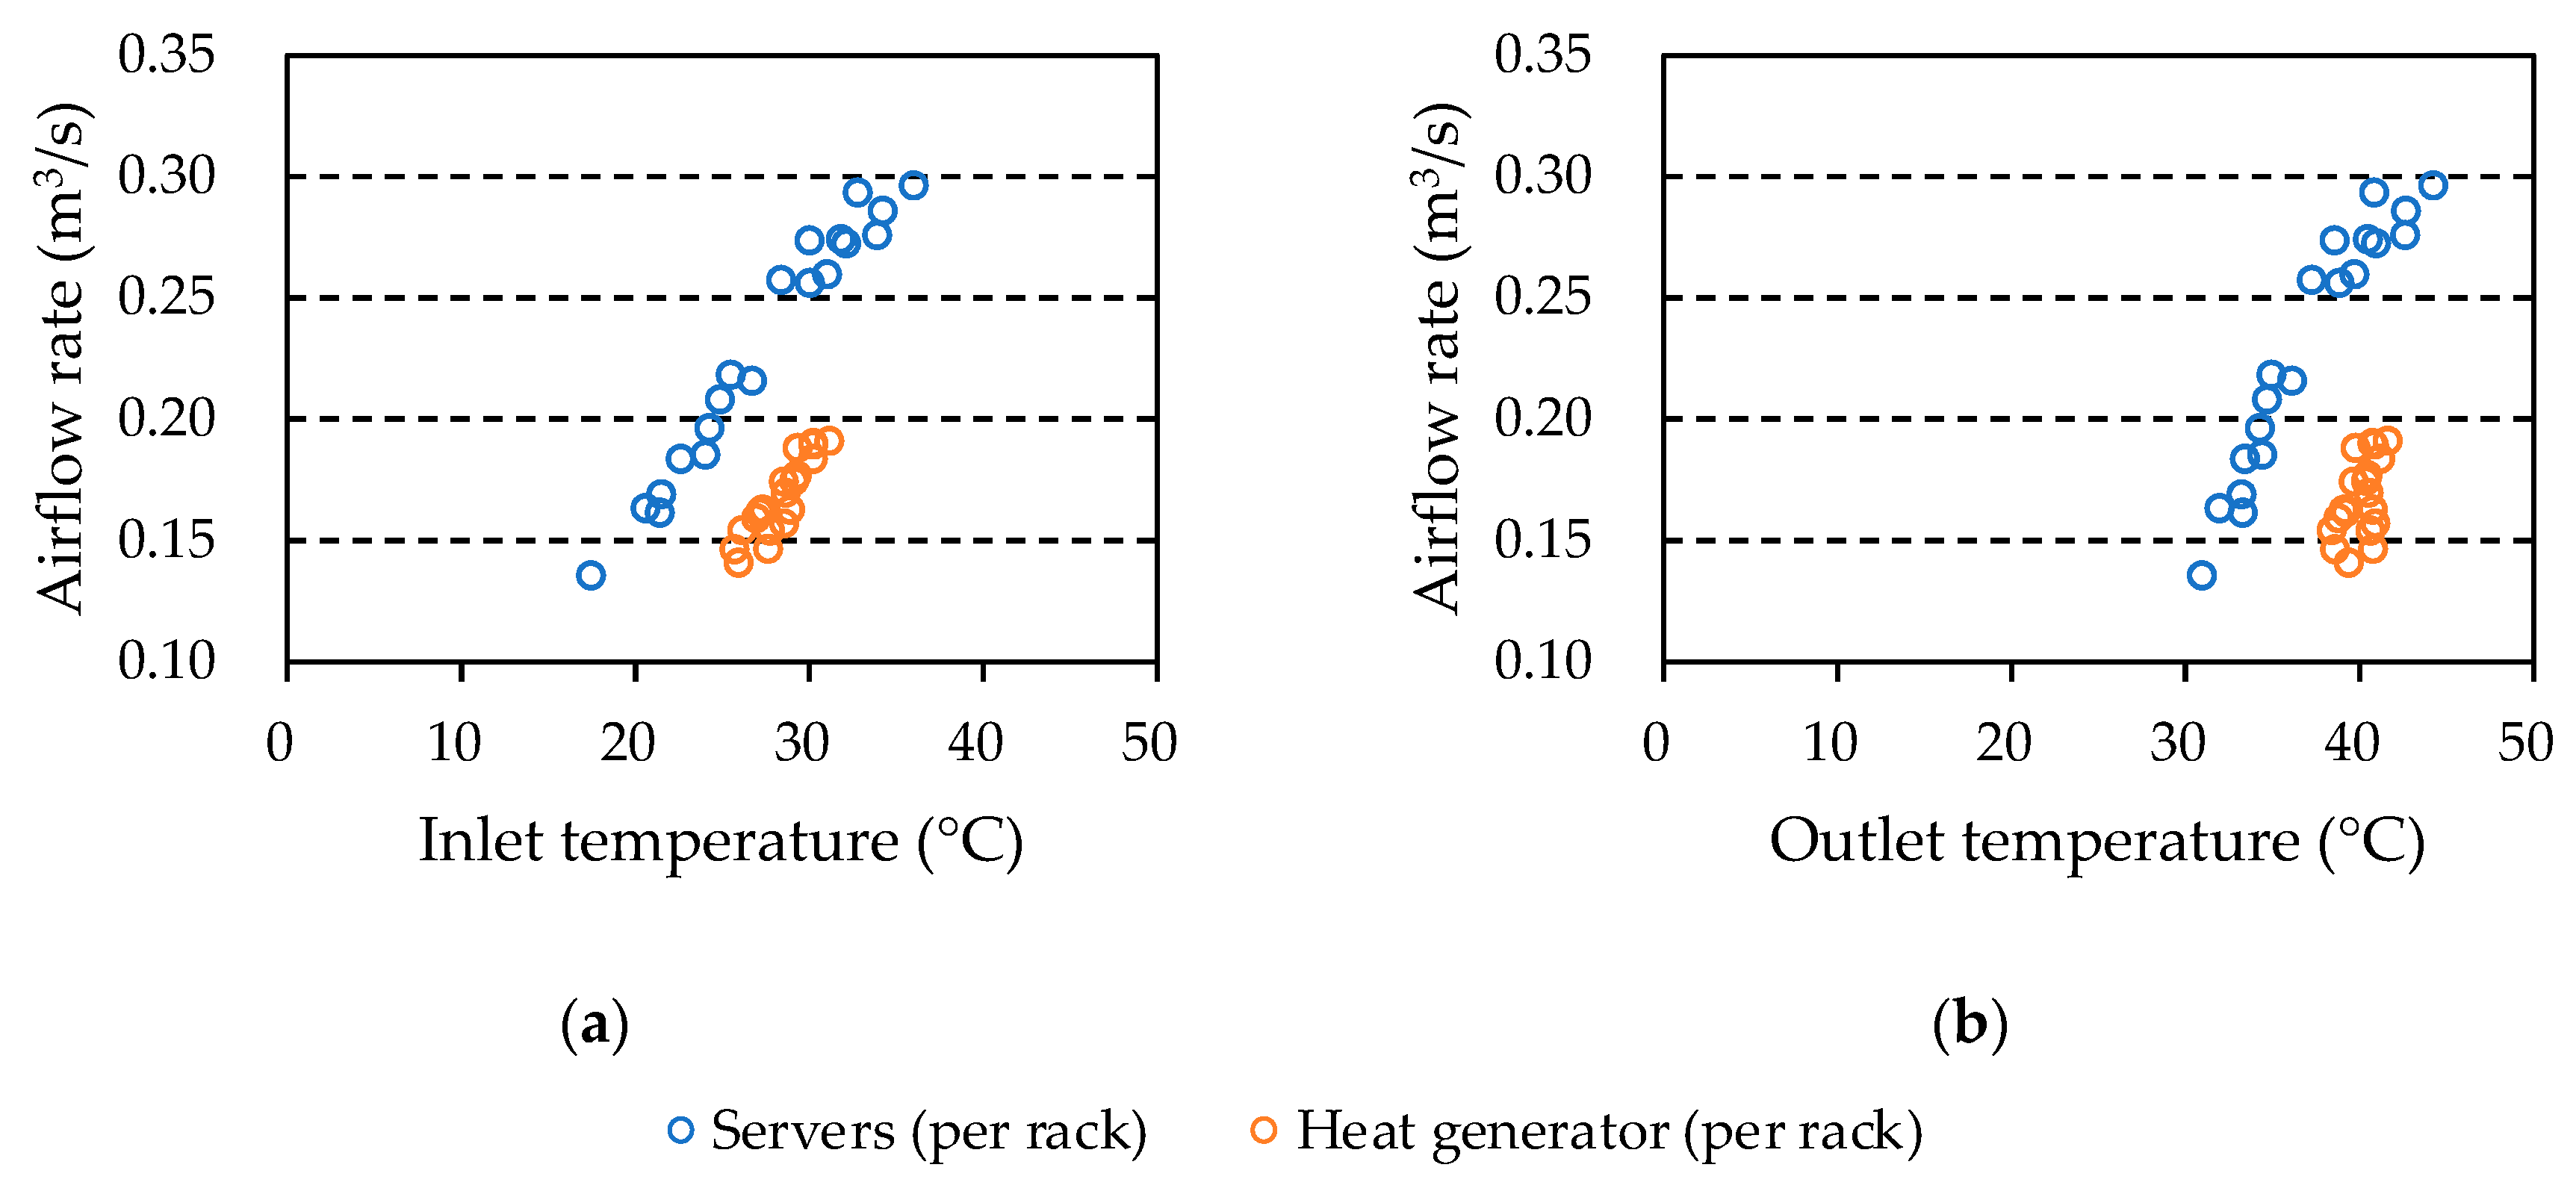
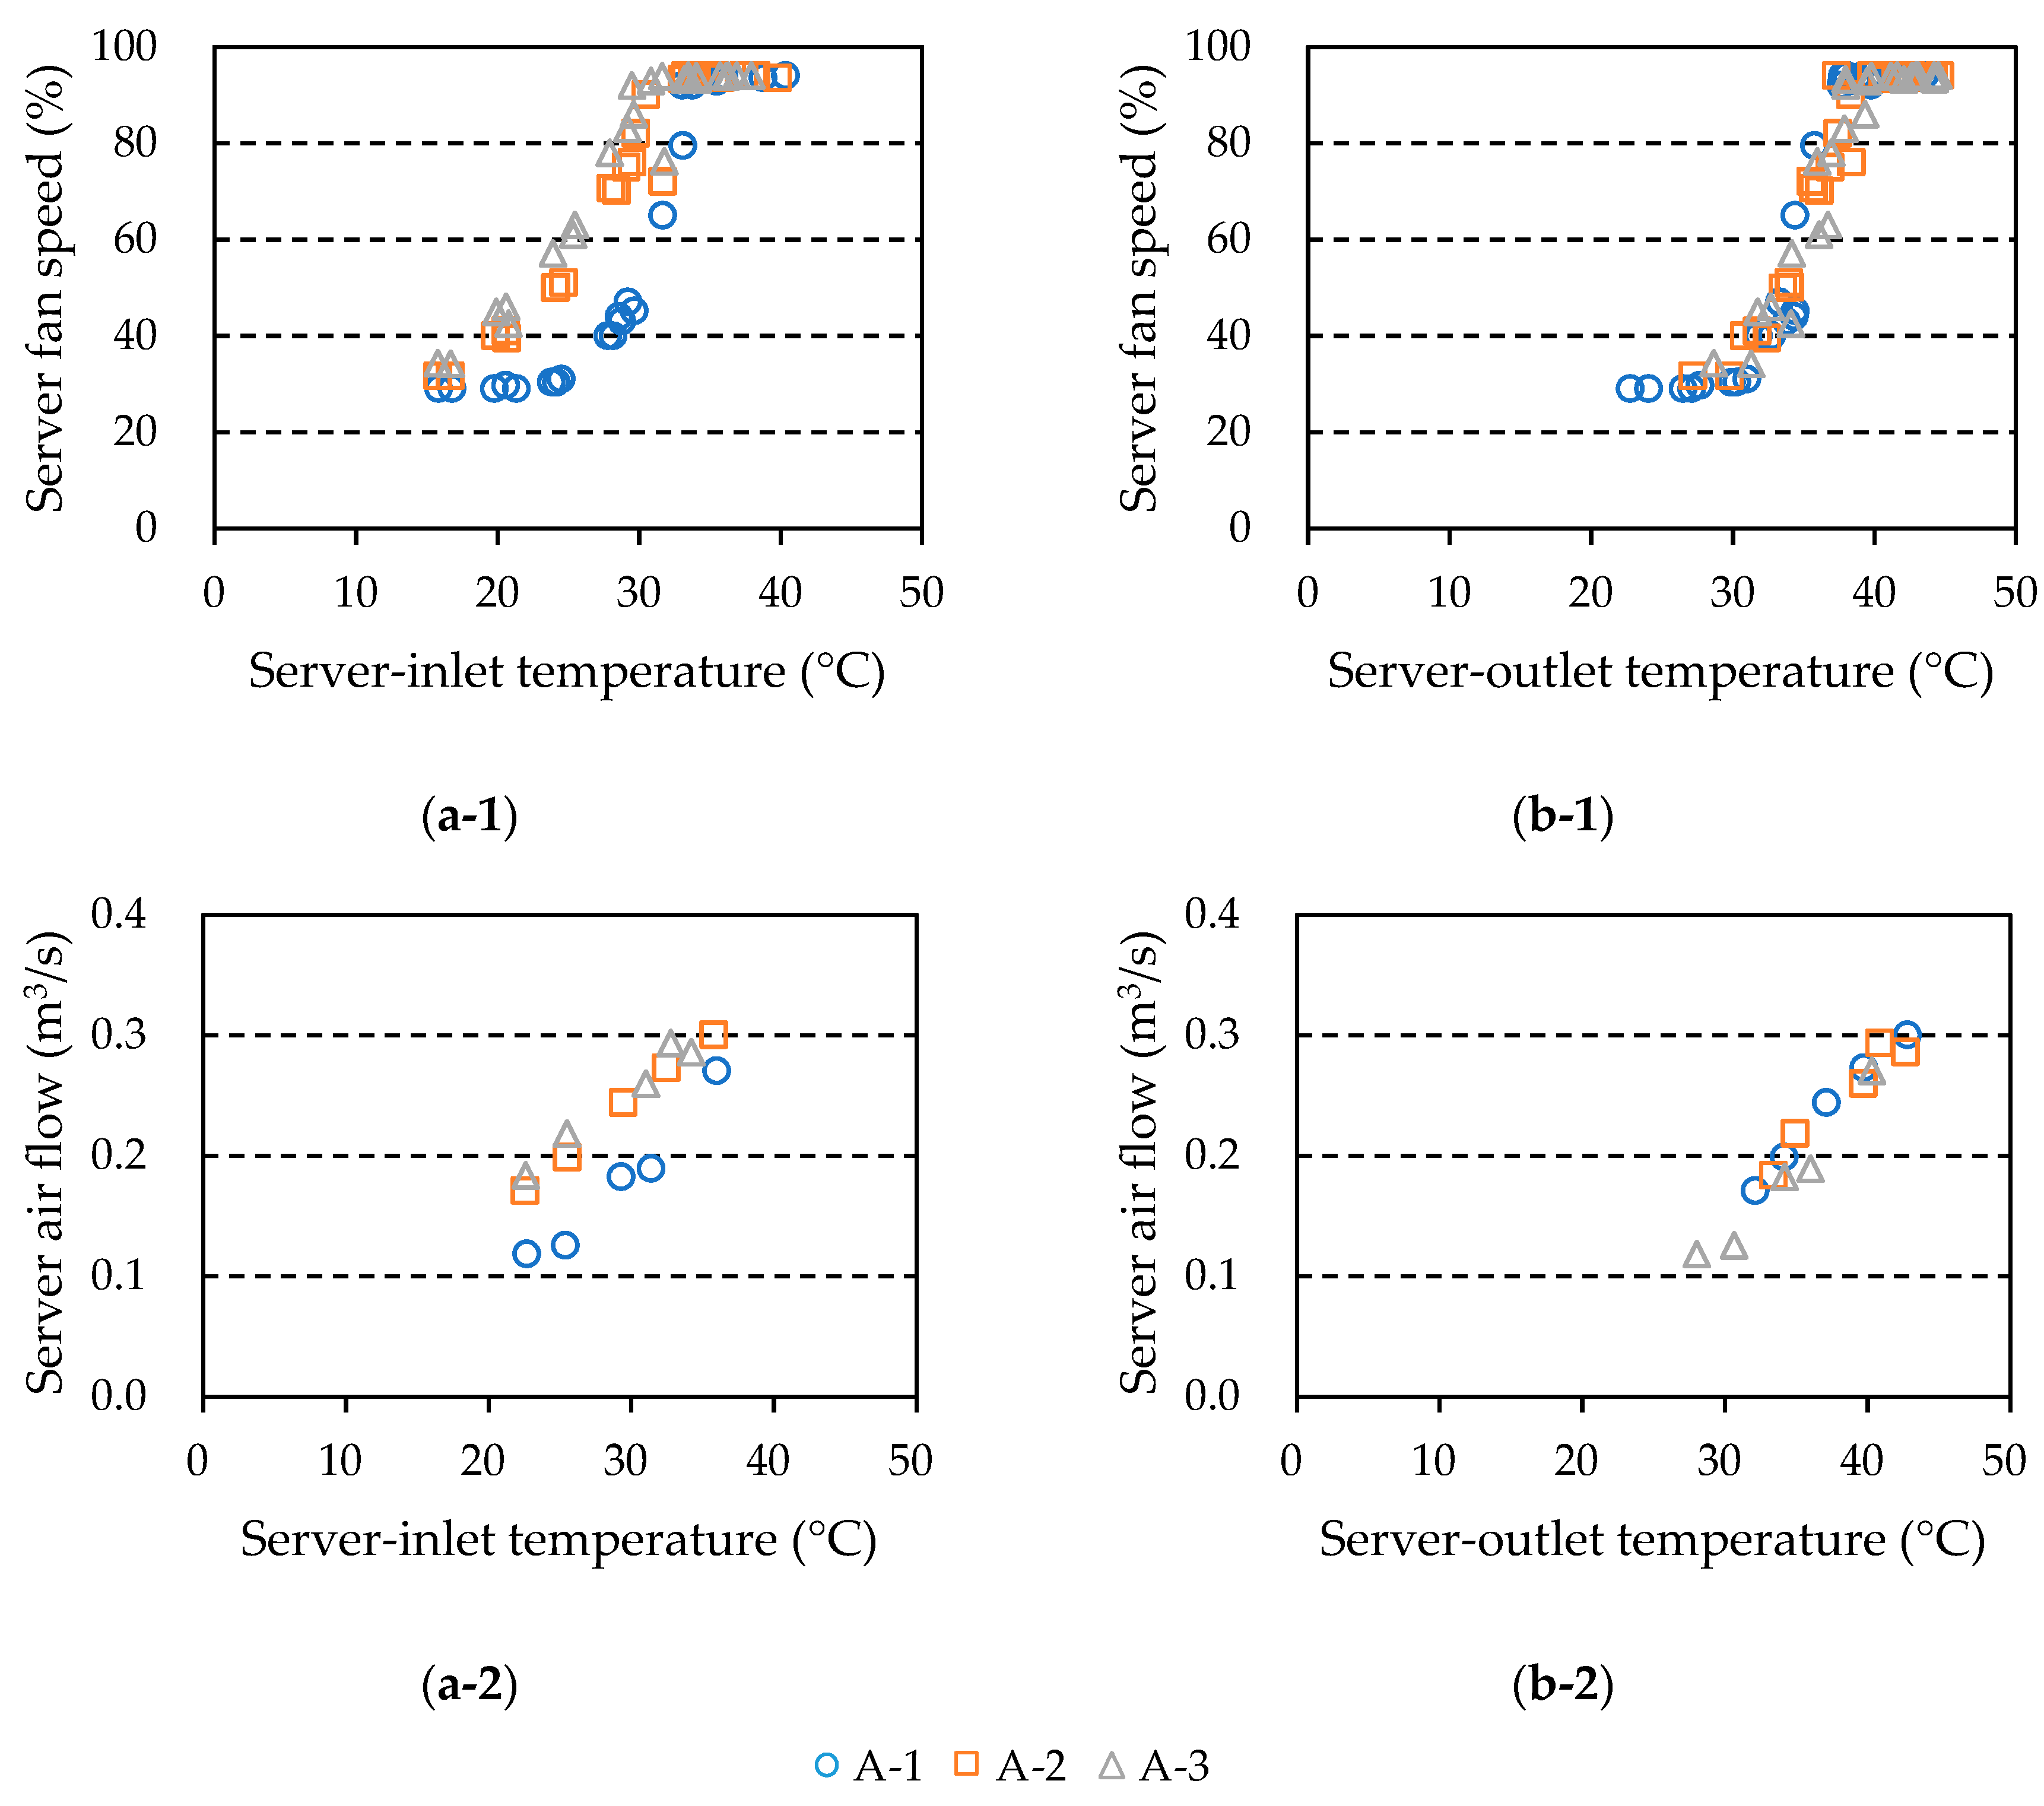
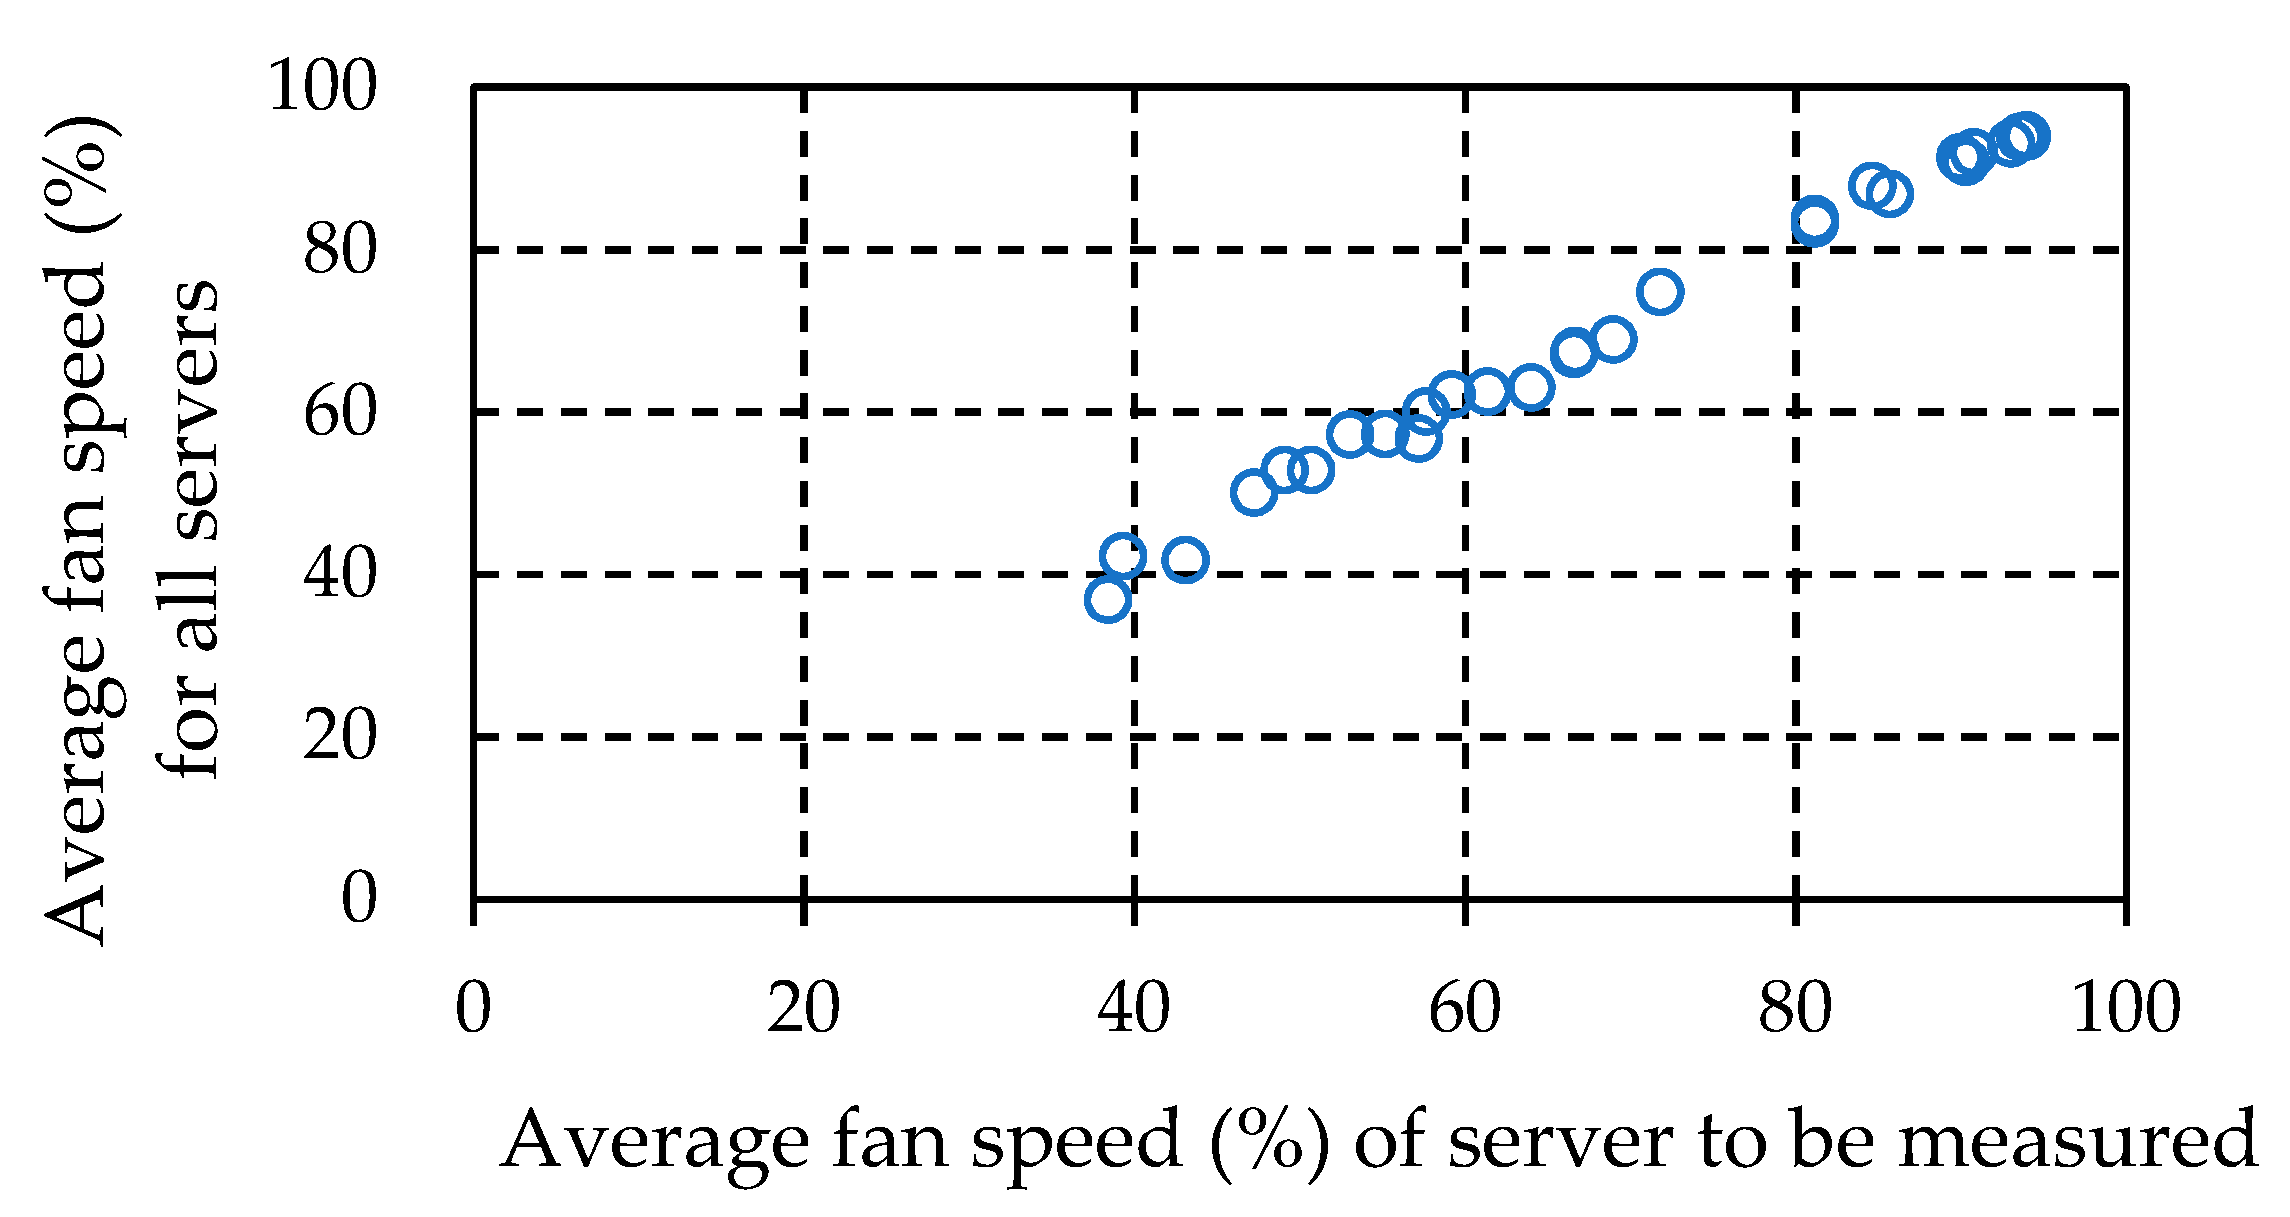
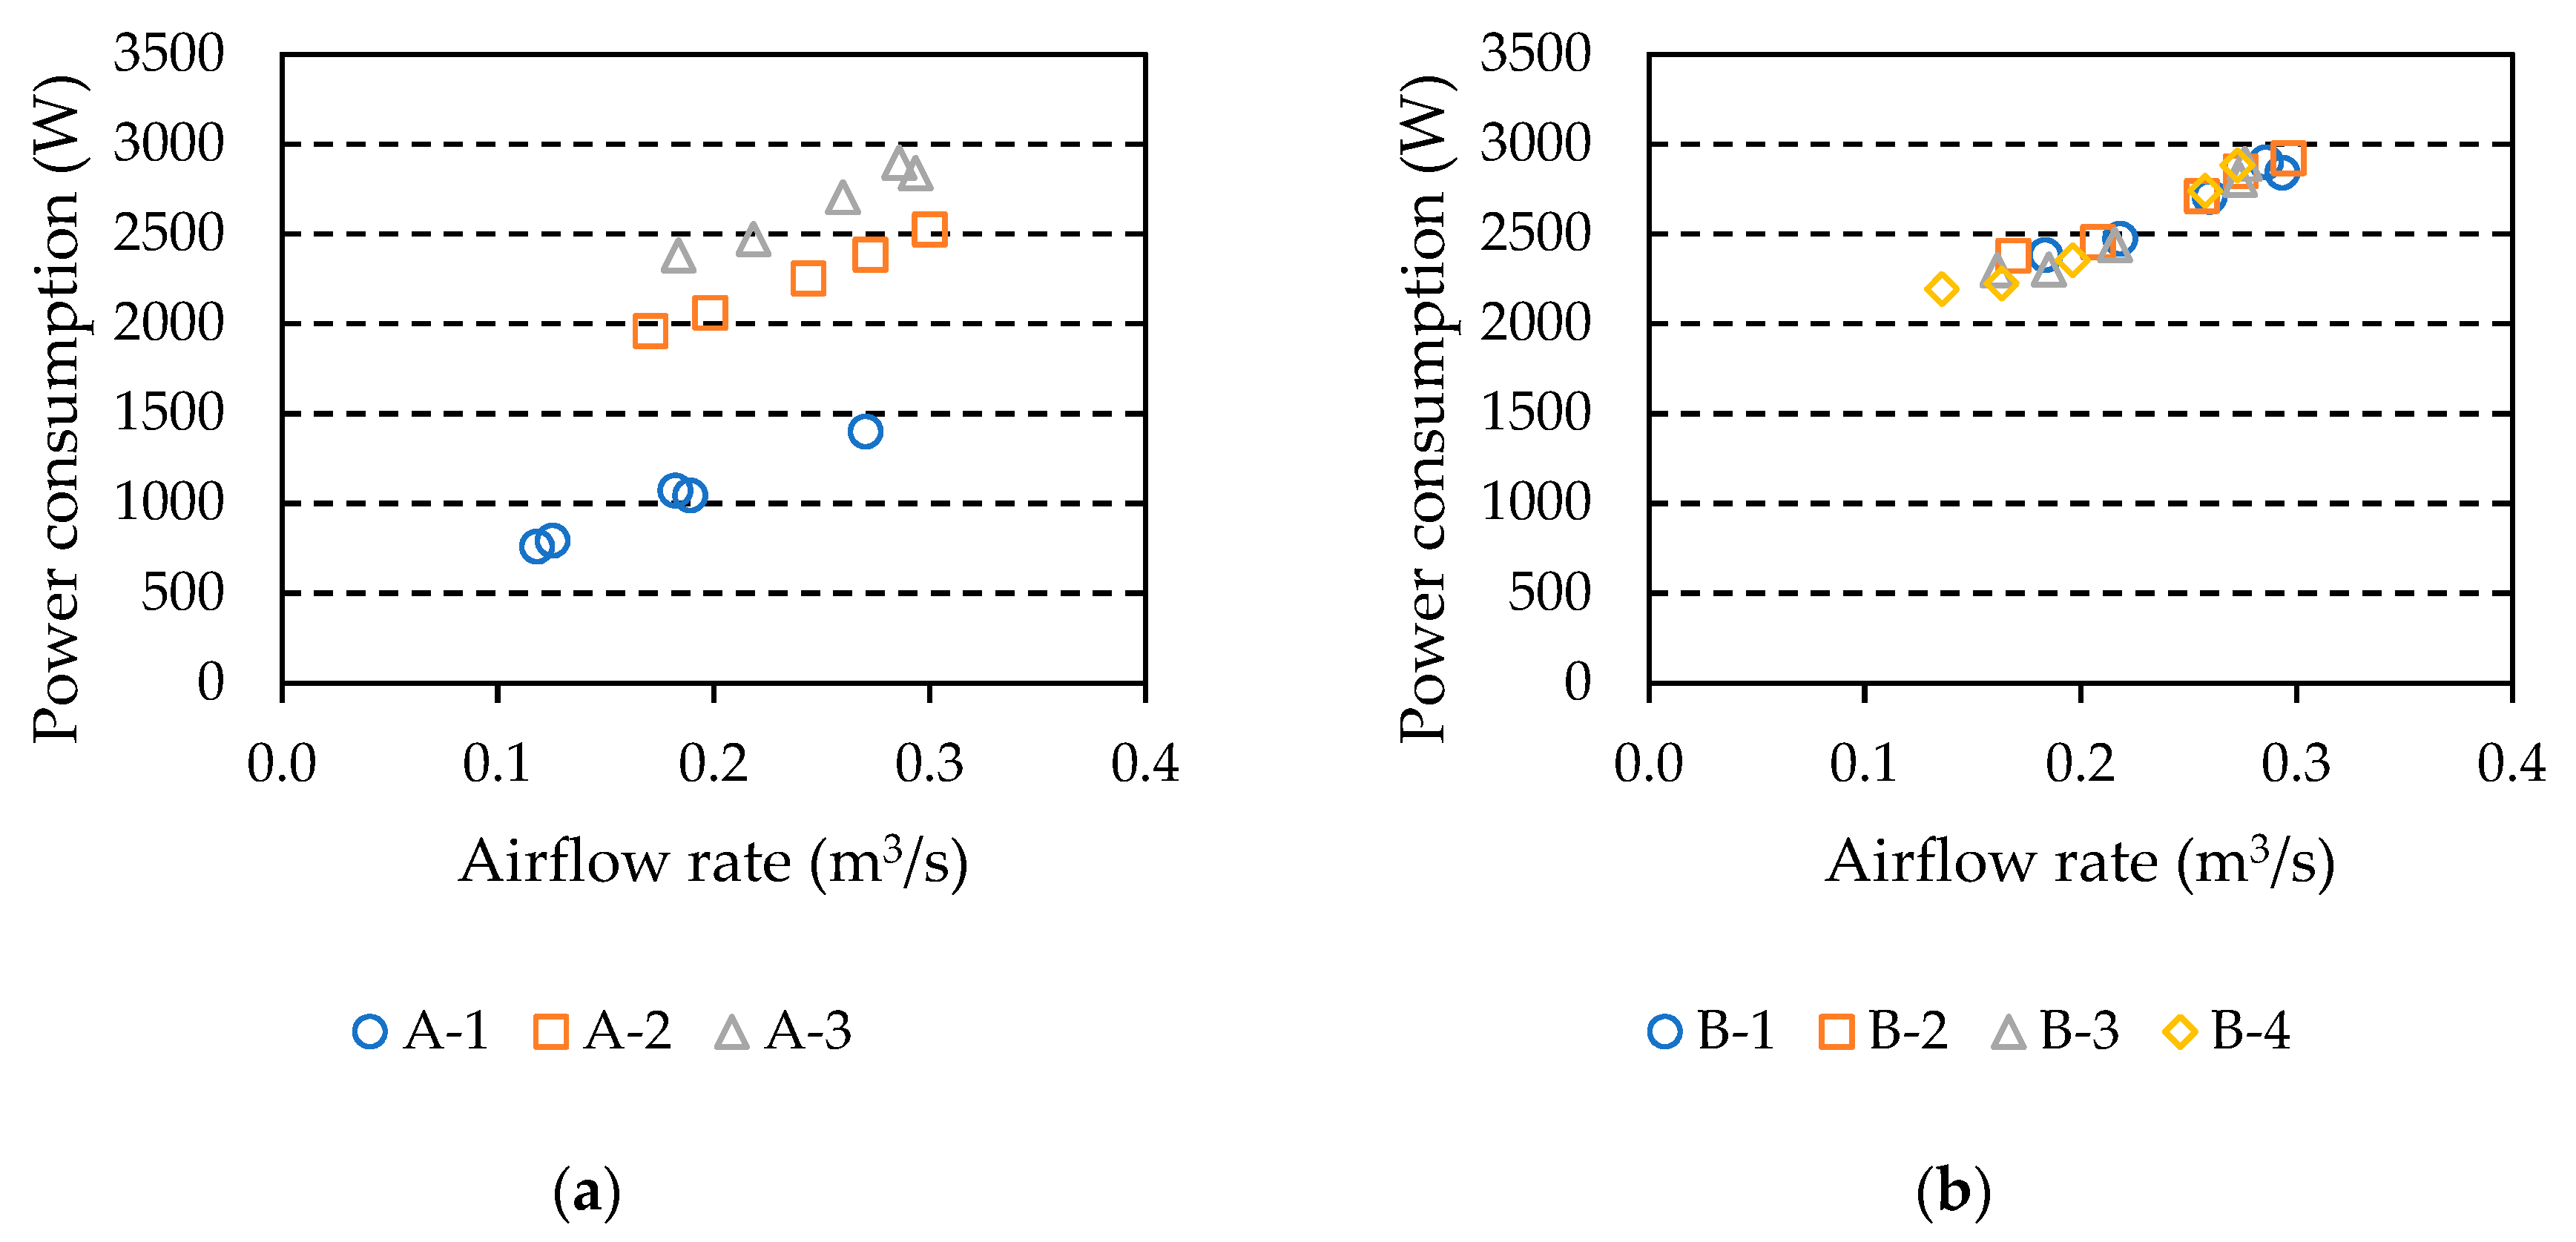
4.2.1. Air-Flow Characteristics of Server
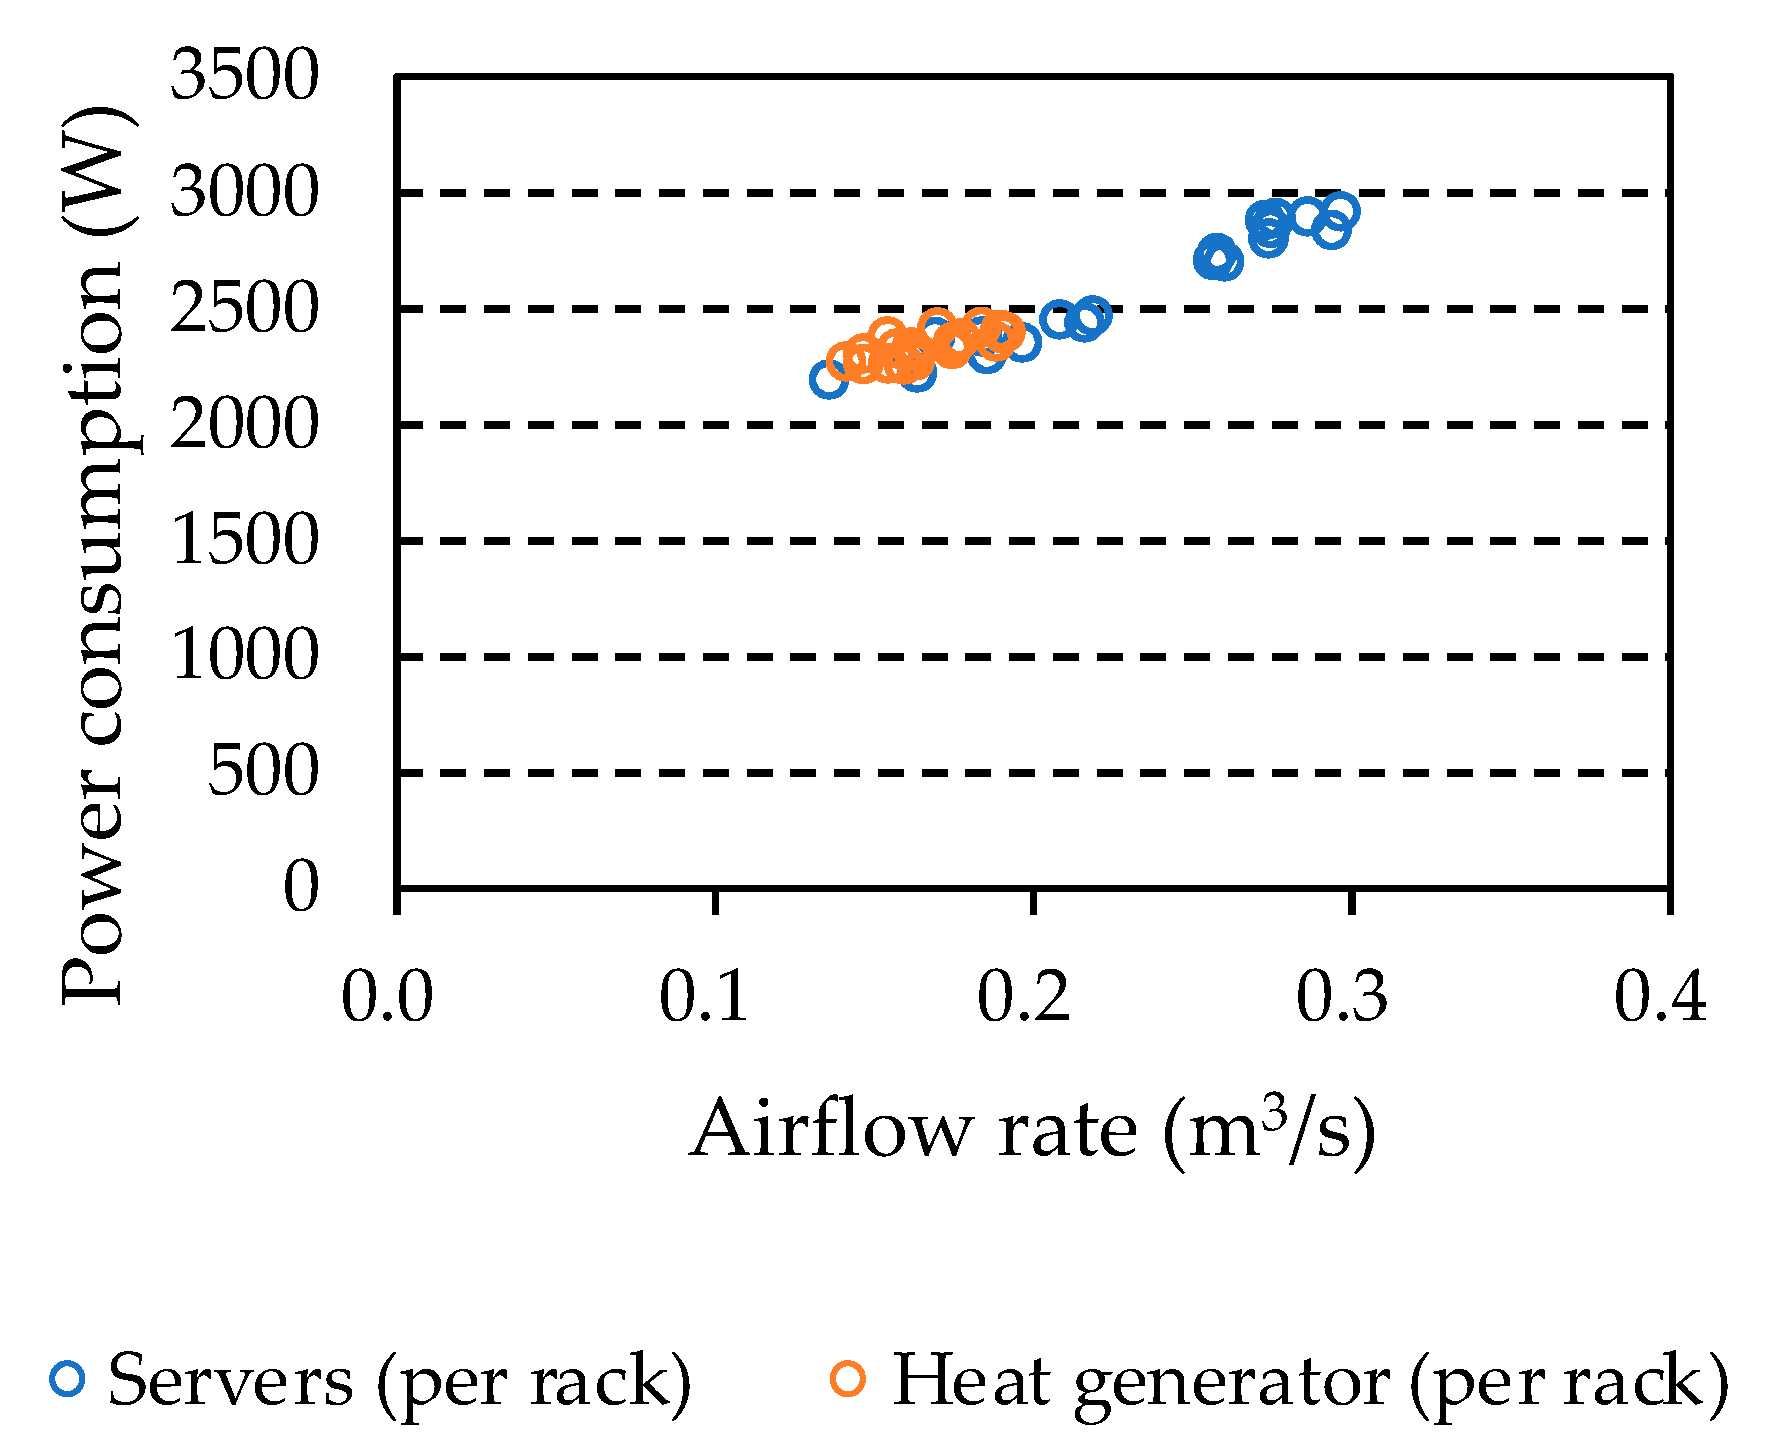
4.2.2. Server-Power-Consumption Characteristics
5. Validity of Prediction Method
5.1. Method to Reproduce ITE
5.2. Experimental Conditions (Experiments C and D)
5.3. Comparison of Experimental Results and Prediction Results (Experiments C and D)
5.3.1. Confirmation of Reproduction Status
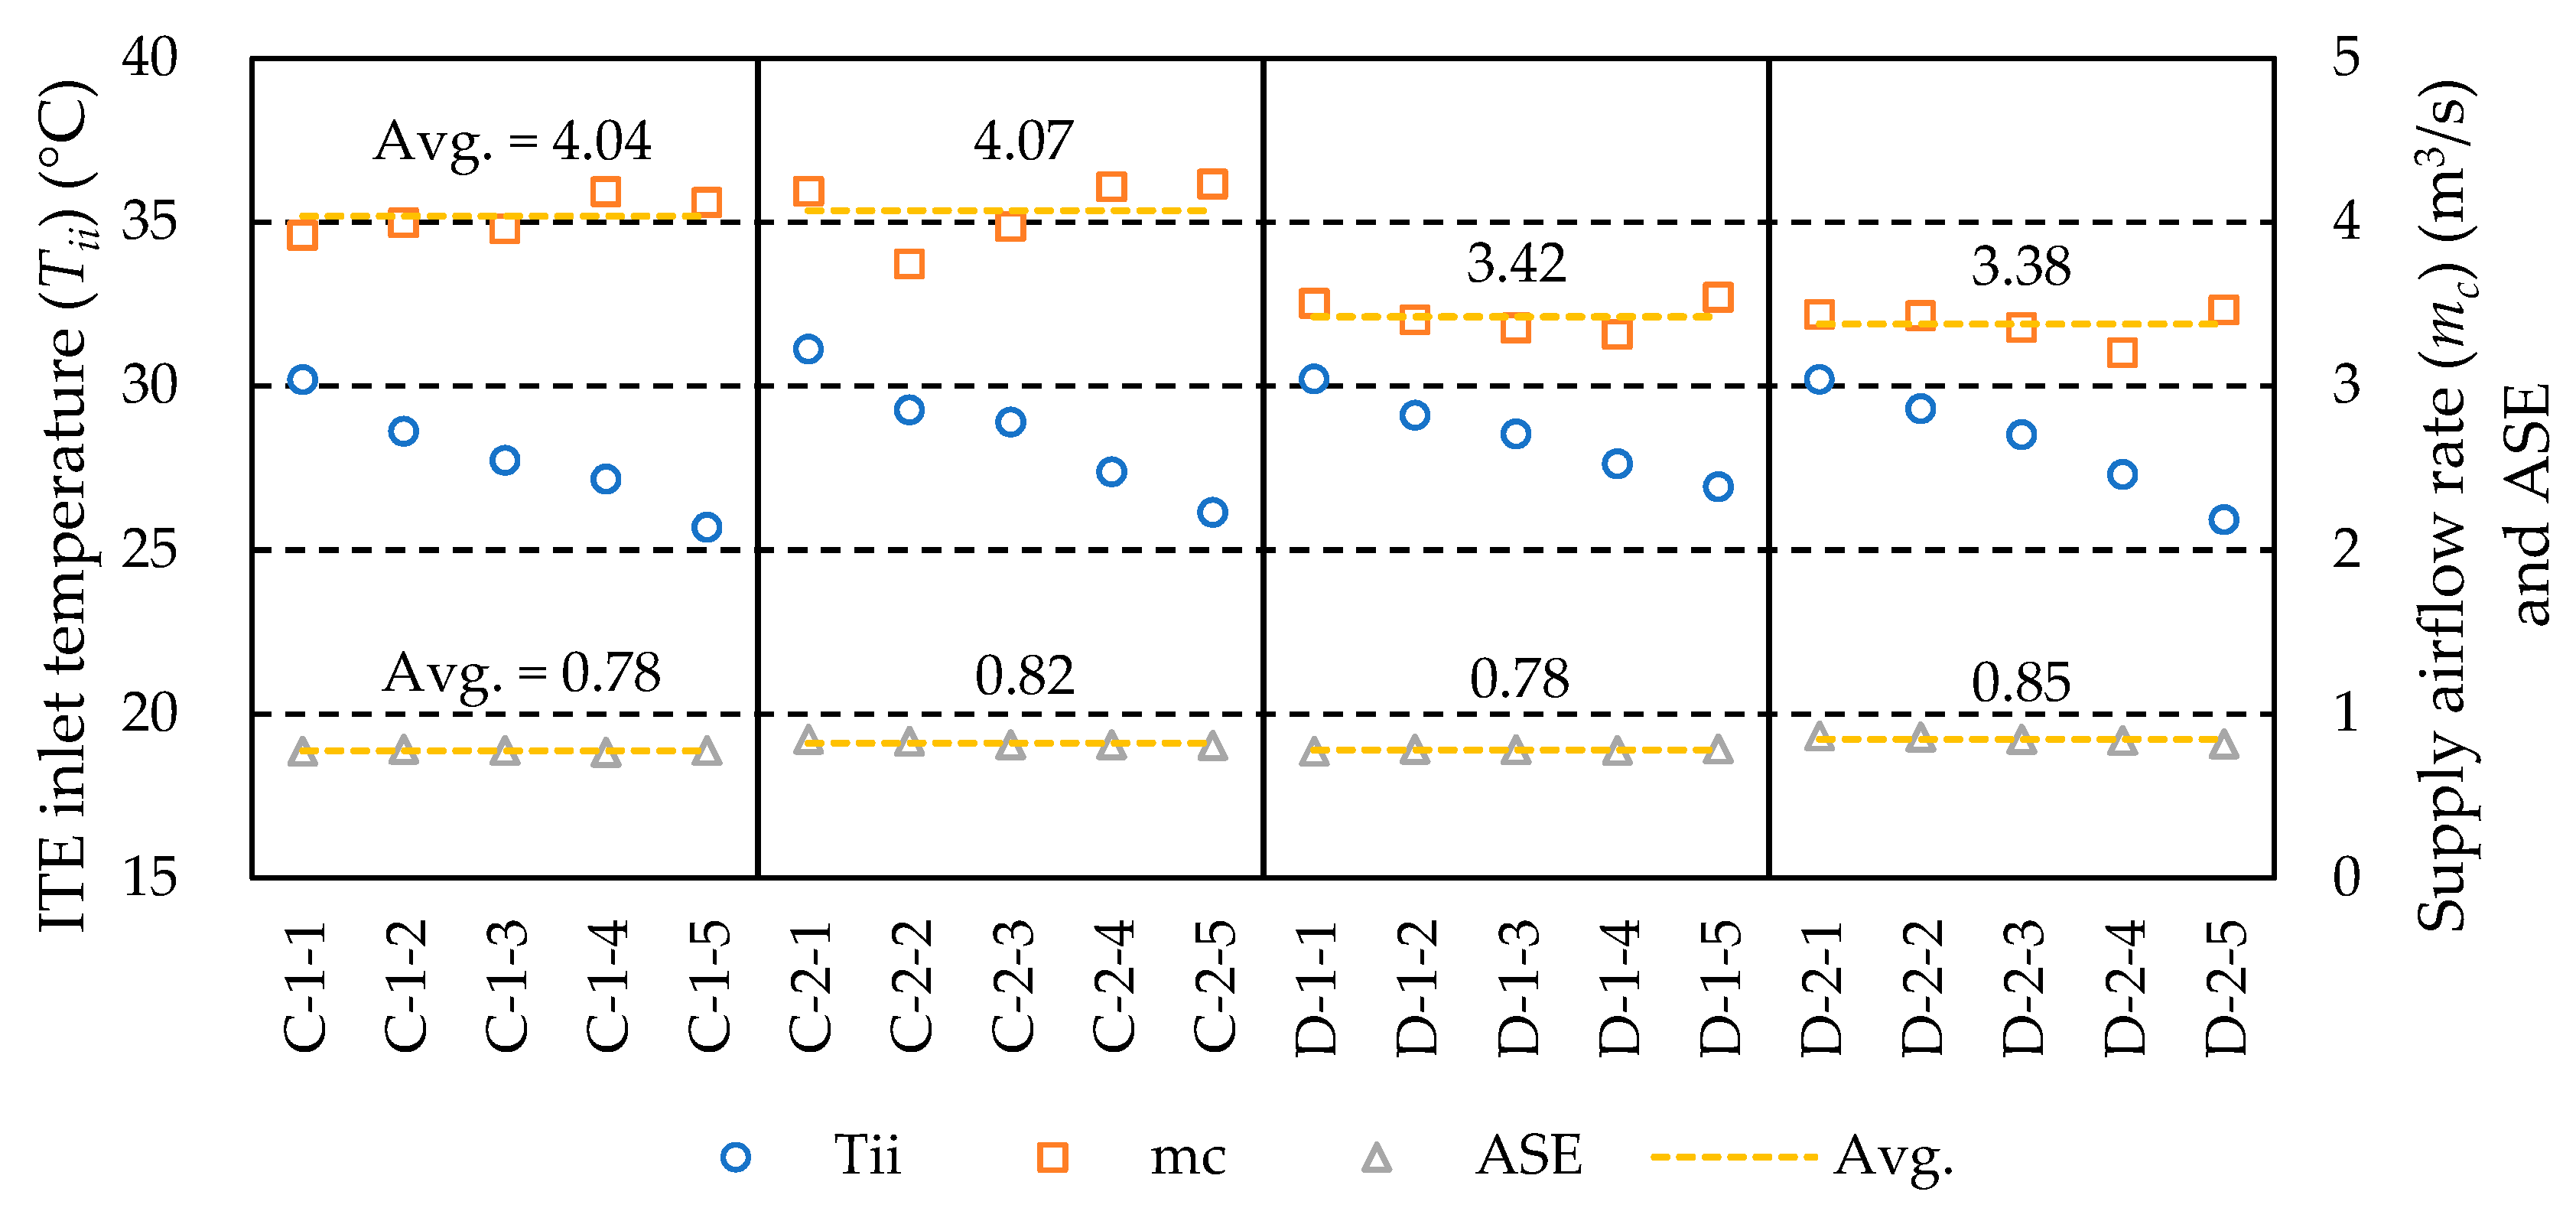
5.3.2. Confirmation of Given Conditions
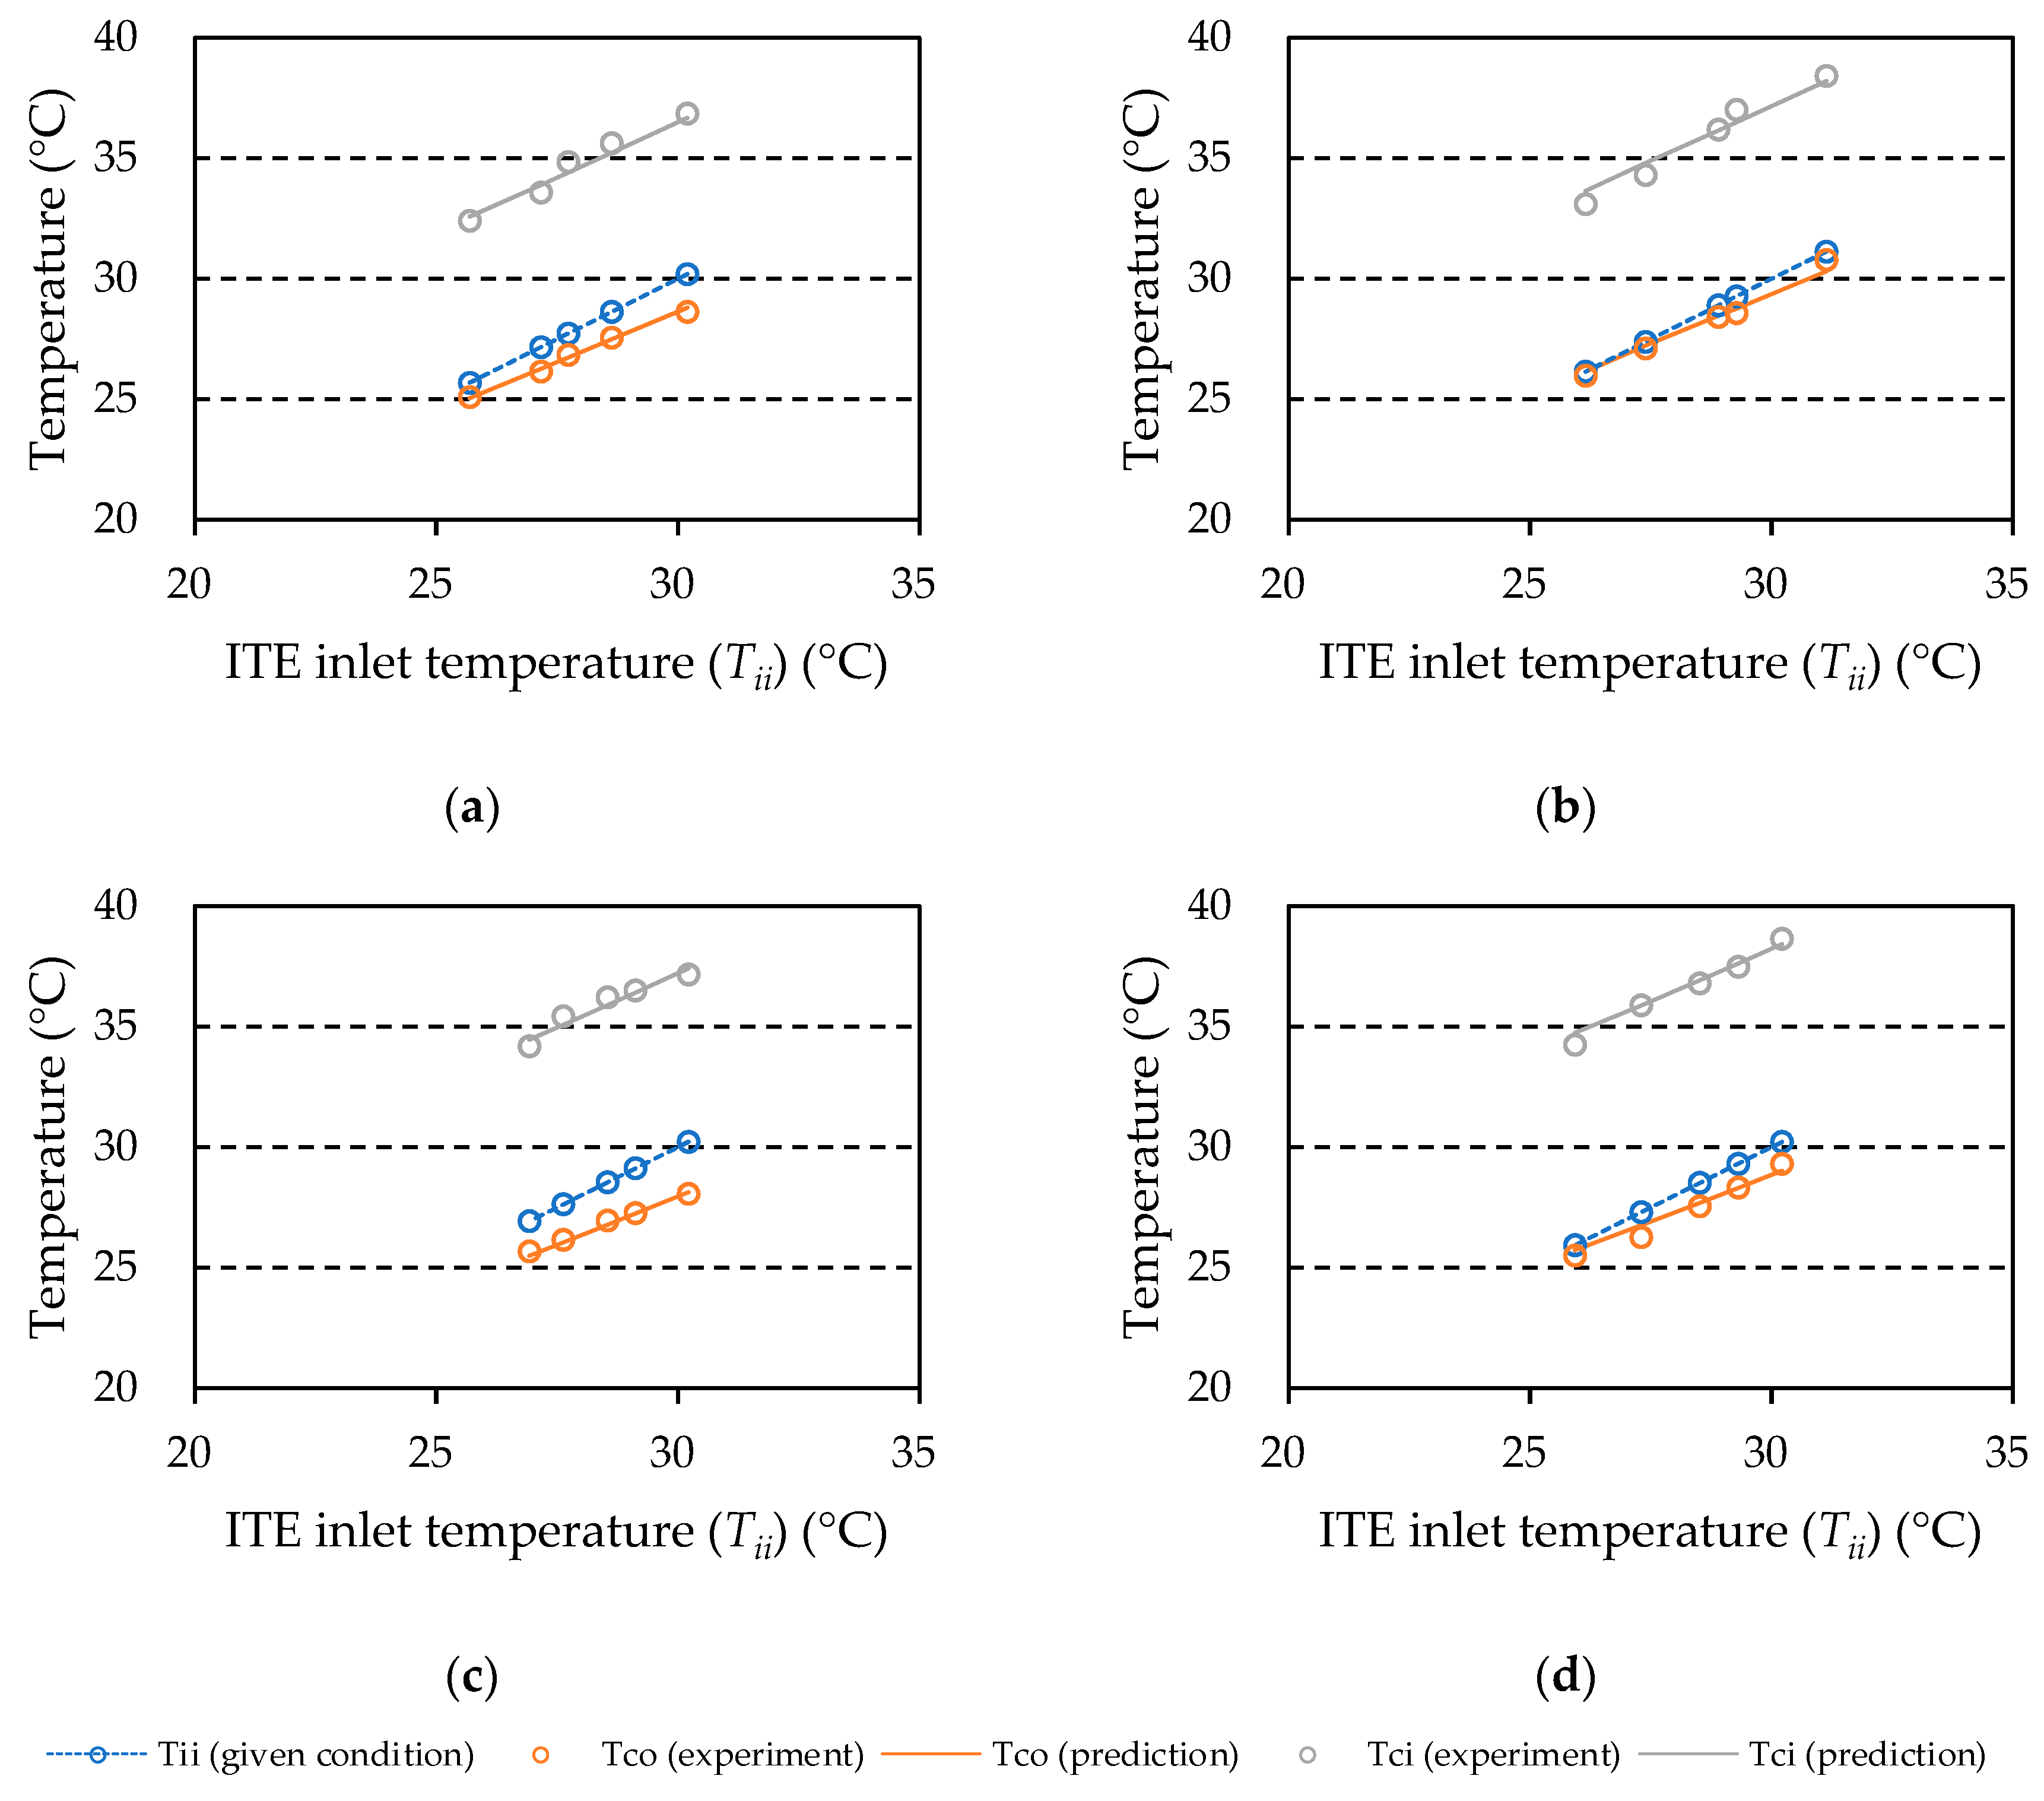
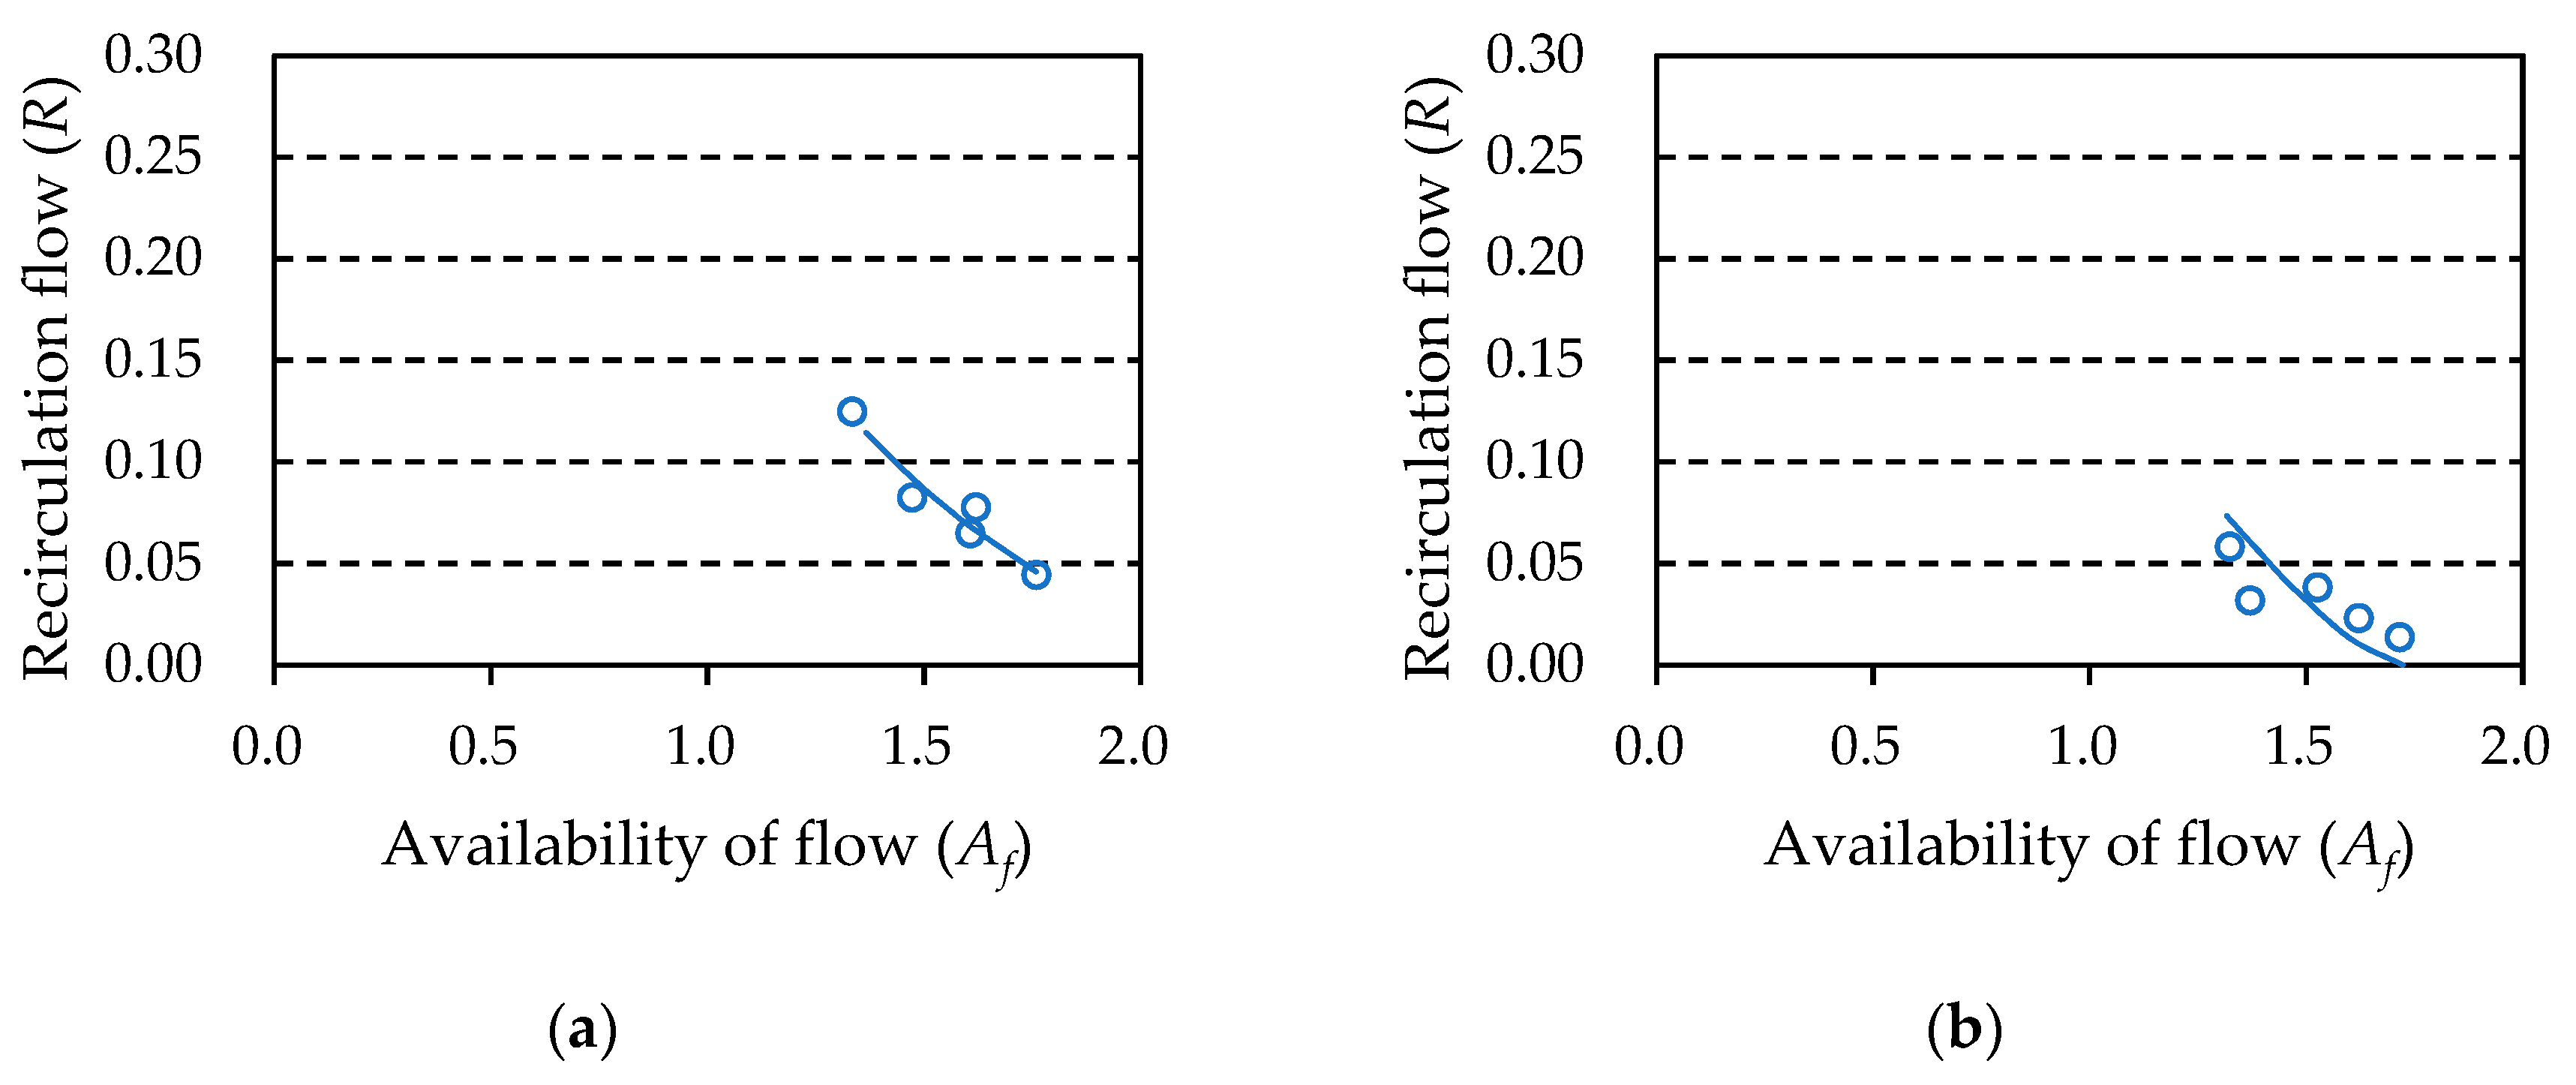
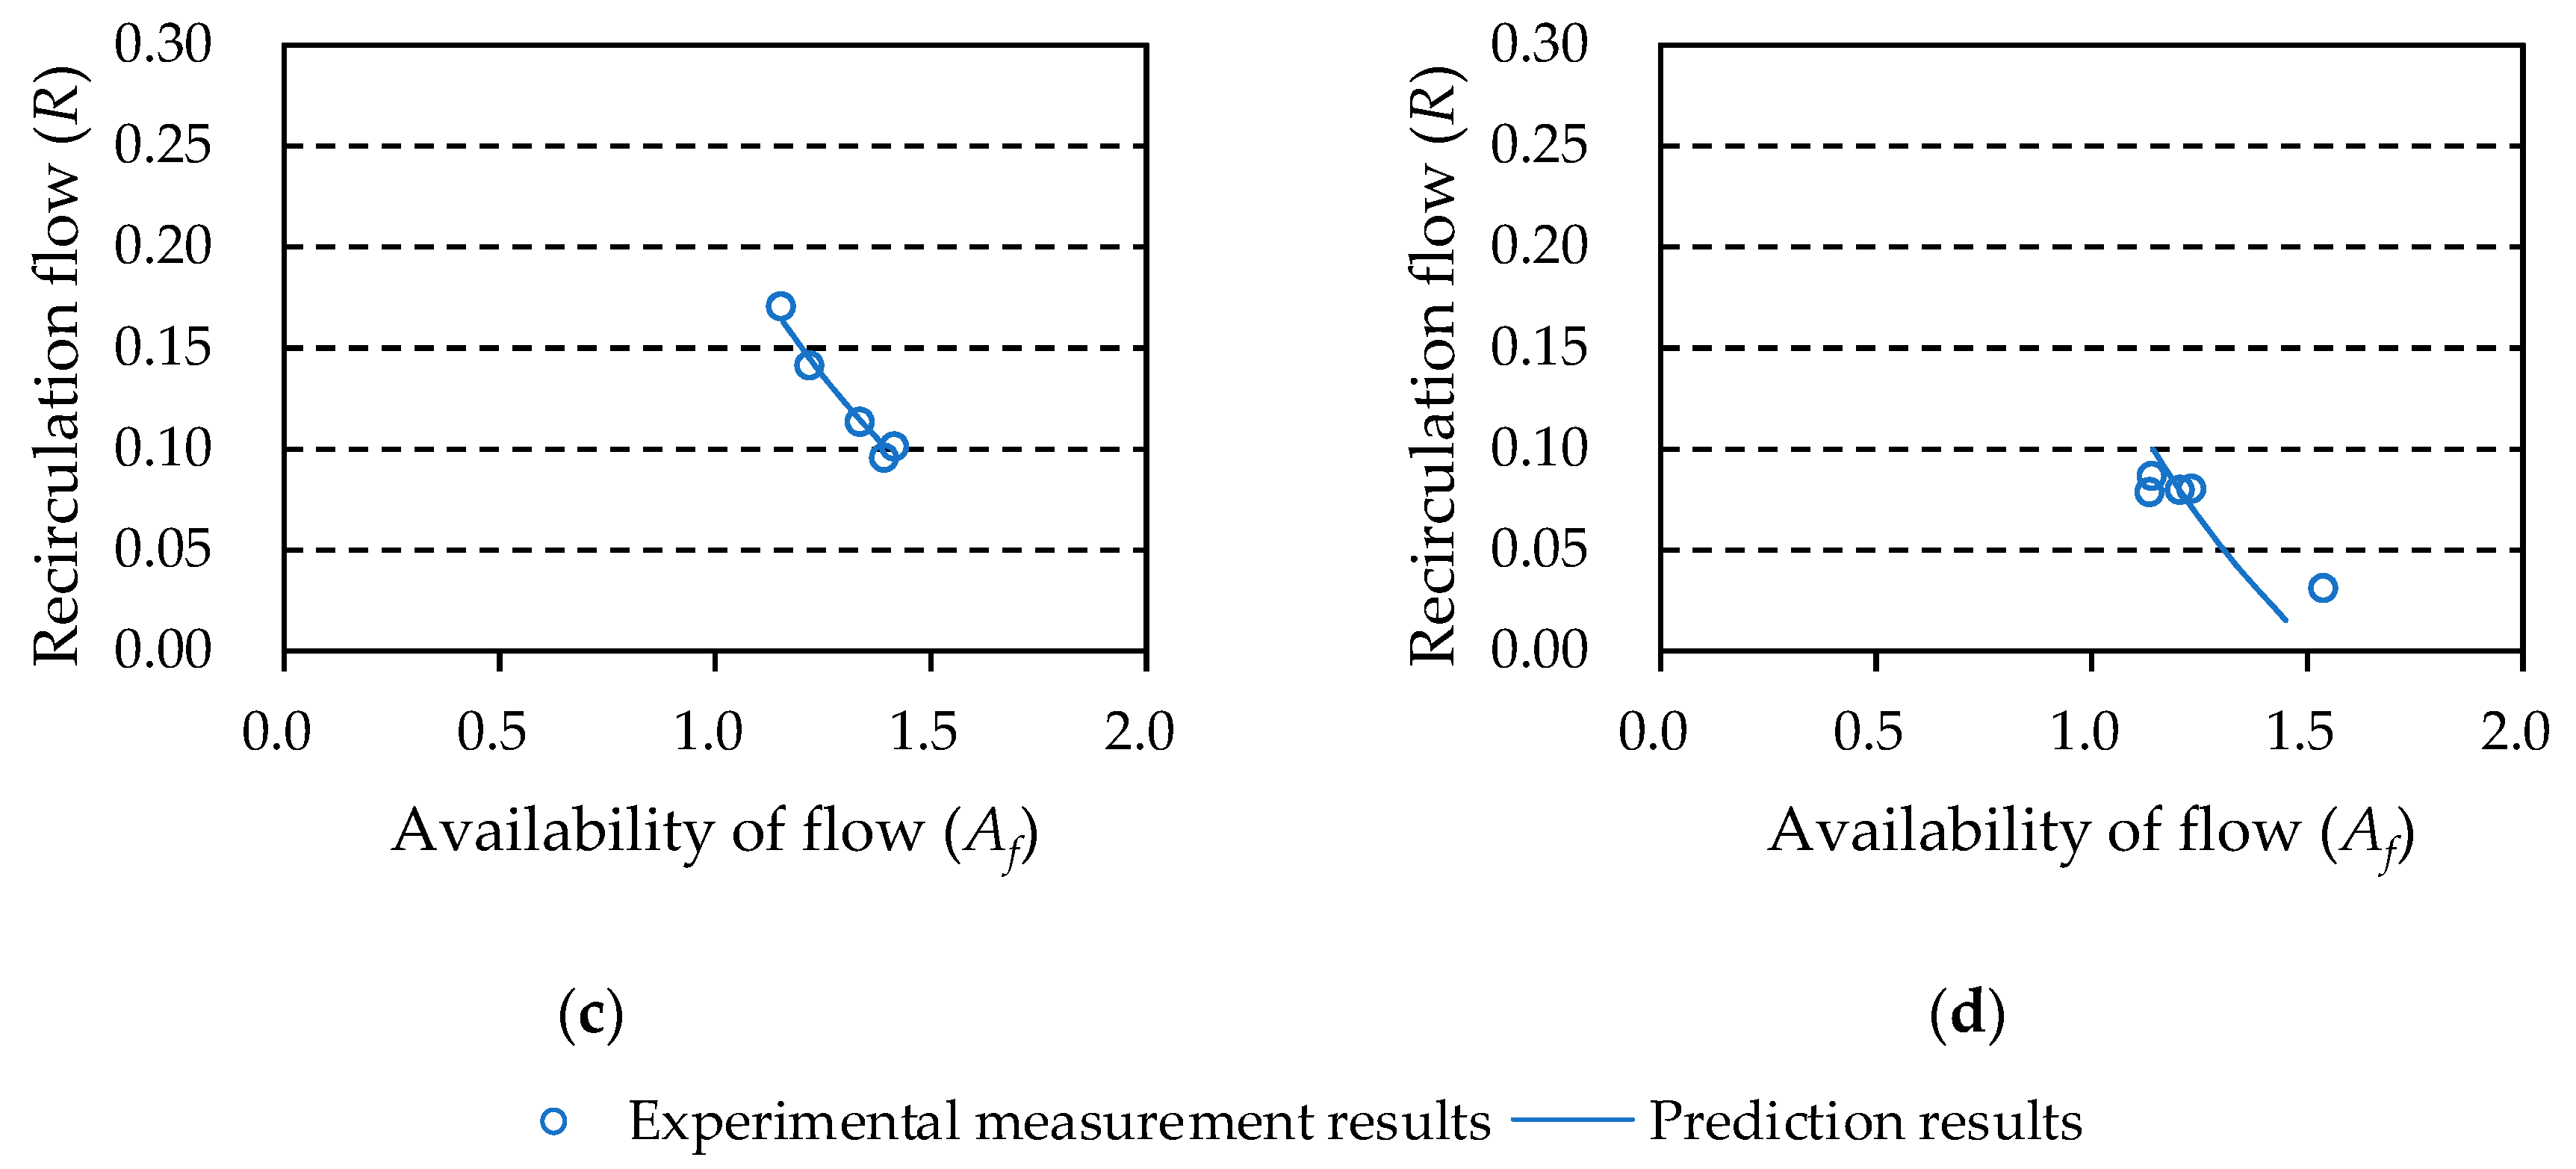
5.3.3. Comparison of Measurement Results with Prediction Results
6. Proposed Method for Optimization of Total Energy of a Machine Room
6.1. Settlement of Conditions
6.1.1. Predetermined Conditions
6.1.2. Characteristics of ITE
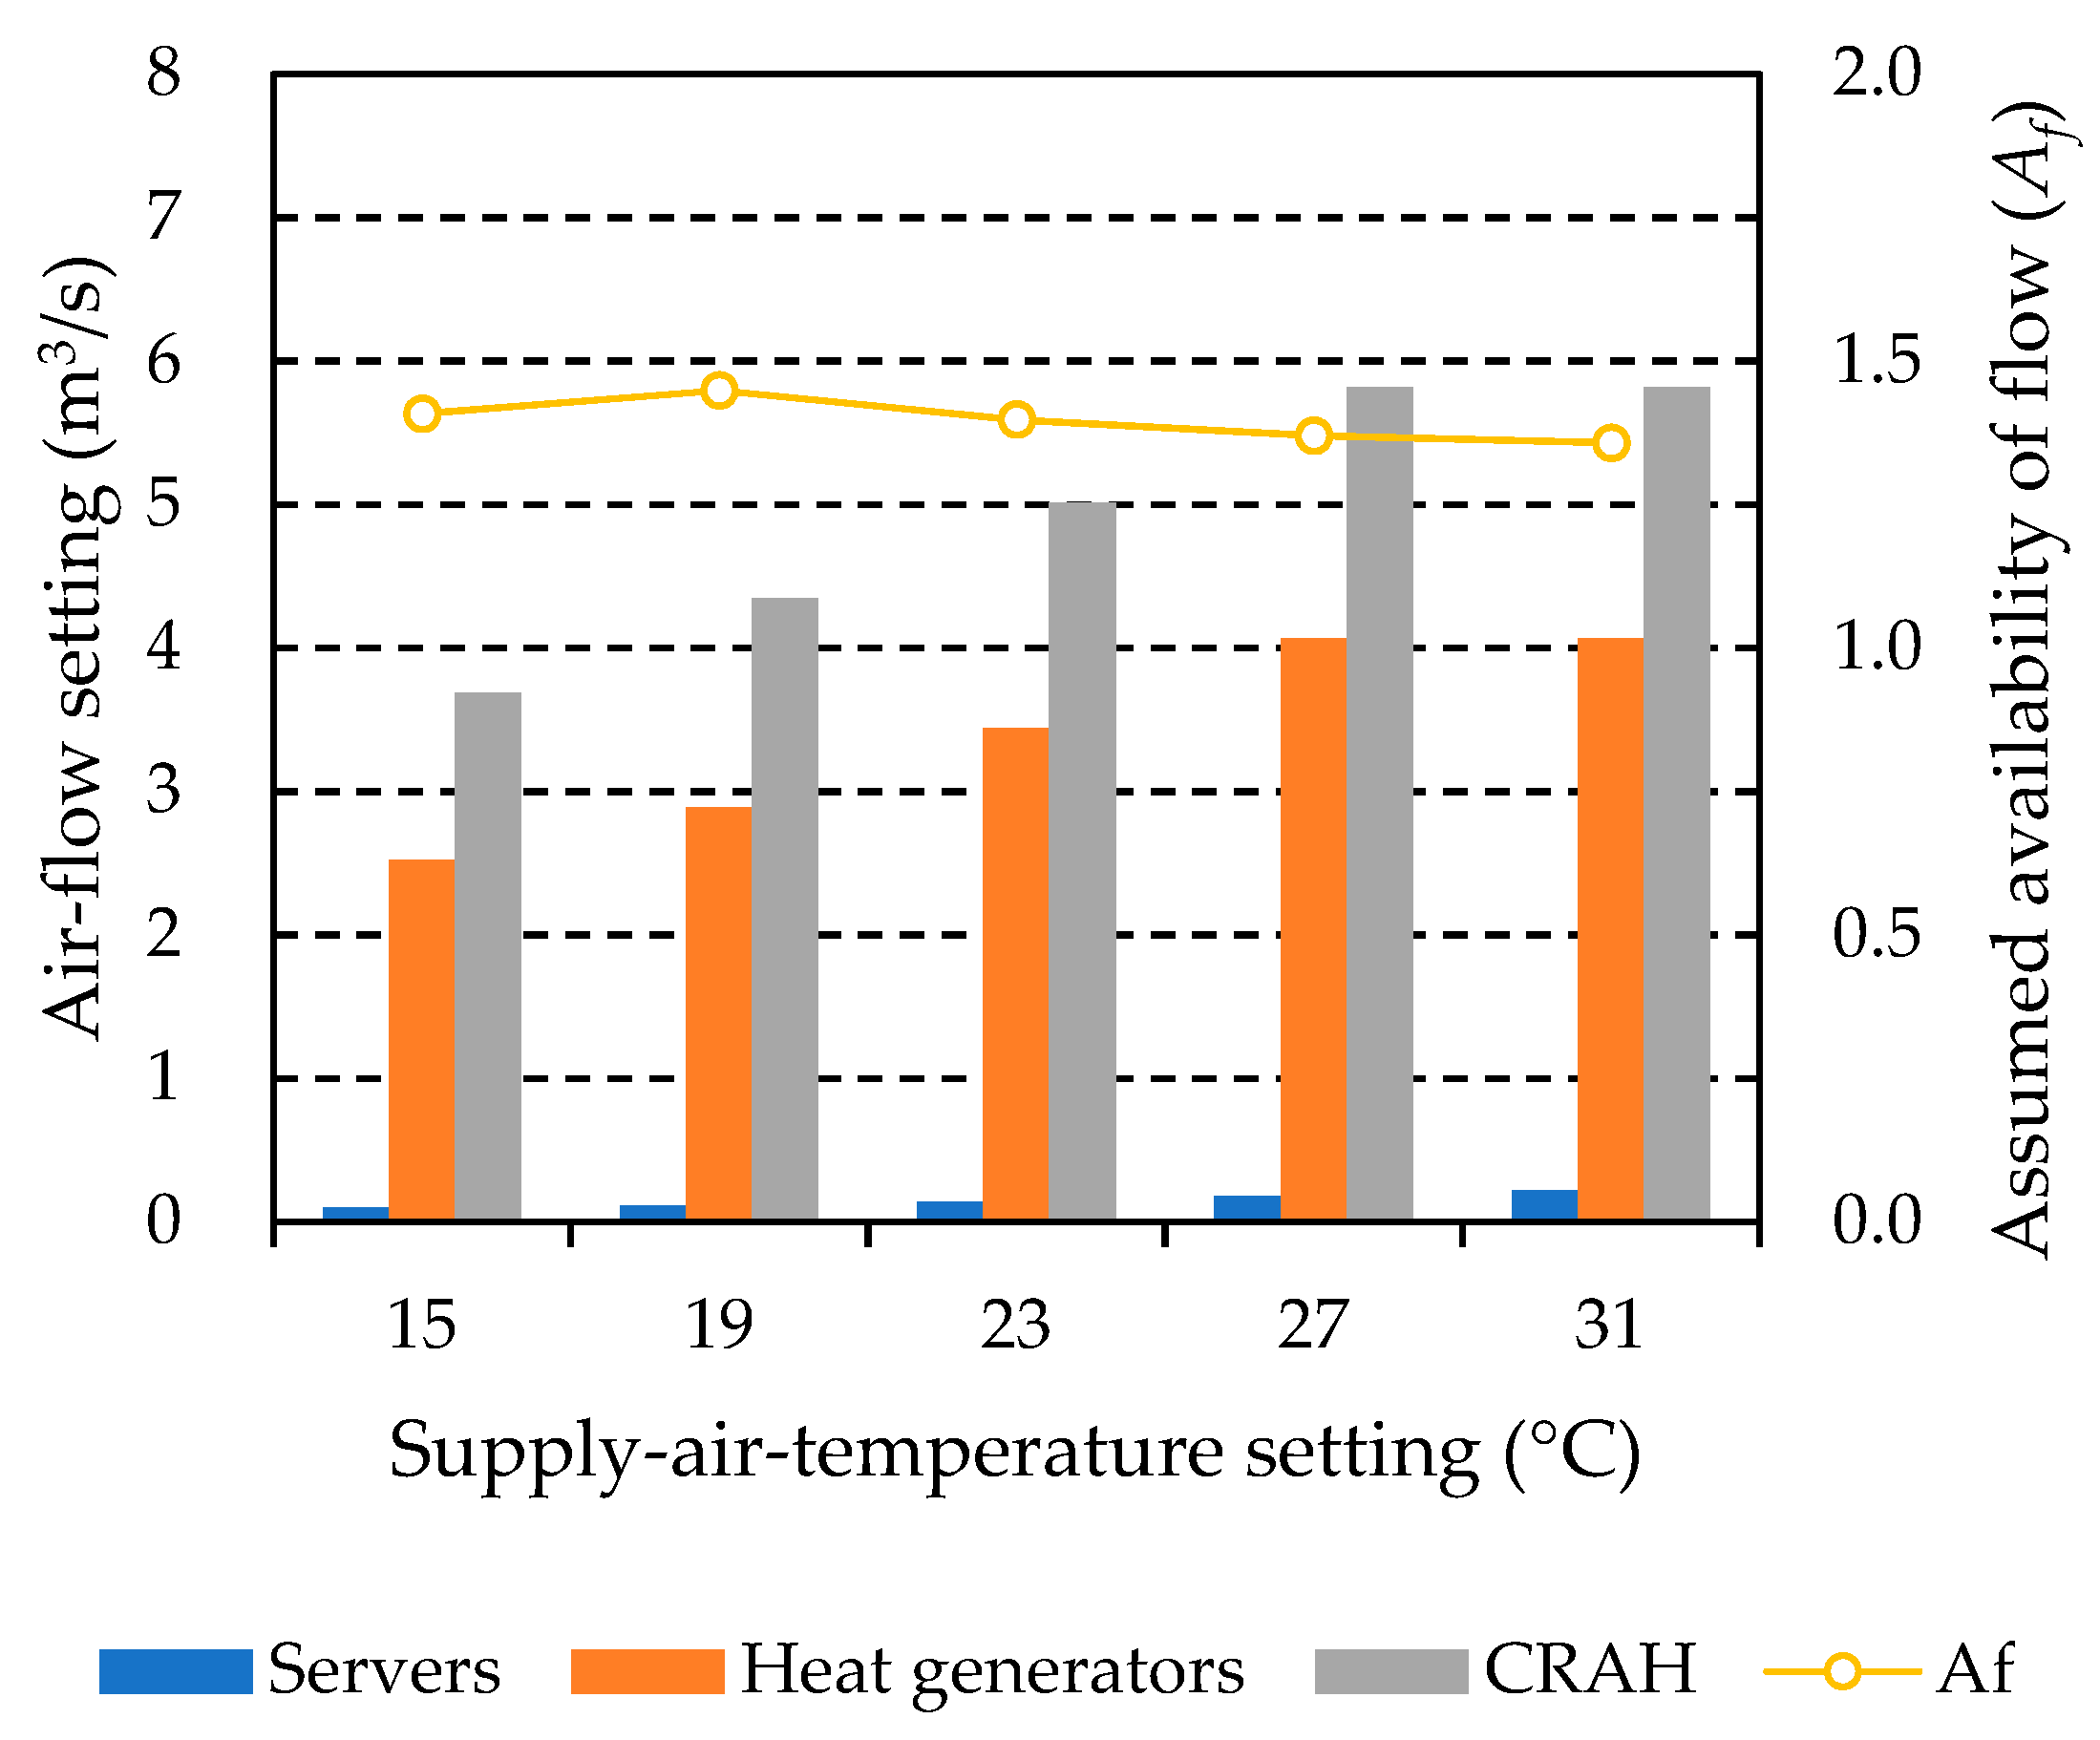
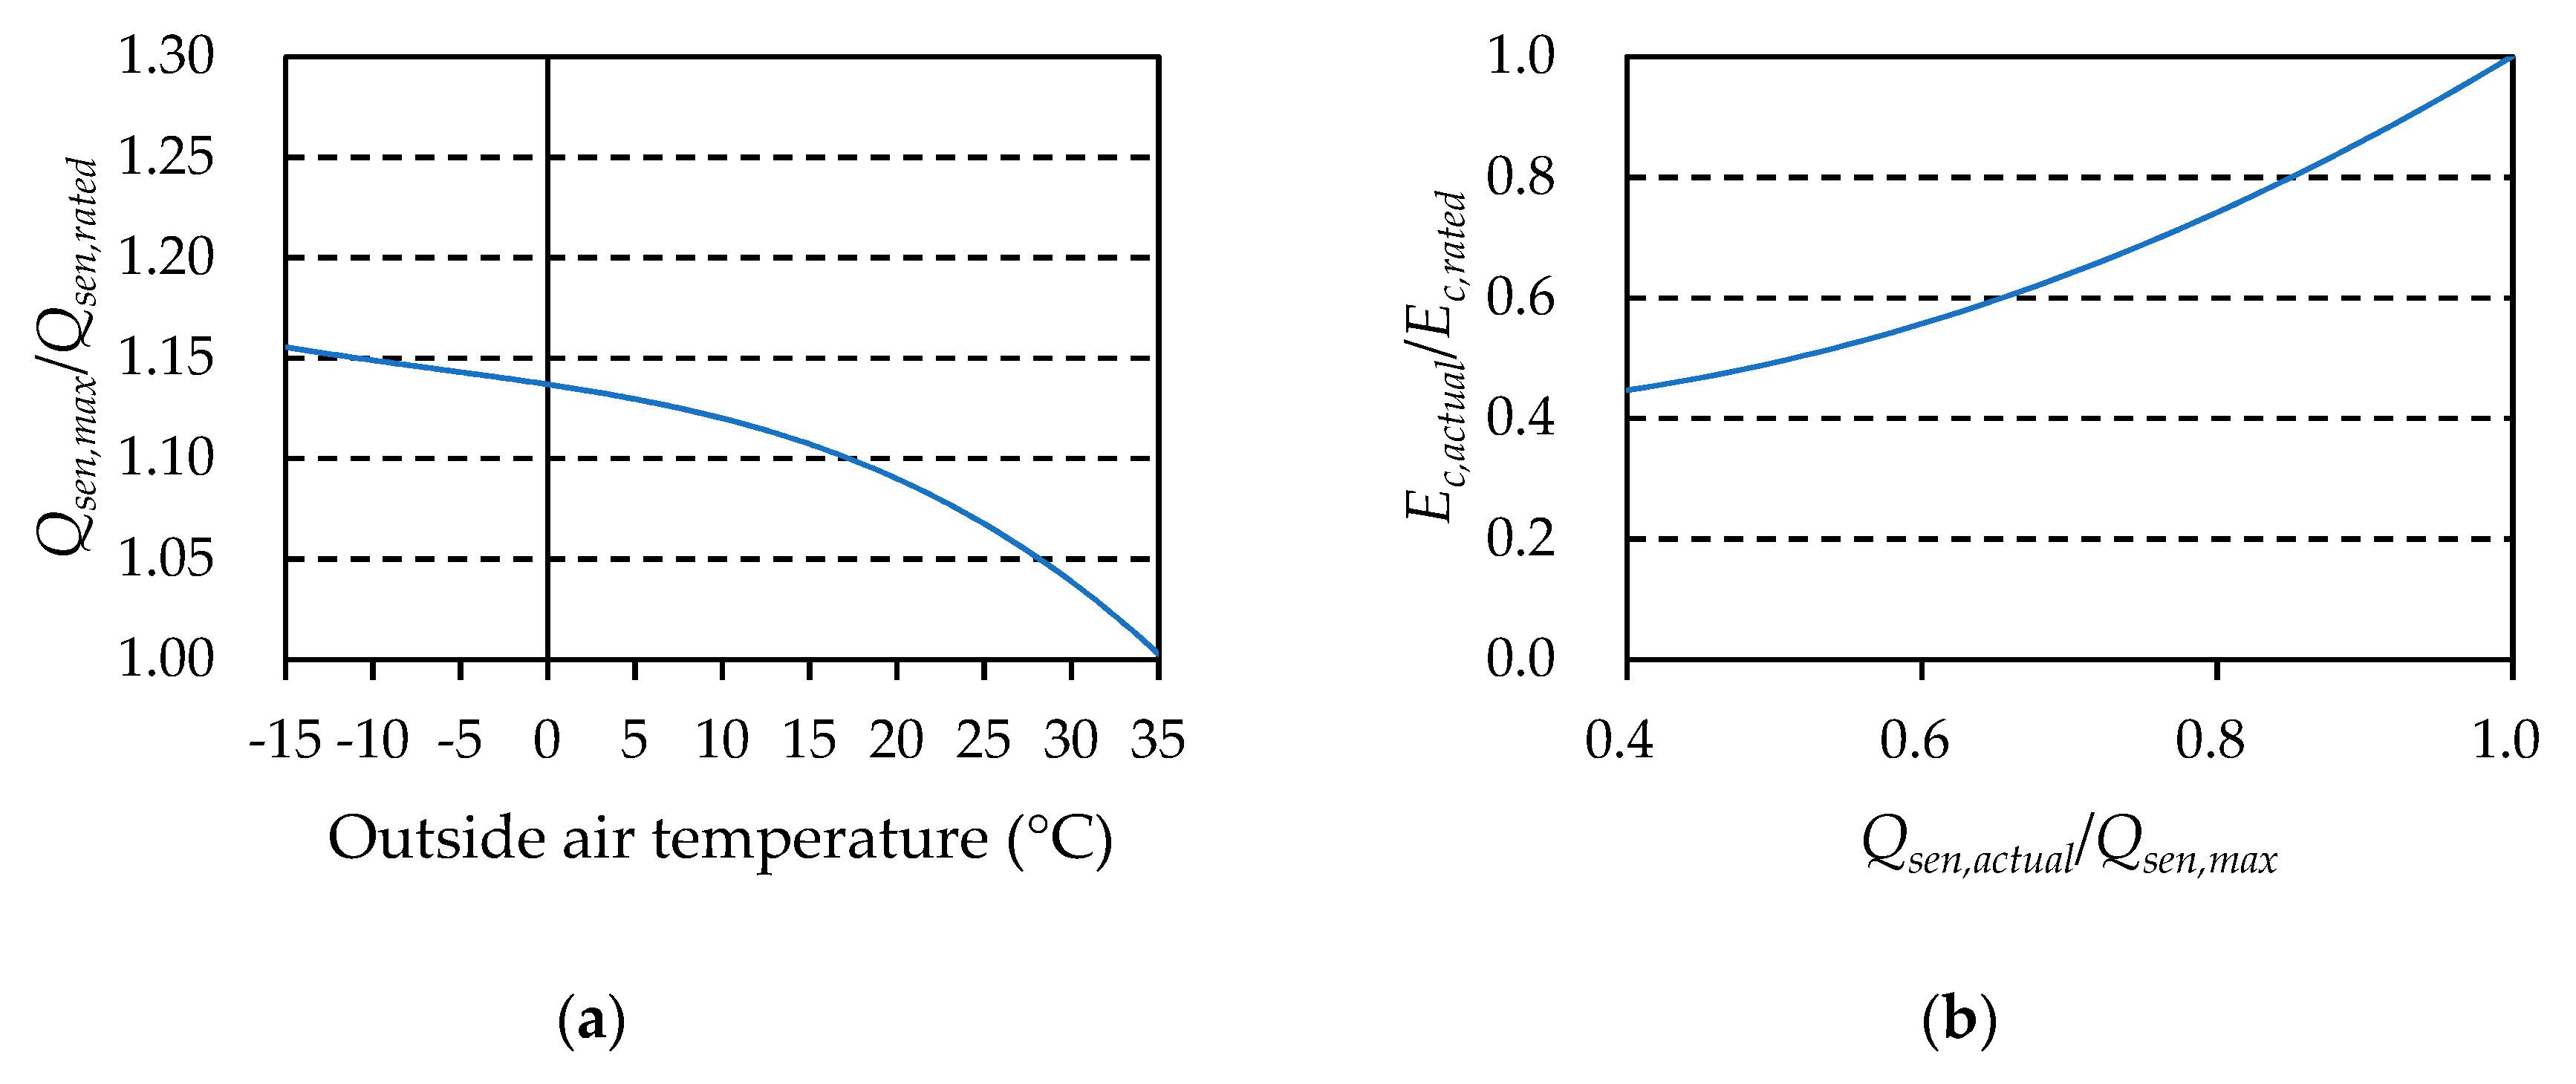
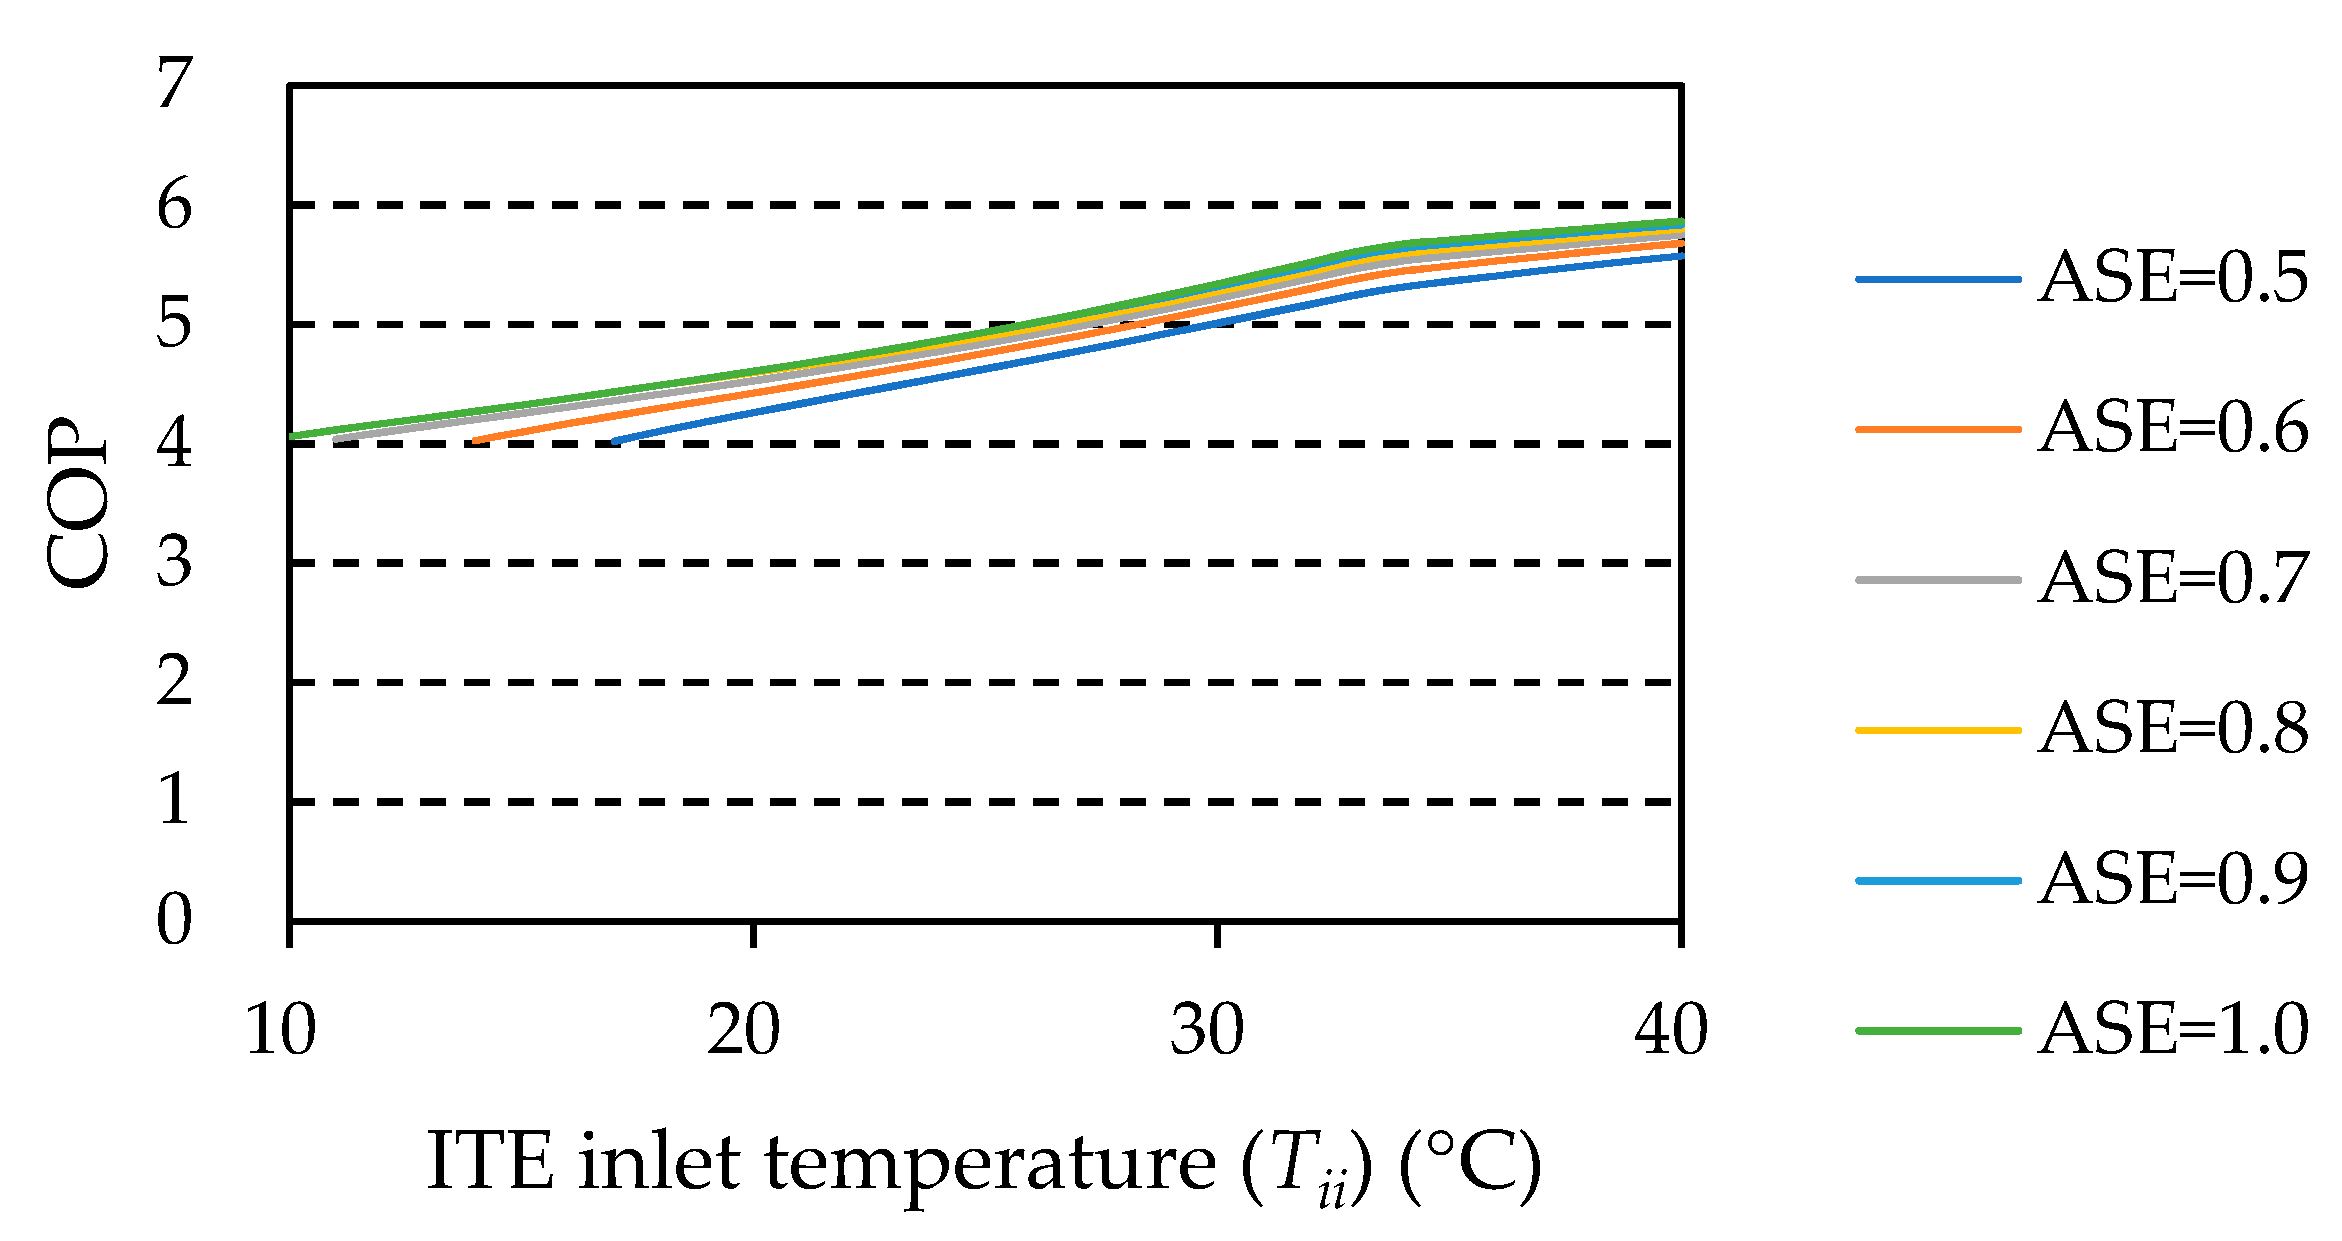
6.1.3. Characteristics of HVAC
6.2. Prediction Results
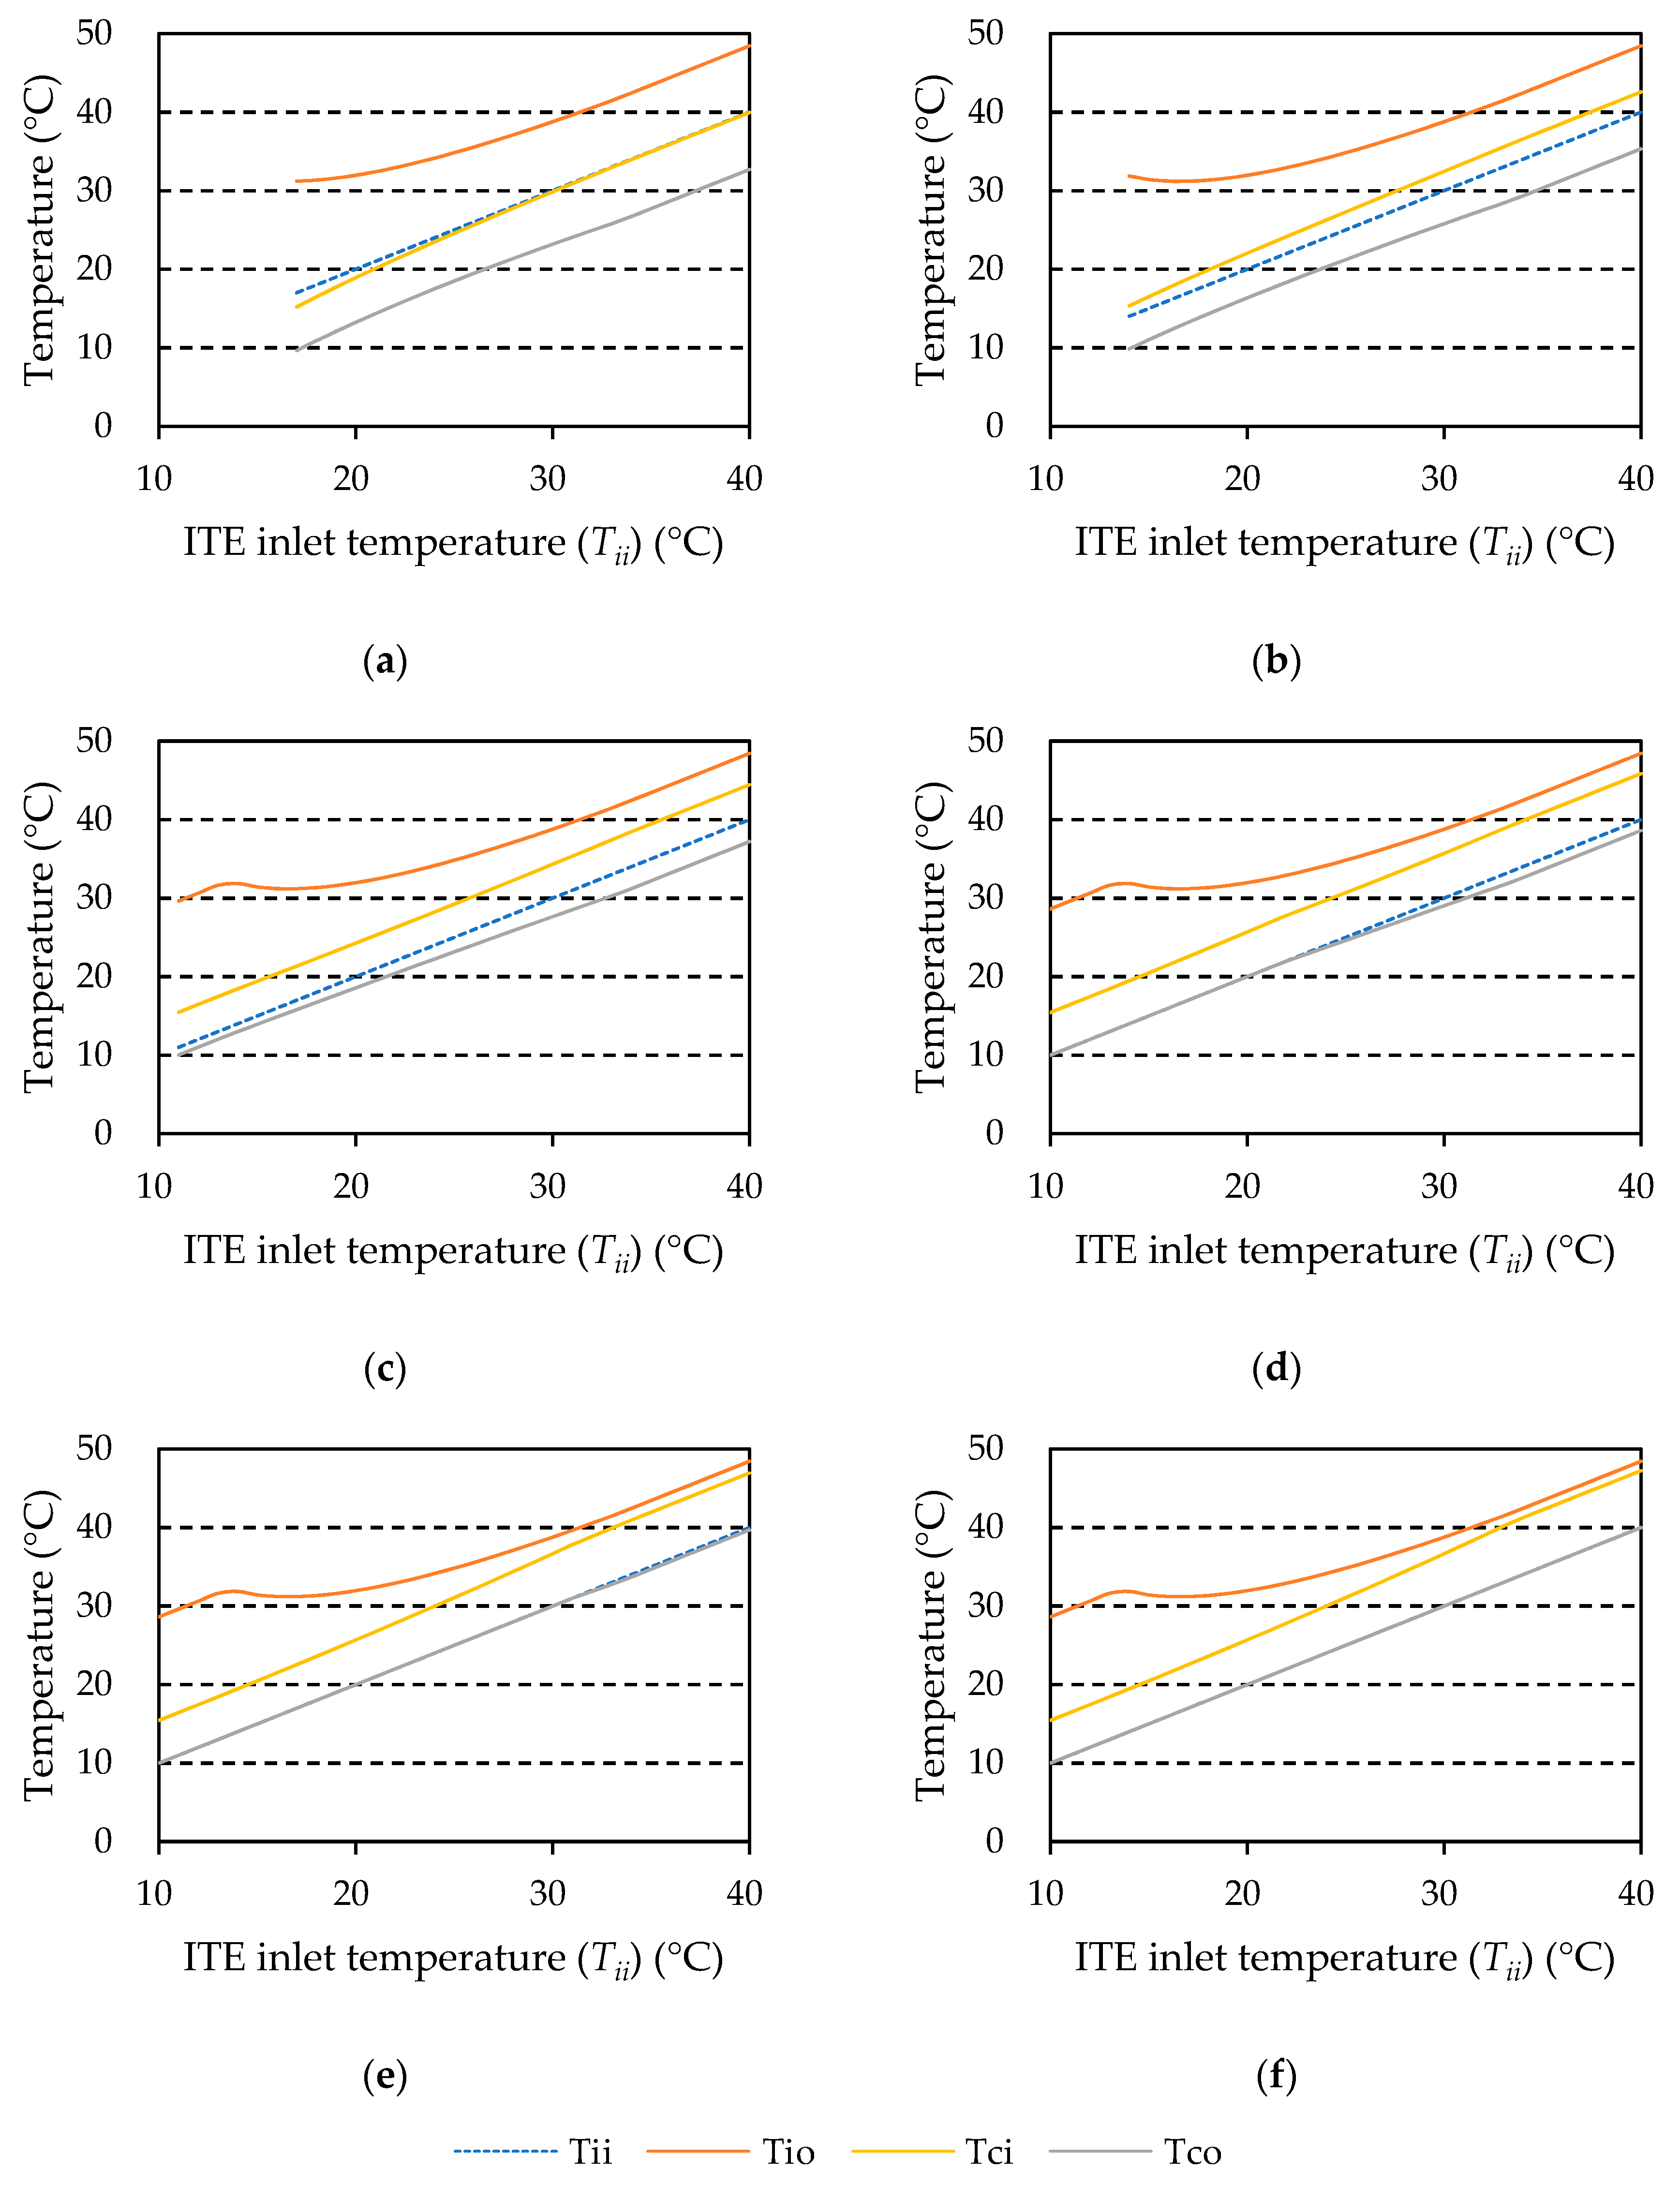
6.2.1. Prediction Results for Inside Environment
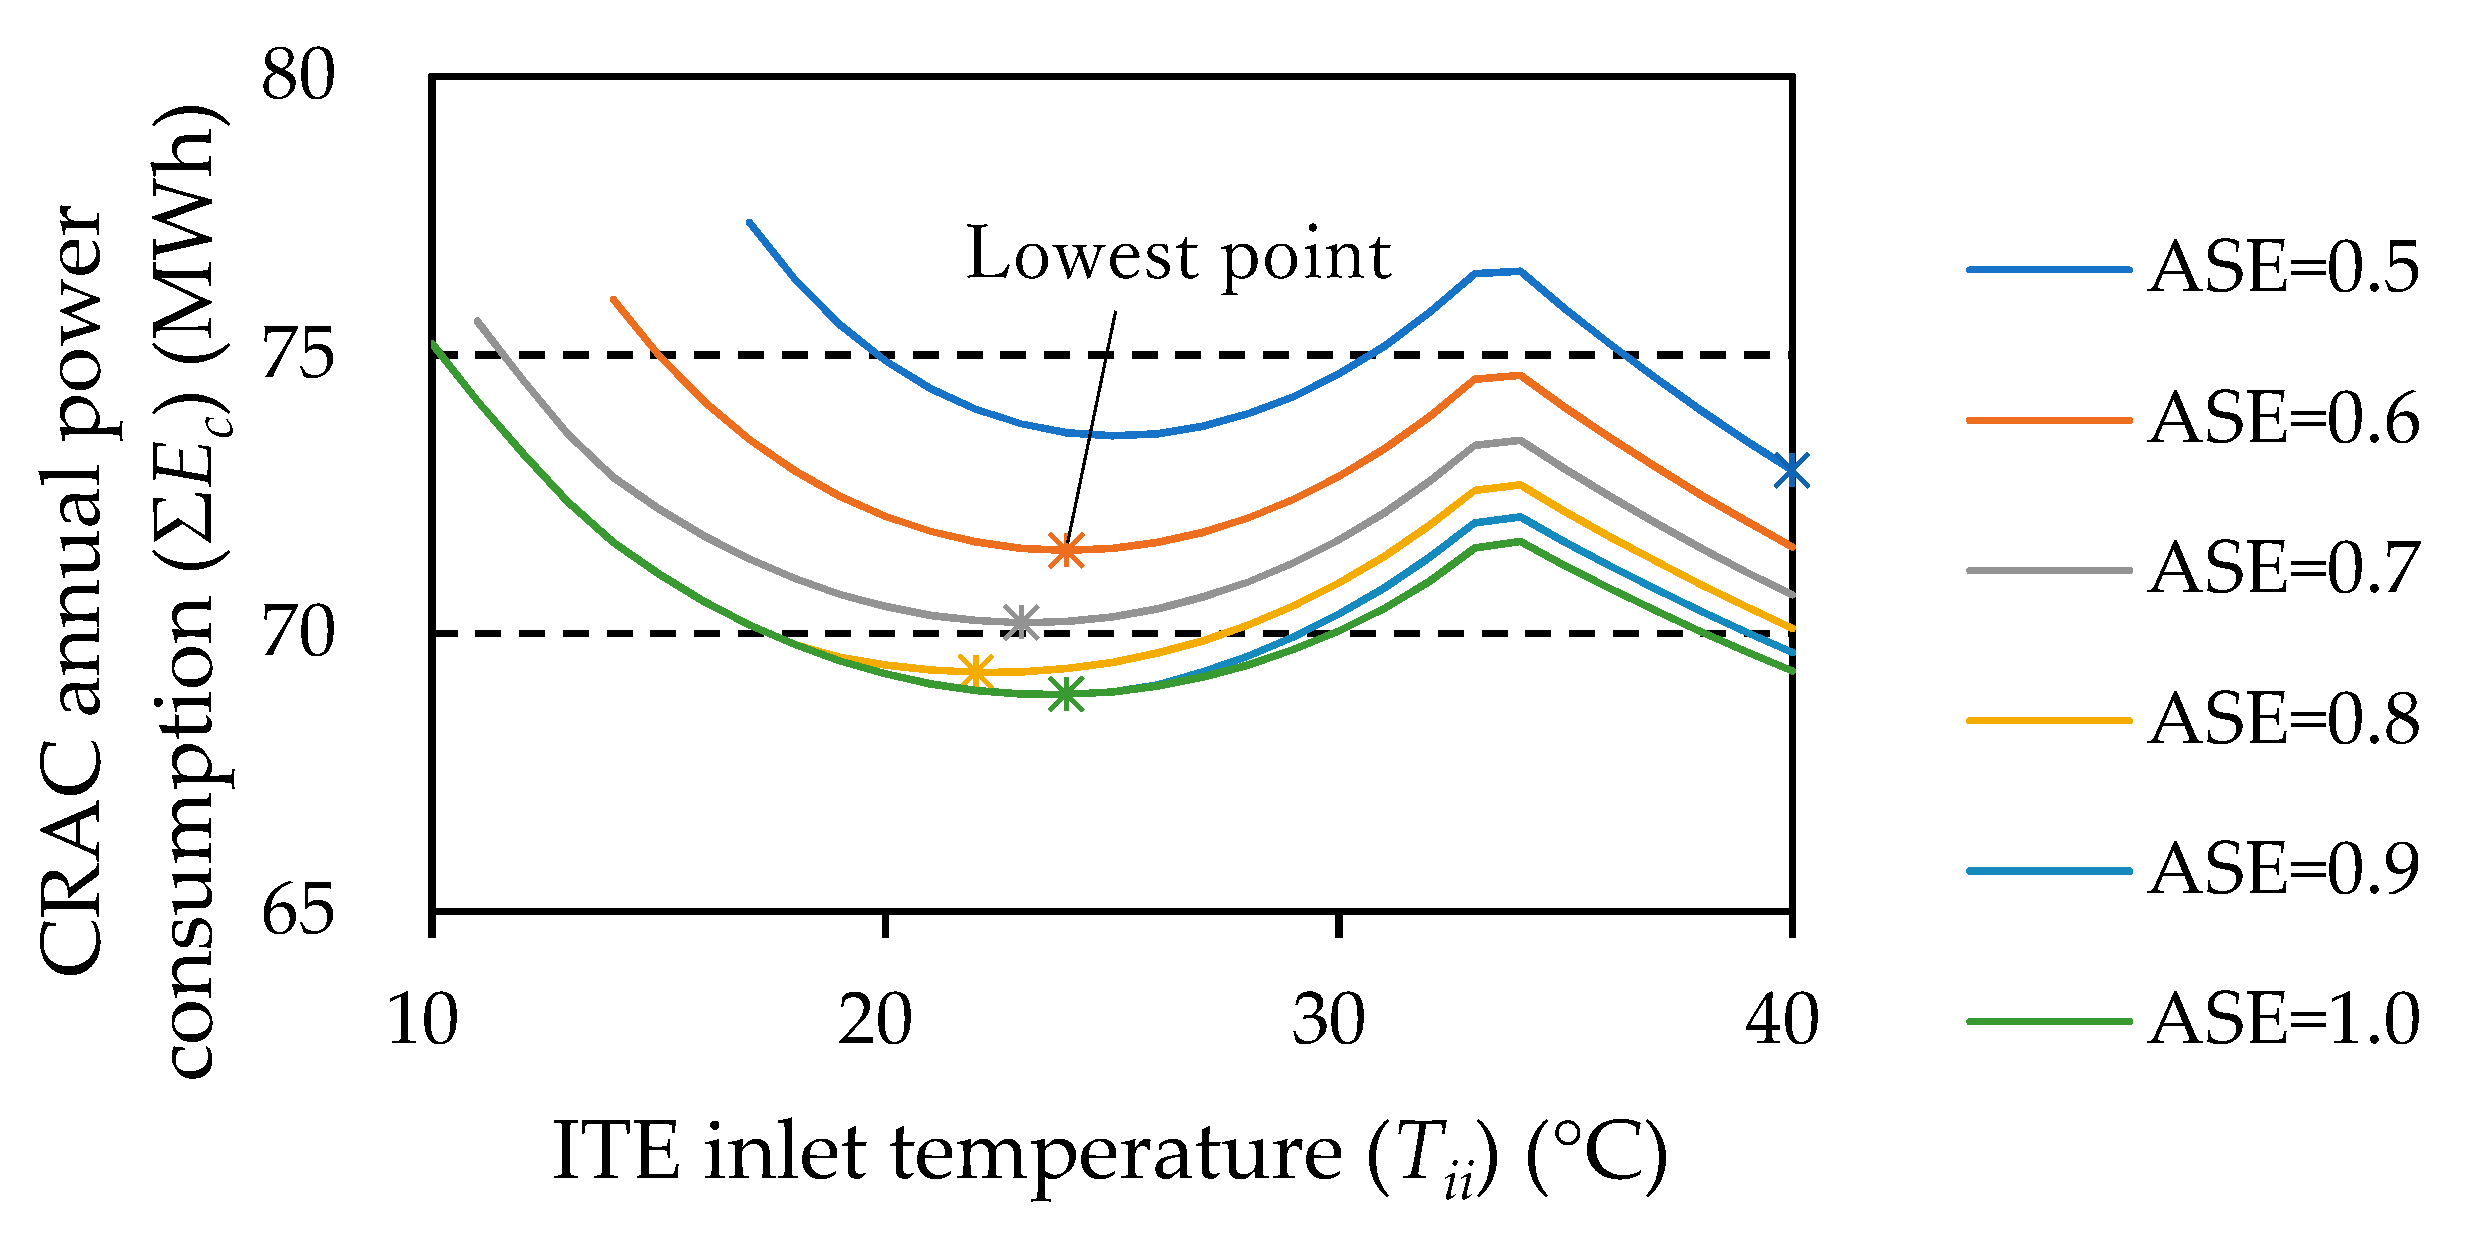
6.2.2. Prediction Results for Power Consumption of CRAC
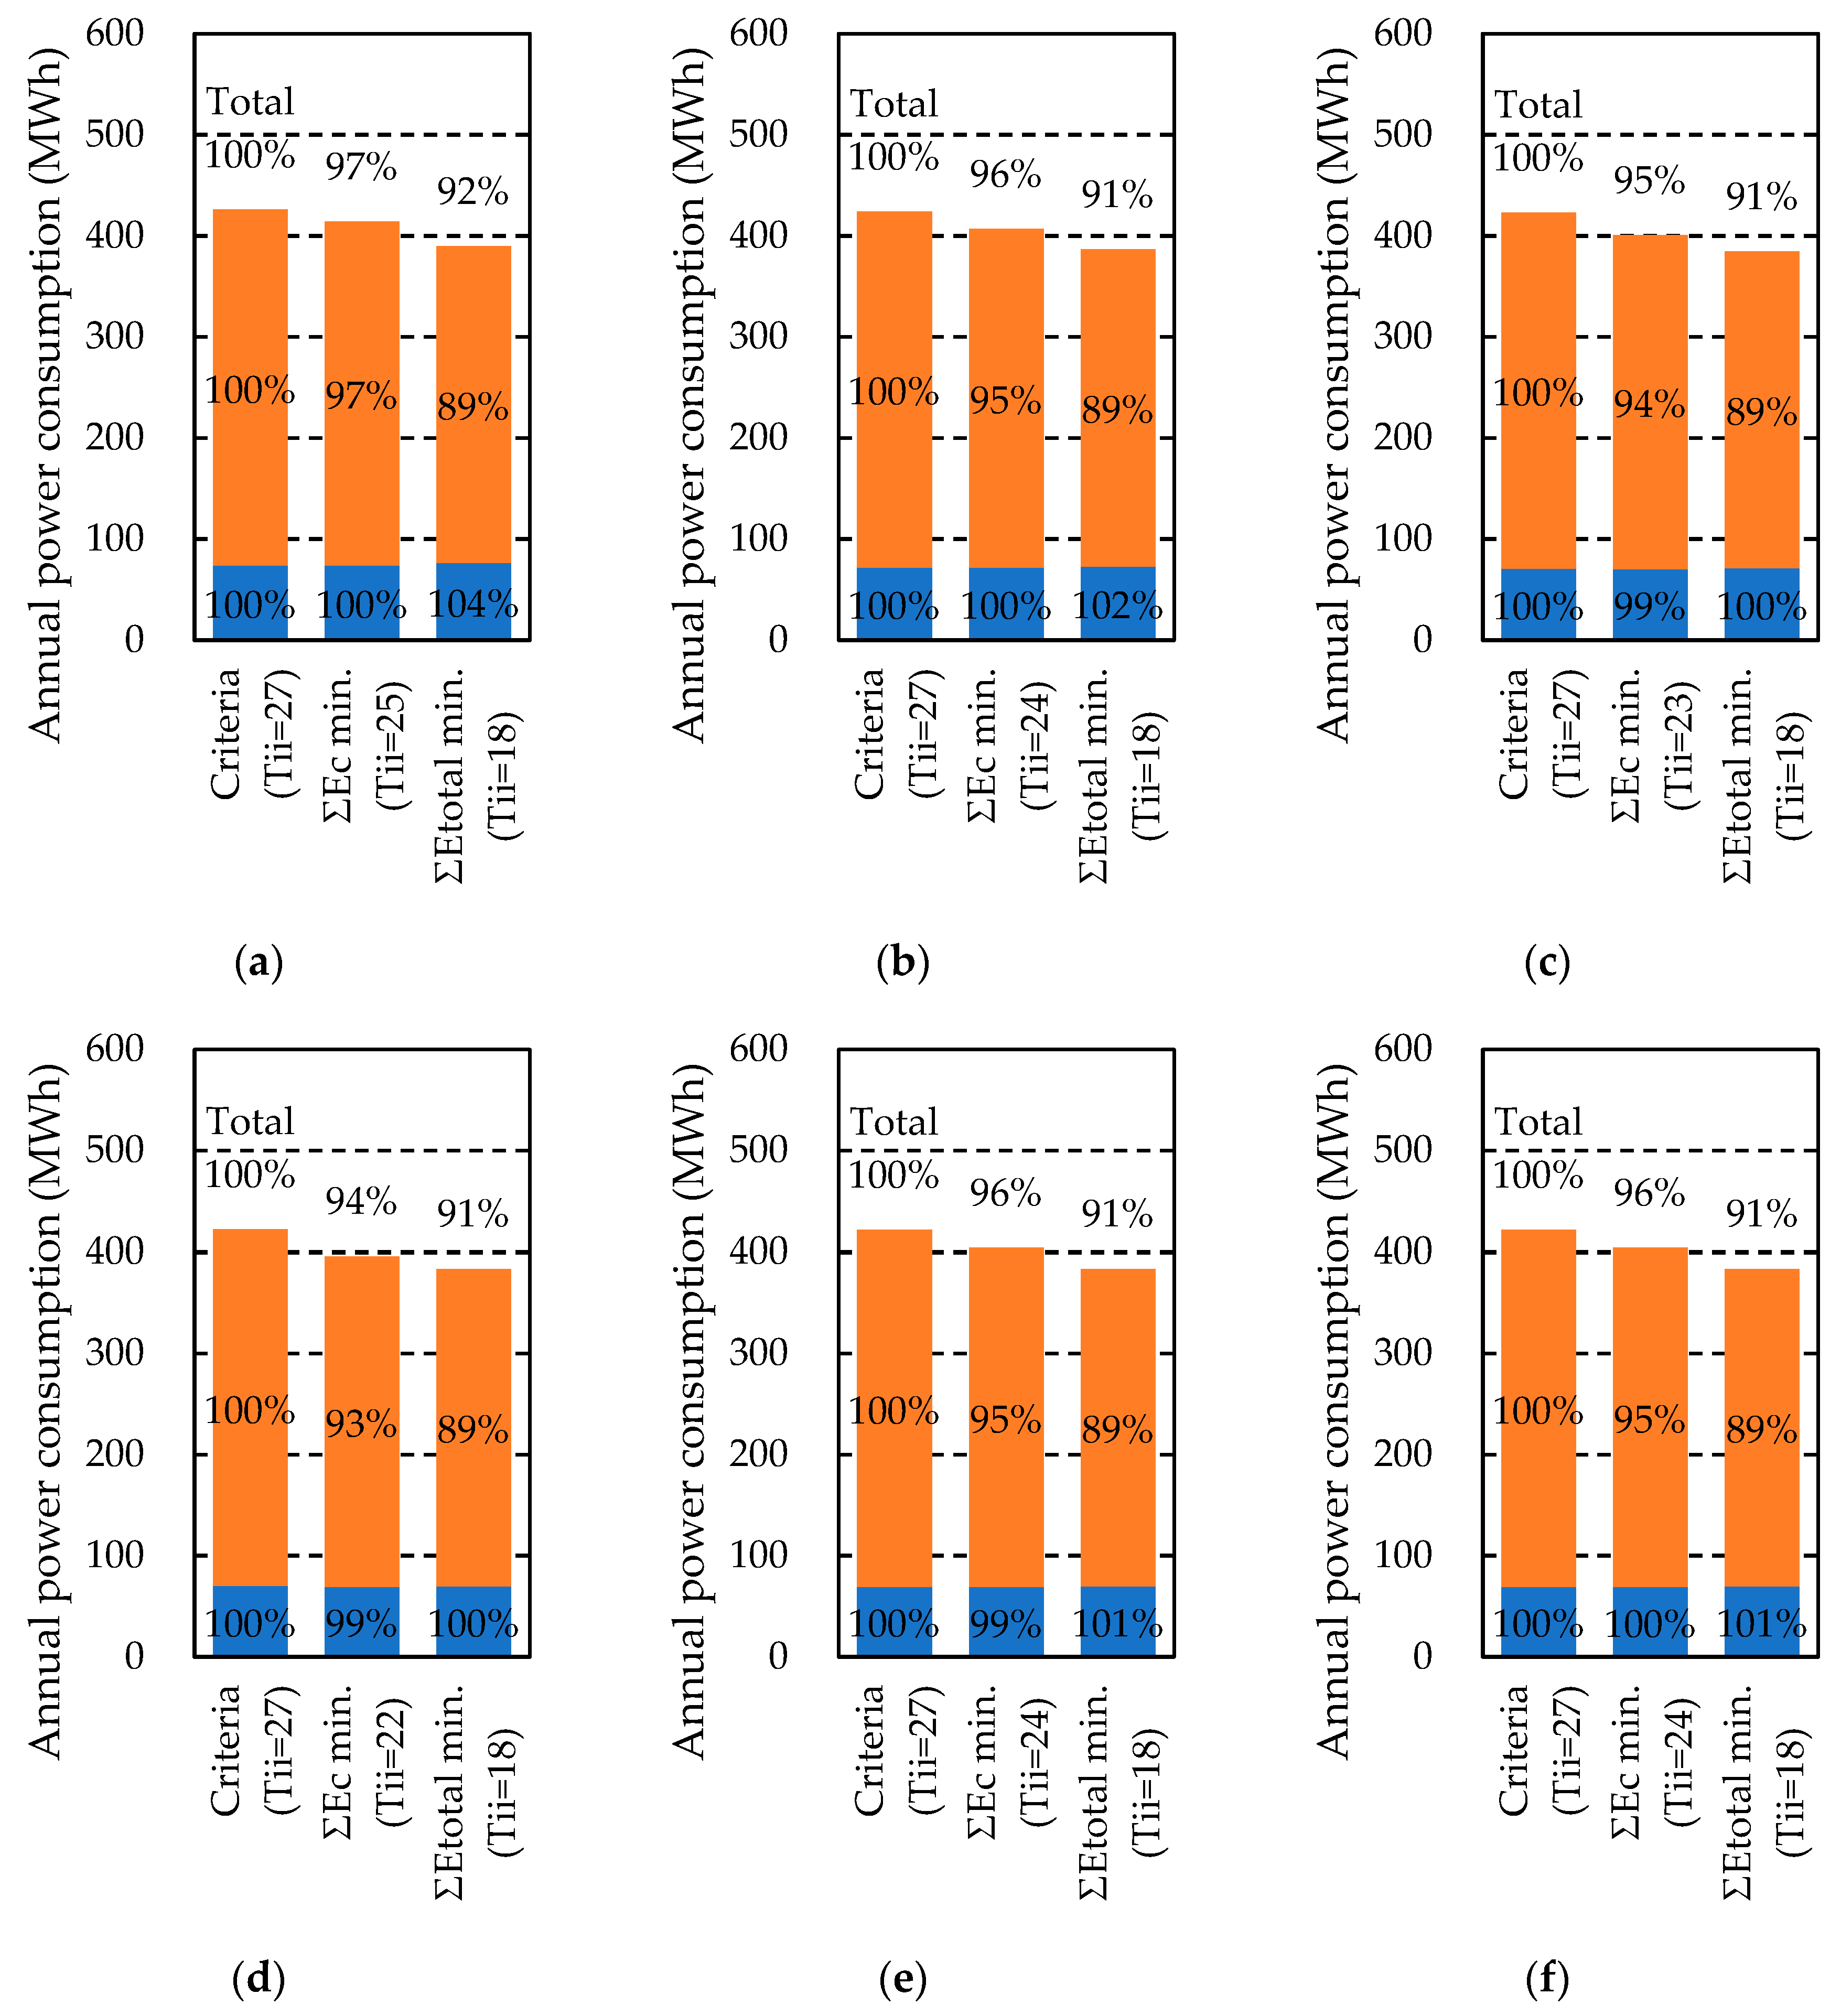
6.2.3. Optimization of Total Energy
7. Concluding Remarks
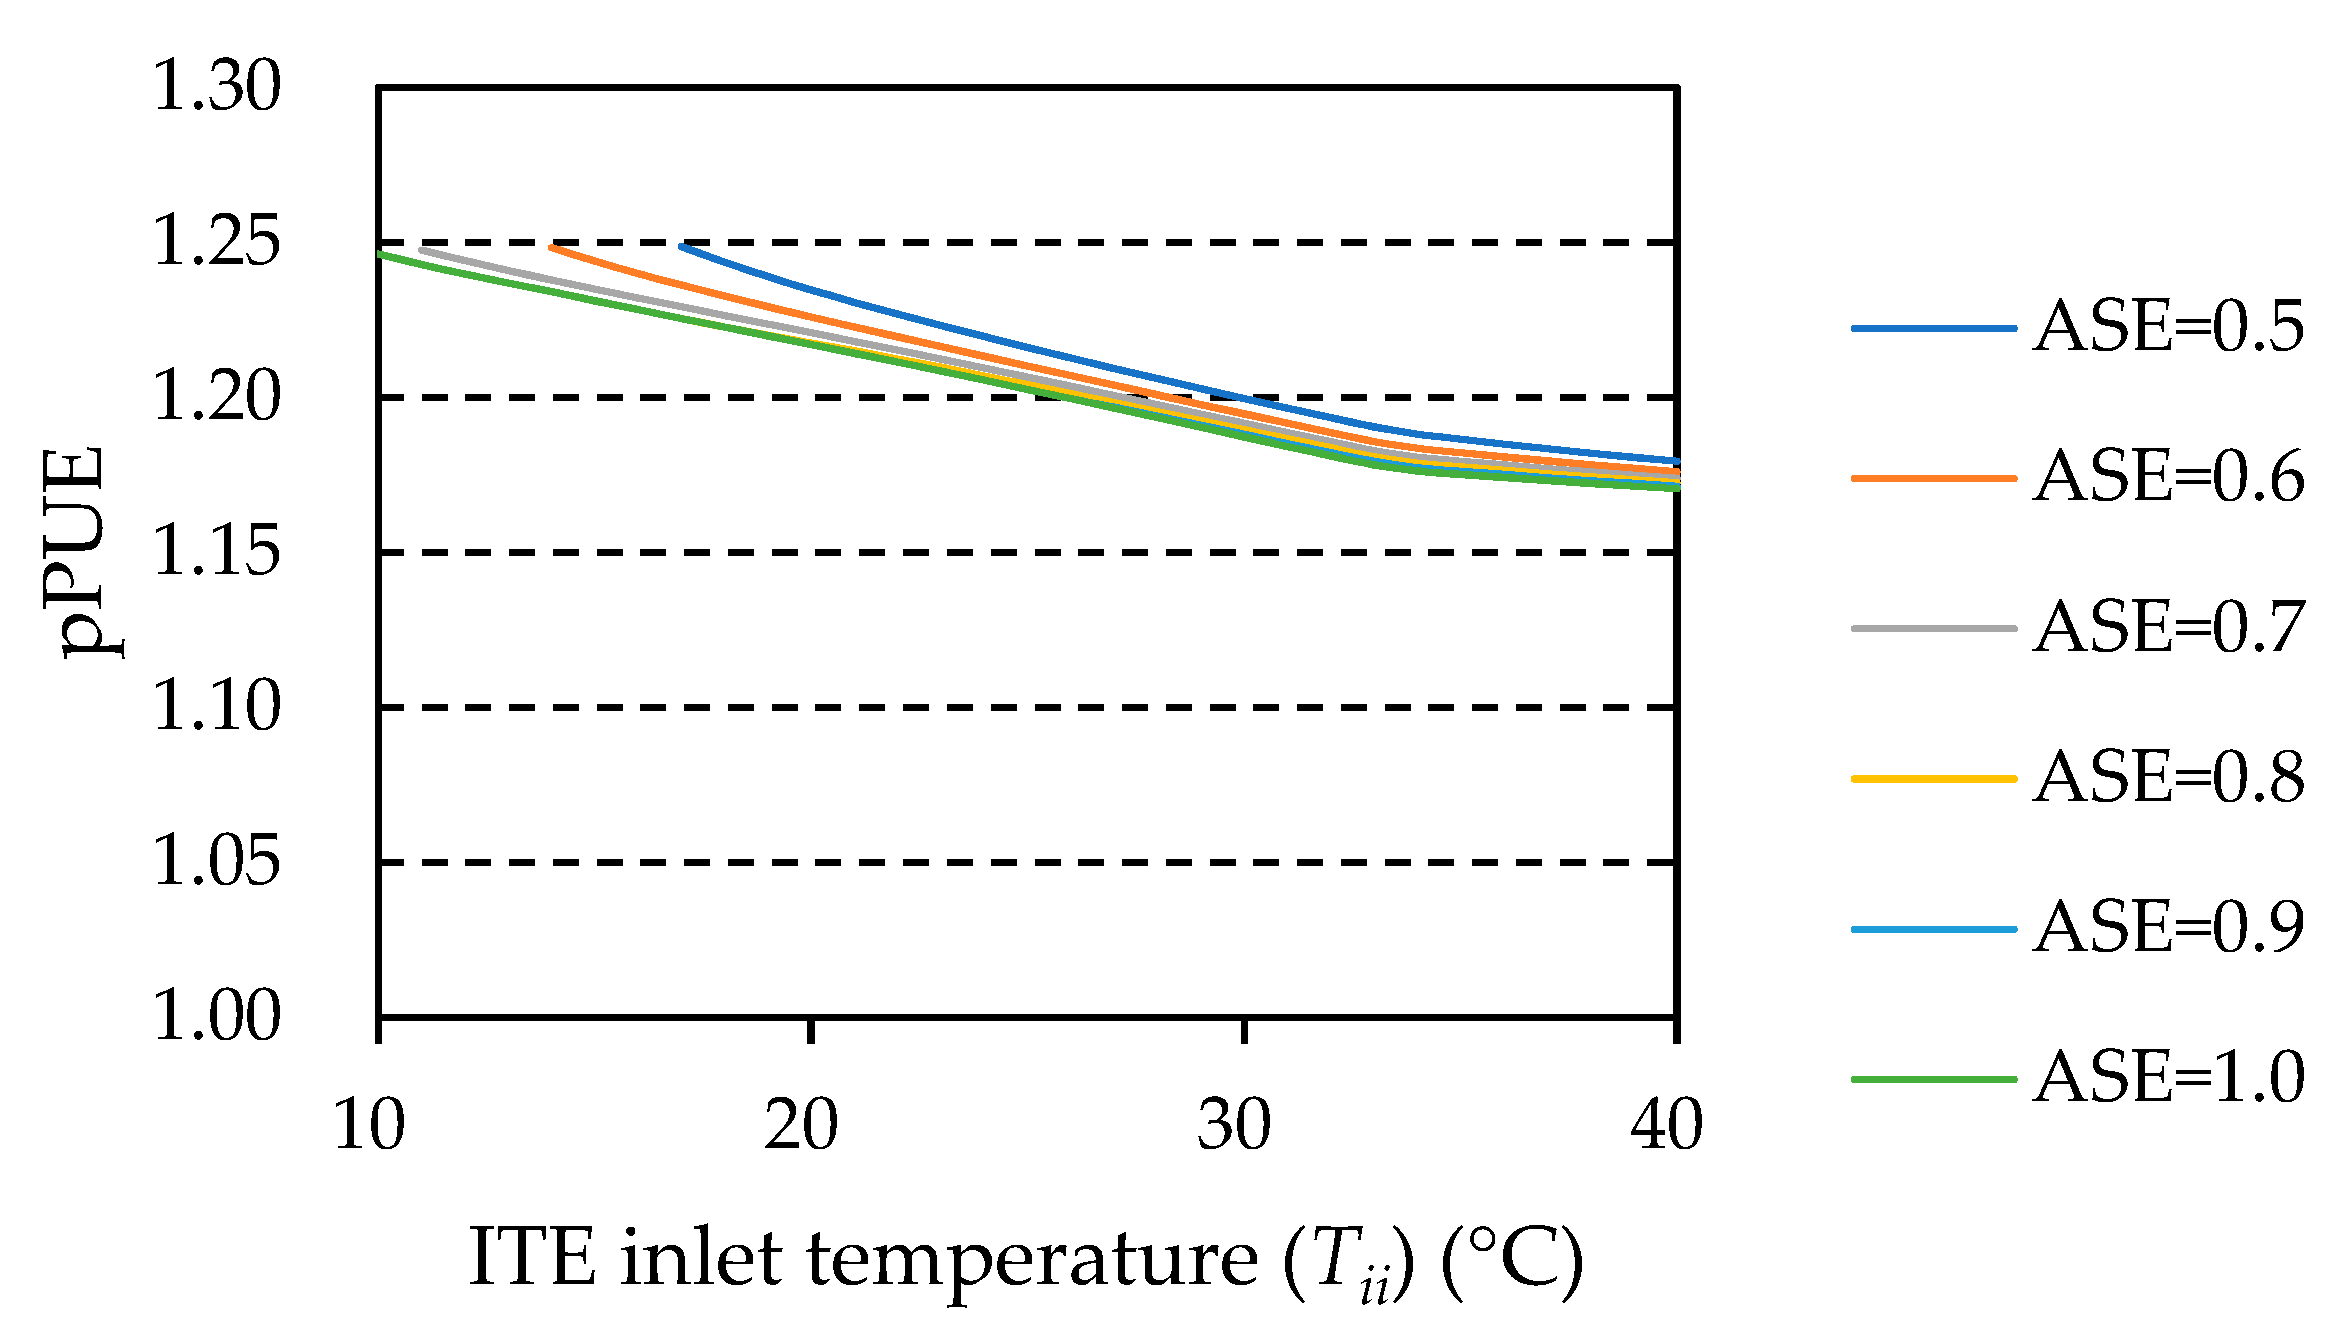
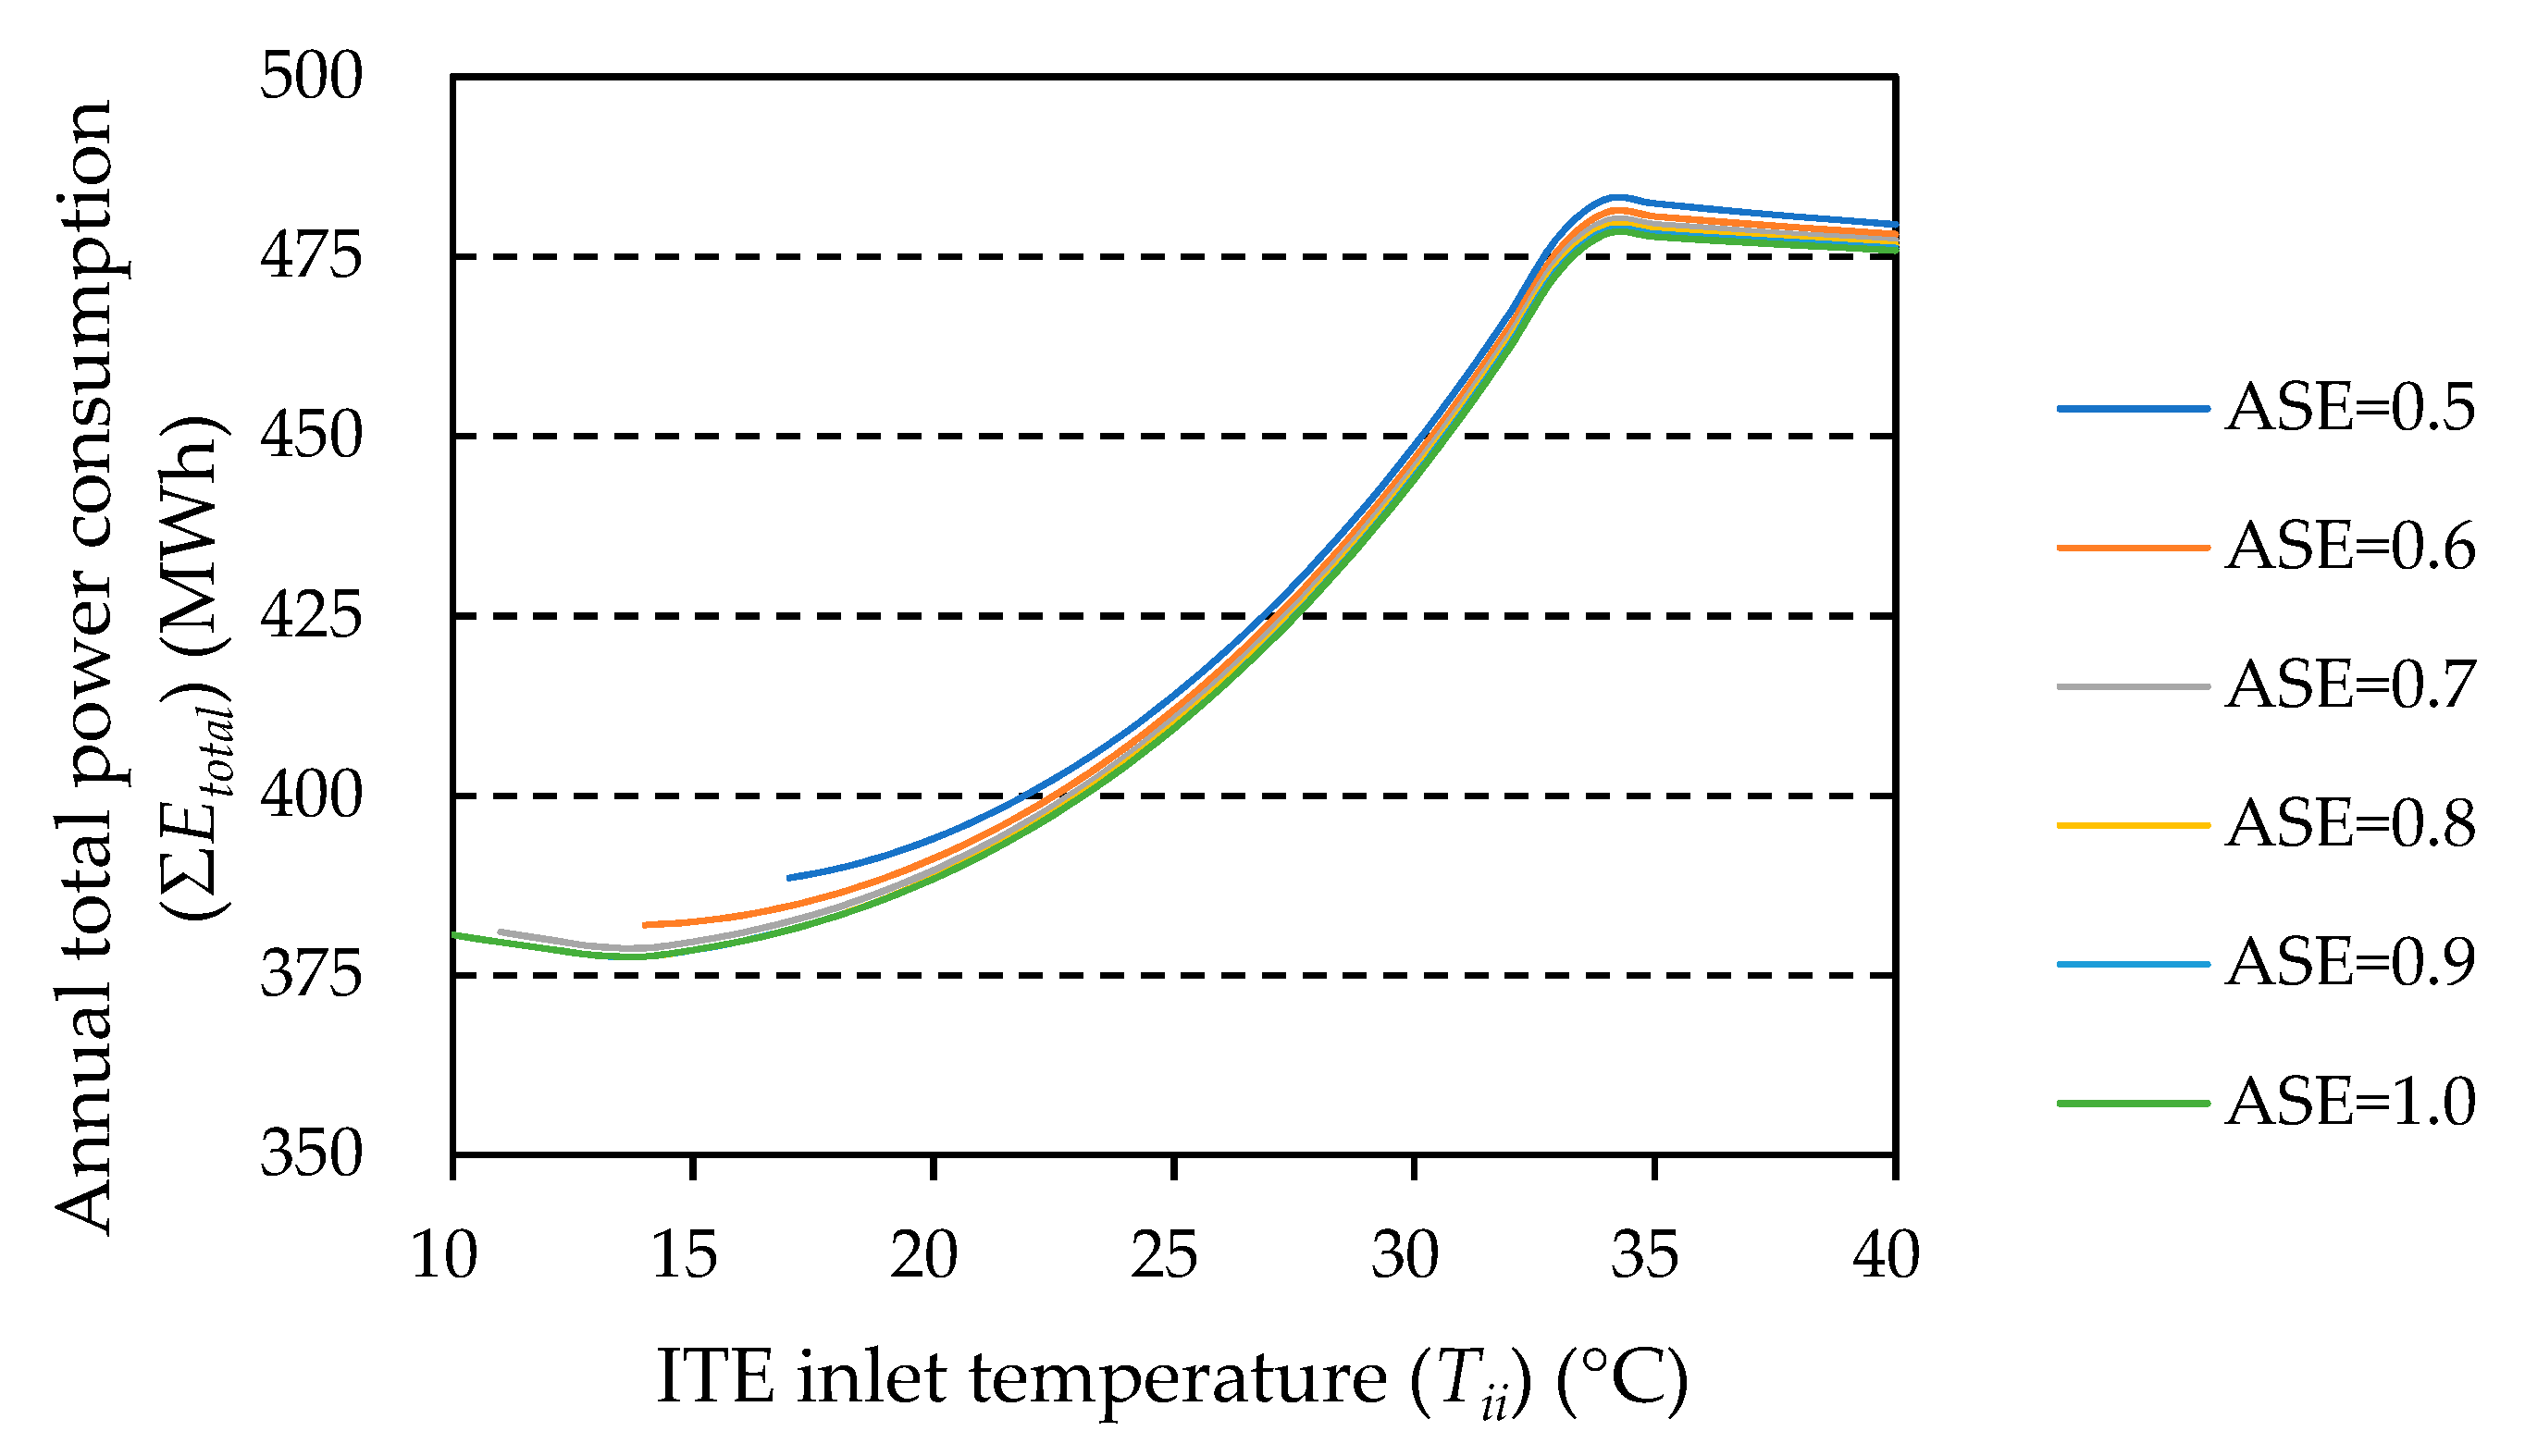
- The results of the trial calculation assuming a machine room with an ASE in the range of 0.5 to 1.0 and using the characteristics of a certain CRAC as an example revealed that (i) to minimize the annual power consumption of the CRAC, the ITE inlet temperature should be selected in the range of 22 to 24 °C, and (ii) to minimize the annual total energy consumption of the machine room, it is better to select the highest ITE inlet temperature among those that give the lowest rotation speed of the ITE’s built-in fan.
- Within the recommended environmental range of the ASHRAE thermal guidelines (ITE inlet temperature of 18 °C to 27 °C), the total energy consumption was lowest when the ITE inlet temperature was 18 °C. It was shown that by lowering the ITE inlet temperature from 27 °C to 18 °C, the annual power consumption of the CRAC will increase; however, annual power consumption of the ITE will be significantly reduced, so the total energy consumption will be reduced by 8 to 9%.
Author Contributions
Funding
Acknowledgments
Conflicts of Interest
References
- ASHRAE TC9.9. Thermal Guidelines for Data Processing Environments, 4th ed.; ASHRAE: Atlanta, GA, USA, 2015; ISBN 978-1-939200-03-7. [Google Scholar]
- Shehabi, A.; Smith, S.; Sartor, D.; Brown, R.; Herrlin, M.; Koomey, J.; Masanet, E.; Horner, N.; Azevedo, I.; Lintner, W. United States Data Center Energy Usage Report; Lawrence Berkeley National Lab. (LBNL): Berkeley, CA, USA, 2016. [Google Scholar]
- Keisuke, S.; Shisei, W.; Tsuneo, U.; Kenji, Y. Development of a High-Efficiency Air Cooled Packaged Air-Conditioner for Data Centers. ASHRAE Trans. 2010, 116 Pt 1, 330–335. [Google Scholar]
- Yosuke, U.; Keisuke, S.; Masahide, Y.; Tsuneo, U.; Yasuhiro, N. Development of an Outdoor Air Cooling-Type Air-Cooled Package Air Conditioner for Data Centers. ASHRAE Trans. 2013, 119 Pt 1, 167–175. [Google Scholar]
- Masaki, N.; Hirofumi, H.; Masatoshi, N. Which Cooling Air Supply System is Better for a High Heat Density Room: Underfloor or Overhead? In Proceedings of the 13th International Telecommunications Energy Conference (INTELEC’91), Kyoto, Japan, 5–8 November 1991; pp. 393–400. [Google Scholar]
- Shrivastava, S.; Sammakia, B.; Schmidt, R.; Iyengar, M. Comparative Analysis of Different Data Center Airflow Management Configurations. In Proceedings of the ASME 2005 Pacific Rim Technical Conference and Exhibition on Integration and Packaging of MEMS, NEMS, and Electronic Systems collocated with the ASME 2005 Heat Transfer Summer Conference (IPACK2005), San Francisco, CA, USA, 17–22 July 2005; pp. 329–336. [Google Scholar]
- Ham, S.-W.; Park, J.-S.; Jeong, J.-W. Optimum Supply Air Temperature Ranges of Various Air-side Economizers in a Modular Data Center. Appl. Therm. Eng. 2015, 77, 163–179. [Google Scholar] [CrossRef]
- Durand-Estebe, B.; Bot, C.L.; Mancos, J.N.; Arquis, E. Simulation of a Temperature Adaptive Control Strategy for an IWSE Economizer in a Data Center. Appl. Energy 2014, 134, 45–56. [Google Scholar] [CrossRef]
- Agrawal, A.; Khichar, M.; Jain, S. Transient Simulation of Wet Cooling Strategies for a Data Center in Worldwide Climate Zones. Energy Build. 2016, 127, 352–359. [Google Scholar] [CrossRef]
- ASHRAE Terminology. Available online: https://xp20.ashrae.org/terminology/ (accessed on 21 September 2020).
- ASHRAE TC9.9. Particulate and Gaseous Contamination in Datacom Environments; ASHRAE: Atlanta, GA, USA, 2009; ISBN 978-1-933742-60-1. [Google Scholar]
- Hum, S.-W.; Kim, M.-H.; Choi, B.-N.; Jeong, J.-W. Energy Saving Potential of Various Air-side Economizers in a Modular Data Center. Appl. Energy 2015, 138, 258–275. [Google Scholar] [CrossRef]
- ENERGY STAR® Program Requirements Product Specification for Computer Servers. Available online: https://www.energystar.gov/sites/default/files/ENERGY%20STAR%20Version%203.0%20Computer%20Servers%20Program%20Requirements.pdf (accessed on 8 September 2020).
- ASHRAE TC9.9. IT Equipment Design Impact on Data Center Solutions; ASHRAE: Atlanta, GA, USA, 2016; ISBN 978-1-939200-20-4. [Google Scholar]
- Wang, Z.; Bash, C.; Tolia, N.; Marwah, M.; Zhu, X.; Ranganathan, P. Optimal Fan Speed Control for Thermal Management of Servers. In Proceedings of the ASME 2009 InterPACK Conference collocated with the ASME 2009 Summer Heat Transfer Conference and the ASME 2009 3rd International Conference on Energy Sustainability (IPACK2009), San Francisco, CA, USA, 19–23 July 2009; pp. 709–719. [Google Scholar]
- ASHRAE TC9.9. Best Practices for Datacom Facility Energy Efficiency; ASHRAE: Atlanta, GA, USA, 2008; ISBN 978-1-933742-27-4. [Google Scholar]
- Energy Impact of Increased Server Inlet Temperature, White Paper 138, Rev. 1. Available online: https://it-resource.schneider-electric.com/white-papers/wp-138-energy-impact-of-increased-server-inlet-temperature (accessed on 21 September 2020).
- Tozer, R.; Whitehead, B.; Flucker, S. Data Center Air Segregation Efficiency. ASHRAE Trans. 2015, 121, 454–461. [Google Scholar]
- Naoki, F.; Hirofumi, H.; Taro, M.; Koki, K.; Noriyuki, T. A Prediction Method for Cooling Characteristics of ICT Equipment Considering Recirculation. J. Environ. Eng. 2013, 78, 409–418. (In Japanese) [Google Scholar]
- Schmidt, R.; Iyengar, M.; Beaty, D.; Shrivastava, S. Thermal Profile of a High-Density Data Center: Hot Spot Heat Fluxes of 512 W/ft2. ASHRAE Trans. 2005, 111 Pt 2, 765–777. [Google Scholar]
- Kosuke, S.; Takeshi, A.; Masayoshi, K.; Takeshi, W. A Temperature-Risk and Energy-Saving Evaluation Model for Supporting Energy-Saving Measures for Data Center Server Rooms. Energies 2020, 13, 5222. [Google Scholar]
- 2020 Best Practice Guidelines for the EU Code of Conduct on Data Centre Energy Efficiency, Version 11.1.0 (Final Version). Available online: https://e3p.jrc.ec.europa.eu/publications/2020-best-practice-guidelines-eu-code-conduct-data-centre-energy-efficiency (accessed on 24 September 2020).
- EnergyPlus Weather Data. Available online: https://energyplus.net/weather (accessed on 1 October 2020).


| Step | Input | Output | Calculation Method |
|---|---|---|---|
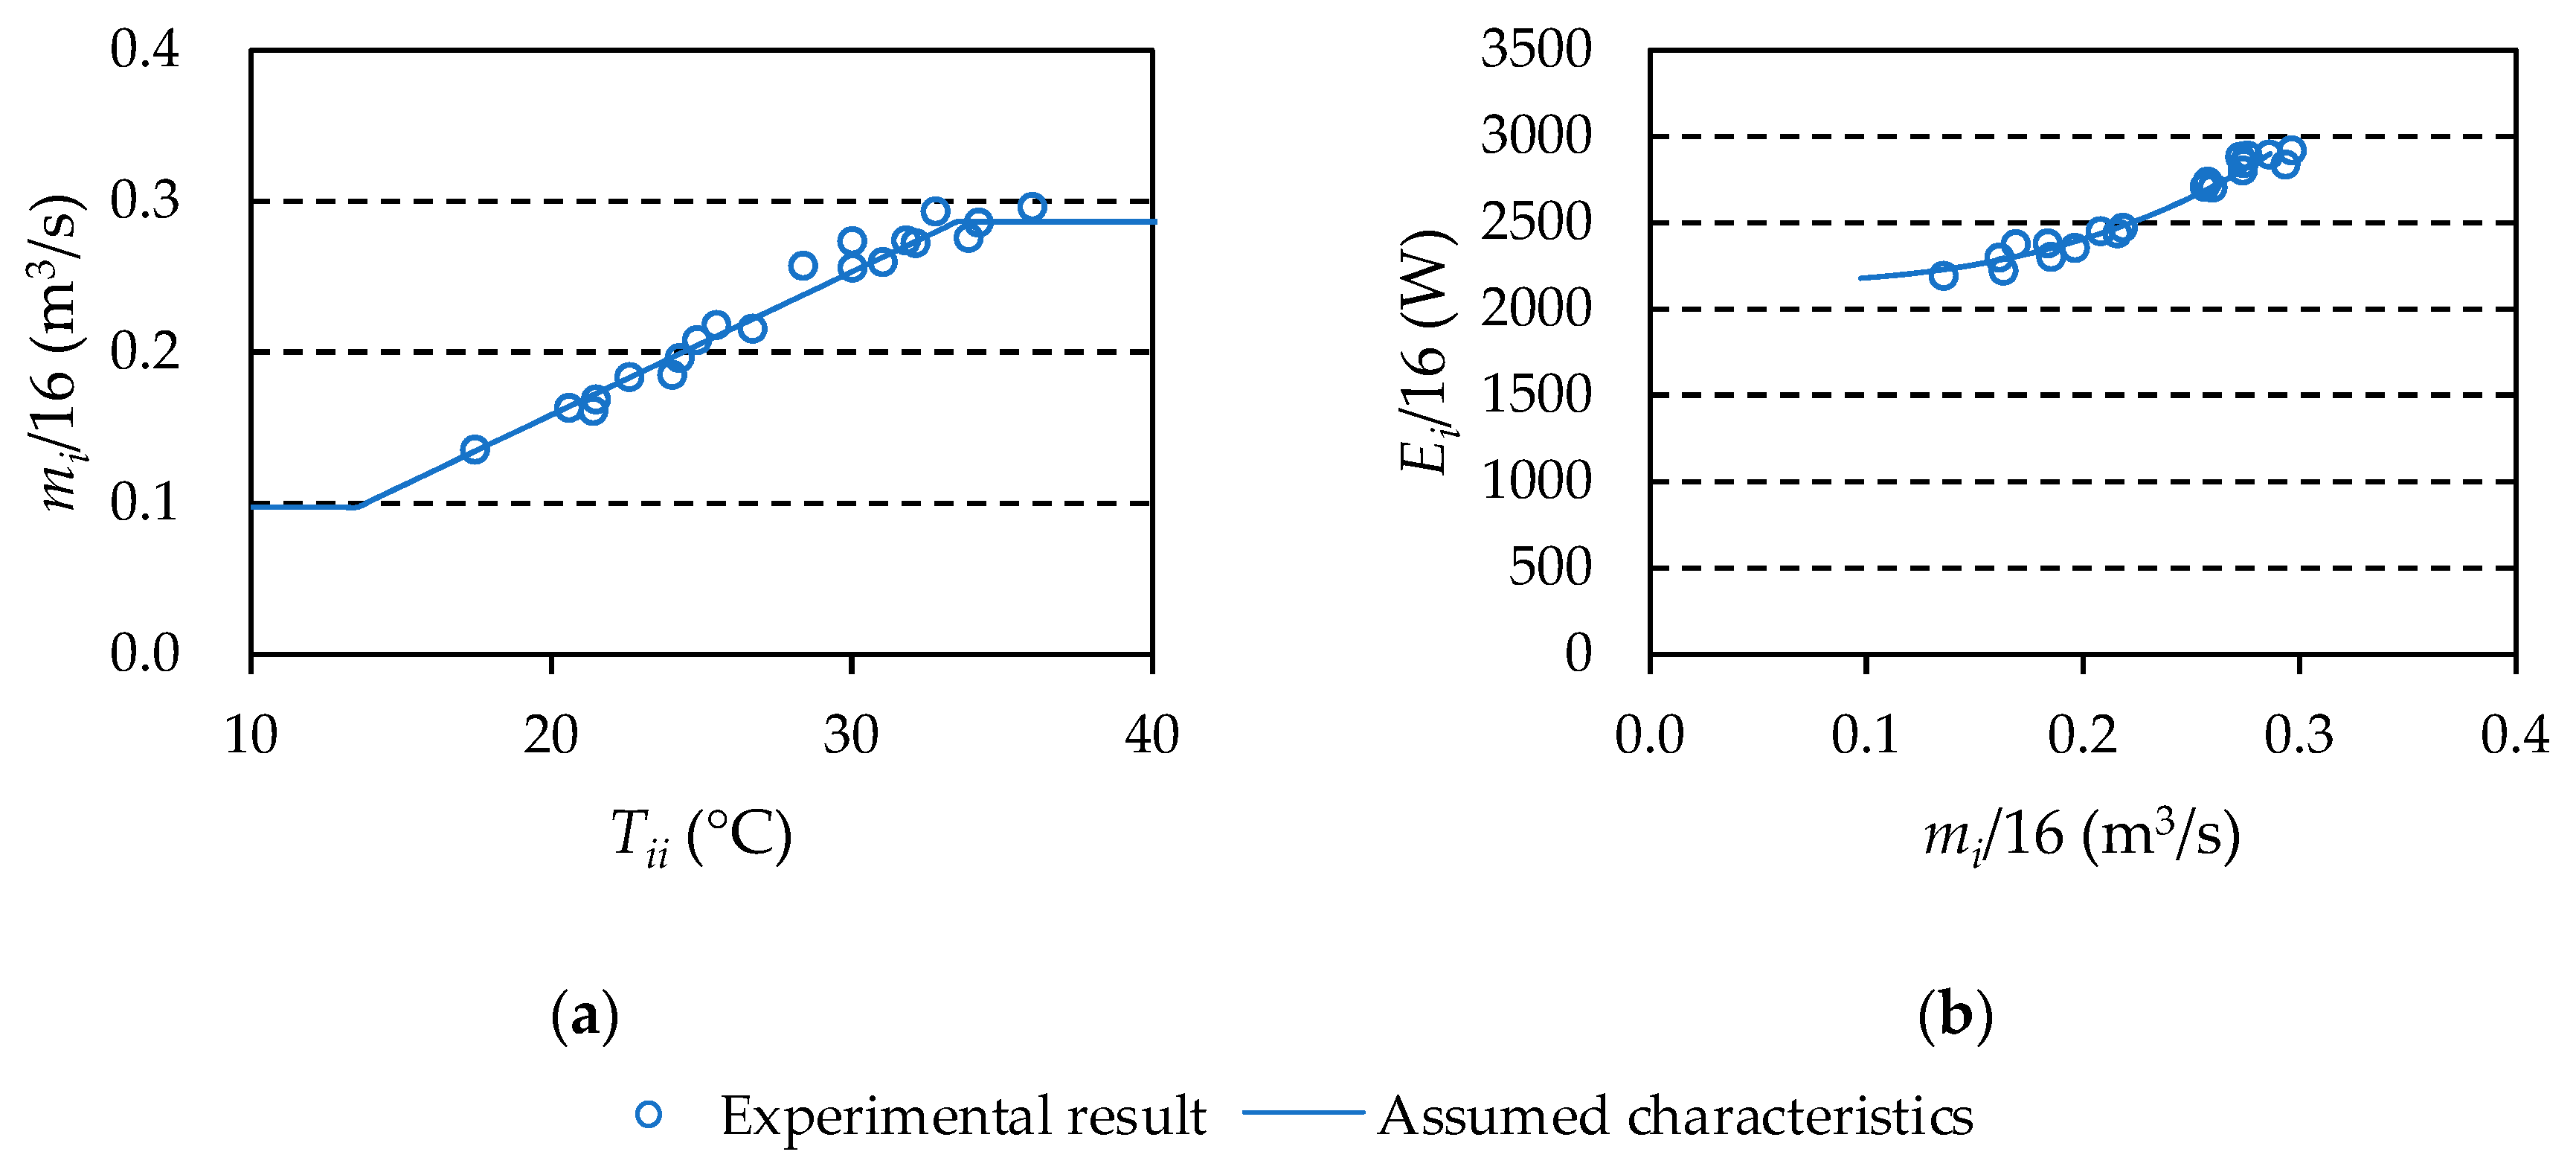
| 1 | Tii (given condition) | mi | Empirical formula, etc. (e.g., Equation (9) and Figure 14a) |
| 2 | mi | Ei | Empirical formula, etc. (e.g., Equation (10) and Figure 14b) |
| 3 | Tii, mi, Ei | Tio | |
| 4 | mc (given condition), mi | Af | Equation (5) |
| 5 | ASE (given condition), Af | R | Equation (8) |
| 6 | Tii, Tio, R | Tco | Equation (2) |
| 7 | Tco, mc, Ei1 | Tci | |
| 8 | Outside air conditions and Tci 2, Ei 1, etc. | Ec | Empirical formula, etc. (e.g., Section 6.1.3) |
| CRAH | Cooling capacity Return-air conditions Water conditions Airflow, ESP | 48.6 kW (sensible) 24.0 °CDB, 50%RH 7–12 °C, 2.87 L/s 4.3 m3/s, 100 Pa |
| CRAC | Cooling capacity Return-air conditions Outdoor-air conditions Airflow, ESP | 45.0 kW (sensible) 27.0 °CDB, 19.0 °CWB 35.0 °CDB 4.0 m3/s, 120 Pa |
| Heat load | Target rack | 1U server (Company A) × 12 or 2 kW heat generator × 1 |
| Nontarget rack | 2 kW heat generator × 1 |
| Server | 1U server (Company A) (Model sold in 2012) |
| Main specifications | CPU: 10-core (3.0 GHz) × 1 Storage: HDD (300 GB) × 1 Memory: 8 GB × 1 |
| Power-supply specifications | Single-phase 100 VAC, 1.91 A (maximum) |
| Item | Instrument |
|---|---|
| Server inlet/outlet temperature (3 points, 5 times) | Type-T thermocouple, data logger (GRAPHTEC, GL840) |
| Power consumption (all servers) | Power meter (HIOKI, 3168) |
| Server fan speed (each server) | Management tool mounted in server |
| Experimental Conditions | CAC | Blanking Panel | CPU Utilization % | Supply-Air-Temperature Set Point °C |
|---|---|---|---|---|
| A-1 | No | No | 0 | 15, 19, 23, 27, 31 |
| A-2 | No | No | 50 | 15, 19, 23, 27, 31 |
| A-3 | No | No | 100 | 15, 19, 23, 27, 31 |
| B-1 | No | No | 100 | 15, 19, 23, 27, 31 |
| B-2 | No | Yes | 100 | 15, 19, 23, 27, 31 |
| B-3 | Yes | No | 100 | 15, 19, 23, 27, 31 |
| B-4 | Yes | Yes | 100 | 15, 19, 23, 27, 31 |
| Experimental Conditions | CAC | HAC | Blanking Panel | Airflow Scheme |
|---|---|---|---|---|
| C-1 C-2 | Yes Yes | - - | No Yes | Raised-floor supply room return |
| D-1 D-2 | - - | Yes Yes | No Yes | Raised-floor supply ceiling return |
| Additional Number | Voltage (V) | Assumed Airflow Rate (m3/s) |
|---|---|---|
| -1 | 26.4 | 0.24 |
| -2 | 23.0 | 0.22 |
| -3 | 19.5 | 0.21 |
| -4 | 17.2 | 0.19 |
| -5 | 15.5 | 0.17 |
| Item | Instrument |
|---|---|
| Supply-air temperature (3 points) Return-air temperature (6 points) | Type-T thermocouple, data logger (GRAPHTEC, GL840) |
| Heat-generator inlet/outlet temperature (1 point/server) | Type-T thermocouple, data logger (GRAPHTEC, GL840 and GL820) |
| Power consumption (all servers) | Power meter (HIOKI, PW3365 and 3168) 1 Power meter (Panasonic, T3720N) 2 |
| Rated condition | Cooling capacity Energy consumption Return-air conditions Outdoor-air condition Airflow, external static pressure (ESP) | 63.0 kW (sensible) 21.6 kW 27.0 °C DB, 19.0 °C WB 35.0 °C DB 5.3 m3/s, 120 Pa |
| Control setting | Capacity control Airflow control | Inverter speed control Fixed airflow rate |
Publisher’s Note: MDPI stays neutral with regard to jurisdictional claims in published maps and institutional affiliations. |
© 2020 by the authors. Licensee MDPI, Basel, Switzerland. This article is an open access article distributed under the terms and conditions of the Creative Commons Attribution (CC BY) license (http://creativecommons.org/licenses/by/4.0/).
Share and Cite
Futawatari, N.; Udagawa, Y.; Mori, T.; Hayama, H. Impact of Fan Airflow of IT Equipment on Thermal Environment and Energy Consumption of a Data Center. Energies 2020, 13, 6166. https://doi.org/10.3390/en13236166
Futawatari N, Udagawa Y, Mori T, Hayama H. Impact of Fan Airflow of IT Equipment on Thermal Environment and Energy Consumption of a Data Center. Energies. 2020; 13(23):6166. https://doi.org/10.3390/en13236166
Chicago/Turabian StyleFutawatari, Naoki, Yosuke Udagawa, Taro Mori, and Hirofumi Hayama. 2020. "Impact of Fan Airflow of IT Equipment on Thermal Environment and Energy Consumption of a Data Center" Energies 13, no. 23: 6166. https://doi.org/10.3390/en13236166
APA StyleFutawatari, N., Udagawa, Y., Mori, T., & Hayama, H. (2020). Impact of Fan Airflow of IT Equipment on Thermal Environment and Energy Consumption of a Data Center. Energies, 13(23), 6166. https://doi.org/10.3390/en13236166