Energy Allocation Strategies for Common Property Load Connected to Shared Solar and Battery Storage Systems in Strata Apartments


Abstract
:
1. Introduction
Study Objective
- ➢
- Section 2 discusses electricity consumption in common areas and includes a literature review on energy allocation and distribution in multi-residential buildings.
- ➢
- Section 3 presents the methodology and analysis in detail. Initially, CP load characteristics at WGV are presented, followed by information about the shared microgrid configuration, as well as CP load consumption patterns from three apartments. Thereafter, three energy allocation strategies are explained.
- ➢
- Section 4 presents the results post implementation of the three strategies.
- ➢
- Lastly, Section 5 concludes the paper, highlighting major findings and recommendations for future research.
2. Electricity Consumption in Common Areas
Energy Allocation and Distribution in Multi-Residential Buildings
3. Methodology and Analysis
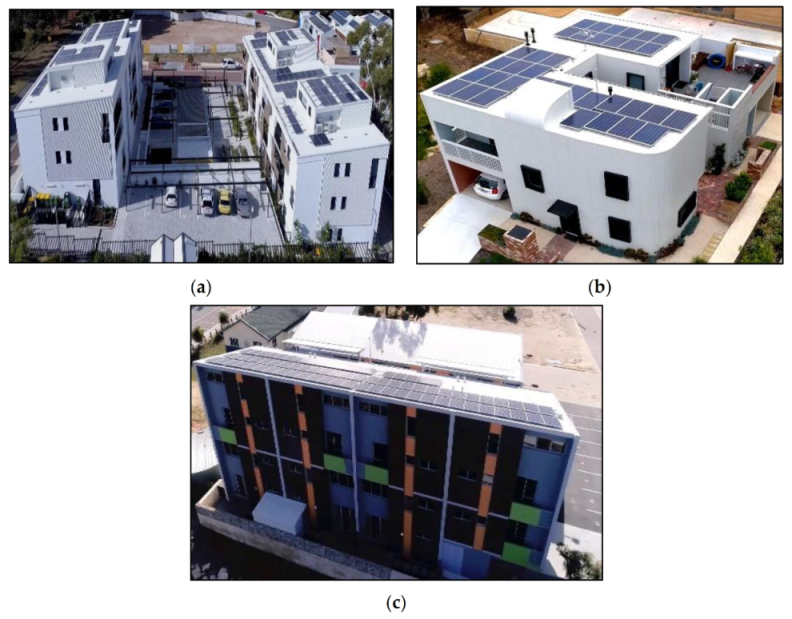
3.1. Common Property Loads at WGV
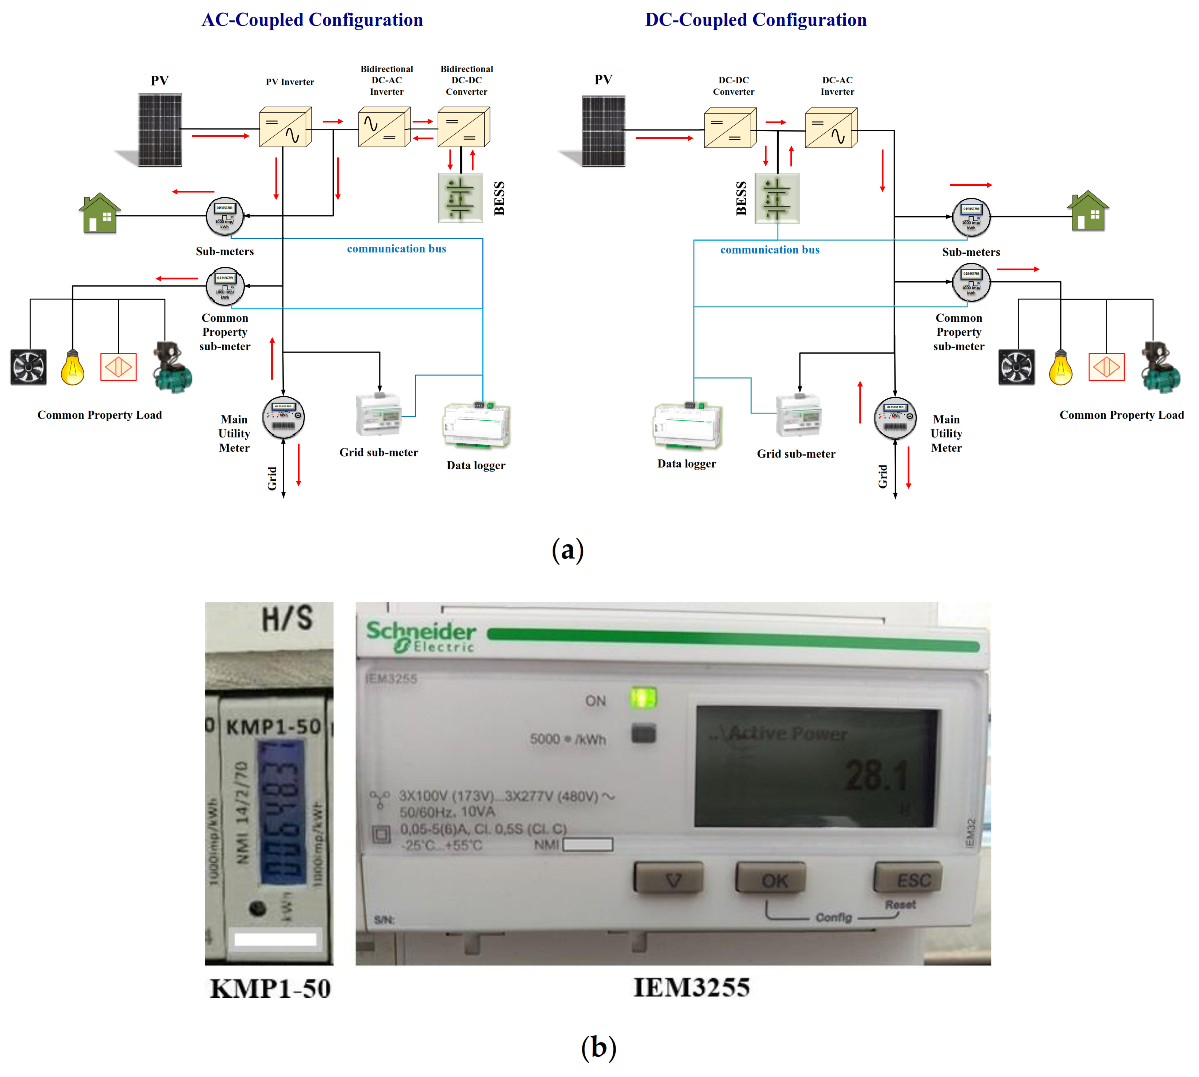
3.2. Shared Microgrid Configurations
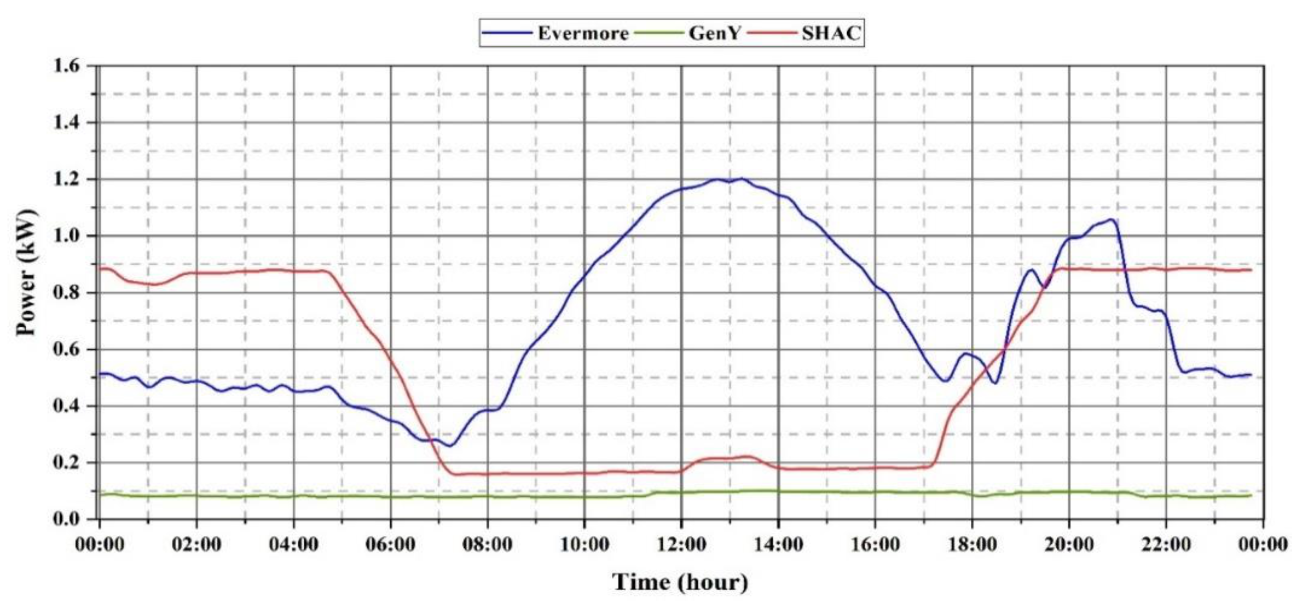
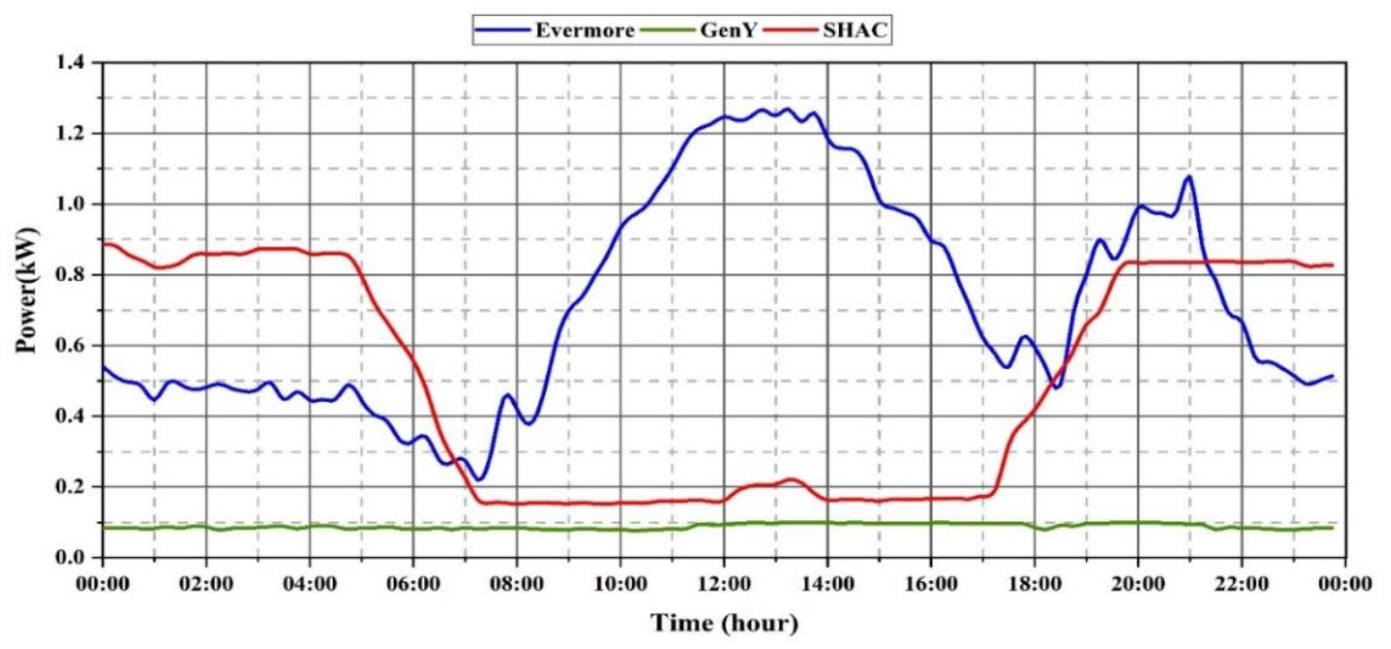
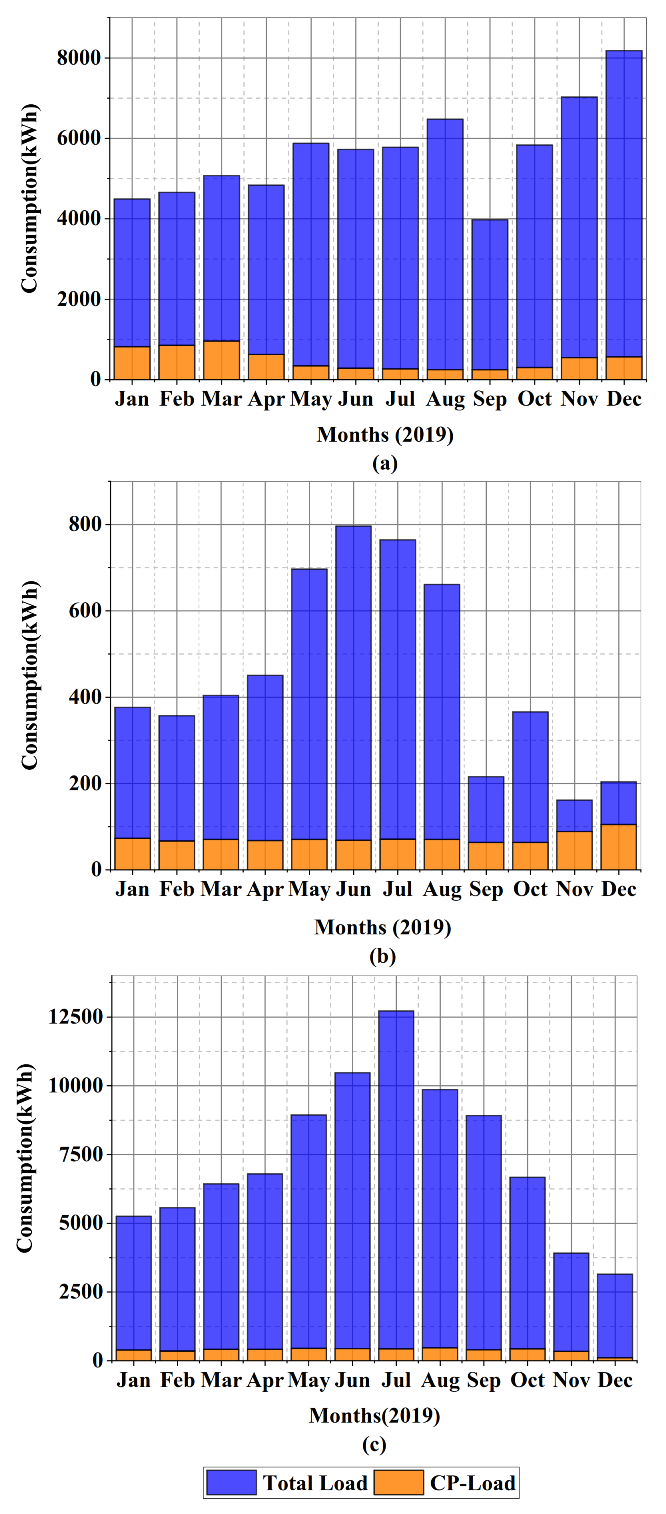
3.3. CP Load Patterns
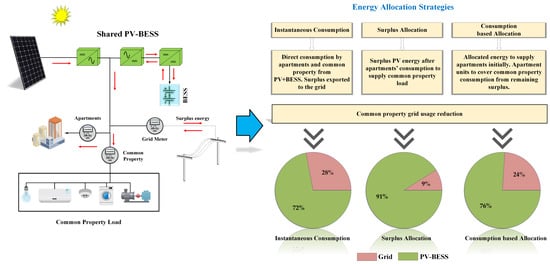
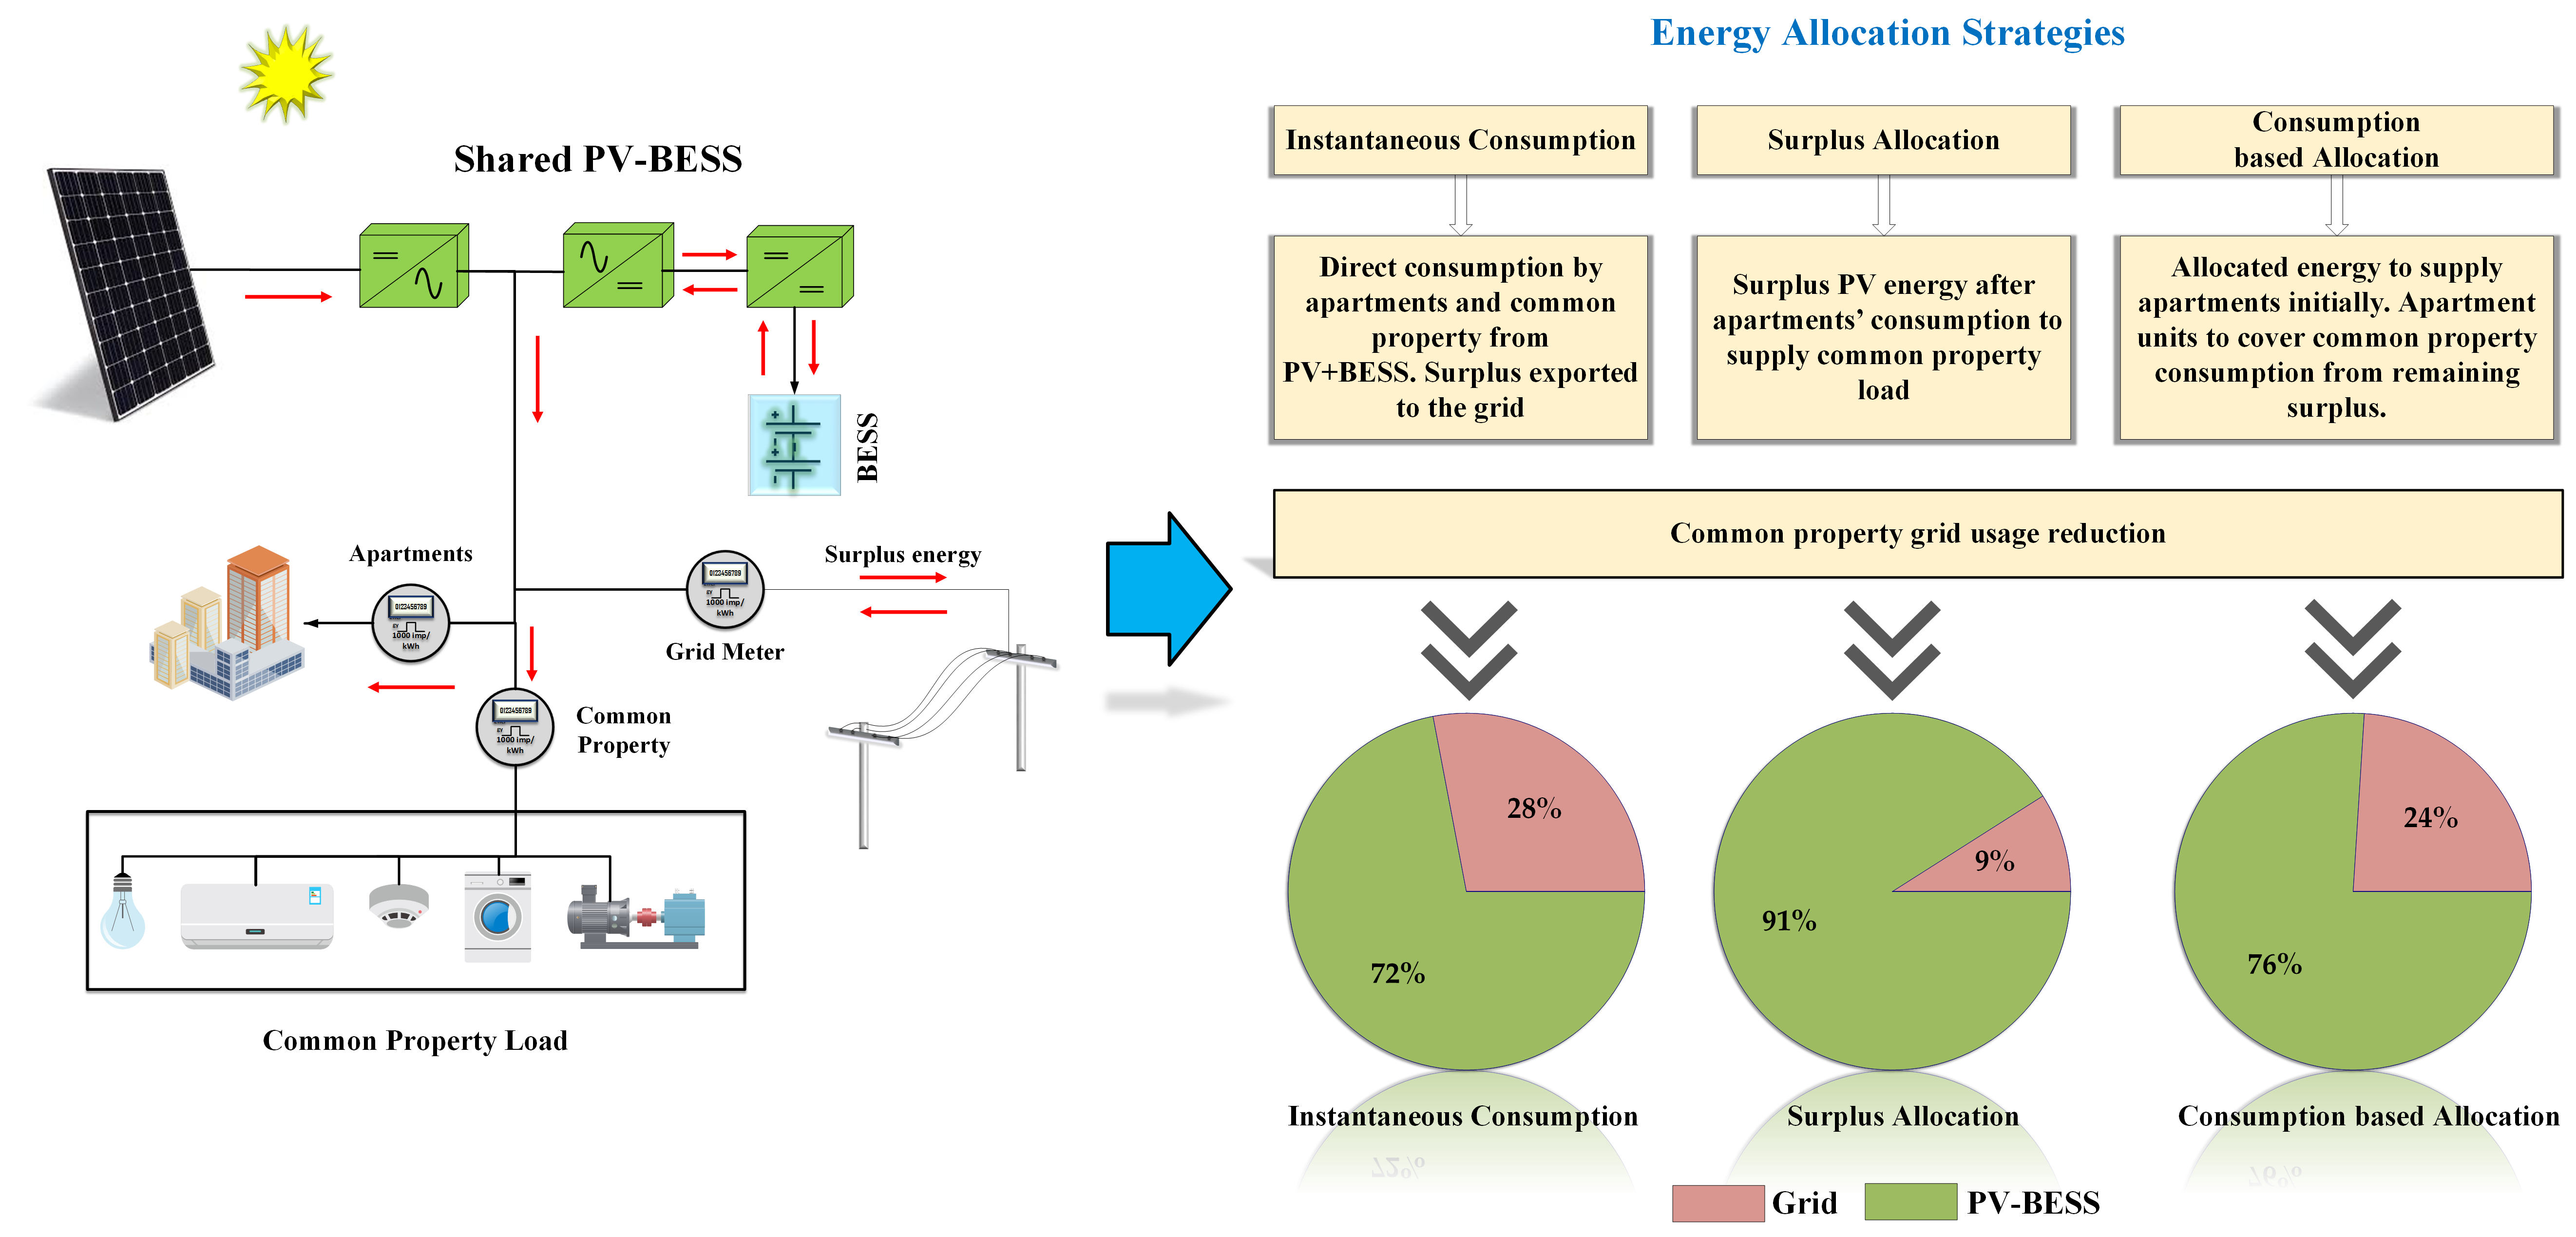
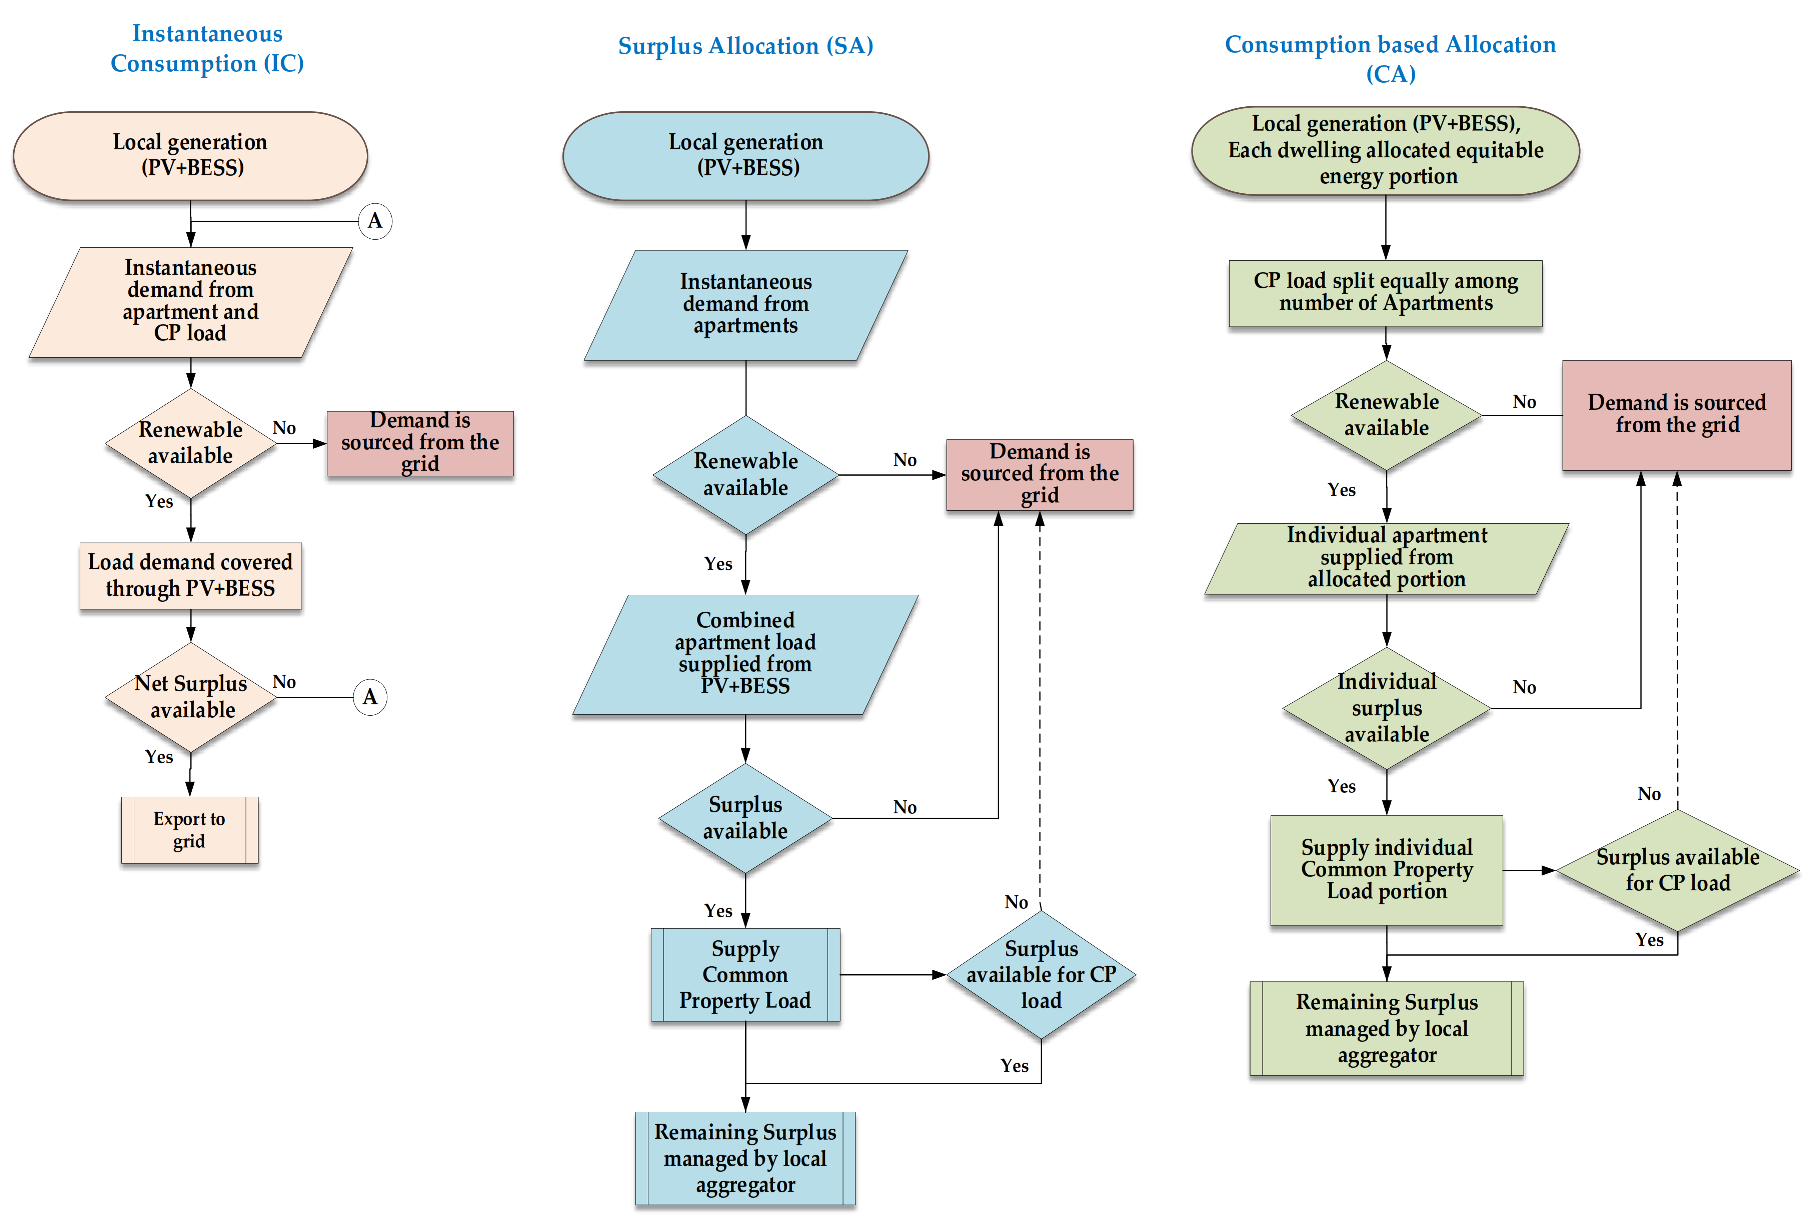
3.4. Energy Allocation Strategies
3.4.1. Instantaneous Consumption
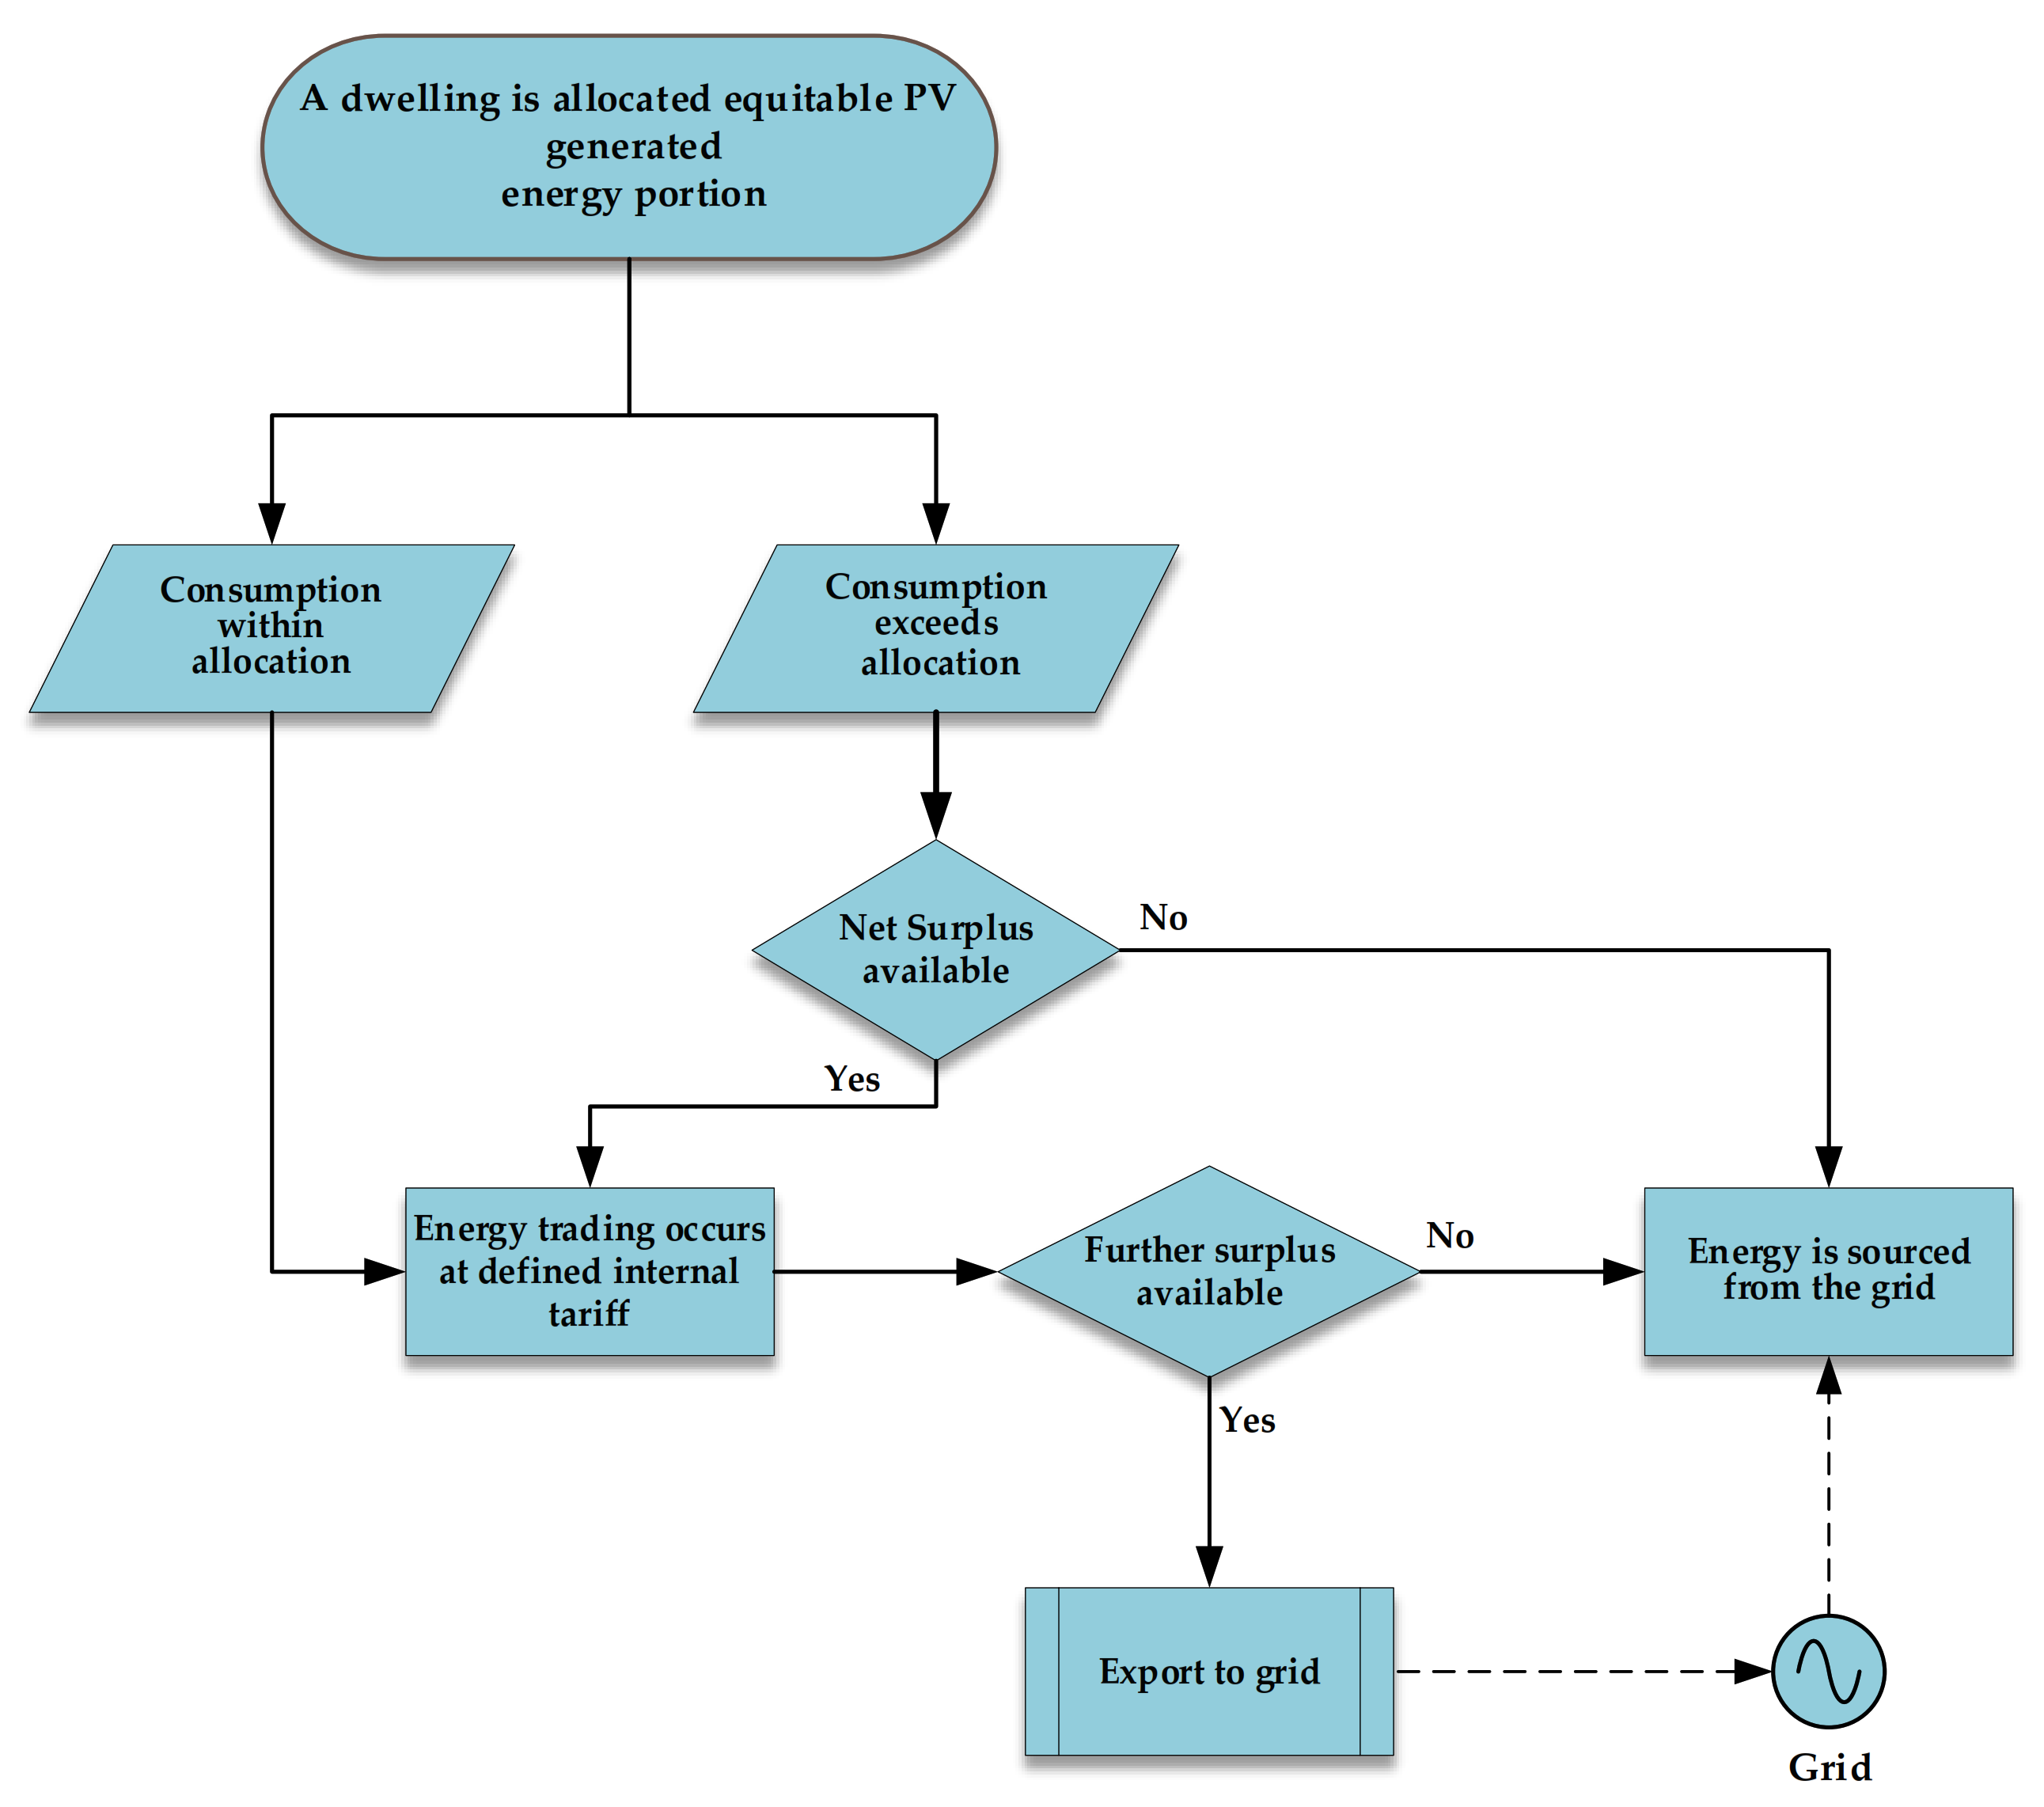
3.4.2. Surplus Allocation
3.4.3. Consumption Based Allocation
4. Results and Discussions
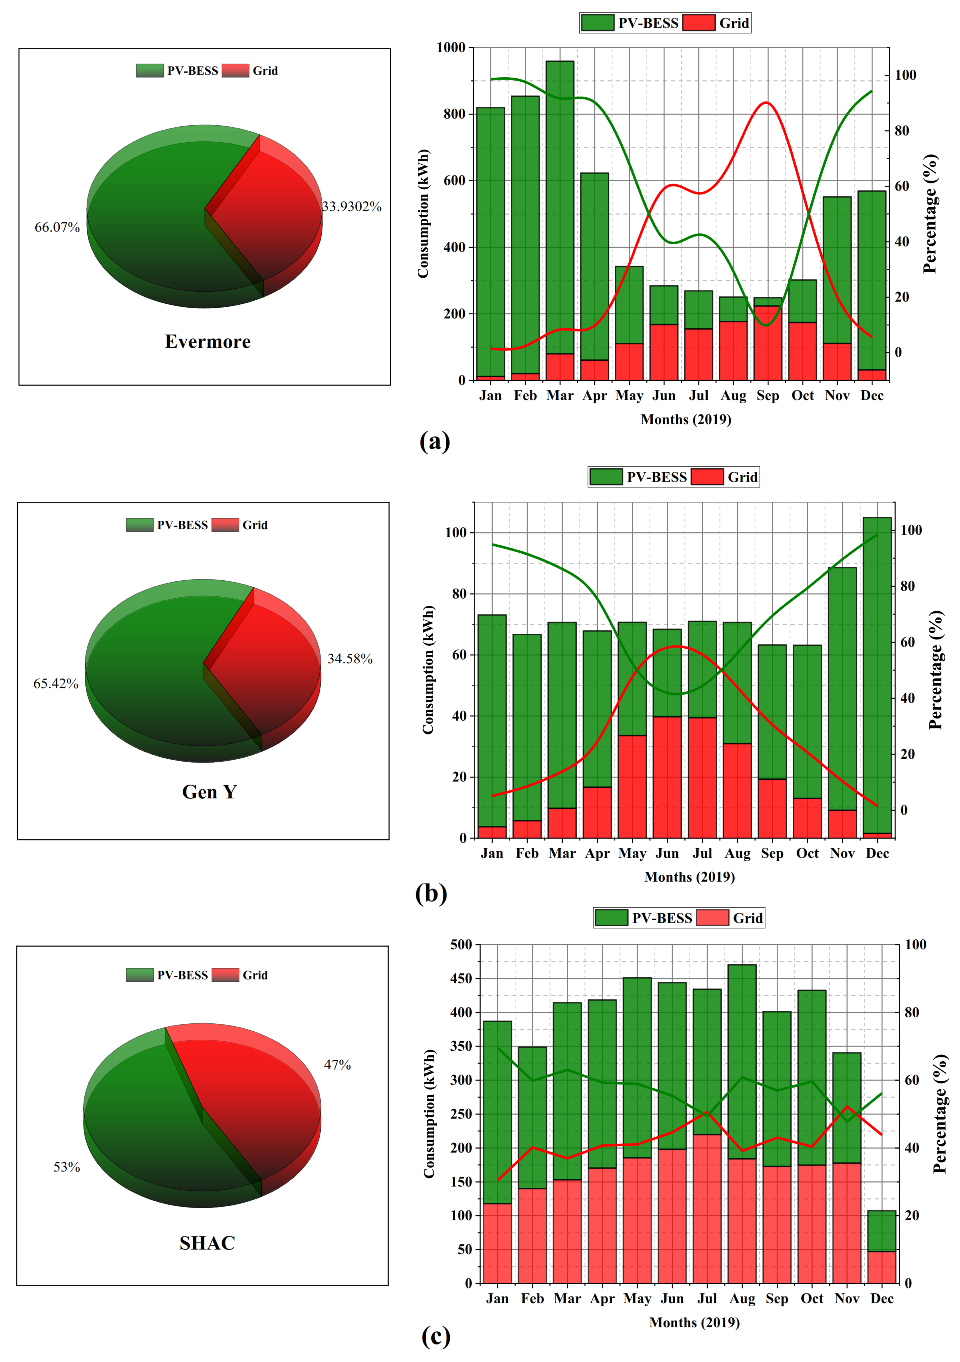
4.1. Instantaneous Consumption
4.2. Comparison of Strategies
5. Conclusions
Author Contributions
Funding
Acknowledgments
Conflicts of Interest
Nomenclature
| Δ | Delta difference output between two intervals |
| Cumulative value of current interval | |
| Cumulative value of previous interval | |
| Excess energy after supplying CP load in SA | |
| CP load demand covered for individual apartment | |
| The CP load consumption split proportionally between numbers of apartments in CA | |
| Renewable generation | |
| Renewable generation capacity allocated to each apartment unit | |
| Energy consumption of apartment | |
| CP energy consumption | |
| Surplus remainder after subtracting apartment load from renewable generation in SA strategy | |
| The surplus available after utilization of allocated energy | |
| AC | Alternating Current |
| BESS | Battery Energy Storage System |
| CA | Consumption based Allocation |
| Cost CA | associated costs from CA strategy |
| Cost IC | associated costs from IC strategy |
| Cost SA | associated costs from SA strategy |
| CP | Common Property |
| DC | Direct Current |
| DRES | Distributed Renewable Energy System |
| Excess-CA | excess energy obtained from CA strategy |
| Excess-IC | excess energy obtained from IC strategy |
| Excess-SA | excess energy obtained from SA strategy |
| GW | Gigawatts |
| IC | Instantaneous Consumption |
| kWh | kilowatt-hours |
| OC | Owner Corporation |
| PV | Photovoltaics |
| SA | Surplus Allocation |
| SWIS | South West Interconnected System |
| WGV | White Gum Valley |
Appendix A


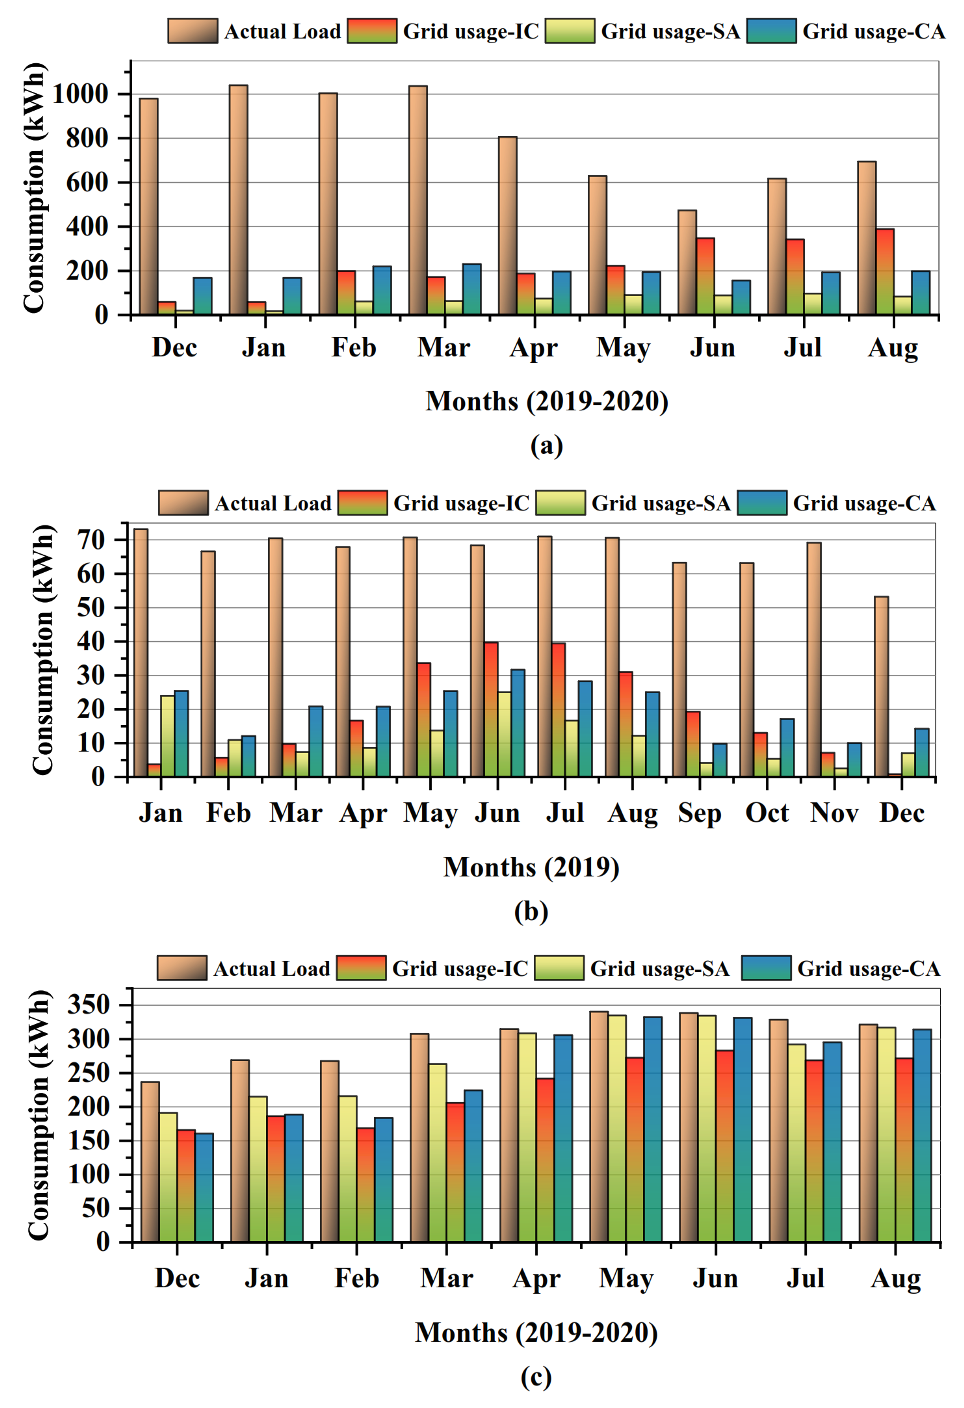
| Months | Actual Load (kWh) | Grid Usage-IC (kWh) | Reduction (%) | Grid Usage-SA (kWh) | Reduction (%) | Grid Usage-CA (kWh) | Reduction (%) |
|---|---|---|---|---|---|---|---|
| Dec | 979.58 | 59.15 | 93.97 | 19.98 | 97.97 | 167.89 | 97.97 |
| Jan | 1040.02 | 58.29 | 94.4 | 17 | 98.37 | 167.91 | 98.37 |
| Feb | 1003.95 | 198.87 | 80.2 | 61.43 | 93.89 | 219.87 | 93.89 |
| Mar | 1036.58 | 172.5 | 83.36 | 63.38 | 93.89 | 230.67 | 93.89 |
| Apr | 806.2 | 188.08 | 76.68 | 74.4 | 90.78 | 197.25 | 90.78 |
| May | 629.16 | 223.18 | 64.53 | 90.26 | 85.66 | 194.28 | 85.66 |
| Jun | 473.43 | 347.61 | 26.58 | 88.72 | 81.27 | 156.4 | 81.27 |
| Jul | 617.97 | 341.93 | 44.67 | 96.98 | 84.31 | 193.06 | 84.31 |
| Aug | 694.69 | 389.07 | 44 | 83.23 | 88.03 | 198.35 | 88.03 |
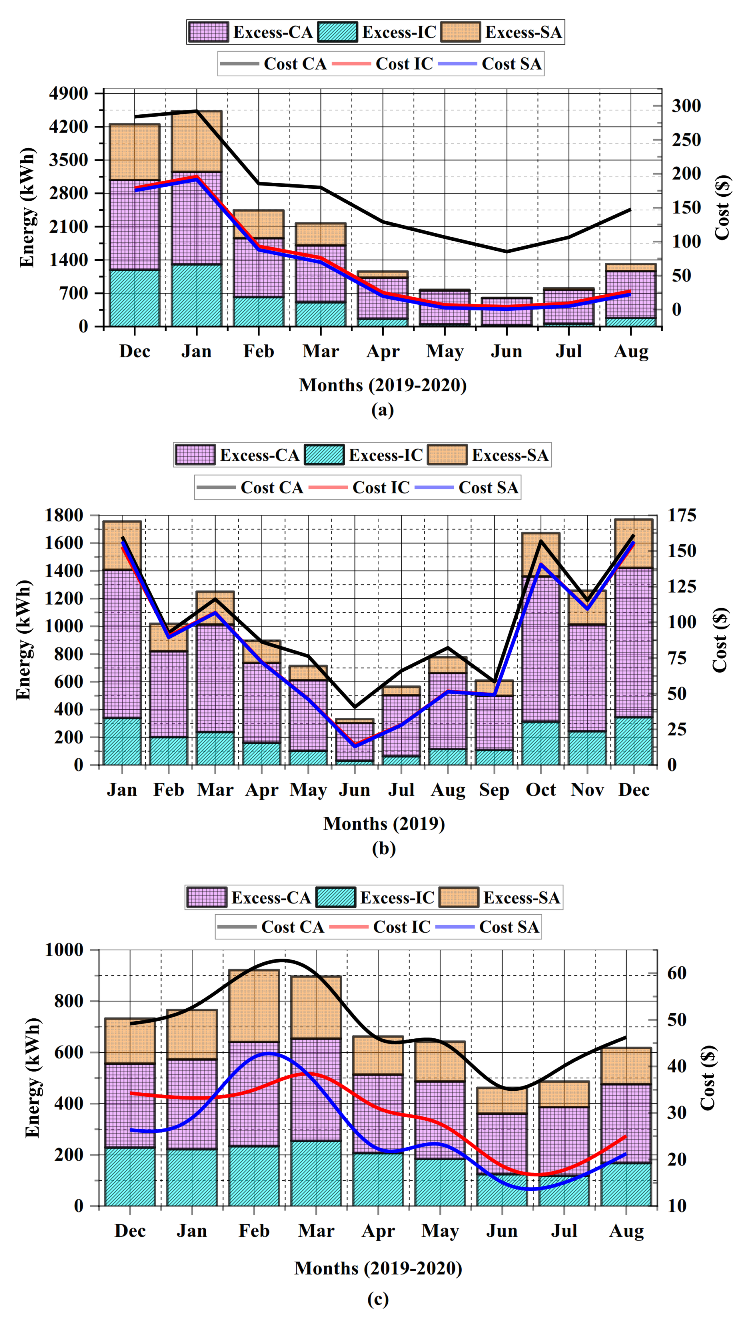
| Months | Excess-IC (kWh) | Excess-CA (kWh) | Excess-SA (kWh) | Cost IC ($) | Cost SA ($) | Cost CA ($) |
|---|---|---|---|---|---|---|
| Dec | 1192.09 | 1892.14 | 1168.32 | 178.82 | 175.25 | 283.83 |
| Jan | 1305.68 | 1947.34 | 1274.92 | 195.86 | 191.24 | 292.11 |
| Feb | 620.81 | 1236.24 | 585.6 | 93.13 | 87.84 | 185.44 |
| Mar | 509.02 | 1198.1 | 463.98 | 76.36 | 69.6 | 179.72 |
| Apr | 166.07 | 860.65 | 131.19 | 24.91 | 19.68 | 129.1 |
| May | 45.53 | 710.36 | 16.34 | 6.83 | 2.46 | 106.56 |
| Jun | 29.36 | 567.85 | 4 | 4.41 | 0.6 | 85.18 |
| Jul | 62.32 | 709.68 | 33.26 | 9.35 | 4.99 | 106.46 |
| Aug | 181.08 | 983.95 | 149.74 | 27.17 | 22.47 | 147.6 |
| Months | Actual Load (kWh) | Grid Usage-IC (kWh) | Reduction (%) | Grid Usage-CA (kWh) | Reduction (%) | Grid Usage-SA (kWh) | Reduction (%) |
|---|---|---|---|---|---|---|---|
| Jan | 73.15 | 3.72 | 94.93 | 25.42 | 65.25 | 23.96 | 67.25 |
| Feb | 66.61 | 5.7 | 91.46 | 12.09 | 81.86 | 10.91 | 83.64 |
| Mar | 70.46 | 9.75 | 86.17 | 20.83 | 70.45 | 7.37 | 89.55 |
| Apr | 67.86 | 16.67 | 75.44 | 20.75 | 69.43 | 8.57 | 87.39 |
| May | 70.7 | 33.62 | 52.45 | 25.39 | 64.1 | 13.7 | 80.63 |
| Jun | 68.37 | 39.71 | 41.93 | 31.68 | 53.67 | 25.01 | 63.43 |
| Jul | 71.02 | 39.45 | 44.46 | 28.25 | 60.23 | 16.67 | 76.53 |
| Aug | 70.62 | 30.97 | 56.15 | 25.02 | 64.58 | 12.2 | 82.74 |
| Sep | 63.27 | 19.33 | 69.46 | 9.79 | 84.54 | 4.12 | 93.51 |
| Oct | 63.21 | 13.04 | 79.38 | 17.14 | 72.89 | 5.36 | 91.53 |
| Nov | 69.18 | 7.14 | 89.69 | 10.01 | 85.55 | 2.51 | 96.38 |
| Dec | 53.24 | 0.8 | 98.5 | 14.22 | 73.3 | 7 | 86.86 |
| Months | Excess-IC (kWh) | Excess-CA (kWh) | Excess-SA (kWh) | Cost IC ($) | Cost SA ($) | Cost CA ($) |
|---|---|---|---|---|---|---|
| Jan | 339.7 | 1067.31 | 348.24 | 152.87 | 156.71 | 160.1 |
| Feb | 201.28 | 618.58 | 198.81 | 90.58 | 89.47 | 92.79 |
| Mar | 237.53 | 775.19 | 236.93 | 106.89 | 106.62 | 116.28 |
| Apr | 160.7 | 575.45 | 159.99 | 72.32 | 72 | 86.32 |
| May | 102.76 | 508.55 | 102.27 | 46.25 | 46.02 | 76.29 |
| Jun | 31.56 | 270.94 | 28.77 | 14.2 | 12.95 | 40.64 |
| Jul | 62.77 | 440.06 | 62.23 | 28.25 | 28 | 66.01 |
| Aug | 114.96 | 548.04 | 114.19 | 51.73 | 51.39 | 82.21 |
| Sep | 109.46 | 389.69 | 109.24 | 49.26 | 49.16 | 58.46 |
| Oct | 312.8 | 1046.13 | 312.37 | 140.76 | 140.57 | 156.92 |
| Nov | 243.54 | 769.73 | 242.96 | 109.6 | 109.33 | 115.46 |
| Dec | 345.02 | 1076.6 | 348.24 | 155.26 | 156.71 | 161.49 |
| Months | Actual Load (kWh) | Grid Usage-CA (kWh) | Reduction (%) | Grid Usage-IC (kWh) | Reduction (%) | Grid Usage-SA (kWh) | Reduction (%) |
|---|---|---|---|---|---|---|---|
| Dec | 236.43 | 160.53 | 32.11 | 165.83 | 29.87 | 190.99 | 19.23 |
| Jan | 268.89 | 188.55 | 29.88 | 186.18 | 30.77 | 214.8 | 20.12 |
| Feb | 267.72 | 183.6 | 31.42 | 168.48 | 37.07 | 215.69 | 19.44 |
| Mar | 307.72 | 224.33 | 27.1 | 205.96 | 33.07 | 263.11 | 14.5 |
| Apr | 314.92 | 305.78 | 2.91 | 241.54 | 23.31 | 308.47 | 2.05 |
| May | 340.41 | 332.36 | 2.37 | 272.35 | 20 | 334.71 | 1.68 |
| Jun | 338.46 | 331.53 | 2.05 | 282.89 | 16.42 | 334.63 | 1.14 |
| Jul | 328.73 | 295.28 | 10.18 | 268.56 | 18.31 | 292.17 | 11.13 |
| Aug | 321.38 | 314.25 | 2.22 | 271.59 | 15.5 | 317.08 | 1.34 |
| Months | Excess-IC (kWh) | Excess-CA (kWh) | Excess-SA (kWh) | Cost IC ($) | Cost SA ($) | Cost CA ($) |
|---|---|---|---|---|---|---|
| Dec | 228.37 | 327.81 | 175.62 | 34.26 | 26.35 | 49.18 |
| Jan | 221.41 | 350.99 | 193.06 | 33.22 | 28.96 | 52.65 |
| Feb | 233.24 | 407.83 | 279.92 | 34.99 | 41.99 | 61.18 |
| Mar | 254.91 | 398.69 | 242.37 | 38.24 | 36.36 | 59.81 |
| Apr | 206.72 | 306.41 | 148.47 | 31.01 | 22.27 | 45.97 |
| May | 184.42 | 302.15 | 155.05 | 27.67 | 23.26 | 45.33 |
| Jun | 124.23 | 236.51 | 100.6 | 18.64 | 15.09 | 35.48 |
| Jul | 118.48 | 267.42 | 100.27 | 17.78 | 15.04 | 40.12 |
| Aug | 167.11 | 308.43 | 141.81 | 25.07 | 21.28 | 46.27 |
References
- IRENA. Renewable Energy Statistics Report 2020; IRENA: Abu Dhabi, UAE, 2020; Available online: https://www.irena.org/publications/2020/Jul/Renewable-energy-statistics-2020 (accessed on 5 November 2020).
- IEEFA. Fitch Solutions: Global Installed Solar Capacity Will Climb 125% in Next 10 Years. IEEFA, 2020. Available online: https://ieefa.org/fitch-solutions-global-installed-solar-capacity-will-climb-125-in-next-10-years/ (accessed on 5 November 2020).
- Zsiborács, H.; Baranyai, N.H.; Vincze, A.; Háber, I.; Pintér, G. Economic and Technical Aspects of Flexible Storage Photovoltaic Systems in Europe. Energies 2018, 11, 1445. [Google Scholar] [CrossRef] [Green Version]
- Syed, M.M.; Hansen, P.; Morrison, G.M. Performance of a shared solar and battery storage system in an Australian apartment building. Energy Build. 2020, 225, 110321. [Google Scholar] [CrossRef]
- Li, H.X.; Edwards, D.; Hosseini, M.R.; Costin, G.P. A review on renewable energy transition in Australia: An updated depiction. J. Clean. Prod. 2020, 242, 118475. [Google Scholar] [CrossRef]
- Wilkinson, S.; Davidson, M.; Morrison, G.M. Historical transitions of Western Australia’s electricity system, 1880–2016. Environ. Innov. Soc. Transit. 2020, 34, 151–164. [Google Scholar] [CrossRef]
- Wilkinson, S.; Morrison, G.M. Enablers of an Electricity System Transition. In Proceedings of the International Conference on Sustainability in Energy and Buildings, Gold Coast, Australia, 20–22 June 2018; Springer: Cham, Switzerland, 2018; pp. 464–477. [Google Scholar]
- Foster, S.; Hooper, P.; Kleeman, A.; Martino, E.; Giles-Corti, B. The high life: A policy audit of apartment design guidelines and their potential to promote residents’ health and wellbeing. Cities 2020, 96, 102420. [Google Scholar] [CrossRef]
- Ren, Z.; Grozev, G.; Higgins, A. Modelling impact of PV battery systems on energy consumption and bill savings of Australian houses under alternative tariff structures. Renew. Energy 2016, 89, 317–330. [Google Scholar] [CrossRef]
- Goop, J.; Nyholm, E.; Odenberger, M.; Johnsson, F. Impact of electricity market feedback on investments in solar photovoltaic and battery systems in Swedish single-family dwellings. Renew. Energy 2019, 163, 1078–1091. [Google Scholar] [CrossRef]
- Nyholm, E.; Goop, J.; Odenberger, M.; Johnsson, F. Solar photovoltaic-battery systems in Swedish households—Self-consumption and self-sufficiency. Appl. Energy 2016, 183, 148–159. [Google Scholar] [CrossRef] [Green Version]
- Jones, P.; Li, X.; Perisoglou, E.; Patterson, J. Five energy retrofit houses in South Wales. Energy Build. 2017, 154, 335–342. [Google Scholar] [CrossRef]
- Sharma, V.; Haque, M.H.; Aziz, S.M. Comparative Evaluation of Alternative Tariffs on Energy Cost of Households with PV and Battery. In Proceedings of the 29th Australasian Universities Power Engineering Conference (AUPEC), Momi Bay, Fiji, 26–29 November 2019; pp. 1–6. [Google Scholar]
- Byrne, J.; Taylor, M.; Green, J. Josh’s Battery-a more even relationship with the grid. Renew. Energy Environ. Sustain. 2017, 2, 1–6. [Google Scholar] [CrossRef]
- Roberts, M.B.; Bruce, A.; MacGill, I. A comparison of arrangements for increasing self-consumption and maximising the value of distributed photovoltaics on apartment buildings. Sol. Energy 2019, 193, 372–386. [Google Scholar] [CrossRef]
- Syed, M.M.; Morrison, G.M.; Darbyshire, J. Shared Solar and Battery Storage Configuration Effectiveness for Reducing the Grid Reliance of Apartment Complexes. Energies 2020, 13, 4820. [Google Scholar] [CrossRef]
- Altmann, E. Apartments, Co-ownership and Sustainability: Implementation Barriers for Retrofitting the Built Environment. J. Environ. Policy Plan. 2013, 16, 437–457. [Google Scholar] [CrossRef]
- Li, J.; Ng, S.T.; Skitmore, M. Review of low-carbon refurbishment solutions for residential buildings with particular reference to multi-story buildings in Hong Kong. Renew. Sustain. Energy Rev. 2017, 73, 393–407. [Google Scholar] [CrossRef] [Green Version]
- Susowake, Y.; Masrur, H.; Yabiku, T.; Senjyu, T.; Howlader, A.M.; Abdel-Akher, M.; Hemeida, A.M. A multi-objective optimization approach towards a Proposed Smart Apartment with Demand-Response in Japan. Energies 2019, 13, 127. [Google Scholar] [CrossRef] [Green Version]
- Roberts, M.B.; Bruce, A.; MacGill, I. PV for Apartment Buildings: Which Side of the Meter? In Proceedings of the Asia Pacific Solar Research Conference, Melbourne, Australia, 5–7 December 2017. [Google Scholar]
- Roberts, M.B.; Huxham, G.; Bruce, A.; MacGill, I.; Strata, A.E. Using PV to help meet Common Property Energy Demand in Residential Apartment Buildings. In Proceedings of the Australian Summer Study on Energy Productivity, Sydney, Australia, 24–26 February 2016. [Google Scholar]
- Valančius, K.; Mikučionienė, R. Solar energy as a tool of renovating soviet-type multi apartment buildings. Sol. Energy 2020, 198, 93–100. [Google Scholar] [CrossRef]
- Fleischhacker, A.; Auer, H.; Lettner, G. Botterud, Sharing solar PV and energy storage in apartment buildings: Resource Allocation and Pricing. IEEE Trans. Smart Grid 2019, 10, 3963–3973. [Google Scholar] [CrossRef]
- Chen, Z.; Xu, P.; Chen, Y. A Peer-to-Peer Electricity System and Its Simulation; IOP Conference Series: Earth and Environmental Science; IOP Publishing: Bristol, UK, 2019; Volume 238, p. 012081. [Google Scholar] [CrossRef]
- Hayes, B.; Thakur, S.; Breslin, J.G. Co-simulation of electricity distribution networks and peer to peer energy trading platforms. Int. J. Electr. Power Energy Syst. 2020, 115, 105419. [Google Scholar] [CrossRef]
- Han, X.; Sun, L.; Tao, Y.; Zhao, J.; Wang, G.; Yuan, D. Distributed Energy-Sharing Strategy for Peer-to-Peer Microgrid System. J. Energy Eng. 2020, 146, 04020033. [Google Scholar] [CrossRef]
- Zhang, C.; Wu, J.; Zhou, Y.; Cheng, M.; Long, C. Peer-to-Peer energy trading in a Microgrid. Appl. Energy 2018, 220, 1–12. [Google Scholar] [CrossRef]
- Liu, N.; Yu, X.; Wang, C.; Wang, J. Energy Sharing Management for Microgrids With PV Prosumers: A Stackelberg Game Approach. IEEE Trans. Ind. Inf. 2017, 13, 1088–1098. [Google Scholar] [CrossRef]
- Sajjad, I.A.; Manganelli, M.; Martirano, L.; Napoli, R.; Chicco, G.; Parise, G. Net metering benefits for residential buildings: A case study in Italy. In Proceedings of the IEEE 15th International Conference on Environment and Electrical Engineering (EEEIC), Rome, Italy, 10–13 June 2015; pp. 1647–1652. [Google Scholar]
- Malaviya, S.; Krishnan, S.; Cibi, S.; Kajol; Nath, S.; Krishnan, D.S. Assessing Clean Energy Opportunities Through Demand Aggregation in Bengaluru’s Apartment Buildings; World Resources Institute: Washington, DC, USA, 2020. [Google Scholar]
- Danielski, I. Energy Variations in Apartment Buildings Due to Different Shape Factors and Relative Size of Common Areas. In Proceedings of the World Renewable Energy Congress, Linköping, Sweden, 8–13 May 2011; Volume 57, pp. 1000–1007. [Google Scholar] [CrossRef] [Green Version]
- Choi, I.Y.; Cho, S.H.; Kim, J.T. Energy consumption characteristics of high-rise apartment buildings according to building shape and mixed-use development. Energy Build. 2012, 46, 123–131. [Google Scholar] [CrossRef]
- O’Brien, W.T.; Kennedy, C.A.; Athienitis, A.K.; Kesik, T. The relationship between net energy use and the urban density of solar buildings. Environ. Plan. B Plan. Des. 2010, 37, 1002–1021. [Google Scholar] [CrossRef]
- Ao, T.; Nagai, H.; Iwata, T.; Hitsuda, N.; Yamaha, M.; Shuku, M. A study on electric power consumption of common space in multiple dwelling houses. J. Environ. Eng. 2011, 76, 1017–1023. [Google Scholar] [CrossRef] [Green Version]
- Dewees, D.; Tombe, T. The impact of sub-metering on condominium electricity demand. Can. Public Policy 2011, 37, 435–457. [Google Scholar] [CrossRef]
- Danielski, I. Large variations in specific final energy use in Swedish apartment buildings: Causes and solutions. Energy Build. 2012, 49, 276–285. [Google Scholar] [CrossRef]
- Hamburg, A.; Kuusk, K.; Mikola, A.; Kalamees, T. Realisation of energy performance targets of an old apartment building renovated to nZEB. Energy 2020, 194, 116874. [Google Scholar] [CrossRef]
- Rolim, C.; Gomes, R. Citizen Engagement in Energy Efficiency Retrofit of Public Housing Buildings: A Lisbon Case Study. In Sustainability in Energy and Buildings; Springer: Singapore, 2019; pp. 421–431. [Google Scholar]
- Hevko, B. Promising Projects of Energy Soving in Housing and Communal Services of Ukraine. Adv. Sci. J. 2015, 103–105. [Google Scholar] [CrossRef]
- Zimmermann, J.P. End-Use Metering Campaign in 400 Households in Sweden-Assessment of the Potential Electricity Savings; Contract; ENERTECH: Chungju-si, Korea, 2009; pp. 5–2743. [Google Scholar]
- Rehman, W.U.; Bhatti, A.R.; Awan, A.B.; Sajjad, I.A.; Khan, A.A.; Bo, R.; Haroon, S.S.; Amin, S.; Tlili, I.; Oboreh-Snapps, O. The Penetration of Renewable and Sustainable Energy in Asia: A State-of-the-Art Review on Net-Metering. IEEE Access 2020, 8, 170364–170388. [Google Scholar] [CrossRef]
- Long, C.; Wu, J.; Zhou, Y.; Jenkins, N. Peer-to-peer energy sharing through a two-stage aggregated battery control in a community Microgrid. Appl. Energy 2018, 226, 261–276. [Google Scholar] [CrossRef]
- Cui, S.; Wang, Y.-W.; Shi, Y.; Xiao, J.-W. An Efficient Peer-to-Peer Energy-Sharing Framework for Numerous Community Prosumers. IEEE Trans. Ind. Inf. 2020, 16, 7402–7412. [Google Scholar] [CrossRef]
- Guerrero, J.; Chapman, A.; Verbic, G. Peer-to-Peer Energy Trading: A Case Study Considering Network Constraints. In Proceedings of the Asia-Pacific Solar Research Conference, Sydney, Australia, 4–6 December 2018. [Google Scholar]
- Li, J.; Wu, Z.; Gu, W.; Fu, H.; Zhang, X.-P. Aggregator service for PV and battery energy storage systems of residential building. CSEE J. Power Energy Syst. 2015, 1, 3–11. [Google Scholar] [CrossRef]
- Long, C.; Wu, J.; Zhang, C.; Thomas, L.; Cheng, M.; Jenkins, N. Peer-to-peer energy trading in a community microgrid. In Proceedings of the IEEE Power & Energy Society General Meeting, Chicago, IL, USA, 16–20 July 2017; pp. 1–5. [Google Scholar]
- Guerrero, J.; Chapman, A.C.; Verbic, G. Decentralized P2P Energy Trading Under Network Constraints in a Low-Voltage Network. IEEE Trans. Smart Grid 2019, 10, 5163–5173. [Google Scholar] [CrossRef] [Green Version]
- Akter, M.N.; Mahmud, M.A.; Haque, M.E.; Oo, A.M. A Transactive Energy Trading Framework for Community Microgrids in Residential Multi-Dwelling Apartment Buildings. In Proceedings of the IEEE Power & Energy Society General Meeting (PESGM), Atlanta, GA, USA, 4–8 August 2019; pp. 1–5. [Google Scholar] [CrossRef]
- Evermore-wgv. Solar Battery Innovation. News. 2018. Available online: http://www.evermorewgv.com.au/solar-powered-apartments-fremantle-wgv.html (accessed on 10 October 2020).
- Landcorp. Initiative Gen Y Project. Innovation through Demonstration. 2017. Available online: https://www.landcorp.com.au/innovation/wgv/initiatives/Gen-Y-House/ (accessed on 10 October 2020).
- Access-Housing. Solar to Power Access Housing’s White Gum Valley Development. News. 2016. Available online: https://www.accesshousing.org.au/solar-to-power-access-housings-white-gum-valley-development/ (accessed on 10 October 2020).
- Choudhry, A.; Dimobi, I.; Gould, Z.M.I. Blockchain Driven Platform for Energy Distribution in a Microgrid. In Data Privacy Management, Cryptocurrencies and Blockchain Technology; Springer: Berlin/Heidelberg, Germany, 2019; pp. 271–288. [Google Scholar]
- Hansen, P.; Morrison, G.M.; Zaman, A.U.; Liu, X. Smart technology needs smarter management: Disentangling the dynamics of digitalism in the governance of shared solar energy in Australia. Energy Res. Soc. Sci. 2020, 60, 101322. [Google Scholar] [CrossRef]
- Lee, W.Y.; Samsung SDI Co Ltd. Energy Storage System of Apartment Building, Integrated Power Management System, and Method of Controlling the System. U.S. Patent 8,766,590, 1 July 2014. [Google Scholar]
- Atia, H.R.; Shakya, A.; Tandukar, P.; Tamrakar, U.; Hansen, T.M.; Tonkoski, R. Efficiency analysis of AC coupled and DC coupled microgrids considering load profile variations. In Proceedings of the 2016 IEEE International Conference on Electro Information Technology (EIT), Grand Forks, ND, USA, 19–21 May 2016; pp. 0695–0699. [Google Scholar]
- He, J.; Yang, Y.; Vinnikov, D. Energy Storage for 1500 V Photovoltaic Systems: A Comparative Reliability Analysis of DC- and AC-Coupling. Energies 2020, 13, 3355. [Google Scholar] [CrossRef]
- Sandelic, M.; Sangwongwanich, A.; Blaabjerg, F. Reliability Evaluation of PV Systems with Integrated Battery Energy Storage Systems: DC-Coupled and AC-Coupled Configurations. Electronics 2019, 8, 1059. [Google Scholar] [CrossRef] [Green Version]
- Zafar, R.; Mahmood, A.; Razzaq, S.; Ali, W.; Naeem, U.; Shehzad, K. Prosumer based energy management and sharing in smart grid. Renew. Sustain. Energy Rev. 2018, 82, 1675–1684. [Google Scholar] [CrossRef]
- Leonard, M.D.; Michaelides, E.E. Grid-independent residential buildings with renewable energy sources. Energy 2018, 148, 448–460. [Google Scholar] [CrossRef]


| Site | Storeys + Units | Type of CP Loads | Renewable Size | Configuration |
|---|---|---|---|---|
| Evermore | 3 + 24 | Walkway, entrance and car park lights, electric gate opener and sensor, ventilation fan and air conditioner for battery room. | 54.6 kWp, 150 kWh Lithium-ion | AC-coupled |
| Gen Y | 2 + 3 | Walkway lights, entry sensor lights, rainwater pump | 9 kWp, 10 kWh Lithium-ion | AC-coupled |
| SHAC | 3 + 14 | Carpark lights, switchboard room electricity, ventilation fan for battery room. | 19.6 kWp, 40 kWh Lithium-ion | DC-coupled |
| Site | Total Load (kWh) | Common Property Load (kWh) | CP-Proportion (%) |
|---|---|---|---|
| Evermore | 67,936.188 | 6071.057145 | 8.93 |
| Gen Y | 5452.007 | 878.793 | 16.11 |
| SHAC | 108,154.9 | 5977.335 | 5.52 |
| Title | Advantage | Disadvantage |
|---|---|---|
| Instantaneous Consumption (IC) | Useful in a shared setup where consumers and strata body agree to earn benefits from the shared PV-BESS based on individuals’ electricity usage. | Renewable energy is not allocated therefore consumers are not conscious about their energy consumption. |
| A particular unit or common area may utilize maximum renewable energy in case other apartment units are not consuming. | Energy fraction distribution depends entirely on individual unit’s consumption. | |
| Excess PV energy is exported to the grid. | ||
| Individual cost benefits are not explicitly discerned as exported energy is unallocated. | ||
| Surplus Allocation (SA) | CP load can be supplied from renewable surplus remained after apartments’ utilization. | Dependent on apartment load consumption. If renewable generation is equal or less than total apartment load, CP load will be supplied by grid. |
| CP may utilize maximum renewable energy in case apartment units are not consuming. | Individual cost benefits are not explicitly discerned as exported energy is unallocated. | |
| Can achieve high grid usage reduction at sites where ample excess generation is available. | ||
| Consumption Based Allocation (CA) | A uniform portion of renewable generation is allocated to each apartment unit along with proportionate consumption of CP load allocated to all apartments. | Fixed allocated portion of renewable energy. If allocated energy portion runs out, then CP load imports grid electricity. |
| An allocated share of renewable means consumers will remain conscious of their energy consumption. | ||
| Possibility of peer-to-peer trading between consumers and monetary benefits in case a particular unit consumes less than allocated portion. | ||
| Can aggregate high excess energy and cost benefits as compare to other two strategies. |
Publisher’s Note: MDPI stays neutral with regard to jurisdictional claims in published maps and institutional affiliations. |
© 2020 by the authors. Licensee MDPI, Basel, Switzerland. This article is an open access article distributed under the terms and conditions of the Creative Commons Attribution (CC BY) license (http://creativecommons.org/licenses/by/4.0/).
Share and Cite
Syed, M.M.; Morrison, G.M.; Darbyshire, J. Energy Allocation Strategies for Common Property Load Connected to Shared Solar and Battery Storage Systems in Strata Apartments. Energies 2020, 13, 6137. https://doi.org/10.3390/en13226137
Syed MM, Morrison GM, Darbyshire J. Energy Allocation Strategies for Common Property Load Connected to Shared Solar and Battery Storage Systems in Strata Apartments. Energies. 2020; 13(22):6137. https://doi.org/10.3390/en13226137
Chicago/Turabian StyleSyed, Moiz Masood, Gregory M. Morrison, and James Darbyshire. 2020. "Energy Allocation Strategies for Common Property Load Connected to Shared Solar and Battery Storage Systems in Strata Apartments" Energies 13, no. 22: 6137. https://doi.org/10.3390/en13226137
APA StyleSyed, M. M., Morrison, G. M., & Darbyshire, J. (2020). Energy Allocation Strategies for Common Property Load Connected to Shared Solar and Battery Storage Systems in Strata Apartments. Energies, 13(22), 6137. https://doi.org/10.3390/en13226137