Article

The Liberalization of the Internal Energy Market in the European Union: Evidence of Its Influence on Reducing Environmental Pollution

by
Pablo Ponce
1,
Cristiana Oliveira
2,
Viviana Álvarez
1 and
María de la Cruz del Río-Rama
3,*
1
School of Economics, Universidad Nacional de Loja, 11050 Loja, Ecuador
2
European University of the Canary Islands, 38300 La Orotava, Santa Cruz de Tenerife, Spain
3
Business Management and Marketing Department, Faculty of Business Sciences and Tourism, University of Vigo, 32004 Ourense, Spain
*
Author to whom correspondence should be addressed.
Energies 2020, 13(22), 6116; https://doi.org/10.3390/en13226116
Submission received: 17 October 2020 / Revised: 15 November 2020 / Accepted: 20 November 2020 / Published: 22 November 2020

Abstract

:
From an empirical point of view, the liberalization of the internal energy market reduces carbon dioxide emissions, promoting a wider range of renewable energy sources. The aim of this paper is to examine the effect of the liberalization of the internal energy market on CO2 emissions, which was implemented in the European Union in 2011. The research data cover 27 countries of the European Union during the period 2004–2017 and was processed by estimating a two-way effects econometric model. The results suggest that the liberalization of the internal energy market is negatively related to CO2 emissions; the policy was effective in reducing CO2 emissions and, therefore, slowing down climate change. This result is significant at the level of the European Union, and in high-income countries since the year the policy was implemented, being different in the upper-middle-income countries, which begins to be effective after two years, which is due to the economic characteristics of the countries. The public policies to be implemented to reduce carbon dioxide emissions should focus on reducing the barriers imposed on foreign trade, which prevent efficient use of resources and providing financial and operating facilities to renewable energy providers in order to stimulate their production and consumption.

1. Introduction

In recent decades, climate change has become a priority worldwide due to the fact that the impacts derived from it have been intensified, generating strong consequences for the economy and society of different regions. This is the reason why the countries of the world aimed their policies to reduce carbon dioxide emissions to ensure sustainable economic growth and development. However, their average cost of mitigation and adaptation is high in the short term since they set ambitious objectives that must be met in certain years, which leads them to make heavy investments in infrastructure and technology [1]. The main sources that emit CO2 into the atmosphere are fossil fuels, which come from natural gas, oil and coal and are used as sources of energy generation in economic activities, being a challenge for large economies to commit to reducing and changing their energy sources [2,3].
According to the Statistical Review of World Energy [4], CO2 emissions in the European Union went from 4081 million tons in 2000 to 3466 million tons in 2018. In the same period, the consumption of fossil fuels has decreased by approximately 15.32% in the European Union. The energy sources mentioned are mainly responsible for the climate change that has been generated in the world, causing some regions of the world to experience droughts, meteorological phenomena and floods, among others [5].
In response to the above, different organizations proposed policies focused on changing traditional energy sources that emit pollutant gases and aggravate environmental problems. The countries that make up the European Union stand out in this regard and are the greatest promoters of policies in favor of the environment, aiming at a more ecological and sustainable Europe, characterized by low emissions of pollutant gases, due to the efficient use of resources, being competitive and generating well-being for citizens. In figures presented by the IEA [6], the carbon dioxide emissions of the European Union went from 4036 to 3475 million tons, from 2000 to 2017, respectively. They are responsible for 10.8% of the emissions that are generated in the world.
In addition, a report by the European Commission [7] revealed that in the European Union, the energy industry emits 35.9% of CO2 emissions due to the dependence it still has on fossil fuels. However, prices and costs have varied in recent years, with the first fall in energy prices since 2008 being experienced in 2017, due to the growing competition from renewable energy sources that have emerged, generating 30.7% and 19.7% of electricity and heating in 2017, respectively—being the main sources of renewable energy in charge of covering the demand for heating: biomass, solar thermal and geothermal energy.
In particular, European countries have high and upper-middle incomes, which drives them to have a greater concern for the environment, in which various objectives and targets have been defined to reduce CO2 emissions at the European Union level. The liberalization of the internal energy market (natural gas and electricity) is included in its measures, which in the third package that was approved in 2011 and had a reform in which the liberalization was extended to both domestic and non-domestic markets. This policy is adopted in order to build a more competitive electricity market that focuses on consumers and covers the production of decarbonized electricity in order to provide a competitive, safe, sustainable and accessible service [8].
Consequently, the policy proposed in agreement with the European Parliament [8] aims to achieve energy efficiency and offer consumers a wider range of options to choose their suppliers, as well as contribute to meeting the climate targets set for 2030 and 2050, to reduce its greenhouse gas emissions by 40% and to be an economy with net-zero emissions, respectively [9] In addition, these types of measures can take on greater force with the emergence of new technologies or green product development to improve environmental sustainability [10,11].
Thus, the liberalization of the internal energy market will be essential for the consumption of renewable energy due to the elimination of trade barriers and barriers that prevented this market from developing [12,13,14]. However, despite the opportunities that it implies, there are also risks due to the distortions that are generated in the transition, being a problem for reducing CO2 emissions [15,16,17].
In this context, the objective of this research is to evaluate the effect of the liberalization of the internal energy market implemented in 2011 on CO2 emissions in the European Union in order to evaluate the effectiveness of the policy. This research covers 27 European Union countries, which were classified according to their income level from 2004 to 2017. This research will take into account the environmental Kuznets curve (EKC) that provides a solid theoretical framework to analyze the environmental pollution caused by economic growth [18]. There is extensive literature that supports the hypothesis of the environmental Kuznets curve in different economies, which responds in different ways [19,20,21].
In addition, the aim is to validate the hypothesis that low carbon dioxide emissions are determined by the liberalization of the internal gas and electricity market.
In this way, this research contributes to the literature that relates CO2 emissions with the policy of the liberalization of the internal energy market by evaluating its effectiveness through a two-way fixed effects econometric model with panel data for the European Union. It differs from the studies of other authors such as Nicolli and Vona [12], Meyer [22] and Akkemik and Oğuz [23], who base their research on simulations and on the comparison of statistical information of one year with another. In addition, Zhao et al. [24] carry out a study with a spatial model, although the impact of the policy over time is not clearly observed.
This document is structured as follows: In the introduction, the subject under study is contextualized, the research is justified, and its objective is stated. The second section comprises a review of previous theoretical and empirical research. The third section describes the data used and proposes an econometric strategy. In the fourth section, the results are discussed with the theory and empirical evidence. The fifth and final section presents the conclusions and policy implications of the research.

2. Review of Previous Literature

The climate change experienced in recent decades is linked to an increase in pollutant gas emissions and the economic growth of countries [5,25,26], which is the reason why there are several empirical studies that analyze the relationship between the mentioned variables [2,3,27,28,29,30,31,32,33,34]. The basic theory used to understand this relationship is the Kuznets curve hypothesis applied to environmental issues.
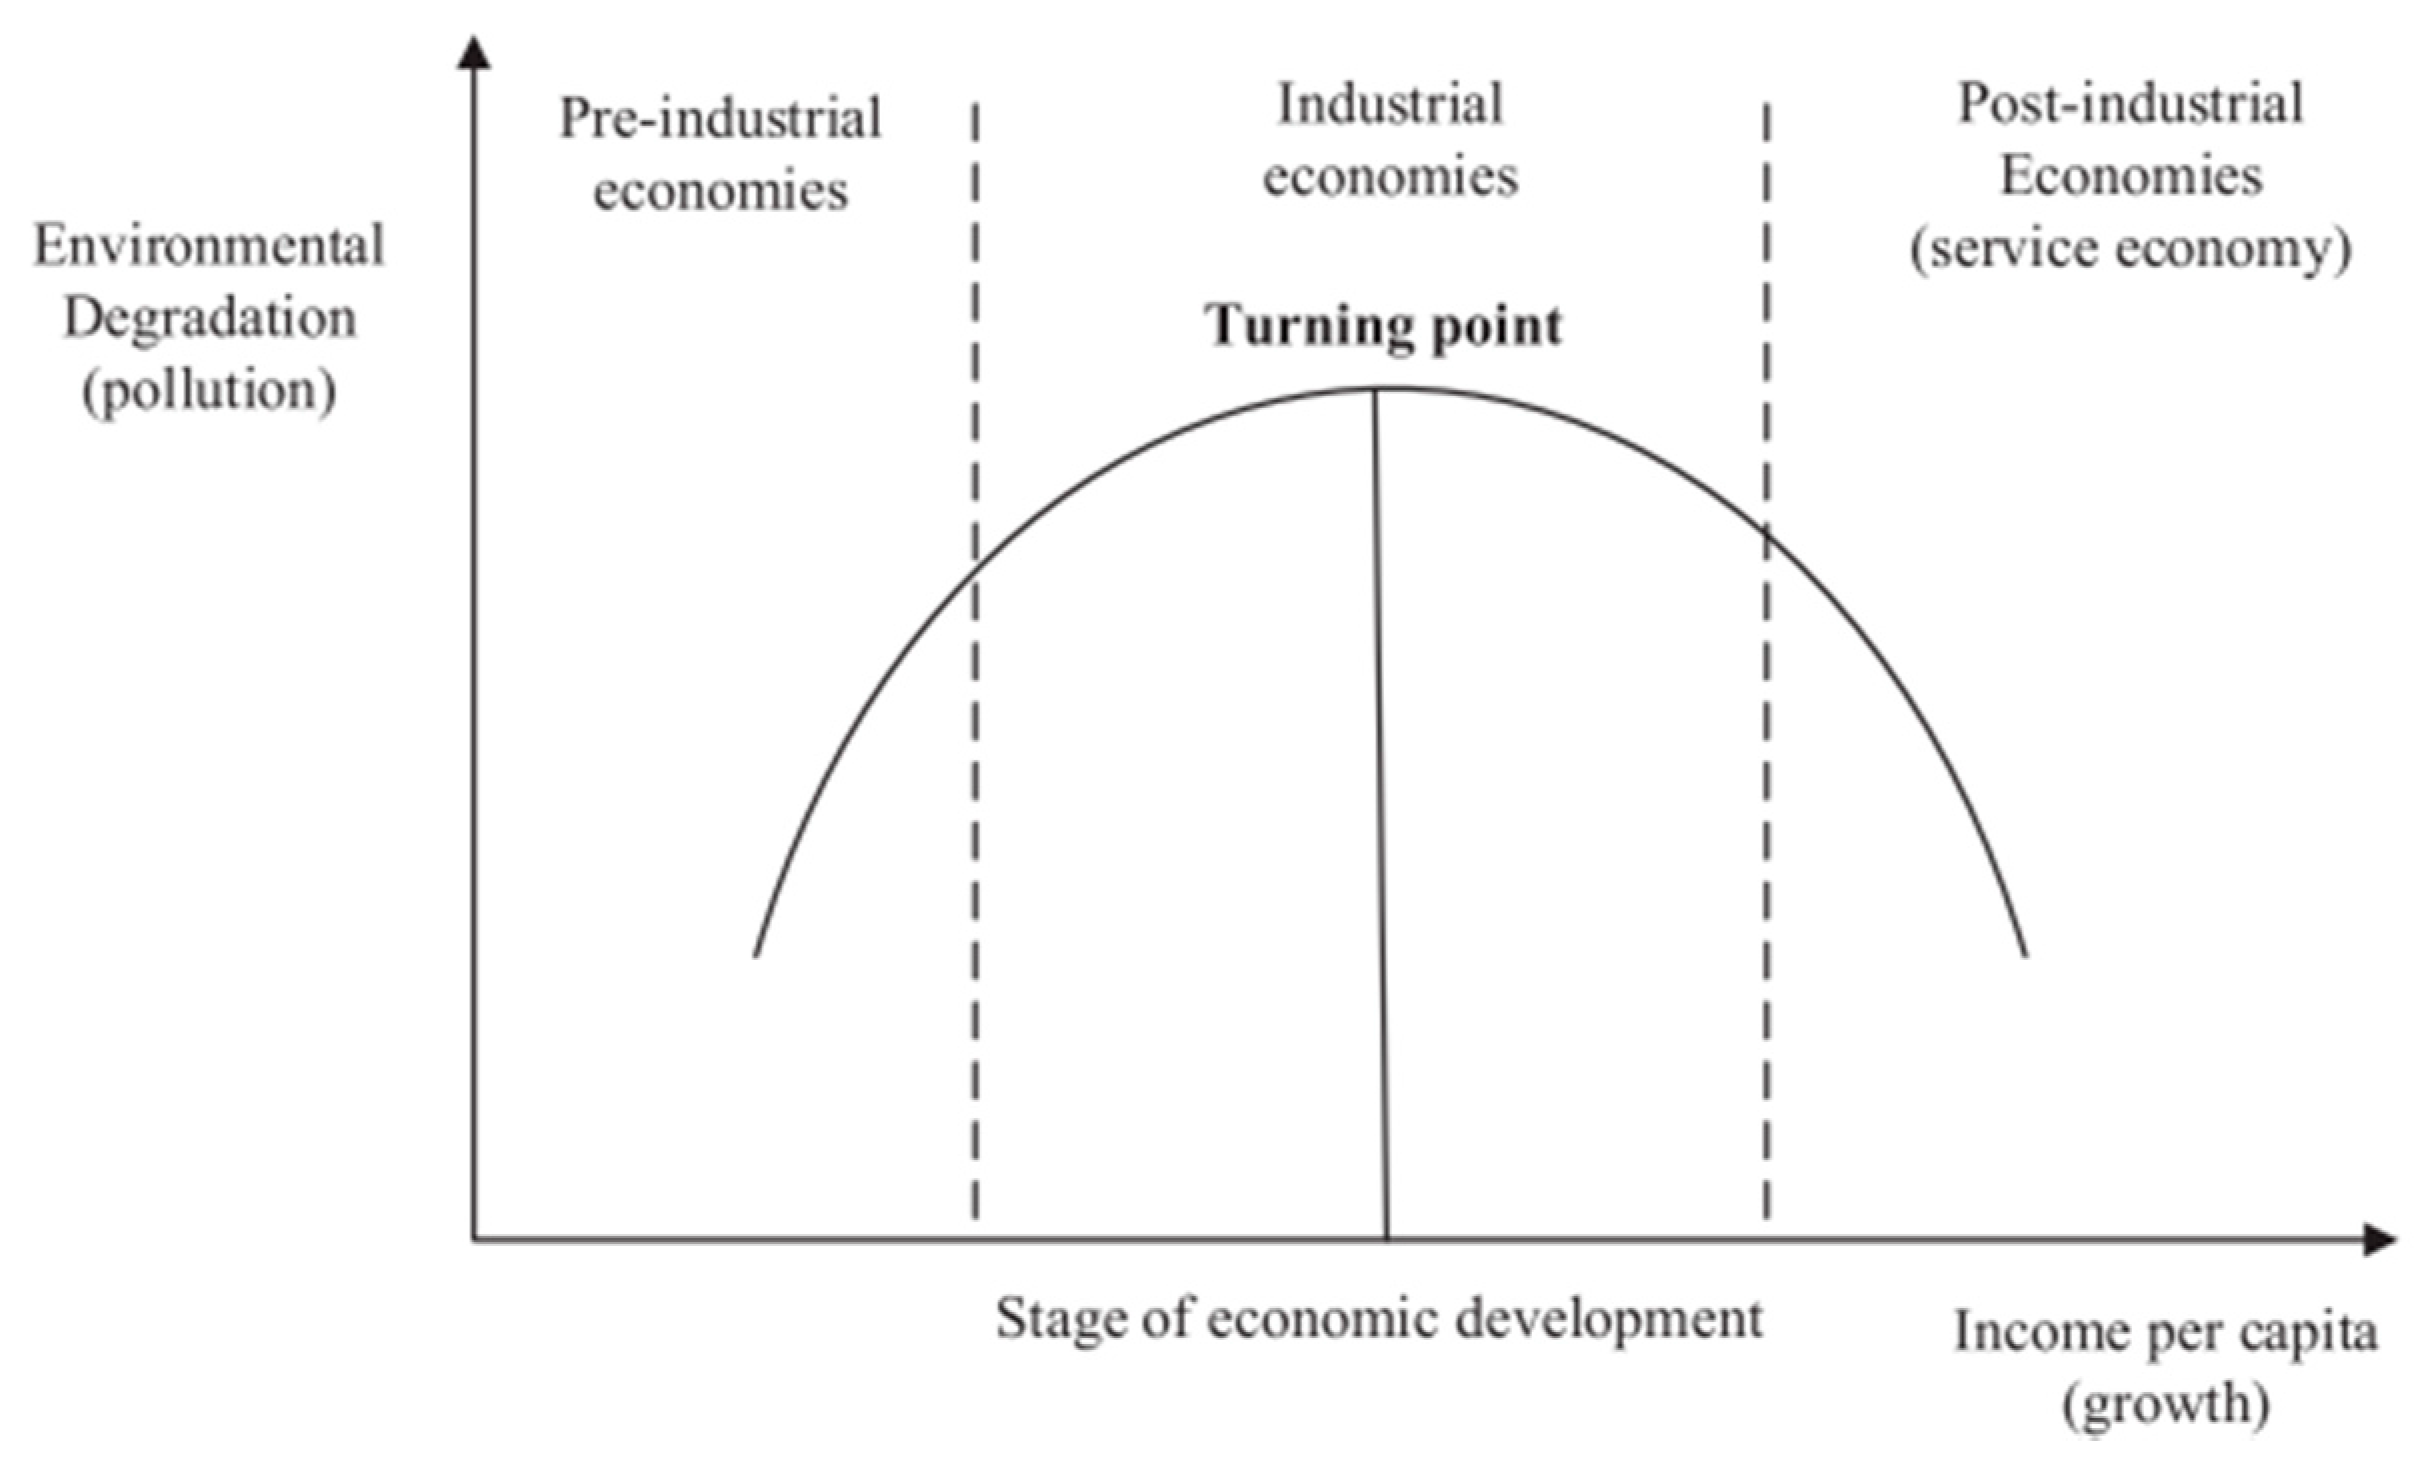
The environmental Kuznets curve (EKC) was used by Panayotou [18], establishing an inverted U-shaped relationship between economic growth and environmental degradation (see Figure A1 in Appendix A). This curve proposes that those countries that are in their initial stages of development cause greater degradation until reaching a certain level of development, and from then on, they tend to decrease their environmental degradation by implementing measures to reverse the situation generated during the process.
Based on the argument presented, the empirical evidence will be divided into two groups. The first one groups those studies that support the hypothesis of the environmental Kuznets curve [19,20,27]. In the second group, we find those investigations that consider the effect of a measure implemented to contribute to an improvement in environmental quality, such as the liberalization of the internal energy market [22,35,36].
In the first group, different empirical investigations validate the existence of the EKC in different contexts according to the study period, and the econometric method used [37]. A study developed by Alam et al. [38] for Brazil, China, India and Indonesia with time-series data of carbon emissions, economic growth, energy consumption and population growth demonstrates the existence of the long-term EKC in these countries. Similar studies applied to Croatia, Denmark, Italy and Algeria, using the autoregressive distributed lag method (ARDL) show the same results, where it is seen that as GDP per capita increases, CO2 emissions are reduced, so measures that have a conservative effect on GDP per capita should not be implemented [39,40,41].
On the other hand, Ardakani and Seyedaliakbar [27] studied the validity of the environmental Kuznets curve in seven oil-rich Middle East and North African (MENA) countries, using panel data, which combine time series and cross-sectional data, that is, the same cross-sectional unit is studied over time. It was determined that the application of the Kuznets curve varies in each country due to the stage its GDP is in with respect to the inflection point they must reach. According to several studies, an aspect to be taken into account is the consumption of renewable energy, the use of environmentally friendly technologies, as well as urban policies in order to accelerate the process in which the EKC reaches its inflection point [42,43,44].
By contrast, other investigations show the invalidity of the environmental Kuznets curve in their results. Adu and Denkyirah [45] showed that economic growth has a positive impact on long-term emissions in their study for West Africa. The results suggest that it is necessary to intervene through environmental and economic policies that help prevent environmental degradation without harming economic growth [46]. In addition, there are studies such as that by Churchill et al. [20], carried out in 20 OECD countries, in which it was observed that countries such as Australia, Canada and Japan had an N-shaped EKC. These results suggest that these countries should be concerned with maintaining a clean industrial sector with environmentally friendly techniques in the long term [47].
On the other hand, different studies have included other variables to search for a greater explanation. Wang et al. [48] stand out with an investigation for the BRICS countries, in which it is shown that corruption plays a regulatory role in this relationship, which means that when there is control over corruption, CO2 emissions will be lower, and the economic growth of the country will be higher. Other studies included variables such as trade openness and financial development, observing that they increase energy consumption but reduce CO2 emissions by expanding the options in the energy market [49].
At the same time, variables such as population size, energy consumption and fossil electricity generation are positively related to CO2 emissions [21,50]. However, the effect of other variables on CO2 emissions, such as urbanization, varies significantly according to the stage of development and the income level faced by each country [51].
In the second group, it is observed that when implementing the policy of liberalizing the internal gas and electricity market, this has repercussions not only at the economic level but also at the environmental level. These studies reveal that the effect can be positive, causing more competitive industries to be generated with more environmentally friendly energy sources, which contribute to reducing gases that cause climate change. However, in other cases, the effect can be the opposite of what was expected [52,53,54].
Different studies reveal that the liberalization of the energy market will be essential to strengthen the consumption of renewable energy, as a consequence of reducing entry barriers, as well as the monopoly power of energy companies, establishing affordable prices for consumers [12,13,14]. Scholars such as Chapman and Itaoka [55] establish that the diversity of energy sources will make consumer decisions be guided by environmental reasoning.
Moreover, Meyer [22] and Akkemik and Oğuz [23] reveal that the liberalization of the energy market is a complex process, in which support from the government is required in order to achieve greater efficiency and develop energy systems that generate welfare for consumers and the environment, influencing the energy market to promote the production of electricity from renewable energy sources, which contributes to improving environmental sustainability [56]. However, despite the opportunities that the liberalization of the energy market implies, there are also risks due to the distortions in the transition, which is a problem for reducing CO2 emissions [15,16,17]. Several studies show that the technology required for the generation of renewable electricity has high costs, so that power plants that use coal, oil, natural gas or nuclear energy remain the most accessible options [57,58]. In addition, the lack of incentives to invest in a sustainable energy system has its impact [59,60,61].
Furthermore, Syri et al. [35] question the statement that nuclear energy is not competitive in the European liberalized electricity market due to the fact that Finland has been liberalizing its market since the 90s and maintains its nuclear power plants active and under development. However, Peña-Torres and Pearson [62] argued that nuclear technology was unlikely to gain space in liberalized energy industries.

3. Methodology

3.1. Data

In this study, data from the World Development Indicators of the World Bank (WB) [63] and the European Statistical Office (EUROSTAT) [64] were used. The research covers 27 of the countries of the European Union. The countries of the European Union (EU) were classified into two groups according to their income level using the Atlas Method of the World Bank [63]. The first group contains high-income countries (HIC), and the second group contains upper-middle-income countries (UMIC). The classification of the countries is found in Table A1 as Appendix B.
The dependent variable is the logarithm of carbon dioxide emissions from the energy industry, and the independent variable is the logarithm of the gross domestic product (GDP). Figure 1 represents the evolution of the basic variables of the model in the US and in the HIC and UMIC. GDP shows an upward trend, the same one that is widely higher in HIC. On the other hand, CO2 emissions are lower in the UMIC. However, for both groups of countries, this variable shows a decreasing trend in the period examined.
The model also included six control variables, such as trade openness, renewable energy, non-renewable energy, industry, urbanization rate and economic growth. Finally, to capture the quadratic form of the EKC, the squared GDP logarithm was included. Some of the variables used in the models were transformed to logarithms in order to reduce the range of the variable by one unit smaller than the original one. Table 1 describes the variables used in the estimations of econometric models.
Table 2 presents the main descriptive statistics of the variables for EU, HIC and UMIC, such as the mean, median, minimum, maximum and standard deviation, which describe the characteristics of the variables prior to econometric modeling.
The inclusion of variables in the econometric model was based on the EKC theory and on the empirical evidence described in Section 2, which considers carbon dioxide emissions to measure environmental degradation. A variable used in the analyses by Wang et al. [51], Olale et al. [37] and Rafindadi [49] is trade openness, which shows the ability of a country to establish trade relations with the rest of the world, which depends on the tariff barriers that have been established.
The renewable and non-renewable energy variables were used by Hdom [50], Yao et al. [42], Cai et al. [65] and Dong et al. [21] to indicate the type of energy consumed in different countries and its impact on CO2 emissions. Moreover, other researchers such as Kacprzyk and Kuchta [2], Liu, Ren, Cheng, and Wang [3], Moye Uddin [31] and Munir, Hooi, and Smyth [32], use the industry as a determinant of CO2 emissions, which comprises the added value of industries and the supply of electricity, gas, among others.
Finally, studies such as those by Muhammad [44] and Wang et al. [48] incorporate the urbanization rate and population growth, particularly Fujii et al. [43], who incorporate them simultaneously, to determine the transformation of a natural space and the development of cities due to the continuous concentration of populations that have increased over time.

3.2. Econometric Approach

The aim of this study is to demonstrate the effect of liberalizing the internal energy market on CO2 emissions in the European Union from 2004 to 2017. The two-way fixed effects model is applied with panel data. First, the relationship between carbon dioxide emissions and economic growth at the EU level and by income levels is examined, based on the hypothesis proposed by Kuznets [66], subsequently applied to environmental issues by Panayotou [18]. The hypothesis of the environmental Kuznets curve is formalized in Equation (1), relating CO2 emissions and economic growth:
l o g ( C O 2 i t ) =   β 0 i t + β 1 l o g ( G D P i t ) + β 2 l o g ( G D P 2 i t ) + ε i t
where log (CO2) represents carbon dioxide emissions in thousands of tons, log(GDP) represents the logarithm of the gross domestic product, the log(GDP)2 represents the logarithm of the squared gross domestic product, and Ɛit represents the term error, which, being a fixed effect estimate, is divided into a fixed part, which is constant for each individual ( v i t ) and another part that constitutes the random error term ( u i t ). The subscript i represents the country number i = 1, 2, 3, …, 27 in the period t = 2004, 2005, …, 2017. The three variables are expressed in logarithms and the base year for GDP is 2010. In the second stage, we will implement a dummy variable in Equation (1) in order to evaluate the effect of the policy:
l o g ( C O 2 i t ) =   β 0 i t + β 1 l o g ( G D P ) i t + β 2 l o g P l i t + ε i t
In Equation (2), the variable Plit captures the effect of the policy and is assigned a value of zero for the years before introducing the policy t = 2004, 2005, …, 2010 and 1 for the years t = 2011, 2012,..., 2017, in which the policy came into force. Furthermore, the proposed relationship may vary depending on different variables, for which Equation (3) is formalized:
l o g ( C O 2 i t ) =   β 0 i t + β 1 l o g ( G D P ) i t + β 2 l o g P l i t +   β 3 Z i t + ε i t
where Zit is a vector that represents the control variables detailed in Table 1, in order to improve the robustness and results of the model.
On the other hand, this study aims to evaluate the effect of the policy over time. Equation (4) is proposed for this purpose, which provides greater consistency to the model and allows for a better assessment of the results:
l o g ( C O 2 i t ) =   β 0 i t + β 1 l o g ( G D P ) i t + β 2 Z i t + β 2 l o g P l i t ( t 1 ) +   β 3 l o g P l i t ( t 2 ) +   β 4 l o g P l i t ( t 3 ) + + β n P l i t ( t n ) + ε i t
where the variable Pl(t1,t2,…,tn) captures the effect of the policy in each year since its implementation. Following Galiani et al. [67] and Albalate [68], this strategy is applied to timing effects to test for invariant heterogeneity over time.
Furthermore, for the panel data models, a choice must be made between a fixed-effects model (FE) and a random-effects model (RE), for which the Hausman test [69] was applied. The fixed-effects model was found to best fit the data. In addition, the Wooldridge test [70] was used to detect autocorrelation and the modified Wald test to detect heteroscedasticity. The existence of the two problems in the model was observed, so the generalized ordinary least squares (GLS) model was applied to correct them.

4. Results and Discussion

This section presents the results obtained from calculating the equations presented in the methodology for 27 European Union countries. By means of the first equation, the hypothesis of the environmental inverted U of Kuznets [
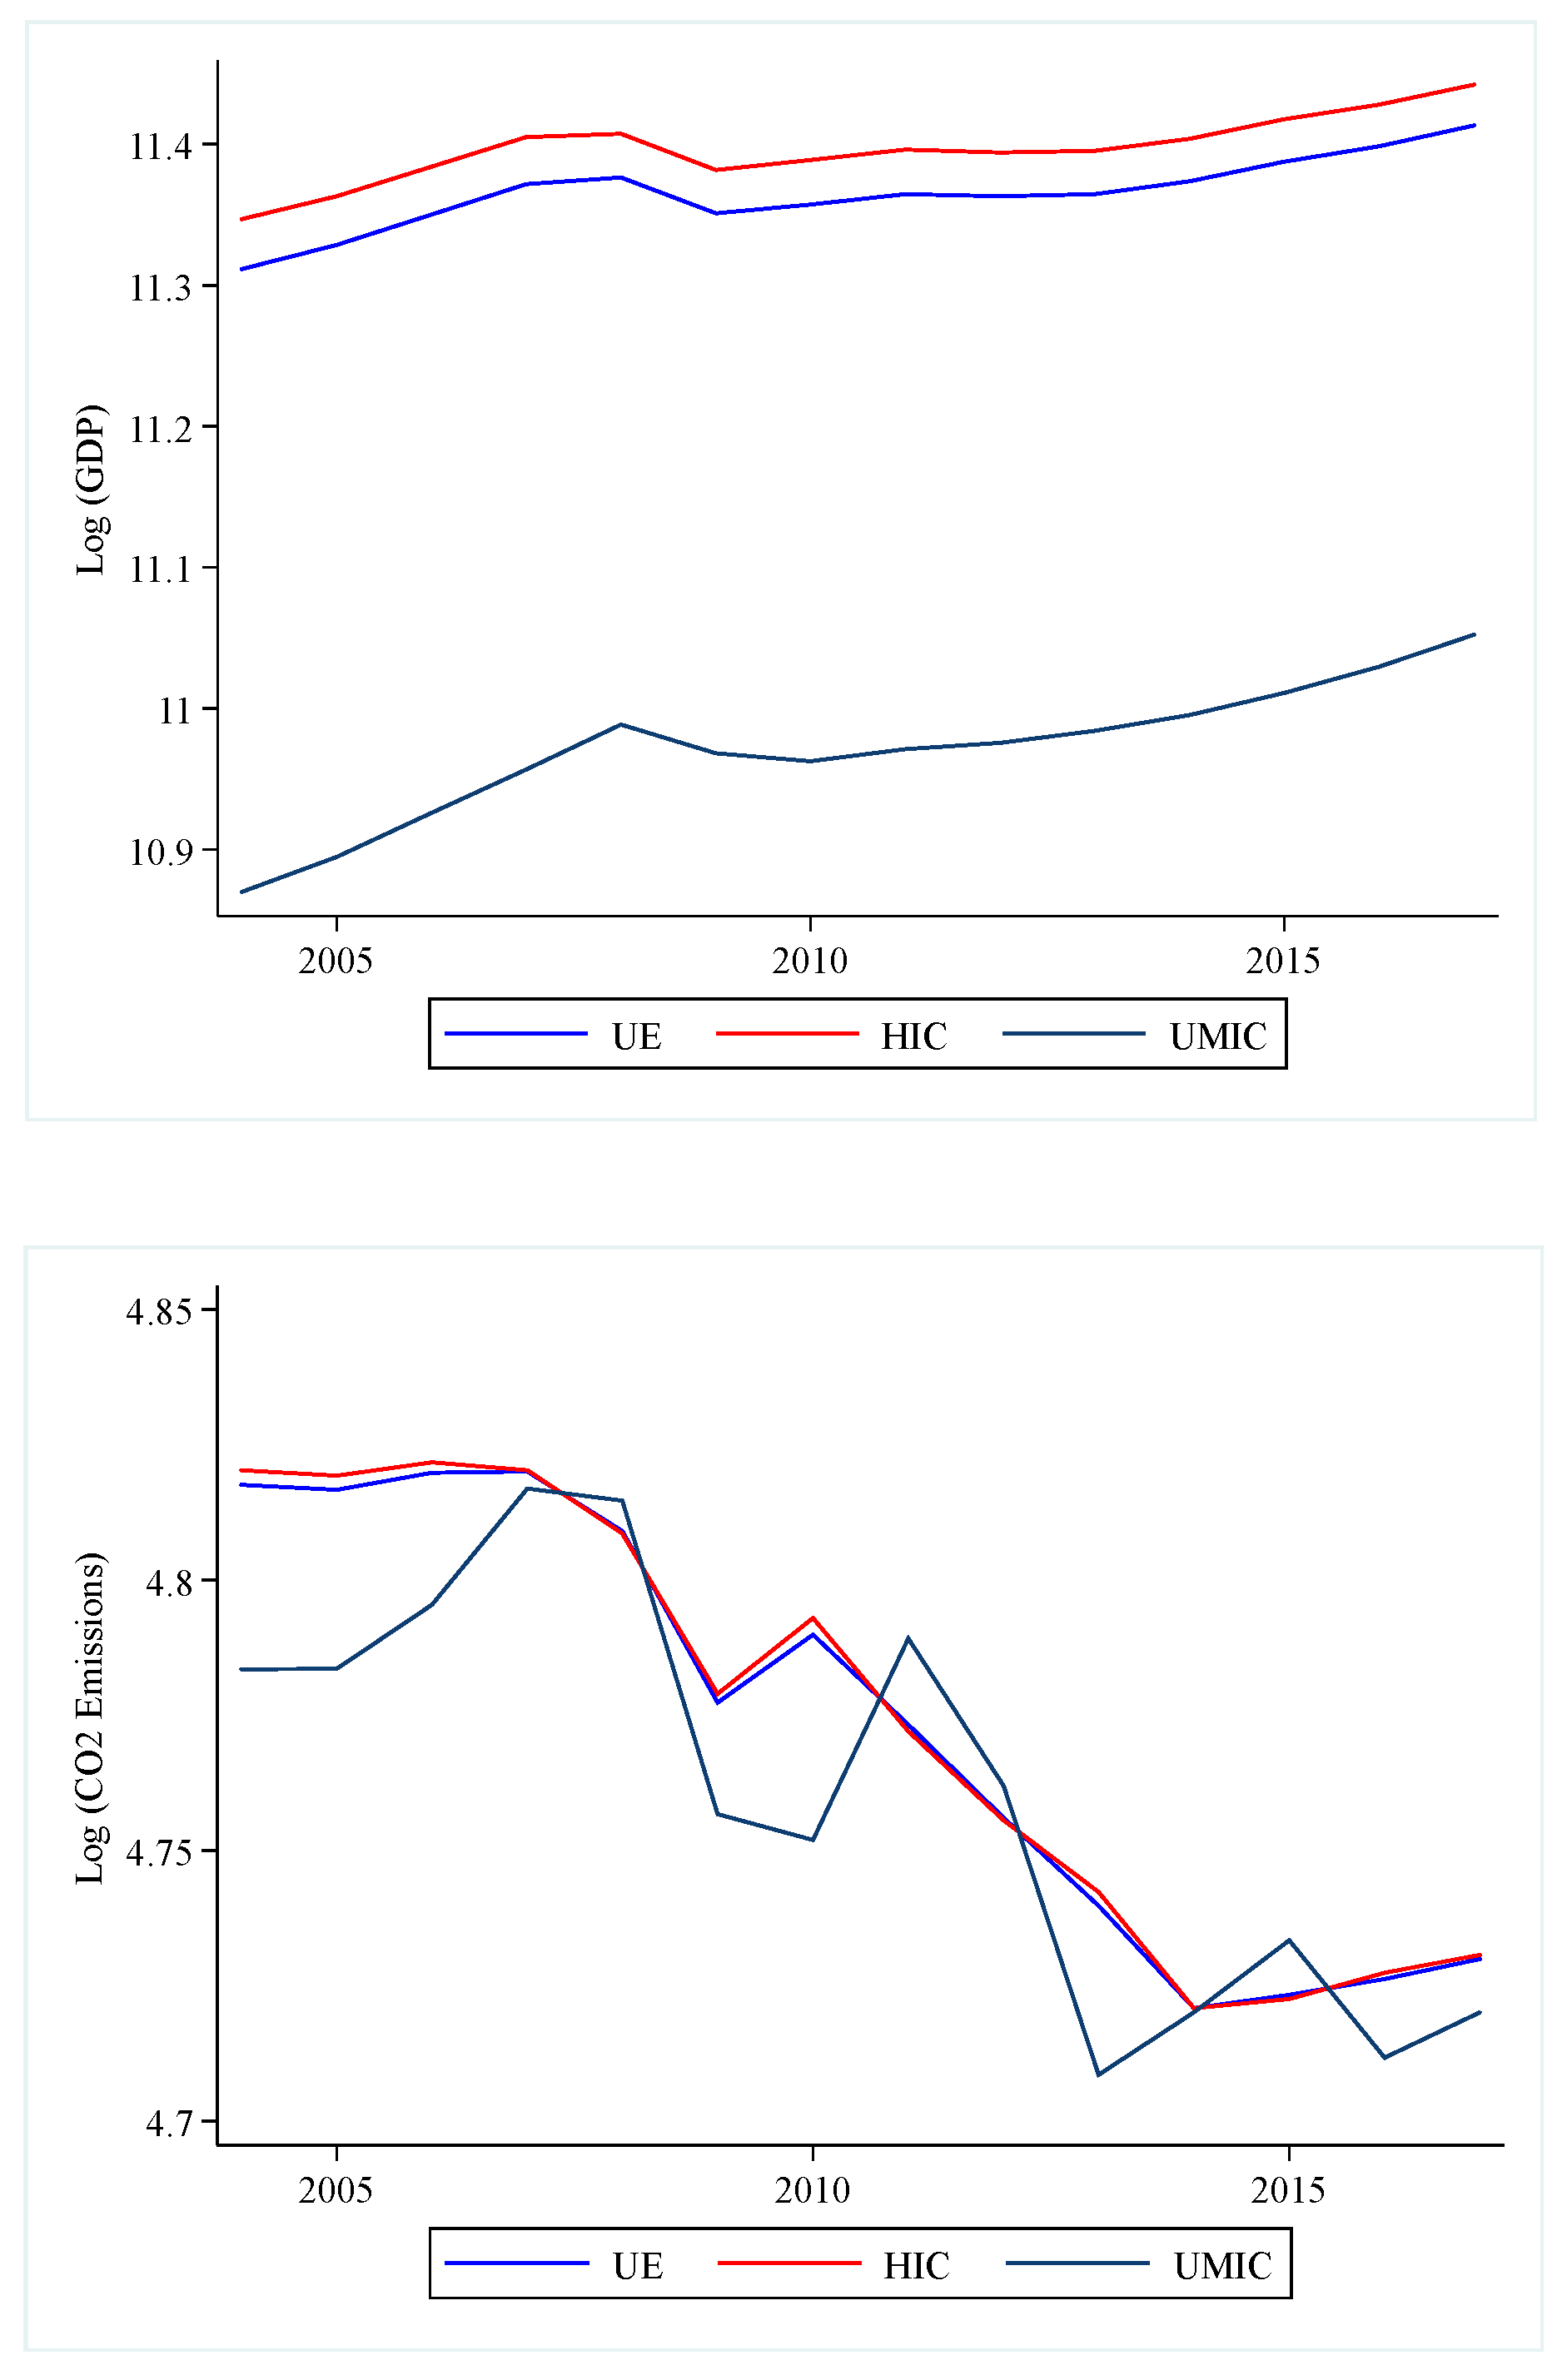
66] is verified, both EU and according to the income level of European countries. The results as shown in Table 3 when estimating Equation (1) indicate that the EKC hypothesis is rejected for European countries, as for the HIC and UMIC, because the sign of the log (GDP) and log (GDP)2 coefficients are not as expected and are also not significant, except for HIC.
The results obtained for HIC are related to those of Adu and Denkyirah [45], which suggest that economic growth will impact CO2 emissions positively in the long term, which means that the quality of the environment will be affected.
The results of the second equation are shown in Table 4, in which the policy of liberalization of the internal energy market was included, observing that at the EU level and according to the income level, economic growth is positively related to carbon dioxide emissions. However, when implementing the policy, its effect on carbon dioxide emissions is negative, which coincides with what is established by Nicolli and Vona [12], Iimura and Cross [13] and Tsybina et al. [14], who explains that it is a measure that helps to strengthen the renewable energy market by eliminating the barriers imposed by protectionism, benefiting both the environment and consumers. However, these results are in contradiction with Ringel [15] and Daví-Arderius et al. [59], who state that this measure has risks that cause the objective set not to be met due to the distortions found in markets and the complexity of the transition.
The third stage consists of adding the control variables to the model to give it greater consistency. Table 5 presents the results of Equation (3) at the EU level. It can be seen that incorporating the trade openness variable has a negative and significant impact on carbon dioxide emissions. This result coincides with Rafindadi [49], Alam et al. [38], Olale et al. [37] and Muhammad [44], who found that commercial openness increases energy consumption as commercial activity increases; however, it also reduces CO2 emissions since more competitive environments are created that encourage the use of energy-efficient technologies that contribute to improving environmental quality. Having access to a variety of renewable and non-renewable energy sources, according to Chapman and Itaoka [55], will result in them choosing those that best suit their preferences, with their environmental reasoning predominating.
Consequently, the consumption of renewable and non-renewable energy was included in the model, which are negatively and positively related to CO2 emissions, respectively. In turn, the increase in the consumption of renewable energy in the European Union is positively associated with the implementation of food tariff policies and green certificates [71,72,73], as well as the interconnection to the electricity grid [74]. The relationship between the consumption of renewable energy and CO2 emissions is consistent with that proposed by Yang [52] and Lise and Kruseman [54], who established that the energy obtained from renewable resources such as wind, sunlight, water resources (tides, rivers and waves), among others, do not emit CO2 emissions. Similarly, Nathaniel and Khan [75] and Khan, Yu, Belhadi, and Mardani [76] establish that the consumption of renewable energy is a driver to avoid deterioration and environmental degradation. However, this study does not take into account the land needed to install the wind, solar thermal and hydroelectric plants. On the contrary, those that come from fossil fuels, according to Dong et al. [21] and Hdom [50], are the ones that generate the highest emissions of pollutant gases, being the cause of climate change that our planet is experiencing.
Furthermore, Table 5 shows the positive relationship between the added value of the industry and CO2 emissions. The results that coincide with Liu et al. [3], Awaworyi Churchill et al. [28] and Zafar et al. [34] make economic sense since increased industrial activity produces higher CO2 emissions if the sources used to satisfy its energy demand are non-renewable. In addition, due to the activity, they are engaged in, according to EUROSTAT [64] data, the manufacturing and construction industry is responsible for emitting 443.64 million tons of CO2 annually, due to the fact that they are dedicated to the production of iron and steel, nonmetallic minerals, chemicals, food processing, beverages and tobacco, pulp, paper and printing, among others. On the other hand, it is observed that the urbanization rate and population growth are negatively related to CO2 emissions. Wang et al. [51] and Fujii et al. [43] express that their impact will vary according to the development stage and level of income received by the study countries. In the case of European Union countries that maintain a high and upper-middle-income level, the population has a greater environmental awareness that is negatively related to carbon dioxide emissions.
Table 6 and Table 7 show the results of Equation (3) according to the income level of the countries that are classified as high and upper-middle, respectively. Contrasting the results obtained, it can be seen that in the case of the HIC, the policy and variables of trade openness, renewable energy, non-renewable energy, industry, urbanization rate and population growth are significant and act in a similar way at the EU level.
In the case of the UMIC, they have some peculiarities and act in a different way from the UE level case. The countries belonging to this group are Bulgaria and Romania, where it is evident that the policy is significant without the inclusion of the control variables. Thus, when implementing the trade openness variable in the model, the policy loses its significance. However, the impact of this variable on carbon dioxide emissions is negative. These results may be associated with the establishment of competitive environments that encourage countries to innovate and improve business productivity, using more efficient technology [49].
The consumption of renewable energy is also included in the model, which loses its significance by including a variable that measures the consumption of non-renewable energy. These results may be associated with the fact that, according to EUROSTAT [64], 18.9% of the energy consumed by the European Union comes from renewable sources, currently being part of the largest electricity producers. However, fossil fuels continue to dominate the energy market, setting the general trends in electricity prices [50,60,62].
Consequently, the last model includes the industry variable, which shows a positive and statistically significant relationship with CO2 emissions. For example, this is due to the fact that the industrial sector represents 23.8% of the GDP for Bulgaria and 29% of the GDP for Romania [64] because they demand more fossil fuels. Then the urbanization rate is added, which is not significant, along with the population growth that is negatively correlated with CO2 emissions. Results opposed to the findings of Dong et al. [21], who showed that population growth has a positive impact. However, other studies show that the characteristics of each country should be considered [43,48]. It should be noted, as mentioned by Meyer [22], that the transition is complex, and countries need time to adapt and have the expected results.
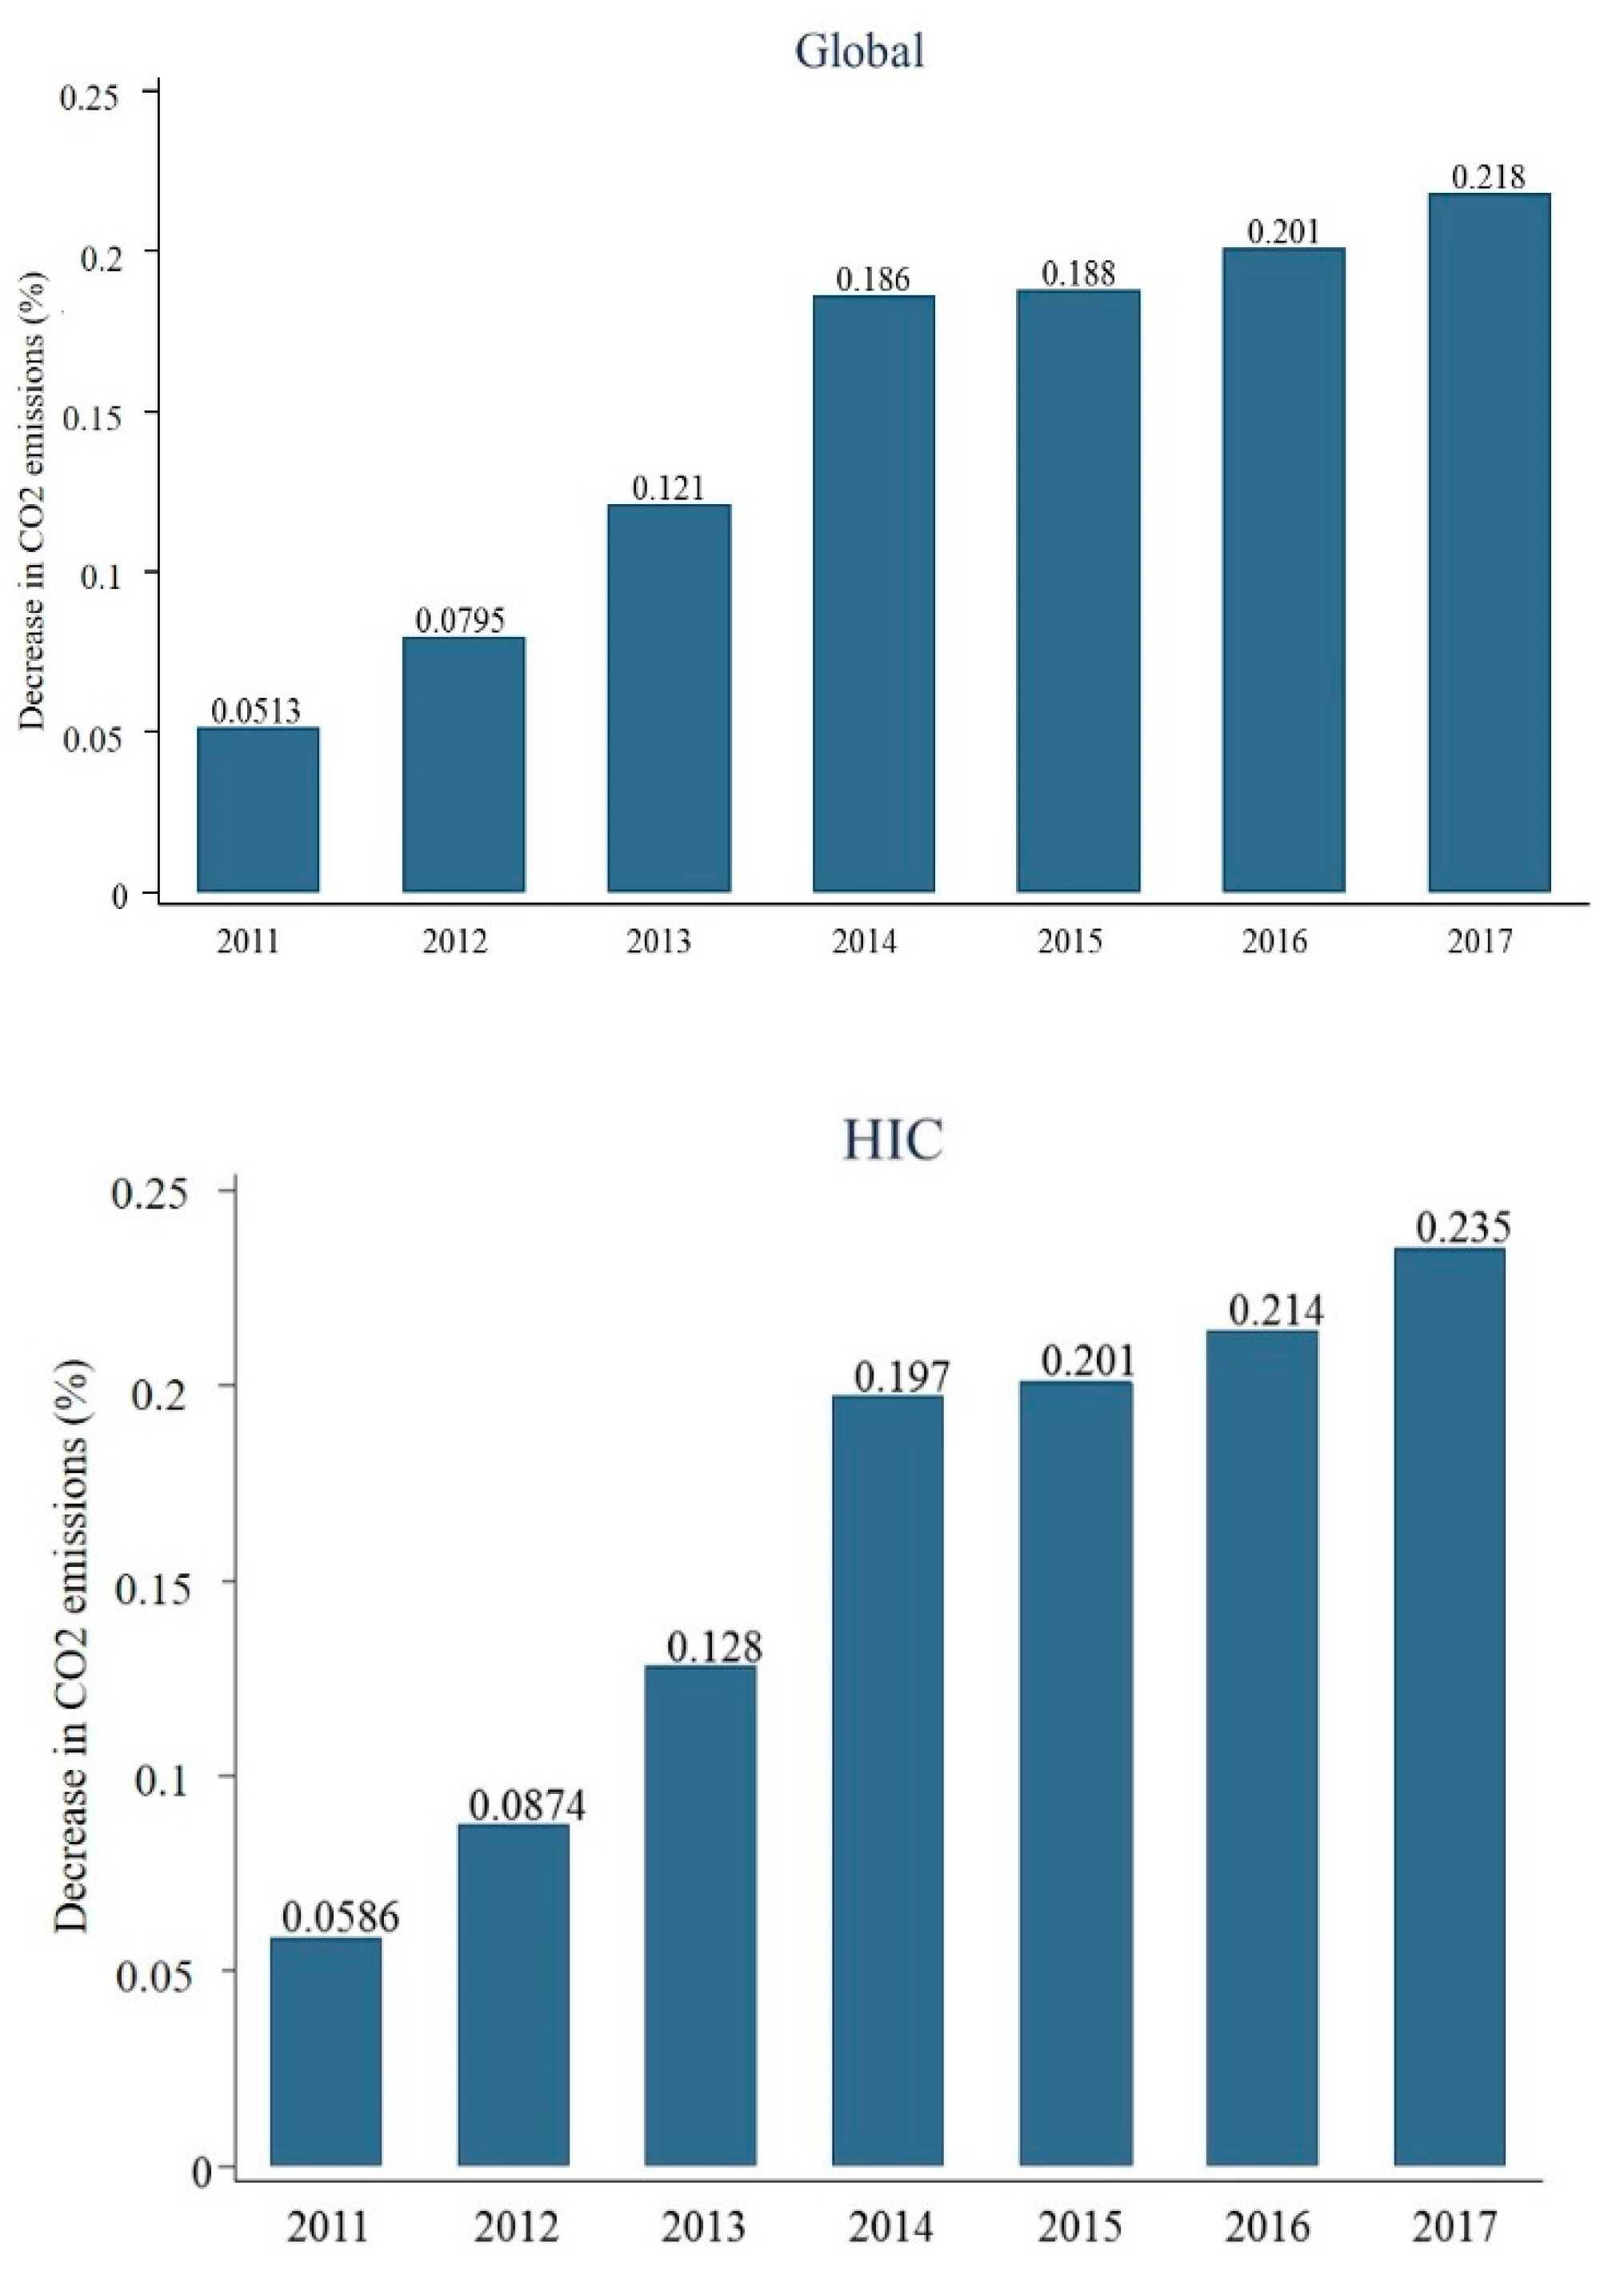
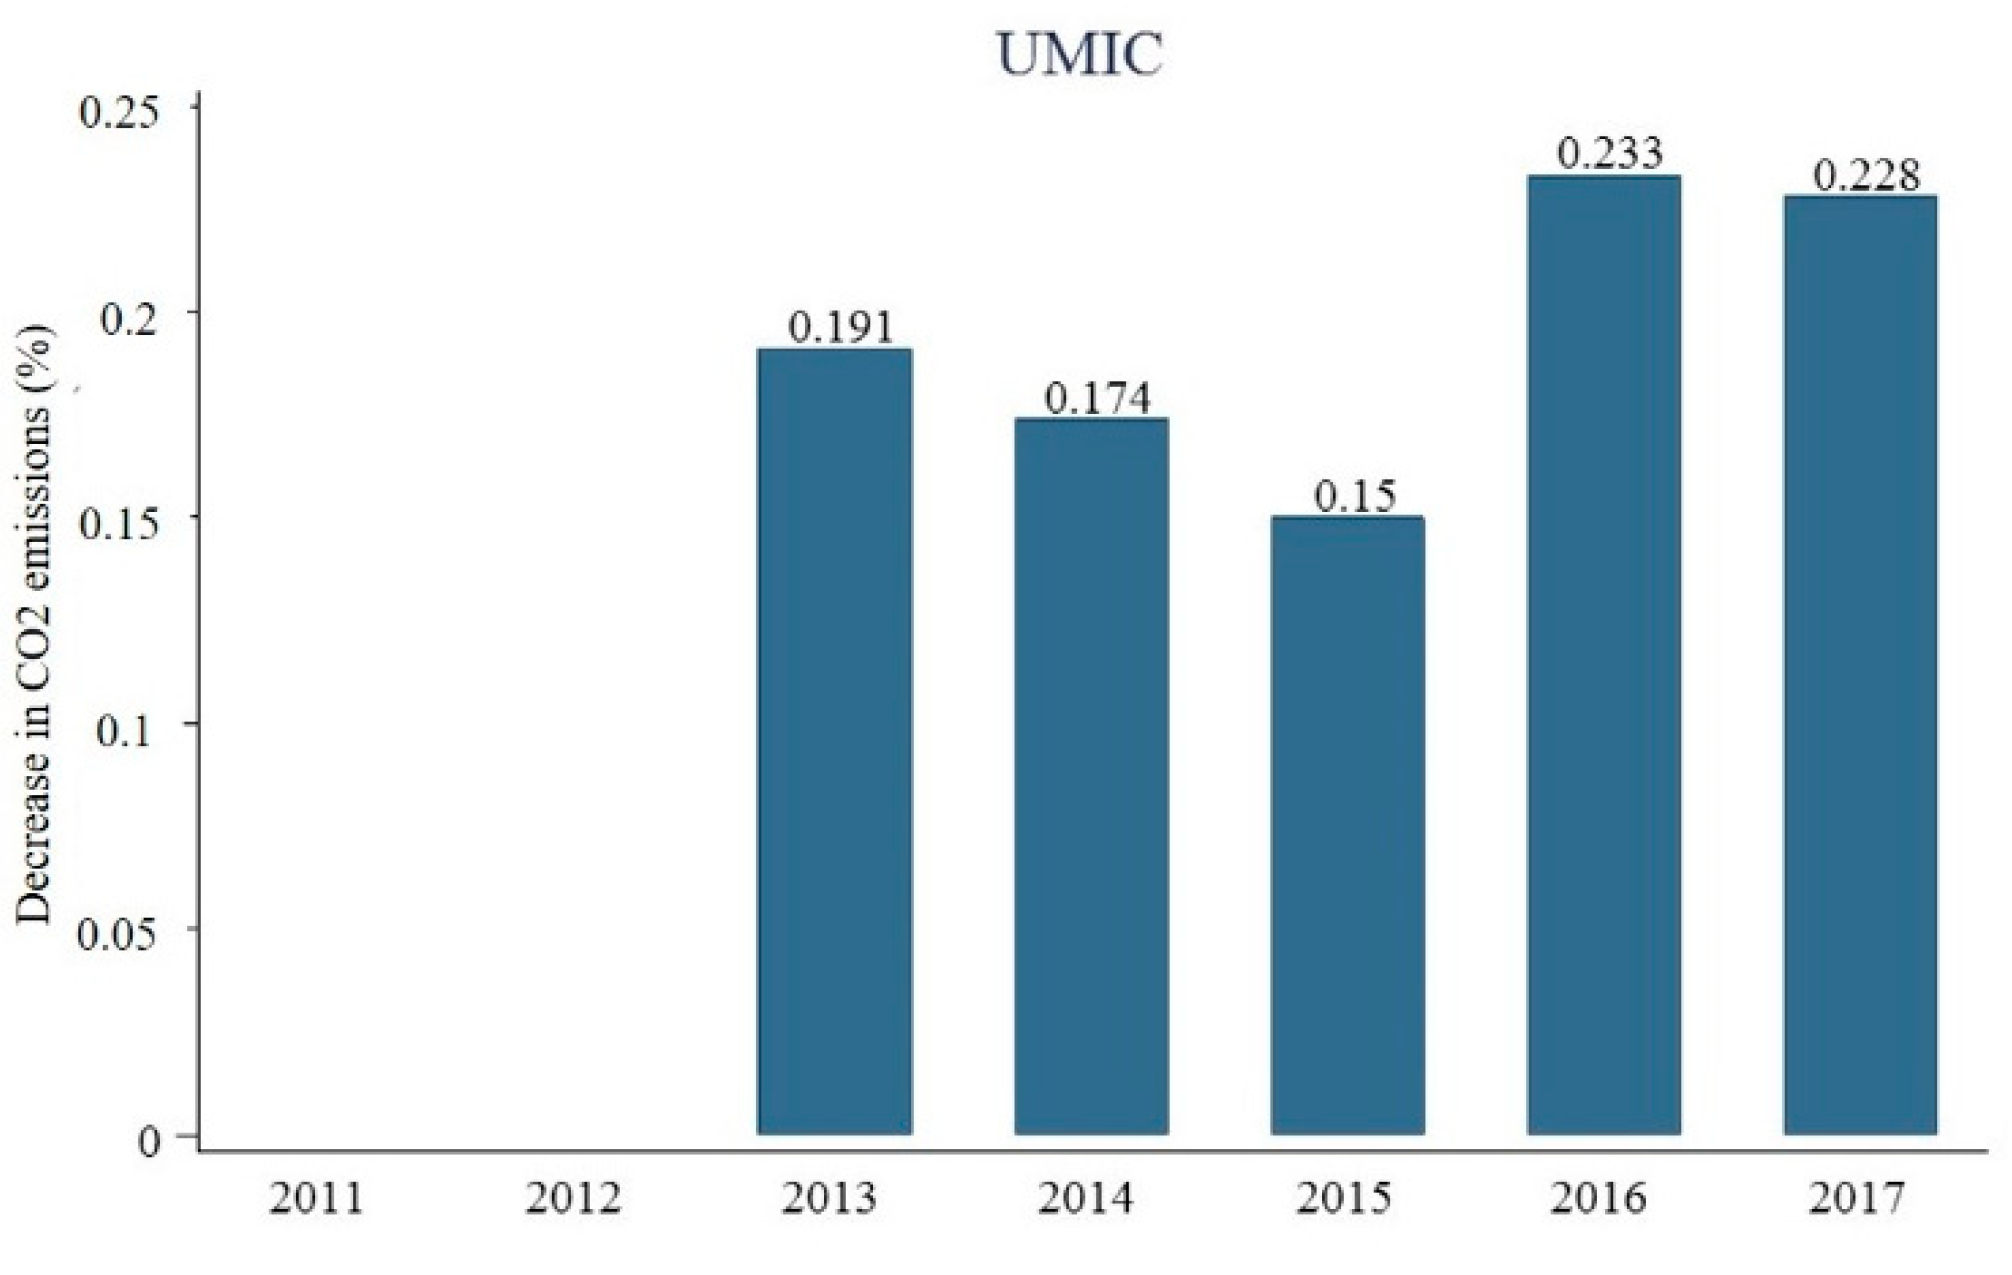
Having identified the effects of the policy in general and of different variables on carbon dioxide emissions in the period analyzed (2004–2017), we proceed to evaluate the effect of liberalizing the internal energy market each year, from the moment the policy entered in force. Thus, we apply the timing effects to evaluate the effect of the policy in each of the years in which it is in force. To capture the effect over time since the policy was implemented (2011–2017), a binary variable was included. This specification allows the effect of the policy to be quantified for each year in the study countries and according to the income level they have.
Table 8 shows that the effect of the policy over time at the EU level was immediate. The result obtained is due to the liberalization process that the European Union started in 1996. Taking the coefficients into account, a pattern can be observed, which indicates that the reduction in carbon dioxide emissions tended to increase from the fourth year after the policy was implemented, going from a reduction of 0.05% to 0.19% in carbon dioxide emissions. According to Sánchez and da Silveira [77], this result is due to the fact that the liberalization of the internal energy market has been a progressive process in which there have been different stages, which, according to the characteristics of the countries, have been fulfilled at different times.
When analyzing the effect of the policy according to the income level of the countries that make up the European Union, it is observed that in the HIC, the effect was immediate. Emissions began to decrease by 0.05% until reaching a decrease of 0.24% in 2017. However, in the UMIC, there was a two-year delay in the effect of the policy to be able to observe significant effects on carbon dioxide emissions, starting with a 0.19% reduction in carbon dioxide emissions from energy systems. Bulgaria and Romania belong to the UMIC category, which according to the documentation of the European Parliament [8] took advantage of the different deadlines granted by the European Union to fully liberalize their internal energy market, taking them more time than the HIC, who was already executing the measure progressively, presenting a higher environmental performance [36].
Generally, it is expected that the benefits from the liberalization of the internal energy market will be achieved with some delay, due to the particular characteristics of the different countries that make up the European Union, in which some adjustments are required by their respective governments, so that they adapt to the new system, ensuring the functioning of an affordable, sustainable energy market that protects consumers’ interests [61].
Substantial long-term effects of at least seven to eight years are regularly confirmed. In order to gain a better assessment, Figure 2 shows the patterns of the effects that occurred in carbon dioxide emissions at the EU level and according to the income level of the countries (the values represent the percentage decrease in contamination).

5. Conclusions and Policy Implications

Preventing climate change is one of the main challenges facing the world in recent decades due to the great damage caused to nature and which affected the well-being of the species that inhabit this planet. The European Union parliament focused its policies on the gas and electricity sources maintained by the countries that comprise it. The liberalization of the internal energy market in 2011 seeks to build a sustainable competitive market, marking a before and after in the energy sector. Therefore, evaluating the results of this policy is essential to generate a roadmap that allows achieving environmental sustainability in countries of the rest of the world. However, the social, economic and demographic particularities of the countries in which it is intended to apply this type of measure must be taken into account. This study shows that the liberalization of the internal energy market was an effective measure for European countries, although there were particularities due to the socioeconomic context they have. As demonstrated, the policy was effective at the EU level and in high-income countries, not only taking into account the dynamization of the economy, but also when considering other social and economic characteristics that are included in the control variables examined. However, upper-middle-income countries do not have the same significance. Due to the political variable, it loses significance (−0.127%) when including control variables. The results show that the policy at the EU level (between 0.0219% and 0.0620%) and by high-income level (between 0.0254% and 0.0742%) managed to reduce carbon dioxide emissions in 27 European Union countries between 2011 and 2017. These results coincide with the literature review presented in the second section, which suggests that carbon dioxide emissions are reduced with the liberalization of the internal energy market.
The benefits of the policy are not evident in the short term, as it is a policy that was applied progressively. Policies aimed at reducing CO2 emissions should focus on facilitating foreign trade, moderating trade barriers that prevent the efficient use of resources, and providing financial and operating facilities to renewable energy suppliers in order to boost their production and consumption. Future research should incorporate variables that demonstrate the level of governance that the different countries have in order to identify their effects on the application of policies. One of the limitations of the study is the lack of a variable that enables to know the behavior of the companies in the sector before and after the application of the policy.

Author Contributions

Conceptualization, Investigation, Methodology, Formal Analysis, Writing—Original Draft Preparation and Writing—Review & Editing, P.P., C.O., V.Á. and M.d.l.C.d.R.-R. All authors have read and agreed to the published version of the manuscript.

Funding

This research received no external funding.

Conflicts of Interest

The authors declare no conflict of interest.

Appendix A

Figure A1. Environmental Kuznets curve. Source: Panayotou (1979).
Energies 13 06116 g0a1

Appendix B

Table A1. Countries of the European Union.
HICUMIC
Countries of the European UnionAustria, Belgium, Croatia, Cyprus, Czech, Denmark, Estonia, Finland, France, Germany, Greece, Hungary, Ireland, Italy, Latvia, Lithuania, Luxembourg, Netherlands, Poland, Portugal, Slovakia, Slovenia, Spain, Sweden, United KingdomBulgaria, Romania

References

  1. Gillich, A.; Brodecki, L.; Hufendiek, K. Impacts of complementing goals besides emission targets on CO2 mitigation cost: A model-based analysis. Energy Strat. Rev. 2019, 26, 100395. [Google Scholar] [CrossRef]
  2. Kacprzyk, A.; Kuchta, Z. Shining a new light on the environmental Kuznets curve for CO2 emissions. Energy Econ. 2020, 87, 104704. [Google Scholar] [CrossRef]
  3. Liu, M.; Ren, X.; Cheng, C.; Wang, Z. Environment The role of globalization in CO2 emissions: A semi-parametric panel data analysis for G7. Sci. Total Environ. 2020, 718, 137379. [Google Scholar] [CrossRef] [PubMed]
  4. BP. Statistical Review of World Energy 2020, 69th ed.; 2020; Available online: https://www.bp.com/content/dam/bp/business-sites/en/global/corporate/pdfs/energy-economics/statistical-review/bp-stats-review-2020-full-report.pdf (accessed on 5 May 2020).
  5. Adedoyin, F.F.; Ozturk, I.; Abubakar, I.; Kumeka, T.; Folarin, O.; Bekun, F.V. Structural breaks in CO2 emissions: Are they caused by climate change protests or other factors? J. Environ. Manag. 2020, 266, 110628. [Google Scholar] [CrossRef] [PubMed]
  6. IEA. International Energy Agency. 2019. Available online: http://www.iea.org/statistics/ (accessed on 5 May 2020).
  7. European Commission. EU Energy in Figures; Publications Office of the European Union: Luxembourg, 2019. [Google Scholar]
  8. European Parliament. The Internal Energy Market 2018. Available online: https://www.europarl.europa.eu/factsheets/en/sheet/45/internal-energy-market (accessed on 5 May 2020).
  9. European Commission. 2050 Long-Term Strategy | Climate Action, 2020. Available online: https://ec.europa.eu/clima/policies/strategies/2050_en (accessed on 5 May 2020).
  10. Albino, V.; Balice, A.; Dangelico, R.M. Environmental strategies and green product development: An overview on sustainability-driven companies. Bus. Strat. Environ. 2009, 18, 83–96. [Google Scholar] [CrossRef]
  11. Dangelico, R.M. Green product innovation: Where we are and where we are going. Bus. Strategy Environ. 2016, 25, 560–576. [Google Scholar] [CrossRef]
  12. Nicolli, F.; Vona, F. Energy market liberalization and renewable energy policies in OECD countries. Energy Policy 2019, 128, 853–867. [Google Scholar] [CrossRef] [Green Version]
  13. Iimura, A.; Cross, J.S. The impact of renewable energy on household electricity prices in liberalized electricity markets: A cross-national panel data analysis. Util. Policy 2018, 54, 96–106. [Google Scholar] [CrossRef]
  14. Tsybina, E.; Moreno-Cruz, J.; Tereshin, A. Liberalisation lowers primary energy efficiency: Evidence from twin power systems. Energy 2019, 173, 423–435. [Google Scholar] [CrossRef]
  15. Ringel, M. Liberalising European electricity markets: Opportunities and risks for a sustainable power sector. Renew. Sustain. Energy Rev. 2003, 7, 485–499. [Google Scholar] [CrossRef]
  16. Morthorst, P.E. A green certificate market combined with a liberalized power market. Energy Policy 2003, 31, 1393–1402. [Google Scholar] [CrossRef]
  17. Meyer, N.I. European schemes for promoting renewables in liberalised markets. Energy Policy 2003, 31, 665–676. [Google Scholar] [CrossRef]
  18. Panayotou, T. Economic Growth and the Environment. In Paper Prepared for and Presented at the Spring Seminar of the United Nations Economic Commission for Europe, Geneva, 3 March; Harvard University and Cyprus International Institute of Management, Massachusetts Hall Cambridge: Cambridge, MA, USA, 1979. [Google Scholar]
  19. Mikayilov, J.I.; Galeotti, M.; Hasanov, F.J. The impact of economic growth on CO2 emissions in Azerbaijan. J. Clean. Prod. 2018, 197, 1558–1572. [Google Scholar] [CrossRef]
  20. Churchill, S.A.; Inekwe, J.N.; Ivanovski, K.; Smyth, R. The Environmental Kuznets Curve in the OECD: 1870–2014. Energy Econ. 2018, 75, 389–399. [Google Scholar] [CrossRef]
  21. Dong, K.; Hochman, G.; Zhang, Y.; Sun, R.; Li, H.; Liao, H. CO2 emissions, economic and population growth, and renewable energy: Empirical evidence across regions. Energy Econ. 2018, 75, 180–192. [Google Scholar] [CrossRef]
  22. Meyer, N.I. Renewable energy policy in Denmark. Energy Sustain. Dev. 2004, 8, 25–35. [Google Scholar] [CrossRef]
  23. Akkemik, K.A.; Oguz, F. Regulation, efficiency and equilibrium: A general equilibrium analysis of liberalization in the Turkish electricity market. Energy 2011, 36, 3282–3292. [Google Scholar] [CrossRef]
  24. Zhao, J.; Zhao, Z.; Zhang, H. The impact of growth, energy and financial development on environmental pollution in China: New evidence from a spatial econometric analysis. Energy Econ. 2019, 104506. [Google Scholar] [CrossRef]
  25. Ali, G. Science of the Total Environment Climate change and associated spatial heterogeneity of Pakistan: Empirical evidence using multidisciplinary approach. Sci. Total Environ. 2018, 634, 95–108. [Google Scholar] [CrossRef]
  26. Pata, U.K. Renewable energy consumption, urbanization, financial development, income and CO2 emissions in Turkey: Testing EKC hypothesis with structural breaks. J. Clean. Prod. 2018, 187, 770–779. [Google Scholar] [CrossRef]
  27. Ardakani, M.K.; SeyedAliAkbar, S.M. Impact of energy consumption and economic growth on CO2 emission using multivariate regression. Energy Strat. Rev. 2019, 26, 100428. [Google Scholar] [CrossRef]
  28. Churchill, S.A.; Inekwe, J.; Smyth, R.; Zhang, X. R&D intensity and carbon emissions in the G7: 1870–2014. Energy Econ. 2019, 80, 30–37. [Google Scholar] [CrossRef]
  29. Cheng, C.; Ren, X.; Wang, Z.; Yan, C. Environment Heterogeneous impacts of renewable energy and environmental patents on CO2 emission—Evidence from the BRIICS. Sci. Total Environ. 2019, 668, 1328–1338. [Google Scholar] [CrossRef] [PubMed]
  30. Du, K.; Li, P.; Yan, Z. Technological Forecasting & Social Change Do green technology innovations contribute to carbon dioxide emission reduction ? Empirical evidence from patent data. Technol. Forecast. Soc. Chang. 2019, 146, 297–303. [Google Scholar]
  31. Moye Uddin, M.M. Environmental and Sustainability Indicators What are the dynamic links between agriculture and manufacturing growth and environmental degradation? Evidence from different panel income countries. Environ. Sustain. Indic. 2020, 7, 100041. [Google Scholar] [CrossRef]
  32. Munir, Q.; Lean, H.H.; Smyth, R. CO2 emissions, energy consumption and economic growth in the ASEAN-5 countries: A cross-sectional dependence approach. Energy Econ. 2020, 85, 104571. [Google Scholar] [CrossRef]
  33. Shabani, Z.D.; Shahnazi, R. Energy consumption, carbon dioxide emissions, information and communications technology, and gross domestic product in Iranian economic sectors: A panel causality analysis. Energy 2019, 169, 1064–1078. [Google Scholar] [CrossRef]
  34. Zafar, M.W.; Zaidi, S.A.H.; Sinha, A.; Gedikli, A.; Hou, F. The role of stock market and banking sector development, and renewable energy consumption in carbon emissions: Insights from G-7 and N-11 countries. Resour. Policy 2019, 62, 427–436. [Google Scholar] [CrossRef]
  35. Syri, S.; Kurki-Suonio, T.; Satka, V.; Cross, S. Nuclear power at the crossroads of liberalized electricity markets and CO2 mitigation—Case Finland. Energy Strategy Rev. 2013, 1, 247–254. [Google Scholar] [CrossRef]
  36. Corsatea, T.D.; Giaccaria, S.; Corsatea, T.D. Market regulation and environmental productivity changes in the electricity and gas sector of 13 observed EU countries. Energy 2018, 164, 1286–1297. [Google Scholar] [CrossRef]
  37. Olale, E.; Ochuodho, T.O.; Lantz, V.; El Armali, J. The environmental Kuznets curve model for greenhouse gas emissions in Canada. J. Clean. Prod. 2018, 184, 859–868. [Google Scholar] [CrossRef]
  38. Alam, M.; Murad, W.; Noman, A.H.M.; Ozturk, I. Relationships among carbon emissions, economic growth, energy consumption and population growth: Testing Environmental Kuznets Curve hypothesis for Brazil, China, India and Indonesia. Ecol. Indic. 2016, 70, 466–479. [Google Scholar] [CrossRef]
  39. Ahmad, N.; Du, L.; Lu, J.; Wang, J.; Li, H.-Z.; Hashmi, M.Z. Modelling the CO2 emissions and economic growth in Croatia: Is there any environmental Kuznets curve? Energy 2017, 123, 164–172. [Google Scholar] [CrossRef]
  40. Acaravci, A.; Ozturk, I. On the relationship between energy consumption, CO2 emissions and economic growth in Europe. Energy 2010, 35, 5412–5420. [Google Scholar] [CrossRef]
  41. Bouznit, M.; Pablo-Romero, M.P. CO2 emission and economic growth in Algeria. Energy Policy 2016, 96, 93–104. [Google Scholar] [CrossRef]
  42. Yao, S.; Zhang, S.; Zhang, X. Renewable energy, carbon emission and economic growth: A revised environmental Kuznets Curve perspective. J. Clean. Prod. 2019, 235, 1338–1352. [Google Scholar] [CrossRef]
  43. Fujii, H.; Iwata, K.; Managi, S.; Kagawa, S.; Managi, S. An analysis of urban environmental Kuznets curve of CO2 emissions: Empirical analysis of 276 global metropolitan areas. Appl. Energy 2018, 228, 1561–1568. [Google Scholar] [CrossRef] [Green Version]
  44. Muhammad, B. Energy consumption, CO2 emissions and economic growth in developed, emerging and Middle East and North Africa countries. Energy 2019, 179, 232–245. [Google Scholar] [CrossRef]
  45. Adu, D.T.; Denkyirah, E.K. Economic growth and environmental pollution in West Africa: Testing the Environmental Kuznets Curve hypothesis. Kasetsart J. Soc. Sci. 2018, 8–15. [Google Scholar] [CrossRef]
  46. Pao, H.-T.; Yu, H.-C.; Yang, Y.-H. Modeling the CO2 emissions, energy use, and economic growth in Russia. Energy 2011, 36, 5094–5100. [Google Scholar] [CrossRef]
  47. Lazăr, D.; Minea, A.; Purcel, A.-A. Pollution and economic growth: Evidence from Central and Eastern European countries. Energy Econ. 2019, 81, 1121–1131. [Google Scholar] [CrossRef]
  48. Wang, S.; Li, G.; Fang, C. Urbanization, economic growth, energy consumption, and CO2 emissions: Empirical evidence from countries with different income levels. Renew. Sustain. Energy Rev. 2018, 81, 2144–2159. [Google Scholar] [CrossRef]
  49. Rafindadi, A.A. Does the need for economic growth influence energy consumption and CO2 emissions in Nigeria? Evidence from the innovation accounting test. Renew. Sustain. Energy Rev. 2016, 62, 1209–1225. [Google Scholar] [CrossRef]
  50. Hdom, H.A. Examining carbon dioxide emissions, fossil & renewable electricity generation and economic growth: Evidence from a panel of South American countries. Renew. Energy 2019, 139, 186–197. [Google Scholar] [CrossRef]
  51. Wang, Z.; Danish; Zhang, B.; Wang, B. The moderating role of corruption between economic growth and CO2 emissions: Evidence from BRICS economies. Energy 2018, 148, 506–513. [Google Scholar] [CrossRef]
  52. Yang, H.-Y. Carbon emissions control and trade liberalization: Coordinated approaches to Taiwan’s trade and tax policy. Energy Policy 2001, 29, 725–734. [Google Scholar] [CrossRef]
  53. Shih, H.-C. Evaluating the prospective effects of alternative regulatory policies on the investment behaviour and environmental performance of a newly liberalised electricity industry in Taiwan. Socio-Econ. Plan. Sci. 2007, 41, 320–335. [Google Scholar] [CrossRef]
  54. Lise, W.; Kruseman, G. Long-term price and environmental effects in a liberalised electricity market. Energy Econ. 2008, 30, 230–248. [Google Scholar] [CrossRef]
  55. Chapman, A.; Itaoka, K. Curiosity, economic and environmental reasoning: Public perceptions of liberalization and renewable energy transition in Japan. Energy Res. Soc. Sci. 2018, 37, 102–110. [Google Scholar] [CrossRef]
  56. Fuchs, D.A.; Arentsen, M.J. Green electricity in the market place: The policy challenge. Energy Policy 2002, 30, 525–538. [Google Scholar] [CrossRef]
  57. Barros, J.J.C.; Coira, M.L.; López, M.P.D.L.C.; Gochi, A.D.C. Probabilistic life-cycle cost analysis for renewable and non-renewable power plants. Energy 2016, 112, 774–787. [Google Scholar] [CrossRef]
  58. Shen, W.; Chen, X.; Qiu, J.; Hayward, J.A.; Sayeef, S.; Osman, P.; Meng, K.; Dong, Z.Y. A comprehensive review of variable renewable energy levelized cost of electricity. Renew. Sustain. Energy Rev. 2020, 133, 110301. [Google Scholar] [CrossRef]
  59. Daví-Arderius, D.; Sanin, M.-E.; Trujillo-Baute, E. CO2 content of electricity losses. Energy Policy 2017, 104, 439–445. [Google Scholar] [CrossRef] [Green Version]
  60. Chappin, E.J.L.; Dijkema, G. On the impact of CO2 emission-trading on power generation emissions. Technol. Forecast. Soc. Chang. 2009, 76, 358–370. [Google Scholar] [CrossRef] [Green Version]
  61. Kraan, O.; Kramer, G.J.; Nikolic, I.; Chappin, E.; Koning, V. Why fully liberalised electricity markets will fail to meet deep decarbonisation targets even with strong carbon pricing. Energy Policy 2019, 131, 99–110. [Google Scholar] [CrossRef]
  62. Peña-Torres, J.; Pearson, P.J. Carbon abatement and new investment in liberalised electricity markets: A nuclear revival in the UK? Energy Policy 2000, 28, 115–135. [Google Scholar] [CrossRef]
  63. World Bank. CO2 Emissions (Metric Tons per Capita), 2018. Available online: https://datos.bancomundial.org/indicador/EN.ATM.CO2E.PC (accessed on 5 May 2020).
  64. Eurostat. Eurostat Database. Population and Social Conditions. Available online: https://ec.europa.eu/eurostat/data/database (accessed on 1 September 2020).
  65. Cai, Y.; Sam, C.Y.; Chang, T. Nexus between clean energy consumption, economic growth and CO2 emissions. J. Clean. Prod. 2018, 182, 1001–1011. [Google Scholar] [CrossRef]
  66. Kuznets, S. Economic Growth and Income Inequality. Am. Econ. Rev. 1955, 45, 1–28. [Google Scholar]
  67. Galiani, S.; Gertler, P.; Schargrodsky, E. Water for Life: The Impact of the Privatization of Water Services on Child Mortality. J. Politi-Econ. 2005, 113, 83–120. [Google Scholar] [CrossRef] [Green Version]
  68. Albalate, D.; Gragera, A.; Daniel, A.; Albert, G. The impact of curbside parking regulations on car ownership. Reg. Sci. Urban Econ. 2020, 81, 103518. [Google Scholar] [CrossRef] [Green Version]
  69. Hausman, J.A. Specification Tests in Econometrics. Economeyrics 1978, 46, 1251. [Google Scholar] [CrossRef] [Green Version]
  70. Wooldridge, J.M. Econometric Analysis of Cross Section and Panel Data; MIT Press: Cambridge, MA, USA, 2002. [Google Scholar]
  71. Jenner, S.; Groba, F.; Indvik, J. Assessing the strength and effectiveness of renewable electricity feed-in tariffs in European Union countries. Energy Policy 2013, 52, 385–401. [Google Scholar] [CrossRef] [Green Version]
  72. Campoccia, A.; Dusonchet, L.; Telaretti, E.; Zizzo, G. An analysis of feed’in tariffs for solar PV in six representative countries of the European Union. Sol. Energy 2014, 107, 530–542. [Google Scholar] [CrossRef]
  73. Ringel, M. Fostering the use of renewable energies in the European Union: The race between feed-in tariffs and green certificates. Renew. Energy 2006, 31, 1–17. [Google Scholar] [CrossRef]
  74. Mac Domhnaill, C.; Ryan, L. Towards renewable electricity in Europe: Revisiting the determinants of renewable electricity in the European Union. Renew. Energy 2020, 154, 955–965. [Google Scholar] [CrossRef]
  75. Nathaniel, S.; Khan, S.A.R. The nexus between urbanization, renewable energy, trade, and ecological footprint in ASEAN countries. J. Clean. Prod. 2020, 272, 122709. [Google Scholar] [CrossRef]
  76. Khan, S.A.R.; Yu, Z.; Belhadi, A.; Mardani, A. Investigating the effects of renewable energy on international trade and environmental quality. J. Environ. Manag. 2020, 272, 111089. [Google Scholar] [CrossRef]
  77. Sánchez, P.R.; Da Silveira, P.B. Liberalización y Competencia en el marco energético de la Unión Europea: Campeones Europeos de la Energía? Rev. Jurídica Presidência 2016, 18, 47. [Google Scholar] [CrossRef]
Figure 1. Evolution of gross domestic product (GDP) and CO2 emissions. Source: own elaboration based on data from World Bank (WB) [63] and European Statistical Office (EUROSTAT) [64].
Energies 13 06116 g001
Figure 2. Effects of the policy about pollution by year at the EU level and according to the income level of the countries. Source: own elaboration based on data from WB [63] and EUROSTAT [64].
Energies 13 06116 g002aEnergies 13 06116 g002b
Table 1. Definition of variables.
VariableDescriptionUnit of Measure
Log (CO2 emissions)Carbon dioxide from the energy sectorThousands of tons
Log (GDP)Sum of all final goods and services produced by a countryUS$ at constant 2010 prices
Log (trade openness)A country’s ability to trade goods and services with the rest of the world. [(X-M)/GDP]US$ at constant 2010 prices
Renewable energyShare of renewable energy in total final energy consumption% of total final energy consumption
Non-renewable energyProportion of energy that comes from coal, oil, petroleum and natural gas products% of total final energy consumption
Log (industry)Added-value of a country’s productionUS$ at constant 2010 prices
Urbanization ratePercentage ratio between the urban population inhabitants of cities and the total population of a country% of the total population
Population growthAnnual population growth rate for year t% Annual
PolicyRepresents the political variable. It takes the value of 1 for the years in which the policy is in force and 0 otherwiseDichotomy 0 and 1
Source: own elaboration based on data from WB [63] and EUROSTAT [64].
Table 2. Descriptive statistics.
VariableGroupMeanMedianMinimumMaximumS.D.
Log (CO2 emissions)UE10.9810.838.6513.621.29
HIC10.9910.838.6513.621.34
UMIC10.9610.9310.5611.390.29
Log (GDP)UE26.1626.1923.6228.981.48
HIC26.2426.2323.6228.981.51
UMIC25.2625.2224.4026.090.64
Log (trade openness)UE0.020.004−0.830.440.44
HIC0.030.02−0.741.370.45
UMIC−0.10−0.004−0.830.300.319
Renewable energyUE16.7417.231.1355.1811.24
HIC17.2013.861.1355.1812.04
UMIC17.6818.168.8725.205.10
Non-renewable energyUE72.2975.7511.5697.5018.11
HIC72.0876.0611.5697.5018.76
UMIC74.9273.3269.2685.054.673
Log (industry)UE24.6924.8124.8127.691.51
HIC24.7124.8121.5727.691.52
UMIC24.4424.3522.9925.911.24
Urbanization rateUE71.5969.7651.3097.9612.02
HIC72.2769.7651.3097.9611.94
UMIC63.0762.1053.0474.669.61
Population growthUE0.210.23−2.252.890.80
HIC0.280.28−2.252.890.78
UMIC−0.68−0.62−1.66−0.370.27
PolicyUE0.50.5010.50
HIC0.50.5010.50
UMIC0.50.5010.50
Source: own elaboration based on data from WB [63] and EUROSTAT [64].
Table 3. Environmental Kuznets relationship.
EUHICUMIC
Log (GDP)−0.843−0.69812.76
(−0.95)(−0.93)(1.50)
Log (GDP)20.03040.0288 *−0.245
(1.81)(2.03)(−1.45)
Constant12.209.415−155.0
(1.05)(0.95)(−1.44)
Observations37835028
t-statistics in parentheses; * p < 0.05
Table 4. Effect of policy and GDP on CO2 emissions.
EUHICUMIC
Log (GDP)0.819 ***0.847 ***0.422 ***
(48.97)(65.64)(12.05)
Policy−0.0620 ***−0.0742 ***−0.127 **
(−5.54)(−6.18)(−3.26)
Constant−10.43 ***−11.22 ***0.363
(−23.47)(−32.78)(0.41)
Observations37835028
t-statistics in parentheses; ** p < 0.01, *** p < 0.001.
Table 5. Relationship between CO2 emissions and GDP, with control variables at the European Union (EU) level.
M1M2M3M4M5M6M7M8
Log (GDP)0.711 ***0.819 ***0.797 ***0.720 ***0.714 ***0.713 ***0.757 ***0.764 ***
(19.95)(48.97)(49.24)(51.62)(56.87)(57.76)(46.08)(49.97)
Policy −0.0620 ***−0.0515 ***−0.0261 **−0.0231 *−0.0219 *−0.0254 **−0.0274 *
(−5.54)(−4.38)(−2.60)(−2.12)(−2.10)(−2.74)(−2.56)
Log (trade openness) −0.235 ***−0.301 ***−0.324 ***−0.326 ***−0.248 ***−0.279 ***
(−5.64)(−8.27)(−9.20)(−9.41)(−6.68)(−7.52)
Renewable energy −0.0235 ***−0.0185 ***−0.0173 ***−0.0156 ***−0.0194 ***
(−16.37)(−10.52)(−9.67)(−8.57)(−10.59)
Non-renewable energy 0.00605 ***0.00698 ***0.00794 ***0.00437 **
(4.78)(5.47)(6.29)(3.27)
Log (industry) 0.0351 **0.0411 **0.0277*
(3.28)(3.29)(2.42)
Urbanization rate −0.00679 ***−0.00696 ***
(−3.90)(−4.73)
Population growth −0.0484 ***
(−4.10)
Constant−7.601 ***−10.43 ***−9.886 ***−7.491 ***−7.884 ***−8.805 ***−9.708 ***−9.216 ***
(−8.06)(−23.47)(−23.03)(−19.85)(−21.98)(−20.46)(−19.81)(−19.12)
Observations378378378378378378378378
t-statistics in parentheses; * p < 0.05, ** p < 0.01, *** p < 0.001. M1, M2, …, M8 represent the models proposed according to the inclusion of each of the control variables.
Table 6. Relationship between CO2 emissions and GDP, with control variables in the high-income countries (HIC).
M1M2M3M4M5M6M7M8
Log (GDP)0.803 ***0.847 ***0.822 ***0.735 ***0.724 ***0.736 ***0.779 ***0.781 ***
(31.20)(65.64)(57.54)(56.19)(68.71)(60.05)(48.88)(51.72)
Policy −0.0742 ***−0.0594 ***−0.0313 **−0.0254 *−0.0271 *−0.0291 **−0.0330 **
(−6.18)(−4.98)(−3.09)(−2.17)(−2.45)(−3.00)(−3.22)
Log (trade openness) −0.221 ***−0.308 ***−0.363 ***−0.329 ***−0.250 ***−0.261 ***
(−5.43)(−8.58)(−11.33)(−9.36)(−6.41)(−6.83)
Renewable energy −0.0223 ***−0.0200 ***−0.0173 ***−0.0153 ***−0.0174 ***
(−15.89)(−12.54)(−9.78)(−8.29)(−9.55)
Non-renewable energy 0.00333 **0.00576 ***0.00705 ***0.00498 ***
(2.71)(4.47)(5.48)(3.78)
Log (industry) 0.0334 **0.0425 ***0.0312 **
(3.09)(3.50)(2.70)
Urbanization rate −0.00687 ***−0.00648 ***
(−4.00)(−4.16)
Population growth −0.0356 ***
(−3.37)
Constant−10.07 ***−11.22 ***−10.57 ***−7.948 ***−7.934 ***−9.282 ***−10.27 ***−9.890 ***
(−14.78)(−32.78)(−27.98)(−22.35)(−26.11)(−20.95)(−21.99)(−21.31)
Observations350350350350350350350350
t-statistics in parentheses; * p < 0.05, ** p < 0.01, *** p < 0.001. M1, M2, …, M8 represent the models proposed according to the inclusion of each of the control variables.
Table 7. Relationship between CO2 emissions and GDP, with control variables in the upper-middle-income countries (UMIC).
M1M2M3M4M5M6M7M8
Log (GDP)0.390 ***0.422 ***0.278 ***0.492 ***0.380 ***0.503 **0.528 **−0.0709
(5.22)(12.05)(7.74)(8.89)(10.61)(2.98)(3.06)(−0.58)
Policy −0.127 **−0.03120.06360.005130.01510.01860.0269
(−3.26)(−0.81)(1.75)(0.21)(0.59)(0.72)(1.43)
Log (trade openness) −0.404 ***−0.290 ***−0.0486−0.0782−0.0461−0.213 **
(−5.08)(−4.03)(−0.82)(−1.15)(−0.52)(−2.83)
Renewable energy −0.0279 ***−0.00689−0.00894−0.00681−0.00799
(−4.68)(−1.47)(−1.76)(−1.09)(−1.65)
Non-renewable energy 0.0226 ***0.0215 ***0.0223 ***0.0158 ***
(6.59)(5.96)(5.77)(4.92)
Log (industry) −0.0609−0.1290.332 **
(−0.73)(−0.94)(3.11)
Urbanization rate −0.006940.0154
(−0.62)(1.65)
Population growth −0.129 ***
(−5.77)
Constant1.1130.3633.909 ***−1.040−0.227−1.733−0.3622.486
(0.59)(0.41)(4.39)(−0.79)(−0.29)(−0.80)(−0.12)(1.02)
Observations2828282828282828
t-statistics in parentheses; ** p < 0.01, *** p < 0.001. M1, M2, …, M8 represent the models proposed according to the inclusion of each of the control variables.
Table 8. Policy effects on CO2 emissions over time.
UEHICUMIC
Policy 2011−0.0513 ***−0.0586 ***0.0493
(−5.57)(−5.85)(1.51)
Policy 2012−0.0795 ***−0.0874 ***−0.0458
(−6.20)(−6.32)(−1.15)
Policy 2013−0.121 ***−0.128 ***−0.191 ***
(−7.80)(−7.77)(−4.42)
Policy 2014−0.186 ***−0.197 ***−0.174 ***
(−10.52)(−10.59)(−3.88)
Policy 2015−0.188 ***−0.201 ***−0.157 ***
(−9.64)(−9.87)(−3.41)
Policy 2016−0.201 ***−0.214 ***−0.233 ***
(−9.54)(−9.83)(−4.99)
Policy 2017−0.218 ***−0.235 ***−0.228 ***
(−9.71)(−10.22)(−4.83)
Observations37835028
t-statistics in parentheses; *** p < 0.001.
Publisher’s Note: MDPI stays neutral with regard to jurisdictional claims in published maps and institutional affiliations.

