A Pitch Angle Controller Based on Novel Fuzzy-PI Control for Wind Turbine Load Reduction


Abstract
1. Introduction
2. Wind Turbine Model
2.1. Aerodynamic Model
2.2. Drive Train Model
2.3. Generator Model
2.4. Pitch Actuator Model
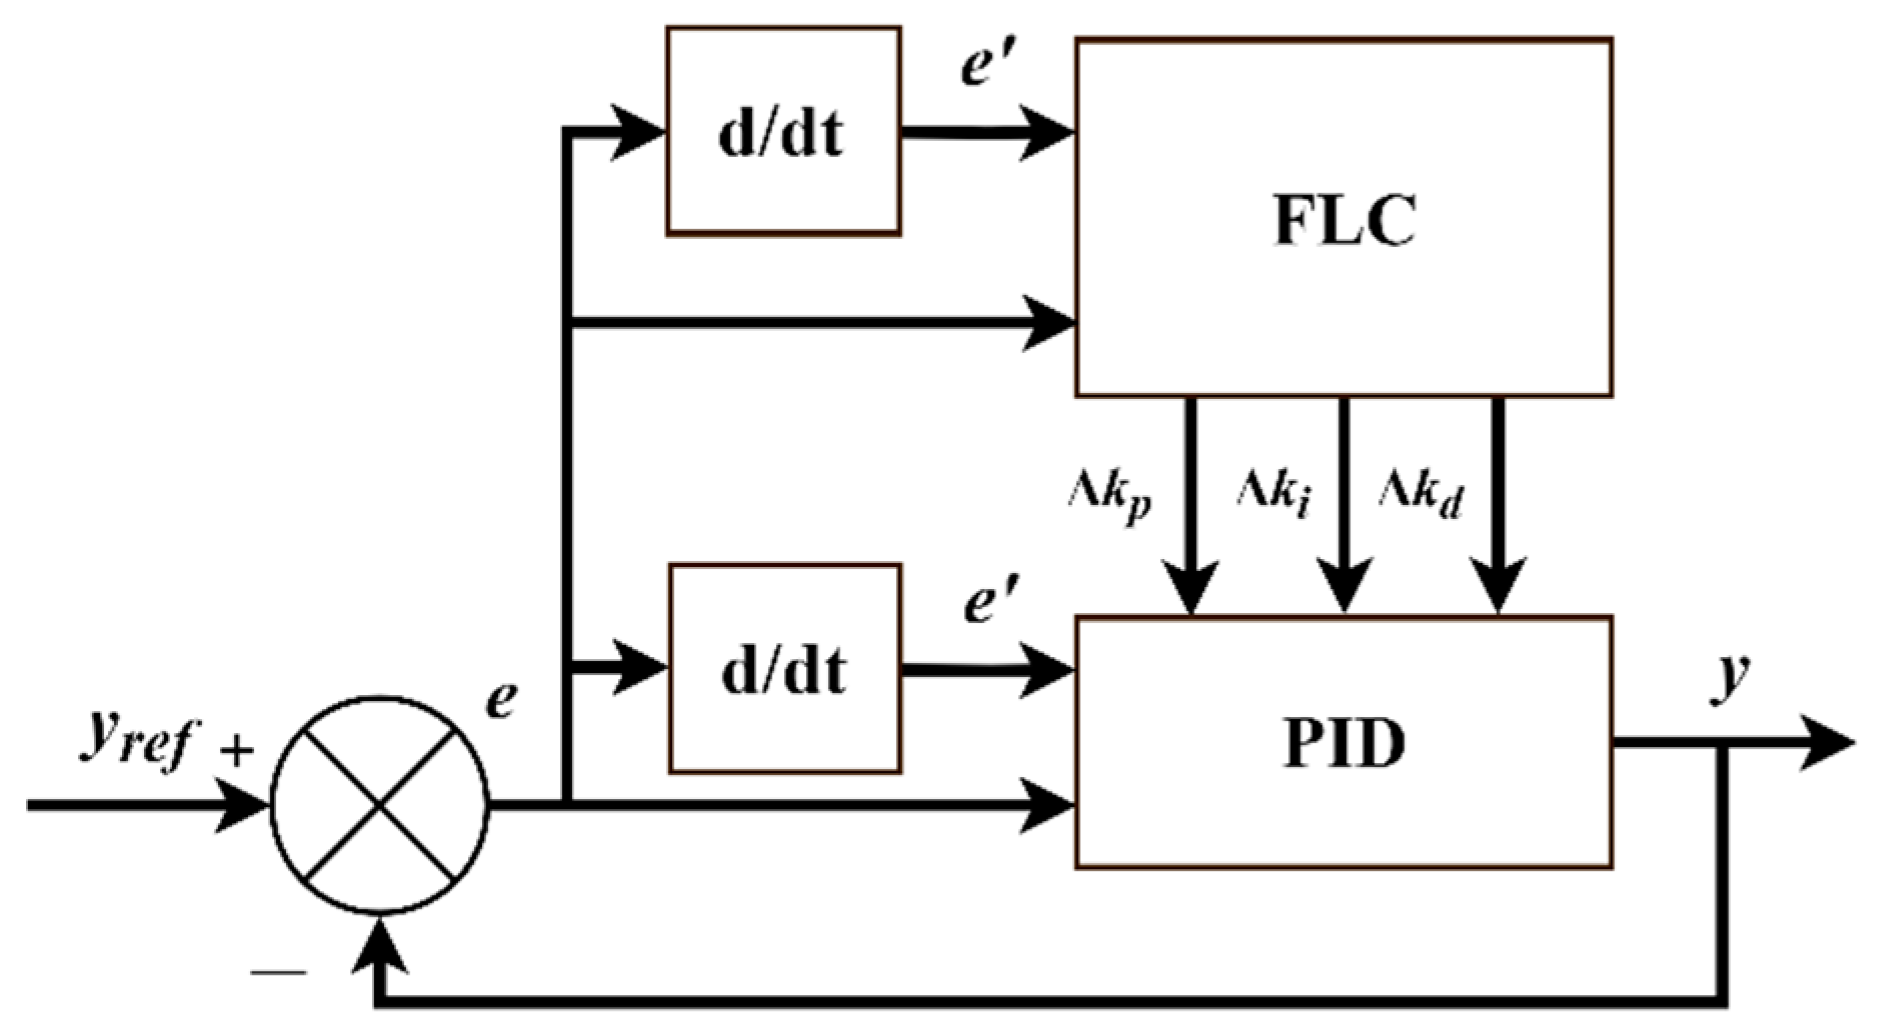
3. Fuzzy-PID Control Algorithm
3.1. Fuzzy Logic Control Algorithm
3.2. Fuzzy-PID Control Algorithm
4. Design of Simulation Platform and Fuzzy Rules
4.1. Design of GH Bladed and MATLAB/Simulink Interactive Software
4.2. Improvement of Fuzzy Rules
5. Simulation and Loads Analysis
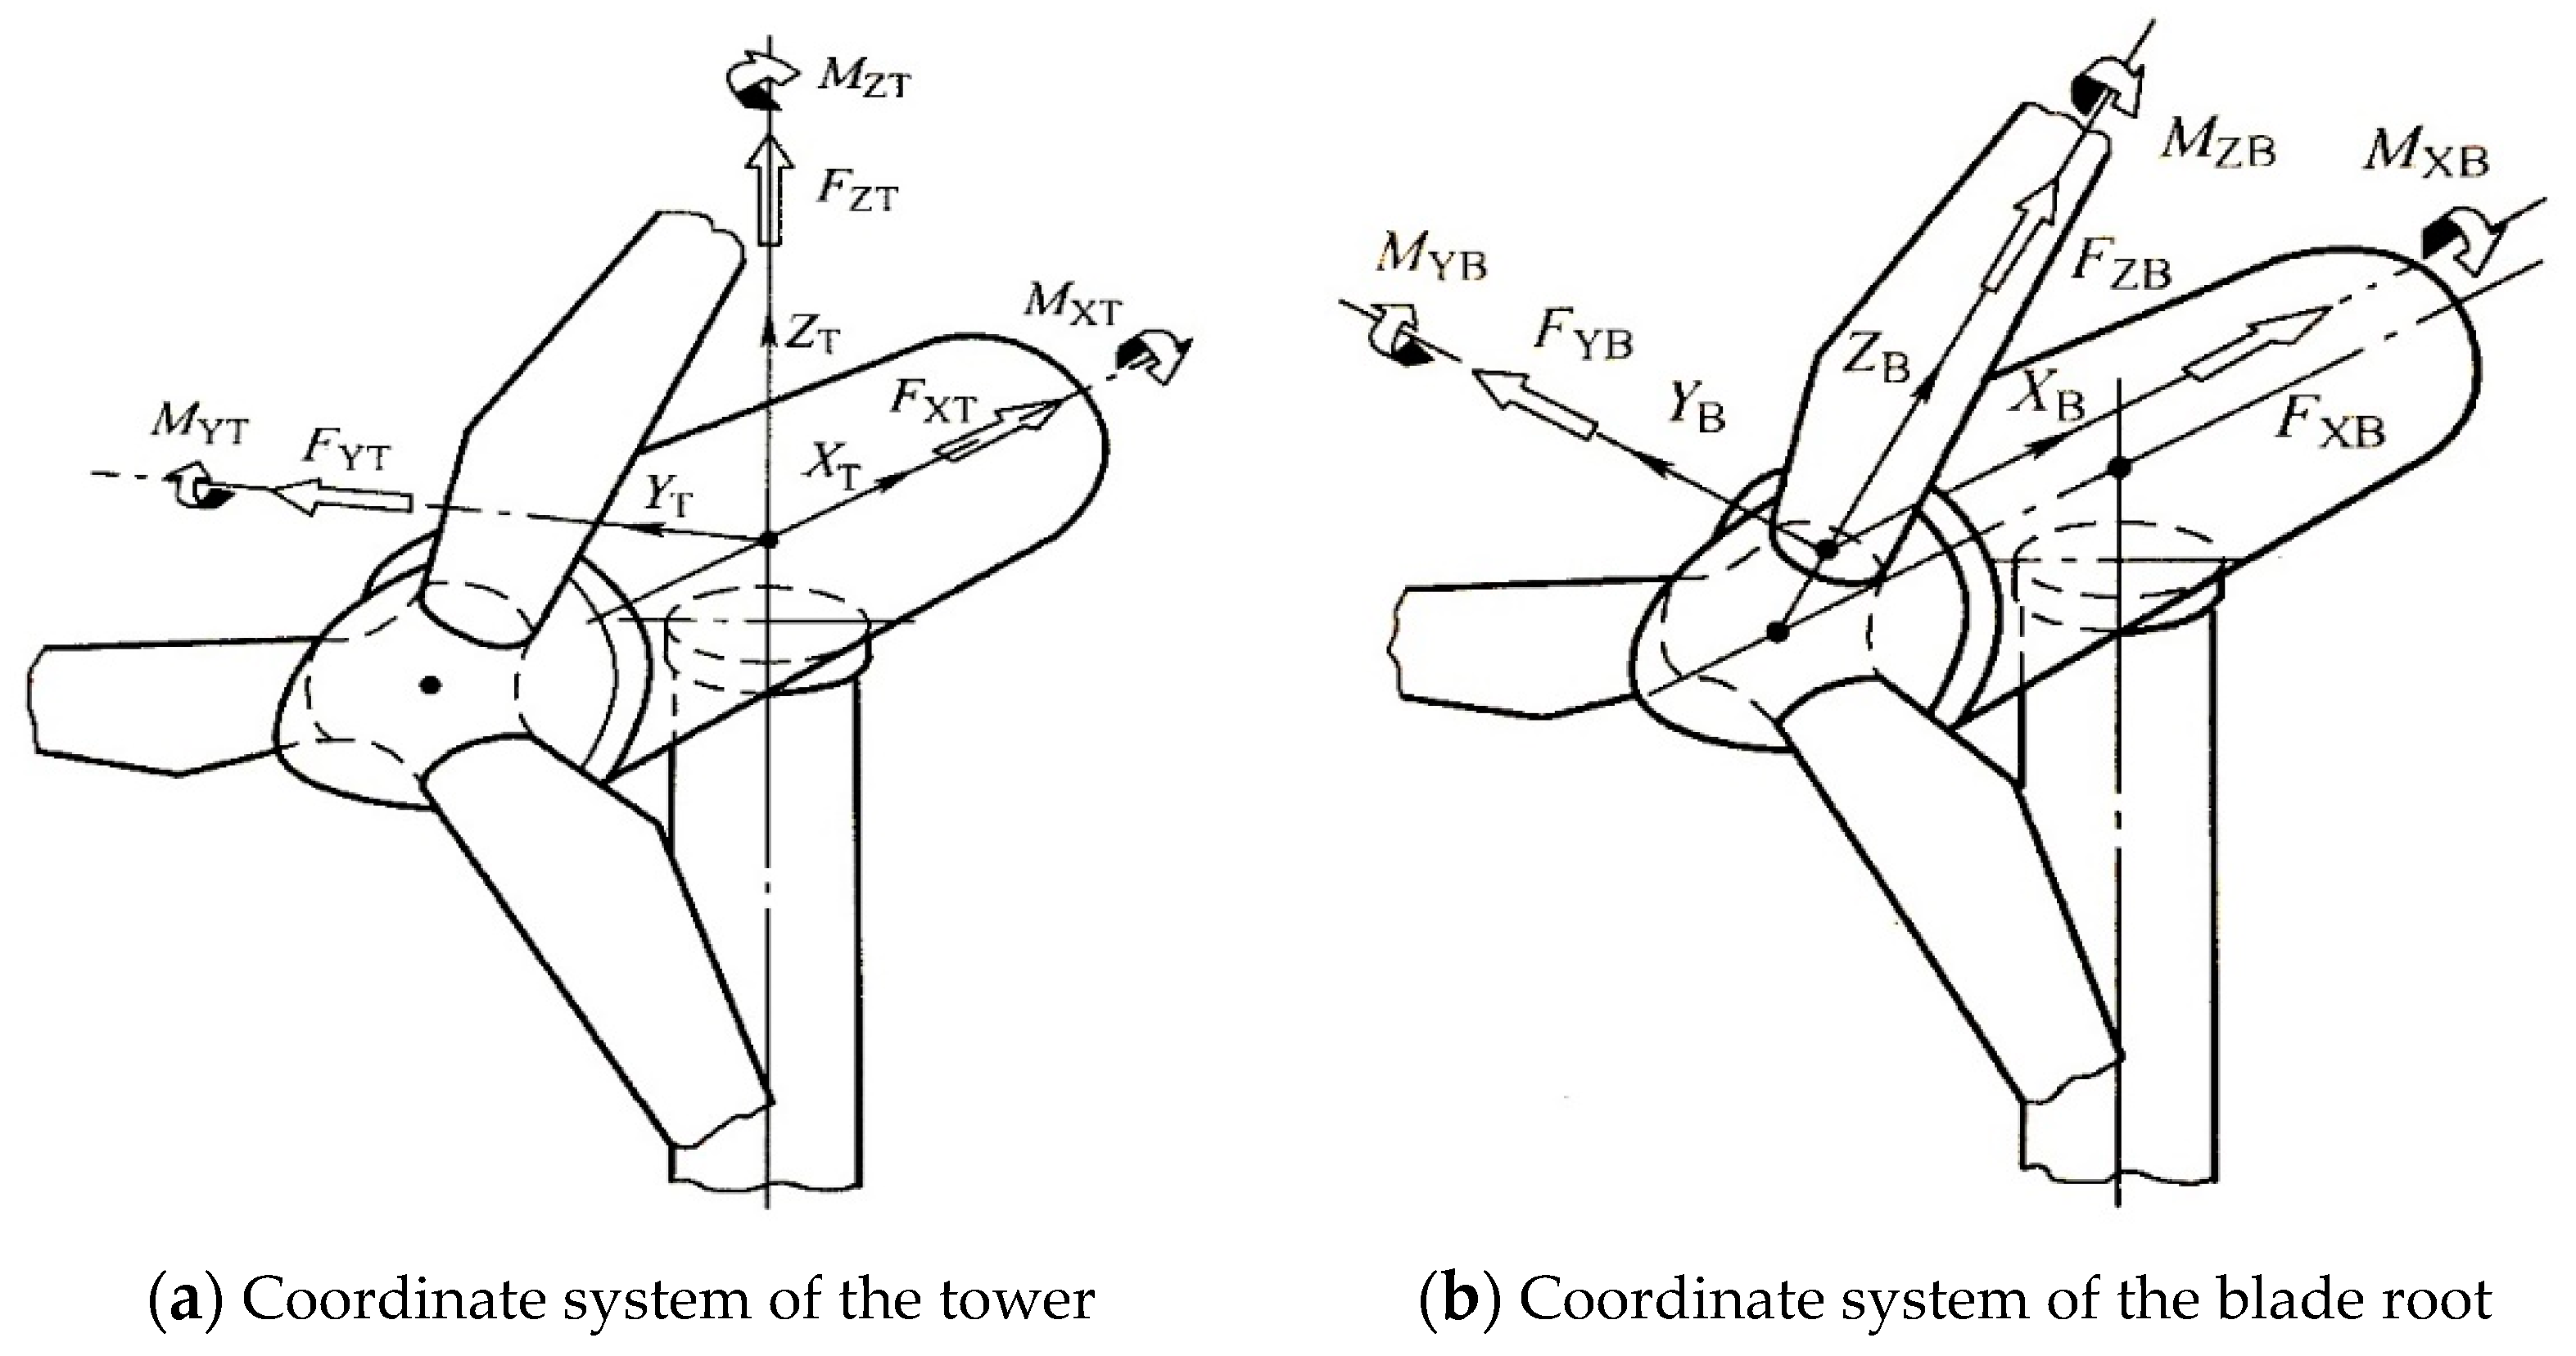
5.1. Information of Wind Turbine, Wind Model, and Loads
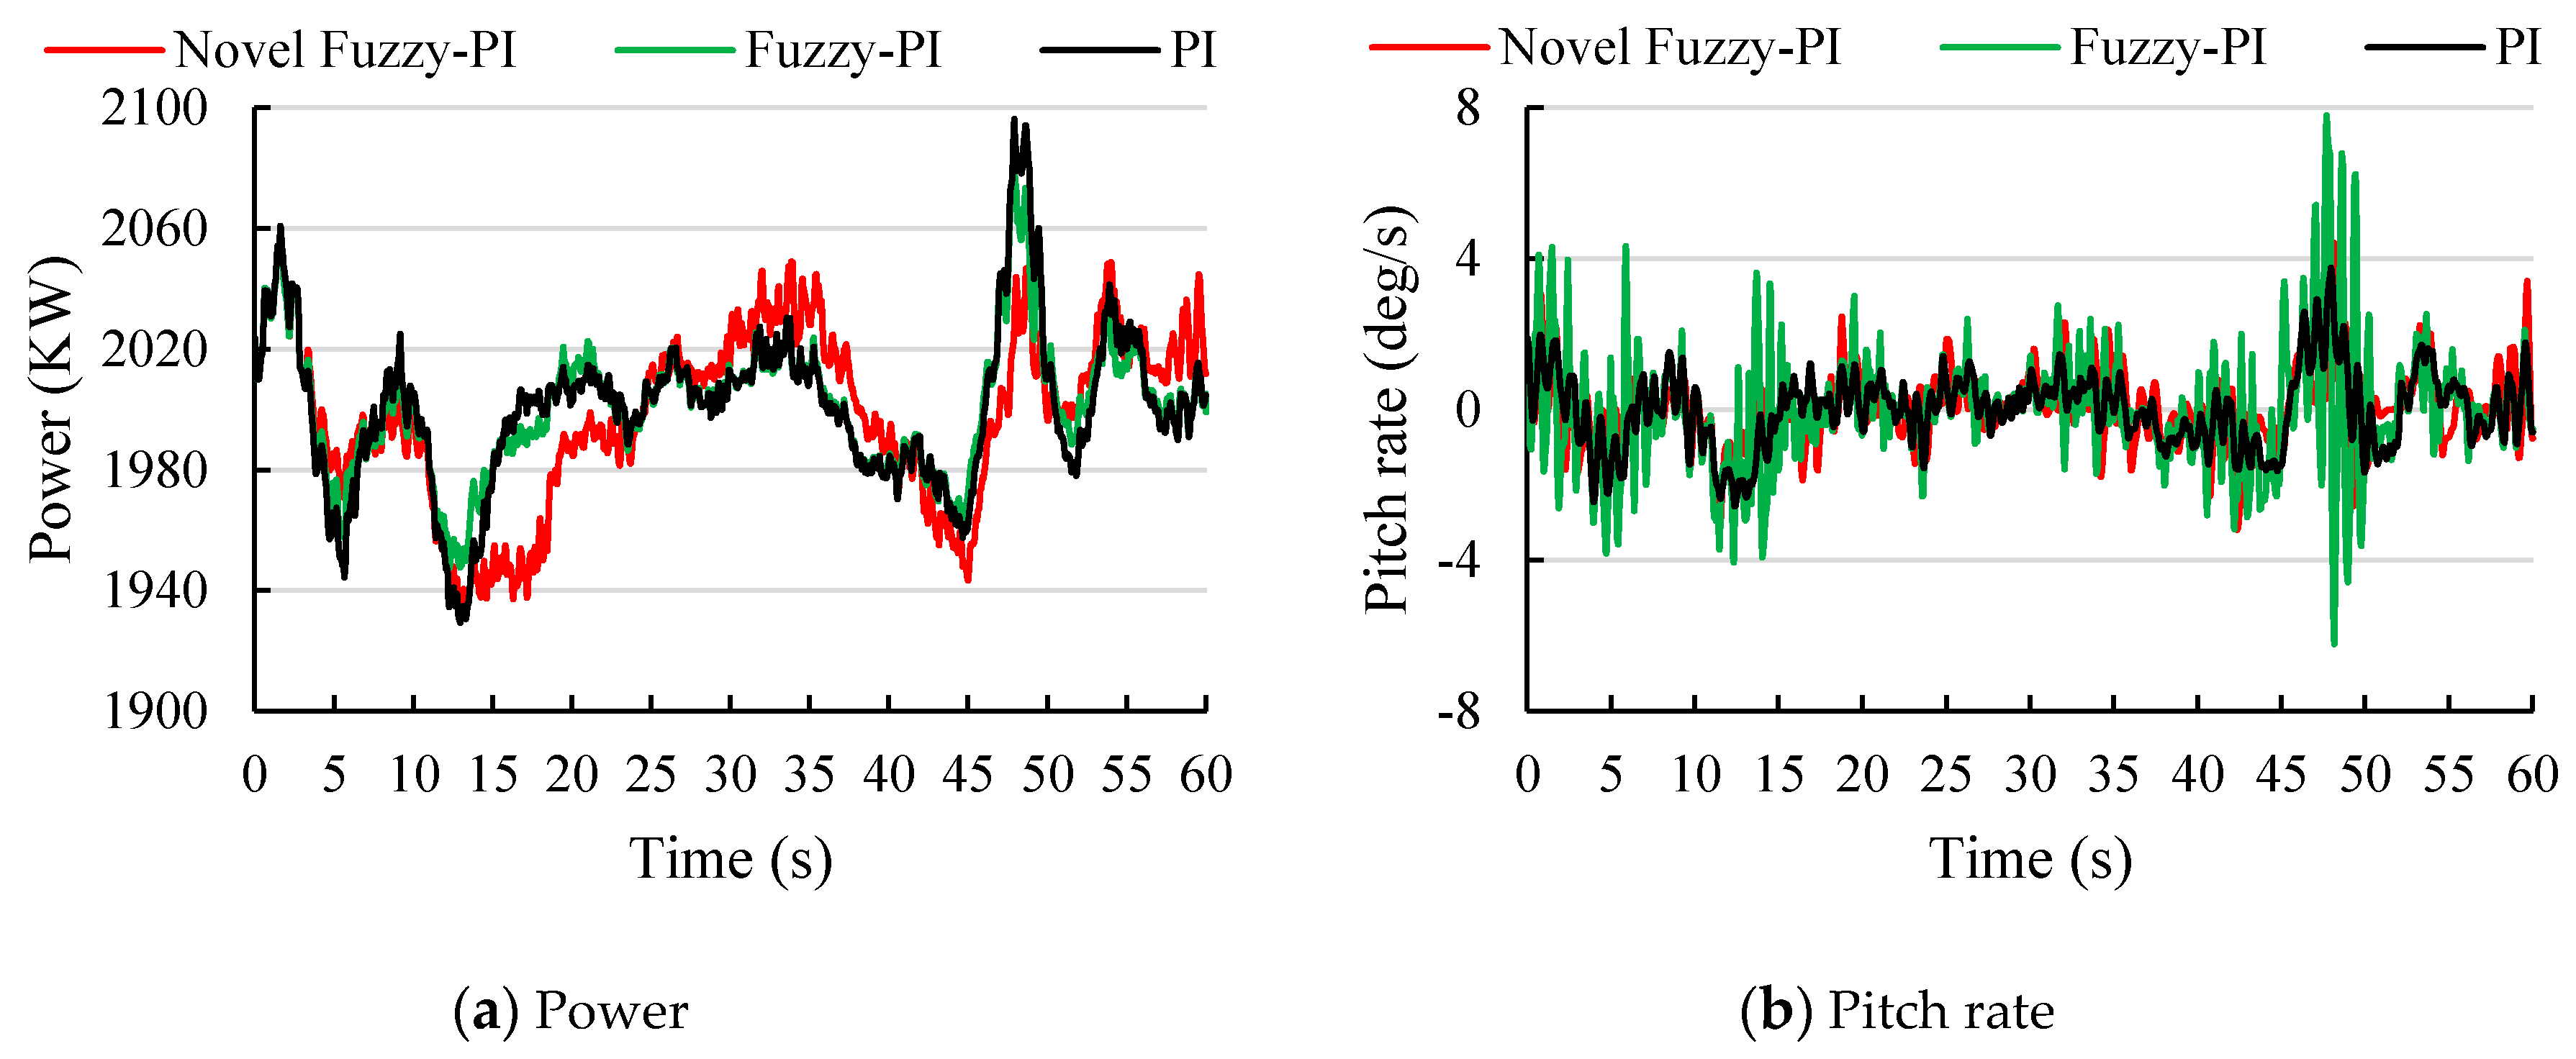
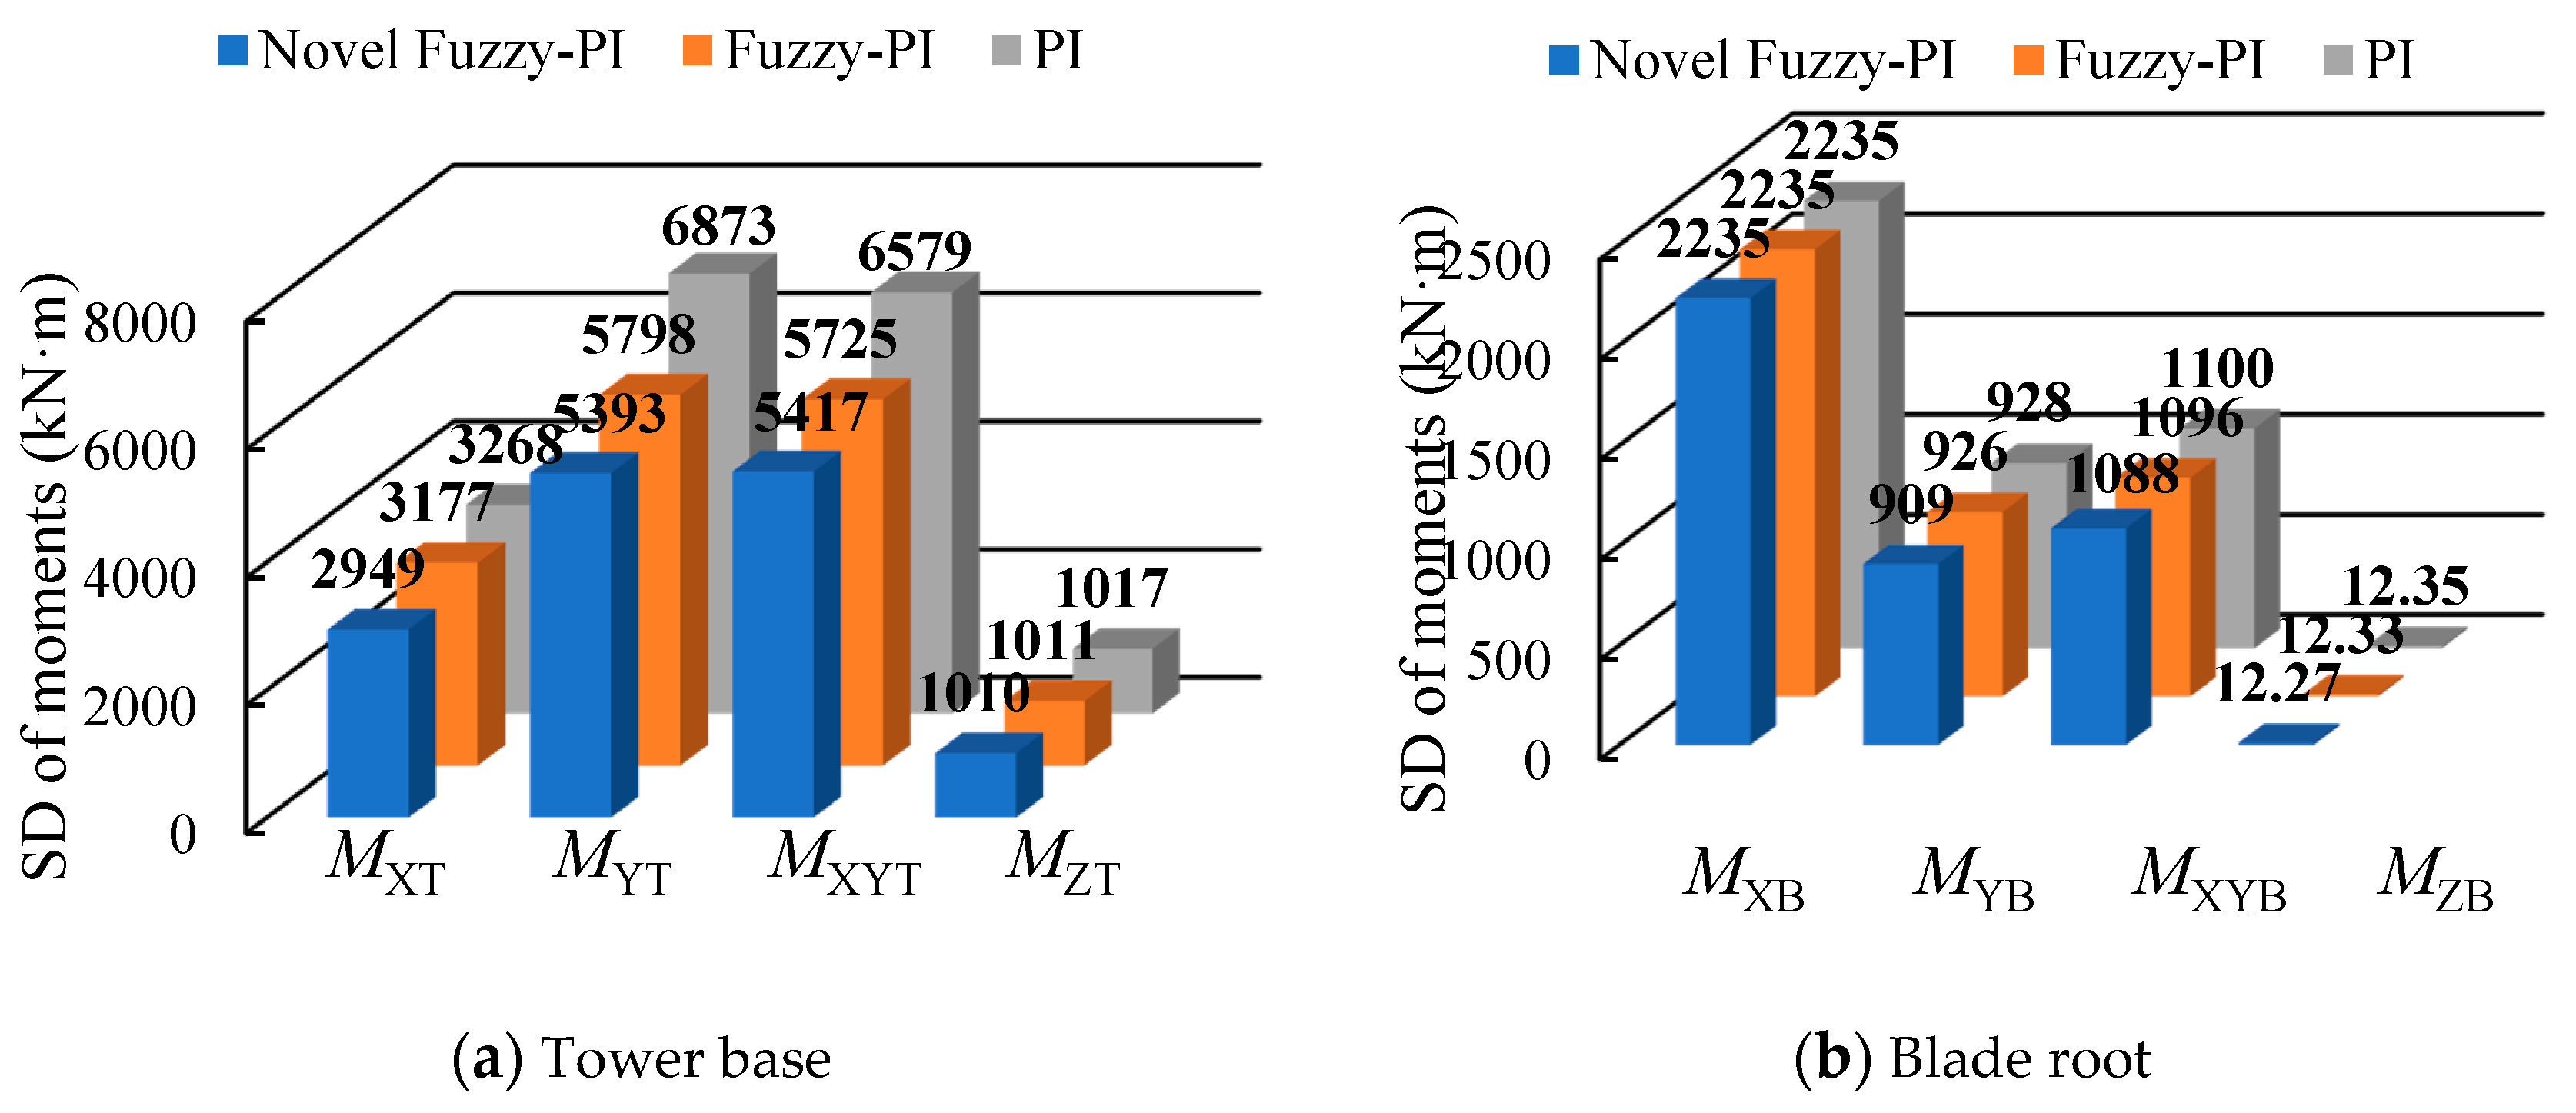
5.2. Analysis of Simulation Results under Normal Turbulent Wind Conditions
5.3. Analysis of Simulation Results under Extreme Turbulent Wind Conditions
5.4. Discussion
6. Conclusions
Author Contributions
Funding
Conflicts of Interest
References
- Rezaeiha, A.; Pereira, R.; Kotsonis, M. Fluctuations of angle of attack and lift coefficient and the resultant fatigue loads for a large Horizontal Axis Wind turbine. Renew. Energy 2017, 114, 904–916. [Google Scholar] [CrossRef]
- Lin, Y.; Tu, L.; Liu, H.; Li, W. Fault analysis of wind turbines in China. Renew. Sustain. Energy Rev. 2016, 55, 482–490. [Google Scholar] [CrossRef]
- Akbarimajd, A.; Olyaee, M.; Sobhani, B.; Shayeghi, H. Nonlinear Multi-Agent Optimal Load Frequency Control Based on Feedback Linearization of Wind Turbines. IEEE Trans. Sustain. Energy 2018, 10, 66–74. [Google Scholar] [CrossRef]
- Tiwari, R.; Babu, N.R.; Sanjeevikumar, P.; Sengupta, S.; Zobaa, A.F.; Sherpa, K.S.; Bhoi, A.K. Fuzzy Logic-Based Pitch Angle Controller for PMSG-Based Wind Energy Conversion System. Lect. Notes Electr. Eng. 2017, 435, 277–286. [Google Scholar]
- Han, B.; Yang, F.; Xiang, Z.; Zhou, L. Individual pitch controller based on fuzzy logic control for wind turbine load mitigation. IET Renew. Power Gener. 2016, 10, 687–693. [Google Scholar] [CrossRef]
- Van, T.L.; Nguyen, T.H.; Lee, D.-C. Advanced Pitch Angle Control Based on Fuzzy Logic for Variable-Speed Wind Turbine Systems. IEEE Trans. Energy Convers. 2015, 30, 578–587. [Google Scholar] [CrossRef]
- Civelek, Z.; Luy, M.; Çam, E.; Mamur, H. A new fuzzy logic proportional controller approach applied to individual pitch angle for wind turbine load mitigation. Renew. Energy 2017, 111, 708–717. [Google Scholar] [CrossRef]
- Tang, K.; Man, K.F.; Chen, G.; Kwong, S. An optimal fuzzy PID controller. IEEE Trans. Ind. Electron. 2001, 48, 757–765. [Google Scholar] [CrossRef]
- Li, C.; Mao, Y.; Zhou, J.; Zhang, N.; An, X. Design of a fuzzy-PID controller for a nonlinear hydraulic turbine governing system by using a novel gravitational search algorithm based on Cauchy mutation and mass weighting. Appl. Soft Comput. 2017, 52, 290–305. [Google Scholar] [CrossRef]
- Hamane, B.; Benghanemm, M.; Bouzid, A.; Belabbes, A.; Bouhamida, M.; Draou, A. Control for Variable Speed Wind Turbine Driving a Doubly Fed Induction Generator using Fuzzy-PI Control. Energy Procedia 2012, 18, 476–485. [Google Scholar] [CrossRef]
- Qi, Y.; Meng, Q. The Application of Fuzzy PID Control in Pitch Wind Turbine. Energy Procedia 2012, 16, 1635–1641. [Google Scholar] [CrossRef]
- Hamane, B.; Doumbia, M.L.; Bouhamida, M.; Benghanem, M. Control of wind turbine based on DFIG using Fuzzy-PI and Sliding Mode controllers. In Proceedings of the Ninth International Conference on Ecological Vehicles and Renewable Energies, Monte Carlo, Monaca, 25–27 March 2014. [Google Scholar]
- Civelek, Z.; Luy, M.; Cam, E.; Barışçı, N.; Barişçi, N. Control of Pitch Angle of Wind Turbine by Fuzzy Pid Controller. Intell. Autom. Soft Comput. 2015, 22, 463–471. [Google Scholar] [CrossRef]
- Sarafraz, M.; Tlili, I.; Tian, Z.; Bakouri, M.; Safaei, M.R. Smart optimization of a thermosyphon heat pipe for an evacuated tube solar collector using response surface methodology (RSM). Phys. A Stat. Mech. Appl. 2019, 534, 122–146. [Google Scholar] [CrossRef]
- Sarafraz, M.; Safaei, M.R.; Goodarzi, M.; Arjomandi, M. Experimental investigation and performance optimisation of a catalytic reforming micro-reactor using response surface methodology. Energy Convers. Manag. 2019, 199, 111983. [Google Scholar] [CrossRef]
- Li, Z.; Renault, F.L.; Gómez, A.O.C.; Sarafraz, M.; Khan, H.; Safaei, M.R.; Filho, E.P.B. Nanofluids as secondary fluid in the refrigeration system: Experimental data, regression, ANFIS, and NN modeling. Int. J. Heat Mass Transf. 2019, 144, 118635. [Google Scholar] [CrossRef]
- Liu, J.; Gao, Y.; Geng, S.; Wu, L. Nonlinear Control of Variable Speed Wind Turbines via Fuzzy Techniques. IEEE Access 2016, 5, 27–34. [Google Scholar] [CrossRef]
- Jonkman, J.M.; Butterfield, S.P.; Musial, W.D.; Scott, G.W. Definition of a 5-MW Reference Wind Turbine for Offshore System Development; Office of Scientific & Technical Information Technical Reports; National Renewable Energy Lab. (NREL): Golden, CO, USA, 2009. [Google Scholar]
- Habibi, H.; Koma, A.Y.; Sharifian, A. Power and velocity control of wind turbines by adaptive fuzzy controller during full load operation. Iranian J. Fuzzy Syst. 2016, 13, 35–48. [Google Scholar]
- Habibi, H.; Nohooji, H.R.; Howard, I. Adaptive PID Control of Wind Turbines for Power Regulation with Unknown Control Direction and Actuator Faults. IEEE Access 2018, 6, 37464–37479. [Google Scholar] [CrossRef]
- Habibi, H.; Howard, I.; Simani, S. Reliability improvement of wind turbine power generation using model-based fault detection and fault tolerant control: A review. Renew. Energy 2019, 135, 877–896. [Google Scholar] [CrossRef]
- Asgharnia, A.; Shahnazi, R.; Jamali, A. Performance and robustness of optimal fractional fuzzy PID controllers for pitch control of a wind turbine using chaotic optimization algorithms. ISA Trans. 2018, 79, 27–44. [Google Scholar] [CrossRef]
- Mehrpooya, M.; Hejazi, S. Design and Implementation of Optimized Fuzzy Logic Controller for a Nonlinear Dynamic Industrial Plant Using Hysys and Matlab Simulation Packages. Ind. Eng. Chem. Res. 2015, 54, 11097–11105. [Google Scholar] [CrossRef]
- Cervantes, L.; Castillo, O. Type-2 fuzzy logic aggregation of multiple fuzzy controllers for airplane flight control. Inf. Sci. 2015, 324, 247–256. [Google Scholar] [CrossRef]
- Meng, W.; Yang, Q.; Ying, Y.; Sun, Y.; Yang, Z.; Sun, Y. Adaptive Power Capture Control of Variable-Speed Wind Energy Conversion Systems with Guaranteed Transient and Steady-State Performance. IEEE Trans. Energy Convers. 2013, 28, 716–725. [Google Scholar] [CrossRef]
- Ang, K.H.; Chong, G.; Li, Y. PID control system analysis, design, and technology. IEEE Trans. Control. Syst. Technol. 2005, 13, 559–576. [Google Scholar]
- Hassairi, W.; Bousselmi, M.; Abid, M.; Sakuyama, C.V. Notice of Violation of IEEE Publication Principles: Using matlab and Simulink in SystemC verification environment by JPEG algorithm. In Proceedings of the 16th IEEE International Conference on Electronics, Circuits and Systems, Yasmine Hammamet, Tunisia, 13 December 2009. [Google Scholar]
- Blair, W.; Joao, L.D.M.; Davis, L.; Anderson, P. Streamlining the Genomics Processing Pipeline via Named Pipes and Persistent Spark Satasets. In Proceedings of the 17th IEEE International Conference on Bioinformatics & Bioengineering, Herndon, VA, USA, 23 October 2017. [Google Scholar]
- Zhu, Q.; Qiu, B. Research on Trajectory Tracking Control of Aircraft in Carrier Landing. In Proceedings of the Third International Conference on Instrumentation, Measurement, Computer, Communication and Control, Shenyang, China, 21 September 2013. [Google Scholar]
- Simani, S.; Castaldi, P. Active actuator fault-tolerant control of a wind turbine benchmark model. Int. J. Robust Nonlinear Control. 2013, 24, 1283–1303. [Google Scholar] [CrossRef]
- He, W.; Ge, S.S. Vibration Control of a Nonuniform Wind Turbine Tower via Disturbance Observer. IEEE/ASME Trans. Mechatron. 2015, 20, 237–244. [Google Scholar] [CrossRef]
- Yin, M.; Li, W.; Chung, C.Y.; Chen, Z.; Zou, Y. Inertia compensation scheme of WTS considering time delay for emulating large-inertia turbines. IET Renew. Power Gener. 2017, 11, 529–538. [Google Scholar] [CrossRef]
- Aho, J.; Buckspan, A.; Laks, J.; Jeong, Y.; Dunne, F.; Pao, L. A tutorial of wind turbine control for supporting grid frequency through active power control. In Proceedings of the 2012 American Control Conference, Montreal, QC, Canada, 27 June 2012. [Google Scholar]
- Kaimal, J.C.; Wyngaard, J.C.; Izumi, Y. Spectral characteristics of surface-layer turbulence. Q. J. R. Meteorol. Soc. 1972, 98, 563–589. [Google Scholar] [CrossRef]
- Von Karman, T. Progress in the Statistical Theory of Turbulence. Proc. Natl. Acad. Sci. USA 1948, 34, 530–539. [Google Scholar] [CrossRef]
- International Electrotechnical Commission, International Standard. IEC 61400-1 Wind Turbines—Part 1: Design Requirements, 3rd ed.; International Electrotechnical Commission: Geneva, Switzerland, 2005. [Google Scholar]
- Zhao, H.; Wu, Q.; Huang, S.; Yan, M.; Yang, Y.; Sun, H. Fatigue Load Sensitivity-Based Optimal Active Power Dispatch for Wind Farms. IEEE Trans. Sustain. Energy 2017, 8, 1247–1259. [Google Scholar] [CrossRef]
- Berg, J.; Natarajan, A.; Mann, J.; Patton, E.G. Gaussian vs non-Gaussian turbulence: Impact on wind turbine loads. Wind. Energy 2016, 19, 1975–1989. [Google Scholar] [CrossRef]


| NL | NM | NS | ZO | PS | PM | PL | ||
|---|---|---|---|---|---|---|---|---|
| NL | NL | NM | NS | PS | PS | PM | PL | |
| NM | NL | NM | NS | PS | PS | PM | PL | |
| NS | NL | NM | NS | ZO | PS | PM | PL | |
| ZO | PL | PM | PS | ZO | NS | NM | NL | |
| PS | PL | PM | PS | ZO | NS | NM | NL | |
| PM | PL | PM | PS | NS | NS | NM | NL | |
| PL | PL | PM | PS | NS | NS | NM | NL | |
| NL | NM | NS | ZO | PS | PM | PL | ||
| NL | NL | NM | NS | NS | NS | NS | ZO | |
| NM | NL | NM | NS | NS | NS | ZO | PS | |
| NS | NM | NS | ZO | ZO | ZO | ZO | PS | |
| ZO | ||||||||
| PS | PS | ZO | ZO | ZO | ZO | NS | NM | |
| PM | PS | ZO | NS | NS | NS | NM | NL | |
| PL | ZO | NS | NS | NS | NS | NM | NL | |
| NL | NM | NS | ZO | PS | PM | PL | ||
| NL | NL | NM | PL | PL | PL | PL | PL | |
| NM | NL | NM | PL | PL | PL | PL | PL | |
| NS | NM | NM | PL | PL | PL | PL | PL | |
| ZO | PS | PS | PS | PS | PS | PS | PS | |
| PS | PL | PL | PL | PL | PL | NM | NM | |
| PM | PL | PL | PL | PL | PL | NM | NL | |
| PL | PL | PL | PL | PL | PL | NM | NL | |
| NL | NM | NS | ZO | PS | PM | PL | ||
| NL | PL | PL | PL | PL | PL | PL | PL | |
| NM | PL | PL | PL | PL | PL | PL | PL | |
| NS | PL | PL | PL | PL | PL | PL | PL | |
| ZO | NL | NL | NL | NL | NL | NL | NL | |
| PS | PL | PL | PL | PL | PL | PL | PL | |
| PM | PL | PL | PL | PL | PL | PL | PL | |
| PL | PL | PL | PL | PL | PL | PL | PL | |
| Parameter | Value |
|---|---|
| Rated power (KW) | 2000 |
| Rated speed of wind rotor (r·min−1) | 11.81 |
| Diameter of wind rotor (m) | 130.62 |
| Power regulation mode | Variable speed and variable blade |
| Variable drive mode | Hydraulic drive |
| Cut-in speed (m·s−1) | 3 |
| Cut-out speed (m·s−1) | 19 |
| Rated speed (m·s−1) | 8.4 |
| Control Algorithm | SD of Power | SD of Pitch Rate | ||
|---|---|---|---|---|
| Value (KW) | Variation Compared with PI Control (%) | Value (deg·s-1) | Variation Compared with PI Control (%) | |
| PI | 26.00 | 0.00 | 1.00 | 0.00 |
| Fuzzy-PI | 21.59 | −16.96 | 1.57 | +57.00 |
| Novel Fuzzy-PI | 28.32 | +8.92 | 0.98 | −2.00 |
| Location | Category | Improvement Compared with PI Control (%) | |
|---|---|---|---|
| Using Novel Fuzzy-PI Control | Using Fuzzy-PI Control | ||
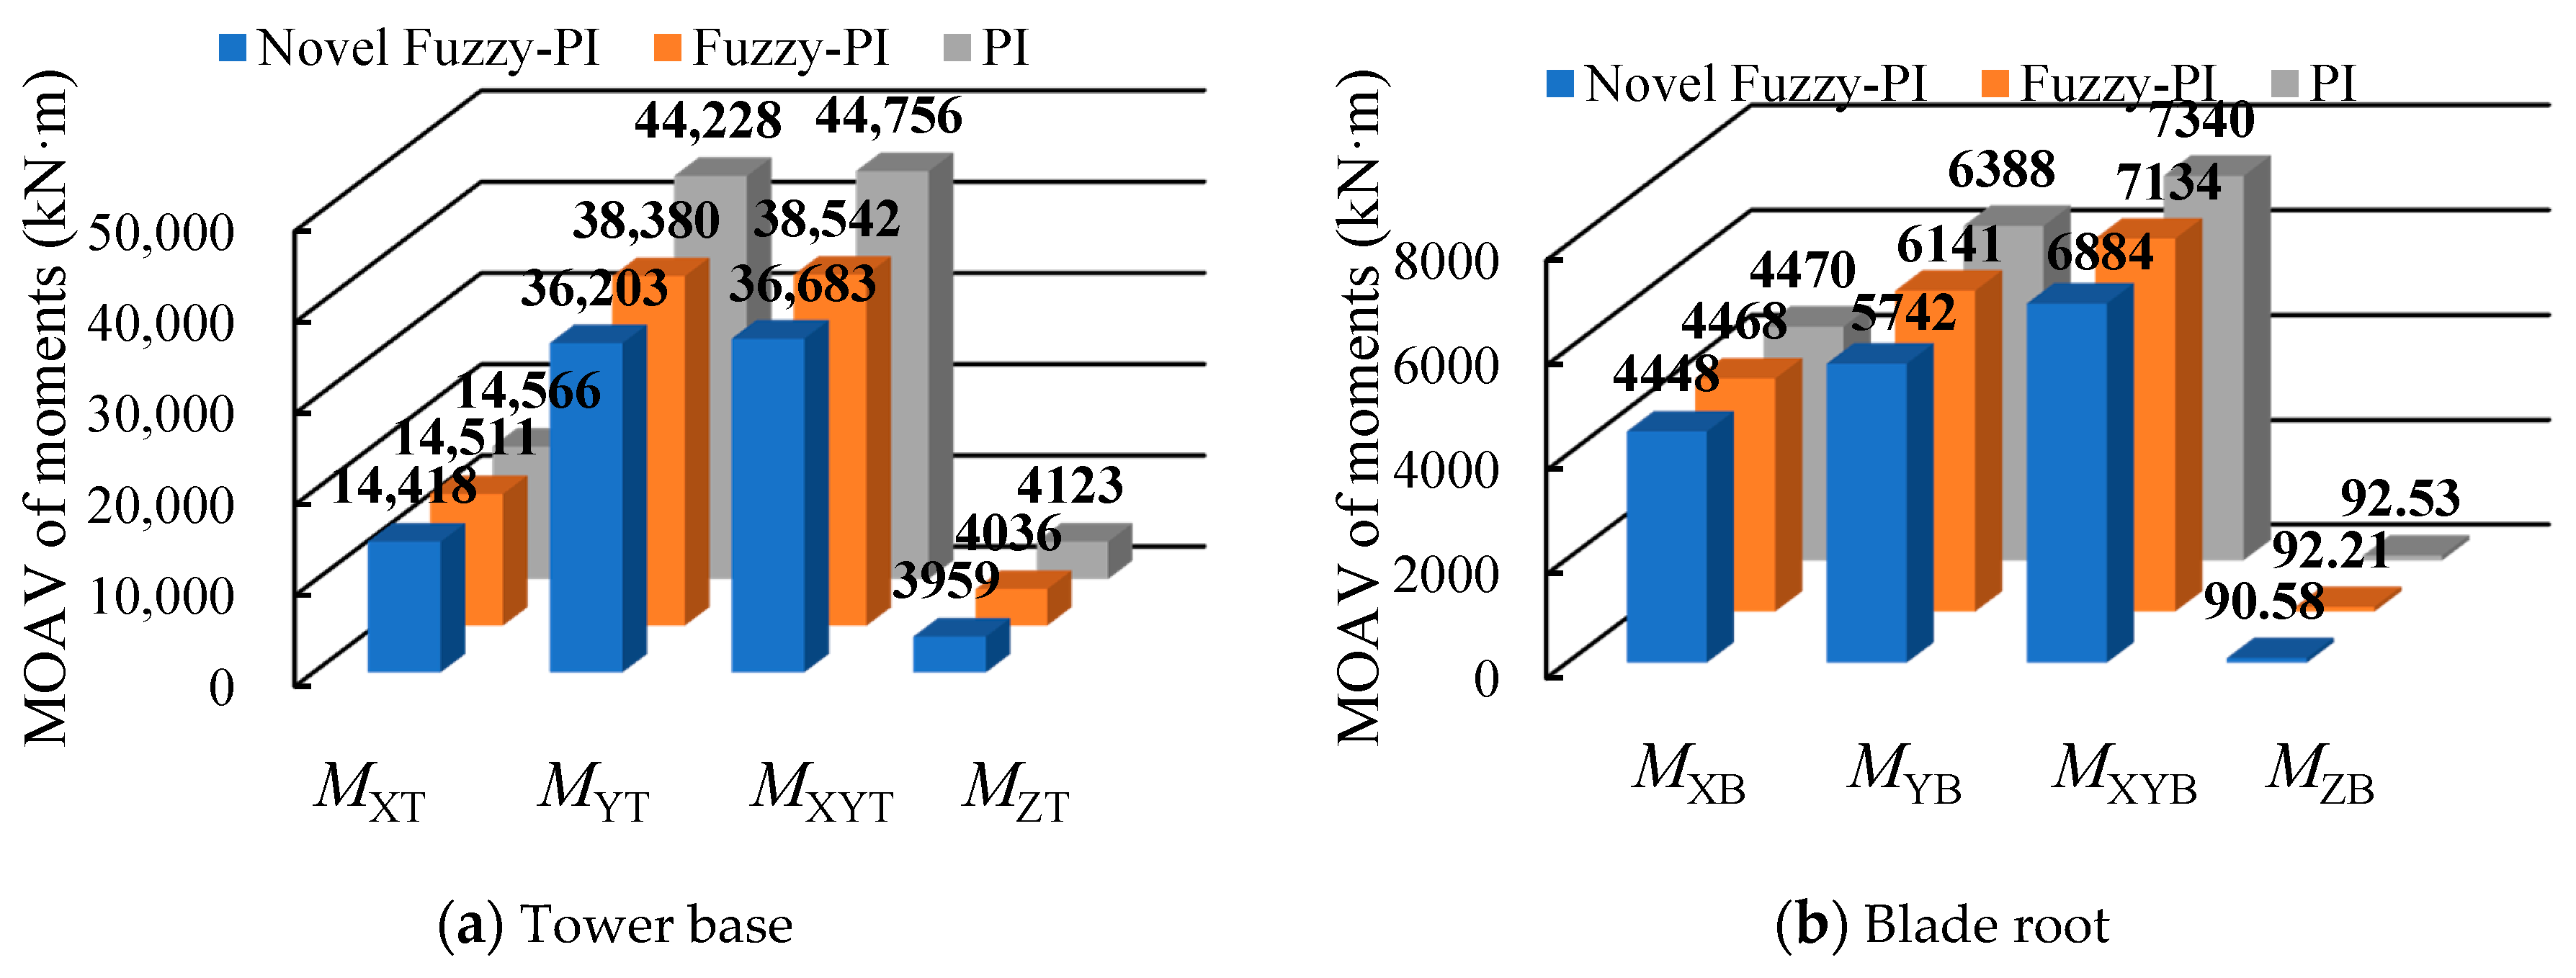
| Fatigue loads of tower base | 9.76 | 2.78 | |
| 21.53 | 15.64 | ||
| 17.66 | 12.98 | ||
| 0.69 | 0.59 | ||
| Fatigue loads of blade root | 0.00 | 0.00 | |
| 2.05 | 0.22 | ||
| 1.09 | 0.36 | ||
| 0.65 | 0.16 | ||
| Control Algorithm | MOAV of Power Deviation Compared with Rated Power | MOAV of Pitch Rate | ||
|---|---|---|---|---|
| Value (KW) | Variation Compared with PI Control (%) | Value (deg·s−1) | Variation Compared with PI Control (%) | |
| PI | 112.27 | 0.00 | 5.40 | 0.00 |
| Fuzzy-PI | 86.16 | −23.26 | 12.22 | +126.30 |
| Novel Fuzzy-PI | 74.26 | −33.86 | 5.85 | +8.33 |
| Location | Category | Improvement Compared with PI Control (%) | |
|---|---|---|---|
| Using Novel Fuzzy-PI Control | Using Fuzzy-PI Control | ||
| Ultimate loads of tower base | 1.02 | 0.37 | |
| 18.14 | 13.22 | ||
| 18.04 | 13.88 | ||
| 3.98 | 2.11 | ||
| Ultimate loads of blade root | 0.49 | 0.04 | |
| 10.11 | 3.87 | ||
| 6.21 | 2.80 | ||
| 2.11 | 0.35 | ||
Publisher’s Note: MDPI stays neutral with regard to jurisdictional claims in published maps and institutional affiliations. |
© 2020 by the authors. Licensee MDPI, Basel, Switzerland. This article is an open access article distributed under the terms and conditions of the Creative Commons Attribution (CC BY) license (http://creativecommons.org/licenses/by/4.0/).
Share and Cite
Xu, B.; Yuan, Y.; Liu, H.; Jiang, P.; Gao, Z.; Shen, X.; Cai, X. A Pitch Angle Controller Based on Novel Fuzzy-PI Control for Wind Turbine Load Reduction. Energies 2020, 13, 6086. https://doi.org/10.3390/en13226086
Xu B, Yuan Y, Liu H, Jiang P, Gao Z, Shen X, Cai X. A Pitch Angle Controller Based on Novel Fuzzy-PI Control for Wind Turbine Load Reduction. Energies. 2020; 13(22):6086. https://doi.org/10.3390/en13226086
Chicago/Turabian StyleXu, Bofeng, Yue Yuan, Haoming Liu, Peng Jiang, Ziqi Gao, Xiang Shen, and Xin Cai. 2020. "A Pitch Angle Controller Based on Novel Fuzzy-PI Control for Wind Turbine Load Reduction" Energies 13, no. 22: 6086. https://doi.org/10.3390/en13226086
APA StyleXu, B., Yuan, Y., Liu, H., Jiang, P., Gao, Z., Shen, X., & Cai, X. (2020). A Pitch Angle Controller Based on Novel Fuzzy-PI Control for Wind Turbine Load Reduction. Energies, 13(22), 6086. https://doi.org/10.3390/en13226086