Abstract
Marangoni condensation is formed due to the surface tension gradient caused by the local temperature or concentration gradient on the condensate surface; thus, the investigation of the surface temperature distribution characteristics is crucial to reveal the condensation mechanism and heat transfer characteristics. Few studies have been conducted on the temperature distribution of the condensate surface. In this study, thermal infrared images were used to measure the temperature distributions of the condensate surface during Marangoni condensation for ethanol–water mixture vapor. The results showed that the surface temperature distribution of the single droplet was uneven, and a large temperature gradient, approximately 15.6 °C/mm, existed at the edge of the condensate droplets. The maximum temperature difference on the droplet surface reached up to 8 °C. During the condensation process, the average surface temperature of a single droplet firstly increased rapidly and then slowly until it approached a certain temperature, whereas that of the condensate surface increased rapidly at the beginning and then changed periodically in a cosine-like curve. The present results will be used to obtain local heat flux and heat transfer coefficients on the condensing surface, and to further establish the relationship between heat transfer and temperature distribution characteristics.
1. Introduction
Dropwise condensation is a highly efficient phase-change process, which has a higher heat transfer coefficient compared with filmwise condensation. Two types of traditional methods achieve dropwise condensation by decreasing wettability. One is to modify the condensing surface using coatings or surface structures, and the other is to add heat transfer additives to the vapor [1]. Nevertheless, the reliability of dropwise condensation modes through these two methods cannot meet the requirement of long-time running in industrial applications.
Mirkovich and Missen [2] firstly observed pseudo-dropwise condensation modes during the condensation experiments of binary vapors, and this phenomenon was later defined as Marangoni condensation [3]. The formation of the pseudo-dropwise condensation modes was not due to special treatments on the condensing surface but to the physical properties of vapor mixtures. Therefore, they could last for a long time. Moreover, Marangoni condensation is similar to dropwise condensation, and also has excellent heat transfer performance. Utaka and Wang [4] found that the maximal condensation heat transfer coefficient of water and ethanol mixtures on a vertical plane was 180 kW/(m2·K) when the ethanol vapor concentration was 1%. Moreover, Wang et al. [5] reported that the temperature gradients on the condensing surface could enhance heat transfer, and they obtained a higher condensation heat transfer coefficient. Ali et al. [6] and Hu et al. [7] found that significant heat transfer enhancement was also obtained on a horizontal low-finned tube and in the plate heat exchanger during Marangoni condensation experiments, respectively. Li et al. [8,9] investigated the influence of ethanol vapor concentration, surface subcooling, and vapor pressure on the condensation modes and the heat transfer characteristics of Marangoni condensation during a time-series process. They found that the heat transfer coefficient was not only related to the above factors but also to the condensation modes. Thus, the condensation mode of Marangoni condensation became another research focus for many scholars. Fujii et al. [10] observed several condensation modes, namely dropwise, drop-and-streak, and ring-wise condensations, in the condensation experiments of ethanol–water vapor mixtures on a horizontal tube. Utaka et al. [11] reported the maximum diameter of the condensate droplets was between 1.5 mm and 2.5 mm on the outside surface of a horizontal tube. On a vertical flat plate, six types of condensation modes including smooth film, drop, streak, drop streak, wavy streak, and drop with tail were recorded by Yan et al. [12]. Moreover, Yan et al. [13] quantitatively analyzed the condensation modes to reveal the condensation phenomenon and dropwise condensation mechanisms. They reported that the proportion of small droplets with a diameter of less than 1 mm was more than 70% in all droplets. In summary, most existing research focuses on heat transfer and morphological characteristics. However, Marangoni condensation is formed due to the surface tension gradient caused by the local temperature or concentration gradient on the condensate surface; thus, the temperature distribution characteristics of the condensate surface are crucial to heat transfer and morphological characteristics. In the existing experimental studies, the temperature of the condensate was usually measured by thermocouples, which could only focus on the temperature at one point but hardly obtained the detailed temperature field. Therefore, the temperature distribution characteristics of Marangoni condensation have not been investigated, still representing a relevant research gap. Thus, more attention should be paid to this research topic.
With unique advantages such as noncontact measurement, wide temperature range, and visualization of measurement results, the infrared thermal image technique could be applied to the measurement of temperature during the gas–liquid phase transition process [14]. Girard et al. [15,16] used a thermal infrared imager to record the temperature distribution of the droplet interface during the evaporation process, and the results were validated with optical measurements. Chen et al. [17], Patil et al. [18], and Sobac et al. [19] also applied a thermal infrared imager to the measurement of the droplets surface temperature during the evaporation process. Malla et al. [20] obtained the temperature distribution of droplets on a glass surface with a temperature gradient by using a thermal infrared imager and plotted the figures of the surface temperature distribution. Fournier et al. [21] measured the surface temperature distribution of an ink droplet, and obtained the surface emissivity of the ink droplet with a thermal infrared imager. Teodori et al. [22] used a thermal infrared imager to obtain the temperature distribution of liquid droplets at different moments of impact and used high-speed imaging to photograph the droplet shapes during the impact process. Then, they processed the temperature distribution figures obtained by the thermal infrared imager and qualitatively and quantitatively analyzed the heat transfer between droplets and wall interactions. Li et al. [23] studied the distribution and evolution features of temperature when a droplet collided with the liquid film on the superhydrophilic surface. They found that after the collision, a low-temperature area was formed in the center of the droplets. Wen et al. [24] used a thermal infrared imager to record the distribution and evolution of the surface temperature field during the coalescence process of a droplet. These studies show the successful applications of the infrared thermal image technique in temperature field measurements during phase-change process.
As mentioned above, due to the formation mechanism, the condensation modes and heat transfer characteristics of Marangoni condensation are attributed to the temperature distribution of the condensate surface. Although significant advances have been made regarding the heat transfer characteristics and condensation modes of Marangoni condensation, few studies have been carried out on the temperature distribution of the condensate surface. The investigation of the temperature distribution characteristics of the condensate surface is beneficial to reveal the mechanism of Marangoni condensation and its heat transfer characteristics. In addition, the relevant studies [14,15,16,17,18,19,20,21,22,23,24] have fully verified the feasibility of using thermal infrared imagers to measure the surface temperature field of the condensate droplets, and its unique advantages can be fully utilized in Marangoni condensation. Thus, in this study, an experimental investigation was carried out to obtain the temperature distribution of the condensate surface during Marangoni condensation using a thermal infrared imager. Moreover, the effects of the impinging cooling water temperature and the ethanol vapor concentration on the temperature distribution of a single droplet surface and total condensate surface were analyzed. The purpose of the present paper is to obtain the temperature distribution on the condensate surface, which will provide a more fundamental description of Marangoni condensation. The experimental results of this study will be the base to establish the relationship between heat transfer and temperature distribution characteristics.
2. Experimental Principle and Method
Figure 1 shows the schematic diagram of the experimental apparatus, which consisted of four closed loops: main vapor loop, impinging cooling loop, condenser loop, and auxiliary condenser loop. In the main vapor loop, ethanol–water mixture vapor was generated in the vapor generator and then went into the condensation chamber, where part of the mixture vapor was condensed by the impinging cooling water (impinging cooling loop). After that, the vapor–liquid mixture went into the condenser, where the rest of the vapor was condensed completely by the cooling water (condenser loop). Finally, the total condensate went through the mass flowmeter and returned to the vapor generator. The main vapor loop is a closed one, which can ensure the consistency of the ethanol vapor concentration during the condensation experiment. The desired vapor pressure and vapor velocity could be sustained by the cooling rate of the condenser and the input voltage of the vapor generator, respectively. Noncondensable gas had a great influence on the condensation experimental results; thus, a vacuum pump above the condenser continuously worked to pump out the noncondensable gas during Marangoni condensation. Furthermore, an auxiliary condenser loop was set to cool the mixture vapor drawn with the non-condensable gas to avoid the loss of mixture vapor.
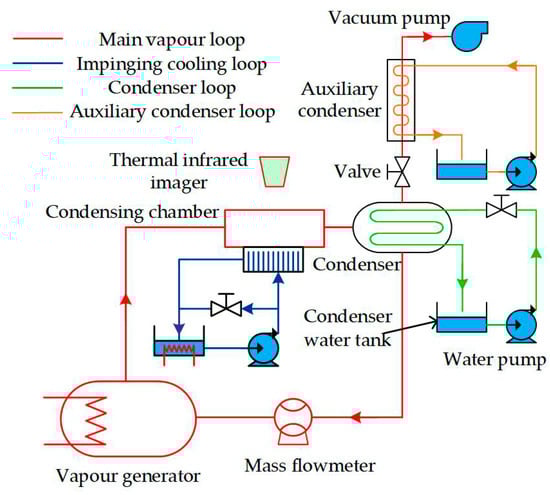
Figure 1.
Schematic diagram of the experimental apparatus.
Table 1 summarizes the equipment used in the present investigation. The mass flowmeter (OPTIMASS 3300 CS03) was used to measure the flow rate of the condensate, and its uncertainty was ±0.1%. The saturated vapor temperature was recorded by thermocouples, and its uncertainty was ±0.1 K. The saturated vapor pressure was measured by an absolute pressure transducer (MSI-US5100), and its uncertainty was ±0.2 kPa. In this study, all the experimental data of the temperature were recorded by the data acquisition system (NI 9213), which has 16 channels, and the collection frequency was 2 Hz.

Table 1.
Equipment used in the present experiment.
To obtain the temperature distribution of the condensate surface, a thermal infrared imager (FLIR A615) was installed above the condensation chamber, as shown in Figure 2. An infrared glass was adopted between the condensation chamber and the thermal infrared imager, and hot air was used to heat the infrared glass surface to prevent the vapor from condensing at the bottom; otherwise, it would seriously affect the temperature measurement of the condensate surface.
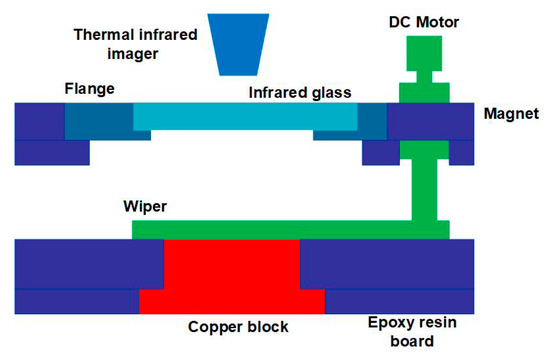
Figure 2.
Schematic diagram of the condensation chamber.
2.1. Experimental Principle
The thermal infrared imager obtains the temperature by receiving the radiation emitted from the measured surface. In the actual measurement, the effective radiation recorded by the thermal infrared imager consists of three main portions, namely the environmental reflection radiation, the target radiation, and the atmospheric radiation. Figure 3 illustrates the principle of temperature measurement by infrared thermal imaging technology.
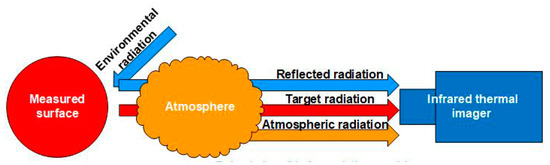
Figure 3.
Measurement principle of thermal infrared imagers.
For opaque objects, the radiant brightness of the measured surface is as follows [25,26]:
where ε is the surface radiance; Tms is the actual temperature of the measured surface, K; ρ is the surface reflectance; Tatm is the ambient temperature, K; and α is the surface absorptivity of the environmental radiation.
According to the measurement principle of the thermal infrared imager, the voltage corresponding to its radiation power is
where τa is the air transmittance; Trefl is the reflection temperature, K; and T′ms is the measured surface temperature when ε and τa are 1, K.
When , then Equation (3) can be obtained from Equations (1) and (2). The value of n is different when using different kinds of thermal imagers. When the infrared wavelengths are between 2 μm and 5 μm, n is 9.2554, and when the infrared wavelengths are between 8 μm and 13 μm, n is 3.9889. In this investigation, the surface temperature of the liquid film ranged from 40 °C to 70 °C. According to Wien’s displacement law, the infrared wavelengths are concentrated between 8.45 μm and 9.29 μm. Therefore, n was 3.9889 in this study.
2.2. Experimental Method
In accordance with Equation (3), the condensate surface temperature can be obtained if the condensate surface emissivity and the infrared glass transmittance are known; thus, they must be obtained before the experiments. During the Marangoni condensation process, the liquid film covers the copper condensing surface. Thus, the condensate surface emissivity is the actual emissivity of the liquid mixture. Furthermore, the mixture vapor in the condensation chamber absorbs the radiation emitted from the condensate surface and is accumulated into the infrared glass transmittance. The steps to obtain the condensate surface emissivity and the infrared glass transmittance are known as the “correction” of the thermal infrared imager. The specific correction steps are as follows.
For the condensate surface emissivity, the infrared glass is removed first, and ethanol–water liquid mixtures on the copper condensing surface where the thermocouple is placed are completely covered. At this time, the infrared glass transmittance τα is the air transmittance and equals 1. Equation (4) can be obtained in accordance with Equation (3). Second, the condensate surface emissivity is set to ensure the temperature recorded by the thermal infrared imager is consistent with that measured by the thermocouple. Third, the temperature of the ethanol–water liquid mixtures is changed, and whether the temperatures measured by the thermocouple and the thermal infrared imager are consistent is determined. If consistent, then the condensate surface emissivity ε is obtained. Otherwise, the condensate surface emissivity is reset until the requirement is met.
Here, T′refl is the reflection temperature, K; however, the condensation chamber is filled with air at this time; thus, T′refl is considered the ambient temperature.
For the infrared glass transmittance τg, the infrared glass is firstly installed and then heated with a hair dryer. Secondly, the condensate surface emissivity ε obtained previously is set. Thirdly, the boiler input power is adjusted to stabilize the steam temperature at the correction value when the vapor temperature approaches the corresponding correction value. Fourthly, the infrared glass transmittance is set on the basis of the temperature measured by the thermocouples when the liquid mixtures cover the condensate surface. Fifth, the vapor temperature is changed, and whether the temperatures from the thermocouples and those from the thermal infrared imager are consistent is determined. If consistent, then the infrared glass transmittance τg is obtained; otherwise, the infrared glass transmittance is reset until the requirement is met.
Equation (5) is obtained in accordance with Equation (3), and the condensate surface emissivity ε is known.
Through the correction of the thermal infrared imager, the condensate surface emissivity and the infrared glass transmittance are obtained. Then, these two parameters are entered in Equation (3), and the real temperature of the condensate surface can be obtained.
3. Results and Discussion
During the present study of the Marangoni condensation process, the droplet surface temperature varied approximately from 43 °C to 60 °C. Thus, the temperature during the correction varied from 40 °C to 65 °C. Figure 4 shows the correction curve of the thermal infrared imager. As shown in Figure 4, the maximum temperature error between the thermocouples and thermal infrared imager was less than 0.6 °C, and the relative error between these two methods was less than 1%. We found that the surface temperature distribution could be accurately measured by the thermal infrared imager. The condensate surface emissivity and the infrared glass transmittance were 0.98 and 0.78, respectively.
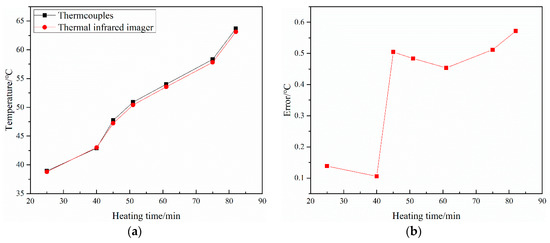
Figure 4.
Correction curve of the thermal infrared imager: (a) Temperature; (b) Temperature error.
3.1. Temperature Distribution of Single Droplet Surface
Figure 5 and Figure 6 show the front and top views of the surface temperature distribution of a typical condensate droplet at different times (P = 20 kPa, We = 1%, U = 3 m/s, tc = 55 °C), respectively. As shown in Figure 5, the maximum surface temperature of the condensate droplet was approximately 60 °C, and the surface temperature in the core area of the condensate droplet was close to the saturation temperature of the mixture vapor. The surface temperature distribution of the single droplet was uneven: a large temperature gradient, approximately 15.6 °C/mm, existed at the edge of the condensate droplet, and the maximum temperature difference on the droplet surface was approximately 7 °C. As shown in Figure 5 and Figure 6, the condensate droplet grew with time, and its average surface temperature increased. Furthermore, the temperature gradient on the droplet surface also increased, causing the condensate droplet to accelerate continuously until it merged with other droplets or left the condensate surface. In addition, the maximum temperature difference on the droplet surface increased from 5 °C to 8 °C when the condensation process progressed from 0.32 s to 1.92 s.
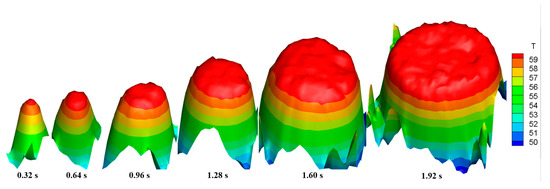
Figure 5.
Front view of the temperature distribution of a typical single droplet surface at different times.
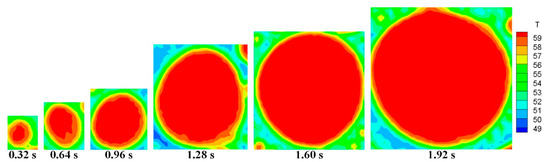
Figure 6.
Top view of the temperature distribution of the typical single droplet surface at different times.
The effects of the impinging cooling water temperature and ethanol vapor concentration on the average surface temperature of the single condensate droplet are shown in Figure 7 and Figure 8, respectively. During the condensation process, the average surface temperature of a single droplet increased rapidly at the beginning and then slowly until it approached a certain temperature. However, the curve still had small fluctuations because the average surface temperature of a single droplet decreased when it merged with little droplets, in which the surface temperature was lower. As shown in Figure 7, the average surface temperature increased first and then decreased with the increase of the impinging cooling water temperature, and the vapor-to-droplet surface temperature difference varied from 0.5 °C to 5 °C. As shown in Figure 8, as the ethanol vapor concentration increased from 0.5% to 5%, the average surface temperature of a single droplet decreased, and the vapor-to-droplet surface temperature difference varied from 0.5 °C to 5 °C.
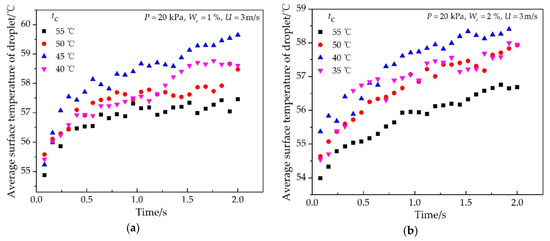
Figure 7.
Effect of the impinging cooling water temperature on the average surface temperature of a typical single droplet at different times with the experimental conditions of (a) P = 20 kPa, We = 1%, U = 3 m/s; (b) P = 20 kPa, We = 2%, U = 3 m/s.
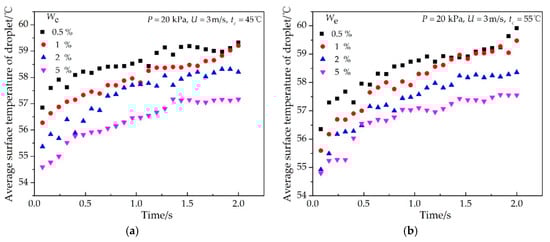
Figure 8.
Effect of ethanol vapor concentrations on the average surface temperature of a typical single droplet at different times with the experimental conditions of (a) P = 20 kPa, U = 3 m/s, tc = 45 °C; (b) P = 20 kPa, U = 3 m/s, tc = 55 °C.
3.2. Temperature Distribution of Condensate Surface
The whole surface covered by the condensate droplets was analyzed, and the droplet radius ranged from 0.1 mm to 6 mm. Figure 9 and Figure 10 show the front and top views of the temperature distribution during the time-series process, respectively. It was found that the number of droplets decreased, and the radius of many droplets increased as the condensation process proceeded. Furthermore, the temperature of the condensate surface increased because the condensate droplet grew, and the maximum temperature difference on the condensate surface also increased.
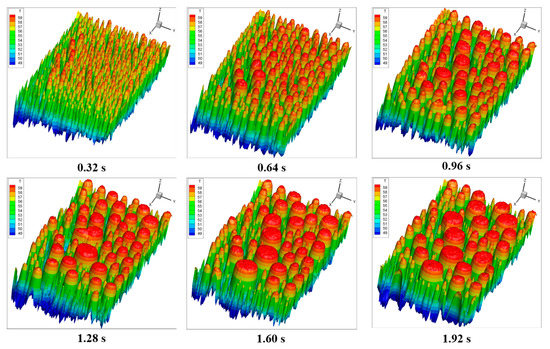
Figure 9.
Front view of the temperature distribution of all the droplets on the condensing surface at different times.
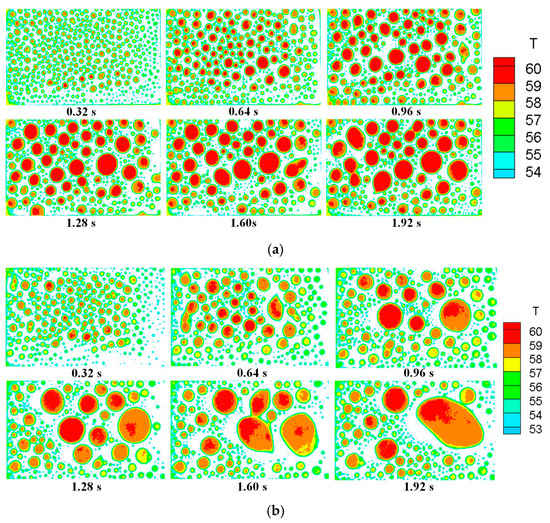
Figure 10.
Top view of the temperature distribution of all the droplets on the condensing surface at different times with the experimental conditions of (a) P = 20 kPa, U = 3 m/s, We = 1%, tc =55 °C; (b) P = 20 kPa, U = 3 m/s, We =2%, tc = 50 °C.
The effects of the impinging cooling water temperature and ethanol vapor concentration on the average temperature of the whole condensate surface are shown in Figure 11 and Figure 12, respectively. It was found that the average temperature of the condensate surface increased rapidly at the beginning of the condensation process and then changed with time periodically in a cosine-like curve because the condensate droplet continued to grow, merge, move, and disengage on the condensate surface. In addition, the average period of its periodic change was 2 s, and the average amplitude was 0.6 °C. As shown in Figure 11, the average temperature of the condensate surface increased first and then decreased with the increase of the impinging cooling water temperature. The average period of its periodic change varied from 1.1 s to 3.9 s, and the amplitude varied from 0.2 °C to 0.9 °C. As shown in Figure 12, when the ethanol vapor concentration increased, the average temperature of the condensate surface decreased. The average period of its periodic change varied from 1.5 s to 4.1 s, and the amplitude varied from 0.3 °C to 0.9 °C. In addition, the influence of the ethanol vapor concentration on the average temperature of the condensate surface was larger than that of the impinging cooling water temperature.
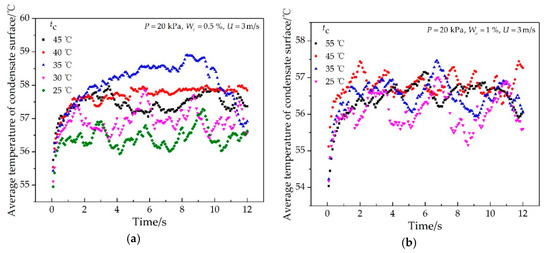
Figure 11.
Effect of the impinging cooling water temperature on the average temperature of the condensate surface at different times with the experimental conditions of (a) P = 20 kPa, We = 0.5%, U = 3 m/s; (b) P = 20 kPa, We = 1%, U = 3 m/s.
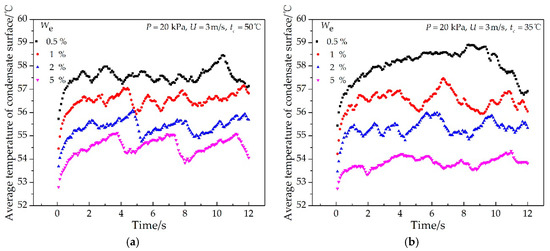
Figure 12.
Effects of the ethanol vapor concentrations on the average temperature of the condensate surface at different times with the experimental conditions of (a) P = 20 kPa, U = 3 m/s, tc = 50 °C; (b) P = 20 kPa, U = 3 m/s, tc = 35 °C.
The present study successfully applied the infrared thermal image technique to the measurement of the surface temperature field during Marangoni condensation. The temperature distribution characteristics of the condensate surfaces for ethanol–water mixture vapor were obtained. It was confirmed that the temperatures of the droplets and the whole condensate surface were uneven, and a large temperature gradient existed at the edge of the condensate droplets. The present results will be used to obtain the local heat flux and heat transfer coefficients on the condensing surface, and to further establish the relationship between heat transfer and temperature distribution characteristics. These will reveal the clear mechanism of Marangoni condensation and help to control the heat transfer characteristics by active regulation.
Marangoni condensation occurs on normal condensing surfaces without special treatments, determined by the physical properties of the condensate itself. Therefore, the pseudo-dropwise condensation formed in Marangoni condensation can be maintained for a long time. Due to the excellent heat transfer performance, Marangoni condensation can be applied in power generation systems, refrigeration systems, thermal management of electronic systems, and so on. The temperature distribution characteristics obtained in this paper might be helpful to enhance heat transfer and develop design guidelines for compact condensers.
4. Conclusions
Marangoni condensation can improve the heat transfer process, and has the potential to be applied in many industrial fields. To obtain the temperature distribution of the condensate surface in Marangoni condensation, the infrared thermal imager was used during the condensation of ethanol–water mixture vapor on a horizontal surface. The main results are summarized as follows:
(1) The temperature distribution of a single droplet surface was uneven, and a large temperature gradient, approximately 15.6 °C/mm, existed at the edge of the condensate droplet. The maximum temperature difference on the droplet surface increased from 5 °C to 8 °C when the condensation process progressed from 0.32 s to 1.92 s.
(2) During the condensation process, the average surface temperature of a single droplet increased rapidly at the beginning and then slowly until it approached a certain temperature, and the vapor-to-droplet surface temperature difference varied from 0.5 °C to 5 °C. The average surface temperature of the condensate surface increased rapidly at the beginning and then changed periodically in a cosine-like curve. The average period of its periodic change was 2.4 s, and the average amplitude was 0.6 °C.
(3) The average temperature of the single droplet and condensate surface increased first and then decreased with the increase of the impinging cooling water temperature. The average period of its periodic change varied from 1.1 s to 3.9 s, and the amplitude varied from 0.2 °C to 0.9 °C. When the ethanol vapor concentration increased from 0.5% to 5%, the average temperature of the single droplet surface and condensate surface decreased. The average period of its periodic change varied from 1.5 s to 4.1 s, and the amplitude varied from 0.3 °C to 0.9 °C. The influence of the ethanol vapor concentration on the average temperature of the condensate surface was larger than that of the impinging cooling water temperature.
This paper describes a new method to obtain the temperature distribution profile of the condensate surface, which provides a better understanding of the condensation process and is helpful to reveal the Marangoni condensation mechanism. Based on these results, further study is planned to establish the quantitative and qualitative relationships between the temperature gradient, surface tension gradient, condensation mode, and heat transfer characteristics. Finally, the present findings will be used to control the heat transfer characteristics by active regulation, and provide design guidelines for compact condensers.
Author Contributions
Conceptualization, G.Z. and J.W.; methodology, G.Z.; software, Z.M.; validation, G.Z. and H.L.; formal analysis, H.L.; investigation, G.Z. and H.L.; resources, J.W.; data curation, Z.M.; writing—original draft preparation, G.Z. and Z.M.; writing—review and editing, J.W.; visualization, G.Z. and H.L.; supervision, J.W.; project administration, J.W.; funding acquisition, J.W. All authors have read and agreed to the published version of the manuscript.
Funding
This research was funded by the National Natural Science Foundation of China (grant number 51876171) and the Natural Science Basic Research Project in Shaanxi Province, China (grant number 2018JM5157).
Acknowledgments
The authors are very grateful to Y. Utaka at Tianjin University for his guidance in this research field.
Conflicts of Interest
The authors declare no conflict of interest.
Nomenclature
| Notation | |
| K | Proportionality coefficient |
| L | Radiant brightness of the measured surface (W/m2/sr) |
| n | 3.9889 |
| P | Vapor pressure (kPa) |
| T | Temperature (K) |
| T′ms | Measured surface temperature when ε and τα are both 1 (K) |
| T′refl | Ambient temperature (K) |
| tc | Temperature of impinging cooling water (°C) |
| U | Vapor velocity (m/s) |
| Vs | Voltage (V) |
| We | Ethanol vapor concentrations (%) |
| Greek Symbols | |
| α | Surface absorptivity |
| ε | Surface radiance |
| ρ | Surface reflectance |
| τ | Transmittance |
| Subscripts | |
| a | Air |
| g | Infrared glass |
| atm | Atmosphere |
| ms | Measured surface |
| refl | Reflective object |
References
- Wang, J.S.; Ma, Z.Q.; Li, G.; Sundén, B.; Yan, J.J. Improved modeling of heat transfer in dropwise condensation. Int. J. Heat Mass Transf. 2020, 155, 119719. [Google Scholar] [CrossRef]
- Mirkovich, V.V.; Missen, R.W. Non-filmwise condensation of binary vapors of miscible liquids. Can. J. Chem. Eng. 1961, 39, 86–87. [Google Scholar] [CrossRef]
- Hijikata, K.; Fukasaku, Y.; Nakabeppu, O. Theoretical and Experimental Studies on the Pseudo-Dropwise Condensation of a Binary Vapor Mixture. J. Heat Transf. 1996, 118, 140–147. [Google Scholar] [CrossRef]
- Utaka, Y.; Wang, S.X. Characteristic curves and the promotion effect of ethanol addition on steam condensation heat transfer. Int. J. Heat Mass Transf. 2004, 47, 4507–4516. [Google Scholar] [CrossRef]
- Wang, J.S.; Yan, J.J.; Hu, S.H.; Liu, J.P. Marangoni condensation heat transfer of water–ethanol mixtures on a vertical surface with temperature gradients. Int. J. Heat Mass Transf. 2009, 52, 2324–2334. [Google Scholar] [CrossRef]
- Ali, H.; Kamran, M.S.; Ali, H.M.; Farukh, F.; Imran, S.; Wang, H.S. Marangoni condensation of steam-ethanol mixtures on a horizontal low-finned tube. Appl. Therm. Eng. 2017, 117, 366–375. [Google Scholar] [CrossRef]
- Hu, S.H.; Ma, X.R.; Zhou, W.Q. Condensation heat transfer of ethanol-water vapor in a plate heat exchanger. Appl. Therm. Eng. 2017, 113, 1047–1055. [Google Scholar] [CrossRef]
- Li, Y.; Wang, J.S.; Shao, F.; Chen, N.N.; Yan, J.J. Heat transfer characteristics of Marangoni condensation for ethanol–water mixtures on a horizontal plate. Int. J. Heat Mass Transf. 2015, 90, 561–567. [Google Scholar] [CrossRef]
- Li, Y.; Wang, J.S.; Xia, K.; Chen, N.N.; Yan, J.J. Experimental study on time-series characteristics in Marangoni condensation for ethanol-water mixtures on a horizontal surface. Exp. Therm. Fluid Sci. 2017, 83, 141–156. [Google Scholar] [CrossRef]
- Fujii, T.; Koyama, S.; Simizu, Y.; Watabe, M.; Nakamura, Y. Gravity controlled condensation of an ethanol and water mixture on a horizontal tube. Trans. Jpn. Soc. Mech. Eng. Ser. B 1989, 55, 210–215. [Google Scholar] [CrossRef]
- Utaka, Y.; Kenmotsu, T.; Yokoyama, S. A study on marangoni condensation (measurement and observation for water and ethanol vapor mixture). In Proceedings of 11th International Heat Transfer Conference; Begell House: Danbury, CT, USA, 1998; Volume 6, pp. 397–402. [Google Scholar]
- Yan, J.J.; Yang, Y.S.; Hu, S.H.; Zhen, K.J.; Liu, J.P. Effects of vapor pressure/velocity and concentration on condensation heat transfer for steam–ethanol vapor mixture. Heat Mass Transf. 2007, 44, 51–60. [Google Scholar] [CrossRef]
- Yan, J.J.; Wang, J.S.; Yang, Y.S.; Hu, S.H.; Liu, J.P. Research on Marangoni Condensation Modes for Water–ethanol Mixture Vapors. Microgravity Sci. Technol. 2009, 21, 77–85. [Google Scholar] [CrossRef]
- Shen, J.L.; Zhang, Y.C.; Xing, T.T.; Zhang, Y. The study on the measurement accuracy of non-steady state temperature field under different emissivity using infrared thermal image. Infrared Phys. Technol. 2018, 94, 207–213. [Google Scholar] [CrossRef]
- Girard, F.; Antoni, M.; Sefiane, K. Infrared Thermography Investigation of an Evaporating Sessile Water Droplet on Heated Substrates. Langmuir 2010, 26, 4576–4580. [Google Scholar] [CrossRef] [PubMed]
- Fabien, G.; Antoni, M.; Sefiane, K. Use of IR Thermography To Investigate Heated Droplet Evaporation and Contact Line Dynamics. Langmuir 2011, 27, 6744–6752. [Google Scholar] [CrossRef] [PubMed]
- Chen, P.; Harmand, S.; Ouenzerfi, S.; Schiffler, J. Marangoni Flow Induced Evaporation Enhancement on Binary Sessile Drops. J. Phys. Chem. B 2017, 121, 5824–5834. [Google Scholar] [CrossRef] [PubMed]
- Patil, N.D.; Bange, P.G.; Bhardwaj, R.; Sharma, A. Effects of Substrate Heating and Wettability on Evaporation Dynamics and Deposition Patterns for a Sessile Water Droplet Containing Colloidal Particles. Langmuir 2016, 32, 11958–11972. [Google Scholar] [CrossRef]
- Sobac, B.; Brutin, D. Thermocapillary instabilities in an evaporating drop deposited onto a heated substrate. Phys. Fluids 2012, 24, 032103. [Google Scholar] [CrossRef]
- Malla, L.K.; Bhardwaj, R.; Neild, A. Colloidal deposit of an evaporating sessile droplet on a non-uniformly heated substrate. Colloids Surfaces A: Physicochem. Eng. Asp. 2020, 584, 124009. [Google Scholar] [CrossRef]
- Fournier, R.; Shum, A.D.; Liu, J.J.; Sabarirajan, D.C.; Xiao, X.H.; Zenyuk, I.V. Combined Infrared Thermography, X-ray Radiography, and Computed Tomography for Ink Drying Studies. ACS Appl. Energy Mater. 2018, 1, 6101–6114. [Google Scholar] [CrossRef]
- Teodori, E.; Pontes, P.; Moita, A.S.; Moreira, A.L.N. Thermographic analysis of interfacial heat transfer mechanisms on droplet/wall interactions with high temporal and spatial resolution. Exp. Therm. Fluid Sci. 2018, 96, 284–294. [Google Scholar] [CrossRef]
- Li, Y.; Zheng, Y.; Lan, Z.; Xu, W.; Ma, X.H. The evolution of droplet impacting on thin liquid film at superhydrophilic surface. Appl. Phys. Lett. 2017, 111, 231601. [Google Scholar] [CrossRef]
- Wen, R.F.; Lan, Z.; Peng, B.L.; Xu, W.; Li, J.X.; Ma, X.H. Distribution and evolution of droplet surface temperature field during dropwise condensation. J. Eng. Thermophys. 2014, 8, 1624–1628. [Google Scholar]
- Zissis, G.J. Infrared Technology Fundamentals. Opt. Eng. 1976, 15, 156484. [Google Scholar] [CrossRef]
- Zhang, Y.C.; Wang, Z.K.; Fu, X.B.; Yan, F.; Kong, T. An experimental method for improving temperature measurement accuracy of infrared thermal imager. Infrared Phys. Technol. 2019, 102, 103020. [Google Scholar] [CrossRef]
Publisher’s Note: MDPI stays neutral with regard to jurisdictional claims in published maps and institutional affiliations. |
© 2020 by the authors. Licensee MDPI, Basel, Switzerland. This article is an open access article distributed under the terms and conditions of the Creative Commons Attribution (CC BY) license (http://creativecommons.org/licenses/by/4.0/).