Article

Seismic Identification of Unconventional Heterogenous Reservoirs Based on Depositional History—A Case Study of the Polish Carpathian Foredeep

1
Oil and Gas Institute–National Research Institute, 25A Lubicz Str., 31-503 Krakow, Poland
2
Faculty of Geology, Geophysics and Environmental Protection, AGH University of Science and Technology, 30 Mickiewicz Av., 30-059 Krakow, Poland
*
Author to whom correspondence should be addressed.
Energies 2020, 13(22), 6036; https://doi.org/10.3390/en13226036
Submission received: 29 October 2020 / Revised: 16 November 2020 / Accepted: 17 November 2020 / Published: 19 November 2020
(This article belongs to the Special Issue Development of Unconventional Reservoirs 2020)

Abstract

:
An integrated geological and geophysical approach is presented for the recognition of unconventional targets in the Miocene formations of the Carpathian Foredeep, southern Poland. The subject of the analysis is an unconventional reservoir built of interlayered packets of sandstone, mudstone and claystone, called a “heterogeneous sequence”. This type of sequence acts as both a reservoir and as source rock for hydrocarbons and it consists of layers of insignificant thickness, below the resolution of seismic data. The interpretation of such a sequence has rarely been based on seismic stratigraphy analysis; however, such an approach is proposed here. The subject of interpretation is high-quality seismic data of high resolution that enable detailed depositional analysis. The reconstruction of the depositional history was possible due to the analysis of flattened chronostratigraphic horizons (Wheeler diagram). The identification of depositional positions in a sedimentary basin was the first step for the indication of potential target areas. These areas were also subject to seismic attribute analysis (sweetness) and spectral decomposition. The seismic attribute results positively verified the previously proposed prospects. The results obtained demonstrate that the interpretation of the Miocene sediments in the Carpathian Foredeep should take into account the depositional history reconstruction and paleogeographical analysis.

1. Introduction

The terms “heterolithic bedding” or “heterogeneous sequence” are used commonly in the description of sedimentary series that are built of interlayered packets (laminae or lenses) of sandstone, mudstone and claystone. The heterogeneous sequence is not only a reservoir rock, but also a source rock that exhibits a high concentration of total organic matter [1,2,3,4]. The thicknesses of the separate intervals can be various, from millimeters to decimeters [5,6]. Considering the ratio of sandstone to mudstone, the thickness of the layers and the frequency of their appearance (i.e., the frequency of sandstone layers appearing in mudstone intervals), various types of heterogeneous sequences can be defined. The increasing interest in the heterogeneous sequence in the Carpathian Foredeep is due to the recent discoveries of gas fields [7,8,9]. Gas flows are present for intervals of low porosity and permeability, which, in well log analysis, are associated with low gas saturation. These intervals are challenging for well log interpretation. The low resolution of well log data and the high clay content associated with these sequences strongly influence the results. The data often suggest increased water content in the heterogeneous sequence, while high dry gas flow is measured in gas tests. For this reason, an interpretation of the heterogeneous sequence based on other geophysical data and comprehensive depositional architecture analysis is needed.
The Carpathian Foredeep is part of a huge Pannonian Basin System (PBS) that is the subject of extensive geological analysis in the aspects of conventional and unconventional reservoirs. The Carpathian Foredeep area is not as detail differentiated in terms of stratigraphy and lithology as other parts of the PBS [10,11,12,13].
In our work, we present a seismostratigraphic-based approach for indicating the possible gas-bearing intervals within the heterogeneous complex. These sequences make standard well log interpretation difficult due to the substantial horizontal and vertical variations in terms of lithology and position in a sedimentary basin. Moreover, low-resolution seismic data cannot be used for the reliable interpretation of these sequences within the Miocene sediments [14]. The seismic data presented in this study, however, have a higher than average resolution, therefore enabling a detailed depositional interpretation. In comparison to the previously published works [7,8,15] the presented data were designed to increase the resolution of a seismic image significantly. Only with such detailed seismic data is it possible to proceed with depositional analysis, which, in terms of heterogeneous sequences, yields accurate results.
Chronostratigraphic interpretations of the high-resolution seismic data and Wheeler diagrams (chronostratigraphic horizons identification and flattening) enable the definition of geometrical relations within the analyzed interval. With such an approach, it was possible to define the elements of the depositional architecture, such as slope fans, basin floor fans and barriers, then identify the depositional sequences [16,17]. Such an analysis is crucial for understanding the depositional architecture of the wider area, as well as facial change definitions that might enable us to understand the paleogeography and paleoenvironment of the Miocene succession, which could lead to hydrocarbon prospecting. The number of conventional hydrocarbon reservoirs within the Miocene formations recently started to decease, and fewer conventional prospects have been discovered in the last few years, hence the need to change the approach and begin an interpretation focused on unconventional, heterolithic targets [18]. Such a situation enforces the need for the development of an alternative methodology suited to heterogeneous sequences.
In order to indicate the possible gas-saturated intervals, we incorporated the spectral decomposition technique, which uses the concept of attenuative properties in relation to frequency modulations of gas-bearing sequences [19]. Similarly, we incorporated a sweetness attribute (based on instantaneous trace analysis), which was proven to give reliable results in clastic deposits [20].
The final set of hydrocarbon prospects was verified by the identification of the depositional architecture elements and their position within the sedimentary basin. Simultaneously, attribute analysis was performed in order to cross-check the prospected target areas. The results imply that, for the heterogeneous sequence definition, the chronostratigraphic approach plays a key role and should be routinely applied to the Miocene sediments of the Carpathian Foredeep.

2. Geological Setting and Data Description

2.1. Geological Setting, the Survey Area

The study area is located in southern Poland within the central part of the Carpathian Foredeep area (Figure 1).
The oldest structural stage in the research area is represented by a series of Neoproterozoic anchimetamorphic rocks. The Ediacaran age of that complex is confirmed by the results of micropaleontological analyses carried out on samples from the boreholes [23,24]. The middle stage is composed of Meso-Paleozoic rocks of a considerable summary thickness up to 2000 m. In the southern part of the analyzed region, directly on the Ediacaran interval, the Lower Paleozoic deposits (Ordovician and Silurian) are situated, but their ranges are not well documented by deep boreholes and insignificant thicknesses (based on well log data and seismic interpretation between 20–100 m) [25,26]. Higher up in the profile lie the carbonate series of Devonian and Carboniferous sediments [27,28]. The Mesozoic interval is represented by carbonate and clastic Triassic sediments, and above them lie the carbonate complexes of the Jurassic and Cretaceous periods [29,30,31].
The youngest structural stage is formed by the Miocene formations (Badenian–Sarmatian), which were initially deposited in the Carpathian Foredeep basin. The sedimentary basin of the Carpathian Foredeep was a fragment of a large foreland graben basin stretching along the whole Carpathian arc. The complex of autochthonous Miocene strata in the research area can be divided into three main units: the Lower Badenian clastic sub-evaporite series, the Upper Badenian evaporite series and the Upper Badenian–Sarmatian clastic series [32,33].
The sub-evaporite sediments, distinguished as the Skawina Formation [34], are mainly represented by a set of claystone and mudstone, with thicknesses up to a few dozen meters. The genesis of the Badenian evaporite series is connected with the Badenian Salinity Crisis (BSC), which probably commenced due to a rather sudden drop in sea level due to global cooling [35,36,37,38]. The sulphate rocks (gypsum and anhydrite) are distinguished as the Krzyżanowice Formation [34]. The siliciclastic sediments, classified as the Machów Formation [32,33,34], are an essential part of the autochthonous Miocene profile in the analyzed region of the Carpathian Foredeep. This formation manifests significant lithofacial diversity. The Machów Formation is assigned to NN6/NN7 calcareous nano plankton zones, although some authors qualify the uppermost part of this formation up to NN9 [39]. A detailed seismostratigraphic analysis of the middle part of the Machów Formation is the main subject of this article.

2.2. Definition of Heterogeneous Sequence

Lis and Wysocka [40], on the basis of well data analysis, show that the Carpathian Foredeep region is defined by three main types of heterogeneous sequences:
  • dominated by mudstone;
  • with an approximately equal proportion of sandstone/siltstone and mudstone;
  • dominated by sandstone and siltstone.
The specific types of bedding are characteristic of the heterogeneous sequence, predominantly flaser, wavy and lenticular laminations that are created by the interchanging deposition form traction and suspension. During the traction-based sedimentation, sand and silt fractions dominate with small-scale cross-bedding or planar bedding. The suspension-based sedimentation favors the deposition of mudstone and claystone without lamination, as well as flaser, wavy or lenticular laminations.
The heterogeneous sequence is commonly found in the Miocene sediment profile in the central part of the Carpathian Foredeep. The sequences might be present in many depositional environments and at various depths, even though they are mostly associated with shallow and tidal regions [41,42,43,44,45]. In the study area, the heterogeneous sequences are typical for the studied part of the Miocene complex.
In the analyzed interval, we can define the existence of the heterolithic facies with all depositional zones, from shallow to deep water environments. The interpreted interval reveals diverse and dynamic facial changes observed at the chronostratigraphic horizons and defined in the Wheeler diagram. The geometrical analysis of these chronostratigraphic horizons enables uniformly defined diagnostic elements of the depositional architecture, such as shelf, shelf margin, slope and basin floor, associated to the sedimentation environments [46,47].

2.3. Data Description

The seismic data used for the project are 3D seismic data that were acquired in 2015 and processed in 2016 by Geofizyka Kraków SA, Kraków, Poland for the Polish Oil and Gas Company. The survey covered the area of about 150 km2 and was obtained by both dynamite and vibroseis methods. The research area covered approximately 150 km2; the analyzed seismic section is situated in the southern part of the seismic survey (Figure 1) in a part that was obtained by the vibroseis method. The data were processed with a relative amplitude preservation scheme, and the resulting volume is a migrated seismic section in the time domain with a sampling rate of 2 ms. The volume was calibrated to the geological information with the use of 15 wells with sonic logs that exist within the survey area. The presented seismic section is situated away from the well data.

3. Methods

3.1. Depositional Analysis

The method is based on seismic sequence stratigraphy and depositional sequence characterization. A depositional sequence is understood as a lithostratigraphic unit that was deposited during a specific depositional episode in a sedimentary basin. Each seismic horizon is associated with a certain position within a depositional sequence. The chronostratigraphic horizons can be linked with a specific element of the paleoenvironment within the sedimentary basin.
The seismic volume was subject to depositional sequence interpretation. It should be noted that the sequence stratigraphy analysis based on seismic volume is less detailed than the interpretation based on well and outcrop data.
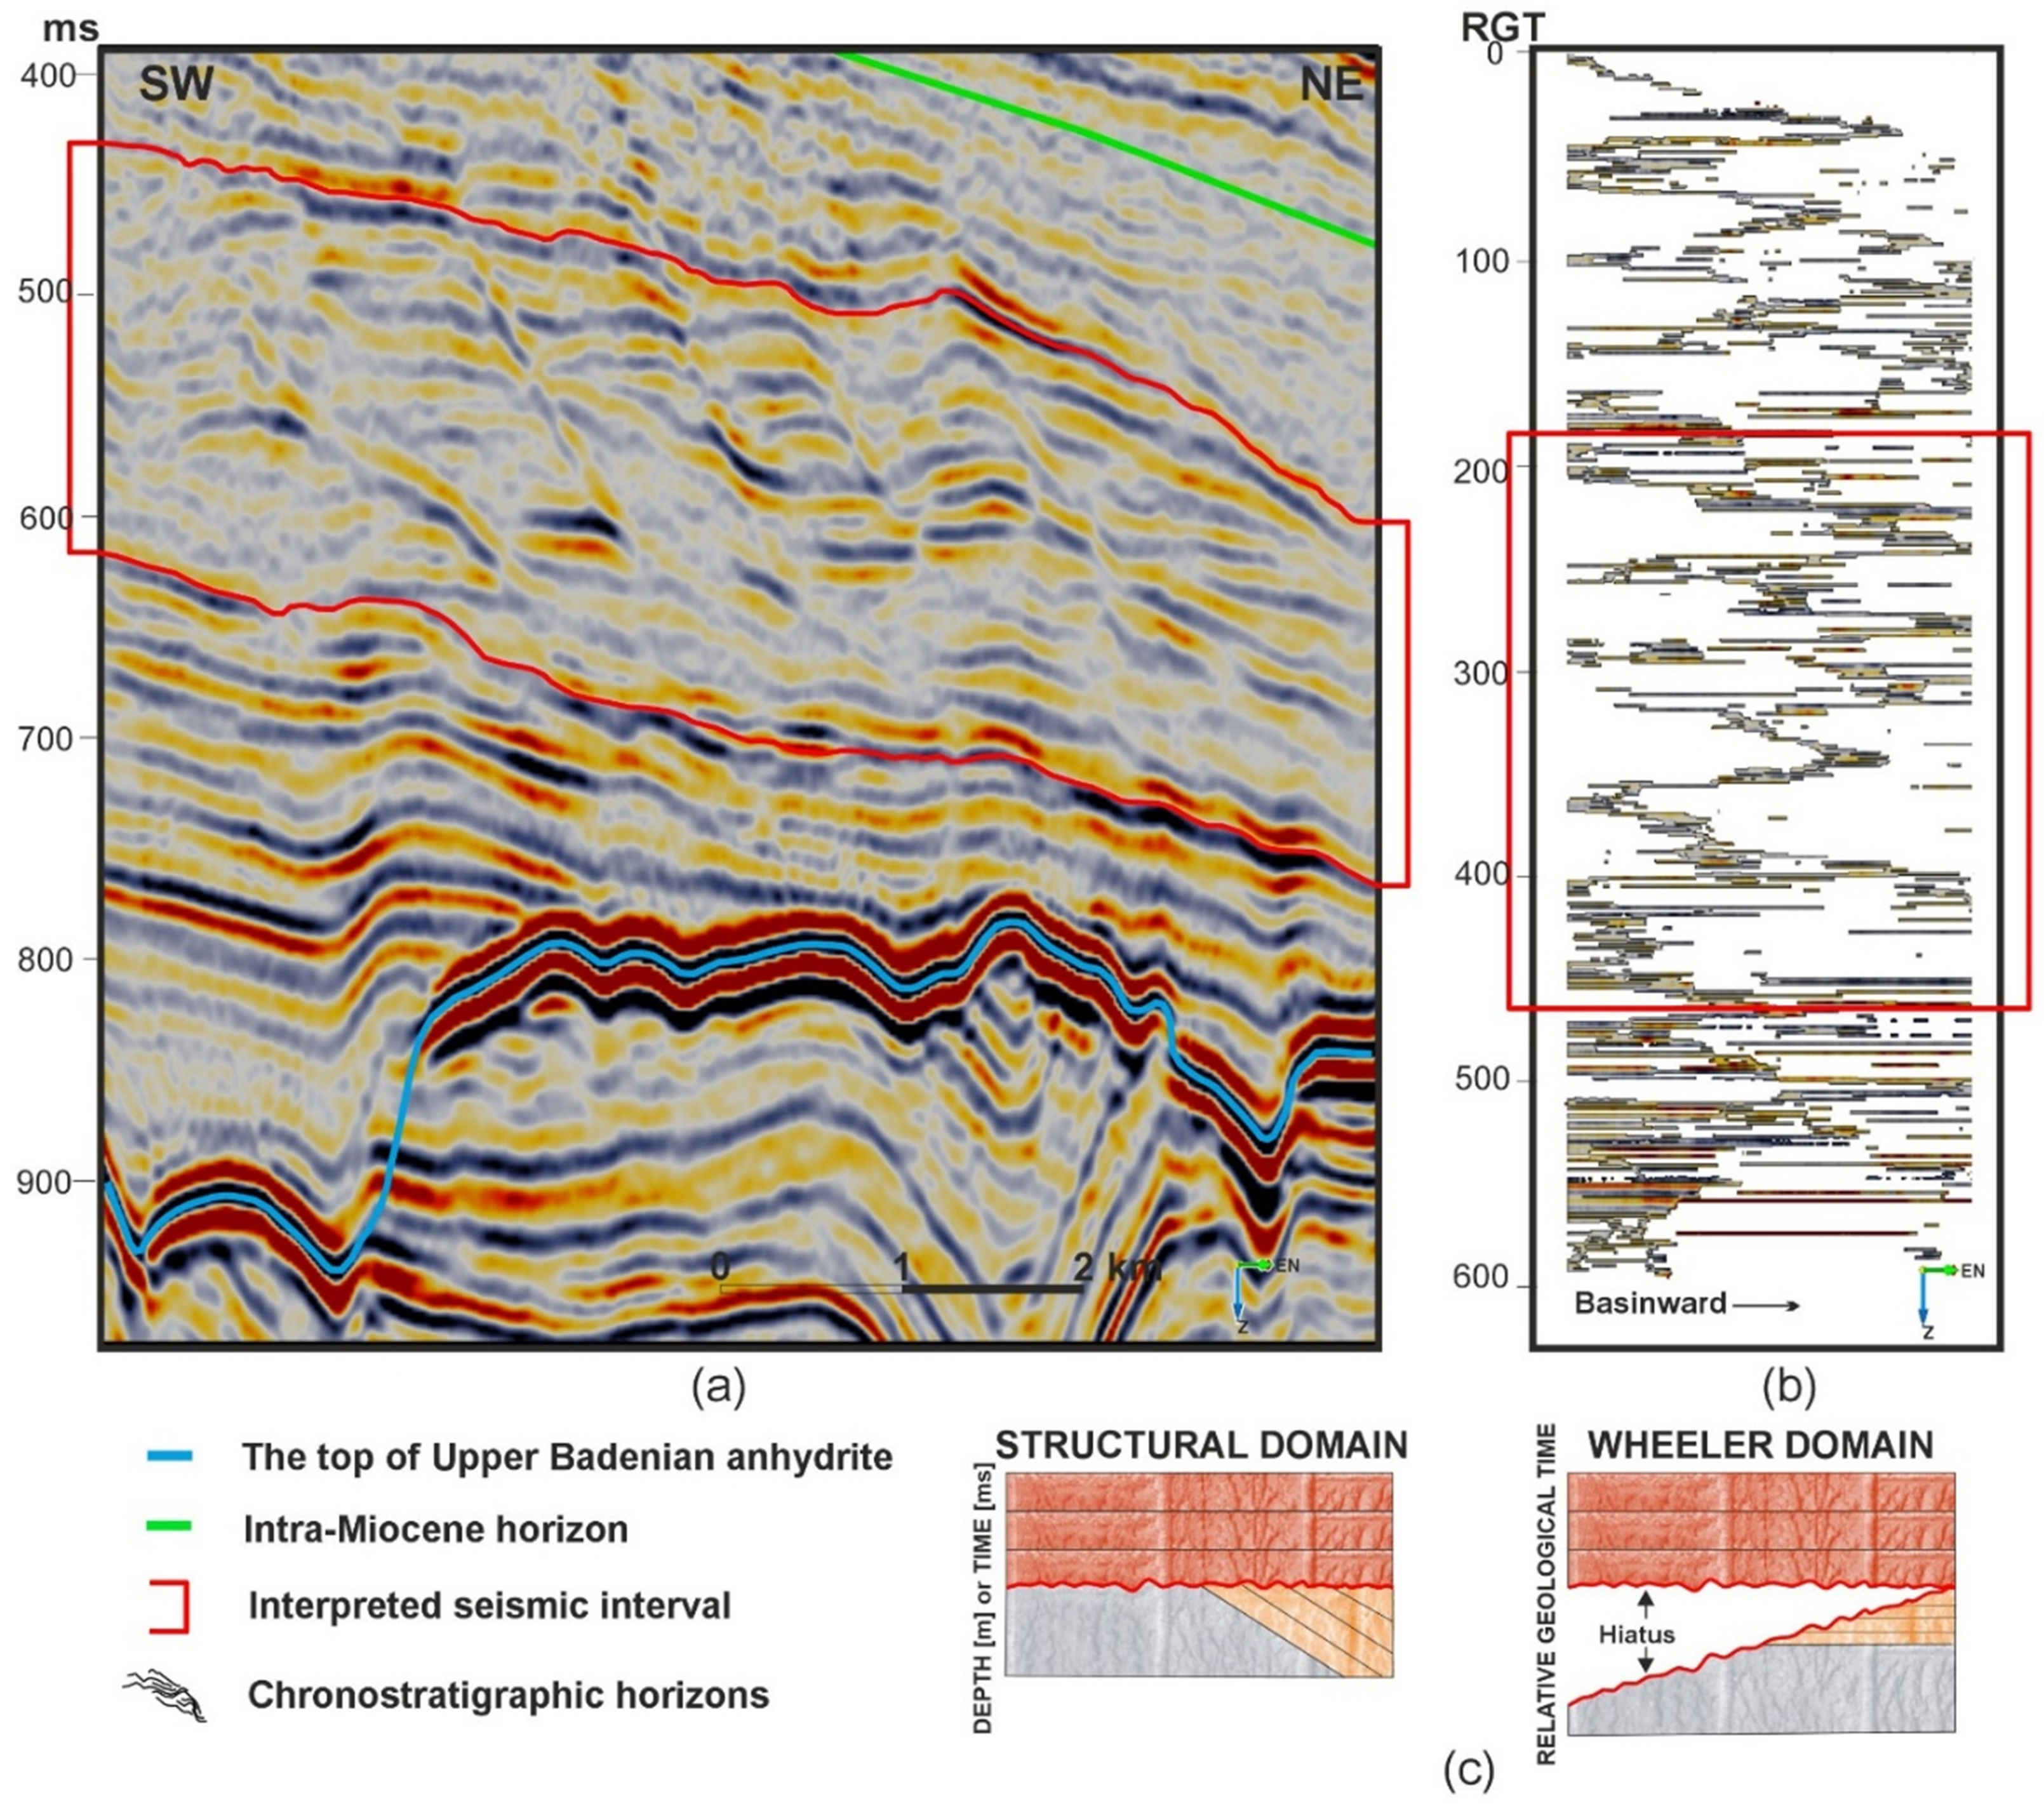
The first step of the analysis was to define a set of seismic sections to find those in directions parallel to the transportation of sediments to the basin. For the analysis, several sections were chosen. The area of analysis was limited to an exact time range by two seismic horizons. Afterwards, the apparent dip in seismic reflections was computed, and the resulting seismic volume enabled us to proceed to the next step, which was a chronostratigraphic horizon extraction. According to the information about the apparent dip and its direction, it was possible to apply a semi-automatic algorithm that tracks the seismic horizon in a given time range. The analysis was performed several times to adjust the parameters and take into account the resolution of the seismic data.
The defined chronostratigraphic horizons were transformed into the Wheeler domain by flattening [16,17] in order to analyze their relative temporal position. Wheeler diagrams were constructed for several seismic sections for the identification and visualization of the directions of deposition, hiatuses (a lack of deposition or erosion periods) and lateral continuities of depositional sequences.
With such an approach, it was possible to identify local changes in depositional directions that affected the exact shape and geometry of the chronostratigraphic horizons. The results are presented for the chosen cross-section.

3.2. Seismic Analysis

Seismic attributes were incorporated for possible gas-bearing zone interpretation. The subject of the analysis is a clastic sequence; hence, attributes that are suited to such environments give the best results. The sweetness attribute is calculated by dividing the instantaneous amplitude by the square root of the instantaneous frequency [48] and is sensitive to changes in amplitude and changes in frequency, both of which are considered direct hydrocarbon indicators (DHI) in clastic sequences [49]. The sweetness attribute might highlight thick, clean reservoirs and is sensitive to hydrocarbon content due to the incorporation of an instantaneous frequency [50]. This is a robust attribute, and its calculation is fast and efficient.
The second tool incorporated was spectral decomposition based on Fast Fourier Transform (FFT). The transform, based on the set of sine and cosine functions, decomposes the seismic trace to a time–frequency domain, in which specific frequency components hold the fraction of the amplitude of the original seismic trace. In this way, the filtering of a seismic signal is performed. The decomposition is performed in the time window; its length can be adjusted to the seismic resolution, but should not be too small in order for the decomposition to be stable. The interpretational value of the frequency volumes is that the reasoning can be limited to lower frequencies that tend to hold information about the hydrocarbon saturation.

4. Results

4.1. Depositional Environments Characterization

The first step of the interpretation was the identification of reflection discordances and lapouts such as onlaps, downlaps, offlaps, toplaps, and truncations [51]. The direction of the presented profile is SW–NE, which is parallel to the main deposition direction (see Figure 1).
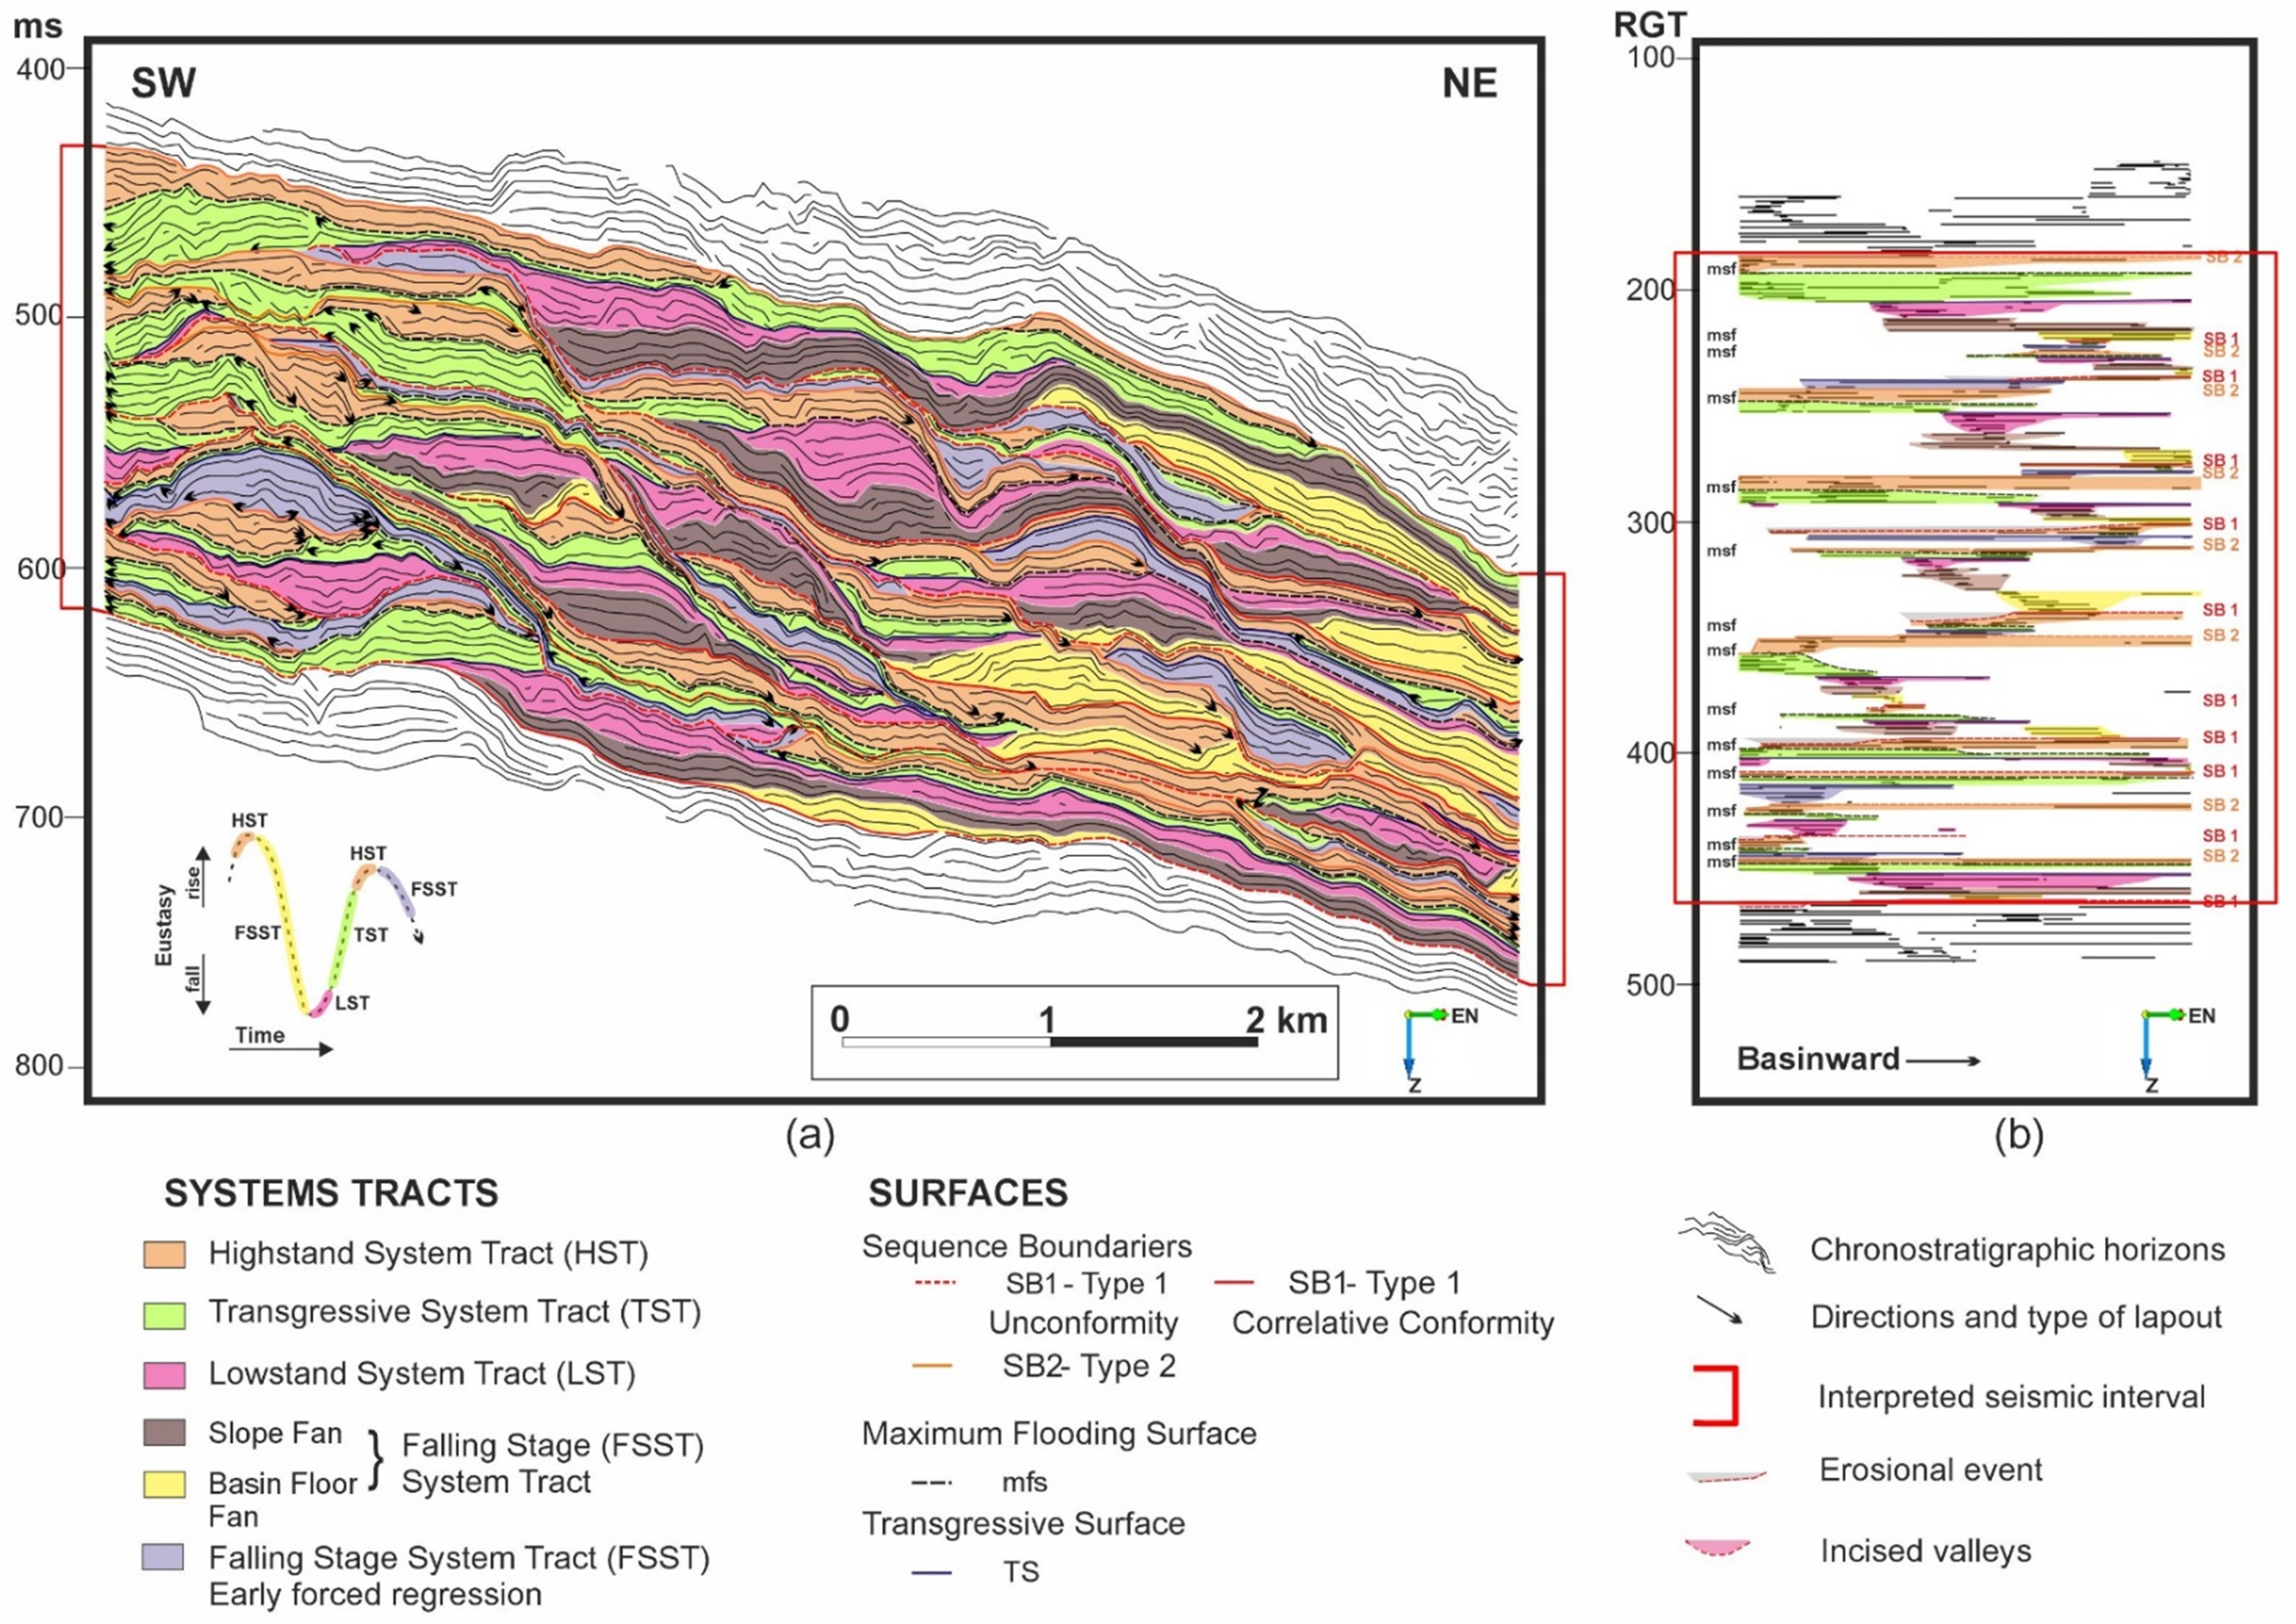
A detailed interpretation of the chronostratigraphic horizons and the Wheeler diagram are presented in Figure 2. The heterogeneous sequence exhibits high diversity and complexity in its chronostratigraphic horizons. The whole analyzed interval, which spans approximately 170 ms (about 300 m), consists of 17 depositional sequences and 18 sequence boundaries (SB).
Within the interpreted seismic interval (Figure 3, red frame), it was possible to indicate two kinds of depositional sequences connected to different types of sequence boundaries: the type I depositional sequence with sequence boundary no 1 (SB1) and the type II depositional sequence with sequence boundary no 2 (SB2).
Depositional sequences (type I) linked to SB1 are characterized by subaerial unconformities. These sequences change their character basinward into correlative conformities. The configuration of chronostratigraphic horizons of type I enables the identification of architectural elements that are typical of falling stage system tract (FSST) deposits that manifest hydrocarbon potential (incised valleys, slope fans and basin floor fans) [53]. These elements are also characterized by anomalous values of seismic attributes (see next subsection). The complete type I sequence consists of four depositional systems: falling stage system tract (FSST: Figure 3, brown—slope fan, yellow—basin floor fan), lowstand system tracks (LST: Figure 3, pink—lowstand wedge), transgressive system tracks (TST: Figure 3, green) and highstand system tract (HST: Figure 3, orange). In the bases of these sequences, it was possible to identify the borders of SB1, which are characterized by terrestrial and marine erosion [47].
Sequence boundaries (SB2) that are associated with type II deposition manifest the aggradational deposition of the falling stage system tract (FSST). At the shelf margin, aggradational deposition can be found, but the shelf area is not intensively eroded. Additionally, at the slope and basin floor, there is a lack of fans. The influence of tectonic activity is visible. At the base of the slope, and also basinwards (e.g., slope fans—sf; basin floor fans—bff), there exist areas where there is a lack of older deposits that cannot be linked to a gap in sedimentation, but can be linked to the erosional cut (underwater erosion). Three levels/areas with high erosional relief can be defined and are generated by a cohesive debris floor (mudflow). Such processes might be linked to early forced regression [51]. The type II depositional sequence consists of an early falling stage system tract (FSST, Figure 3, purple), which corresponds to forced regression in type I sequences (or, e.g., forced regression of the shelf margin wedge), TST (Figure 3, green) and HST (Figure 3, orange). The lower boundary of these sequences (SB2) is characterized by an erosional surface in a proximal shelf zone. Basinwards, this boundary becomes correlative conformity.
Higher up in the profile, after each type I depositional sequence, a change in the depositional axis can be observed. The character of the sequence elements is also modified (type II depositional sequence). The direction of the siliciclastic material transport is SW, but the sea level drop is not rapid, and the shelf area is not substantially eroded. These circumstances do not favor fan creation within the slope and basin floor. At the shelf margin, aggradational deposition of falling stage system tracts (FSSTs) takes place.
The facies that dominate the shelf (mainly in the SW part of the cross-section) are transgressive deposits (TST, Figure 3, green), their architecture indicates shelf edge progradation. A substantial part of these deposits are highstand deltas (Figure 3, orange) that are built of clinoforms and deposits corresponding to the shallow sea level.
The heterogeneous complex has retrogradational–progradational characteristics with significant thickness changes in specific depositional elements and a diverse architecture. This is a result of few components that changed over time: sediment flux directions, subsidence and eustatic sea level changes. The primary influence on the deposition must have been related to relative sea level changes linked to subsidence rate fluctuations. The high distribution rate in the sedimentary basin seems to limit fluvial erosion and move the shelf margin forward into the area of higher subsidence (depocenter).
Some of the depositional sequences are characterized by the lack of a link between the shelf and deep basin sediments (see Figure 4a,b, around the second “TST” from the left). This is the result of an erosional cut in the older deposits caused by younger deposits. This suggests that the rebuilding of the sedimentary basin architecture took place, which is most likely linked to tectonic processes. We observe a shift in the basin axis, which is crucial information from a prospecting point of view.

4.2. Seismic Signatures for Unconventional Targets Prospecting

The interpretation of possible prospecting targets took into account the results of the sweetness attribute and spectral decomposition. These two attributes give similar results, but their images are slightly different. The sweetness attribute (Figure 4c) reveals more details that are associated with the definition of the attribute and instantaneous character. The value of the attribute is assigned to each sample at every time point. The amplitude image of the frequency slice (Figure 4d) is more blurred than for the sweetness attribute. This is a result of the averaging effect of the FFT computed within the specific time window. Nonetheless, for the presented low frequency volume (20 Hz), it is possible to indicate the anomalous zones. These zones are affiliated with the attenuation of high frequencies, which results in a shift in the dominant frequencies in the lower part of a spectrum. The presented image indicates such regions (Figure 4d).
The zones of the highest hydrocarbon potential are linked to the FSST, especially the slope fans and basin floor fans (Figure 4a, yellow; Figure 4c,d, bright colors—high amplitudes). Elements of the transgressive sequence are also prominent (Figure 4a, brown). The transgressive sequence is built of the fine clastic material and can play the role of a caprock (see Figure 4, “TST”—green). There also exist anomalies suggesting hydrocarbon saturation in a transgressive sequence at the shelf, but they have limited volume (Figure 4, “TST”—green, Figure 4c,d, bright colors—high amplitudes). The high-resolution seismic image enabled us to indicate the potential hydrocarbon saturation in the incised valley (see Figure 4, “IVF”).
From a hydrocarbon prospecting point of view, transgressive deposits might be prominent exploration targets (TST, Figure 4a, green, Figure 4b). The main prism of these sediments is deposited in the SW part of the section, near the shelf. The interpretation of the seismic reflection pattern in the zone of maximal thickness indicates development towards the shelf. However, TST deposits manifest a retrogradational character and hence cannot be the most prominent from a hydrocarbon prospecting point of view. The most promising areas for hydrocarbon prospecting are as follows: (1) transgressive sequences that fill incised valleys; (2) onshore barriers in the central part of a profile; (3) transgressive deposits covering slope fans.

5. Discussion

Due to the high resolution of the data, it was possible to indicate incised valleys, which are rarely seen on seismic sections. Their existence proves that we provided the correct definition of the sequence boundaries. Incised valleys have very high hydrocarbon potential (both for conventional and unconventional plays), here verified by the results of the sweetness attribute and spectral decomposition. However, despite being small in size in the presented case, their existence shows the applicability of the proposed methodology. Moreover, erosional truncations that are associated with the sub-aerial erosion and diverse relief of the onshore part of the highstand delta (HST) could have been indicated by chronostratigraphic interpretation.
It should be noted that there is an ongoing discussion regarding the methodology of sequence boundary interpretation and the specialistic nomenclature [46,51,54,55]. Nevertheless, in the presented study, we decided to divide sequence boundaries into two types, type I and type II [56], even though type II discontinuities were recently considered to be an integral part of the failing stage system tract (FSST; a shift in the shoreline basinward during one sequence with a fall in the relative sea level).
The high-resolution seismic image enabled the identification of differences in the failing stage system tracts between type I and type II depositional sequences. The interpretation of a Wheeler diagram made it possible to define and differentiate between FSST type II from lower-lying highstand deposits (HST).
The heterogeneous sequence under analysis exhibits significant thickness changes and the rebuilding of architecture. This is a result of continuous fluctuations in sediment flux, the rate of subsidence and eustatic sea level. Depositional architecture is also controlled by intensive tectonics; its influence is prominent in the non-according contacts between chronostratigraphic horizons and in the erosional cutting of older deposits by younger sediments [47,55]. Depositional sequences are characterized by a geometry that ensures that the lack of a link between the shelf and basin deposits can be proposed. After each erosional episode, signatures that prove the rebuilding of the sedimentary basin can be defined; a shift in the basin axis toward the NE direction can also be indicated. The increase in the transportation rate brings fluvial erosion to a halt and shifts the shelf margin towards a higher subsidence area. This is proved by the increasing thicknesses of the sediments and the development of basin elements (slope fans, basin floor fans). After stabilization, the sediment flux rate is lower than the subsidence rate and the deposits exhibit retrogradational character until the next tectonic episode.

6. Conclusions

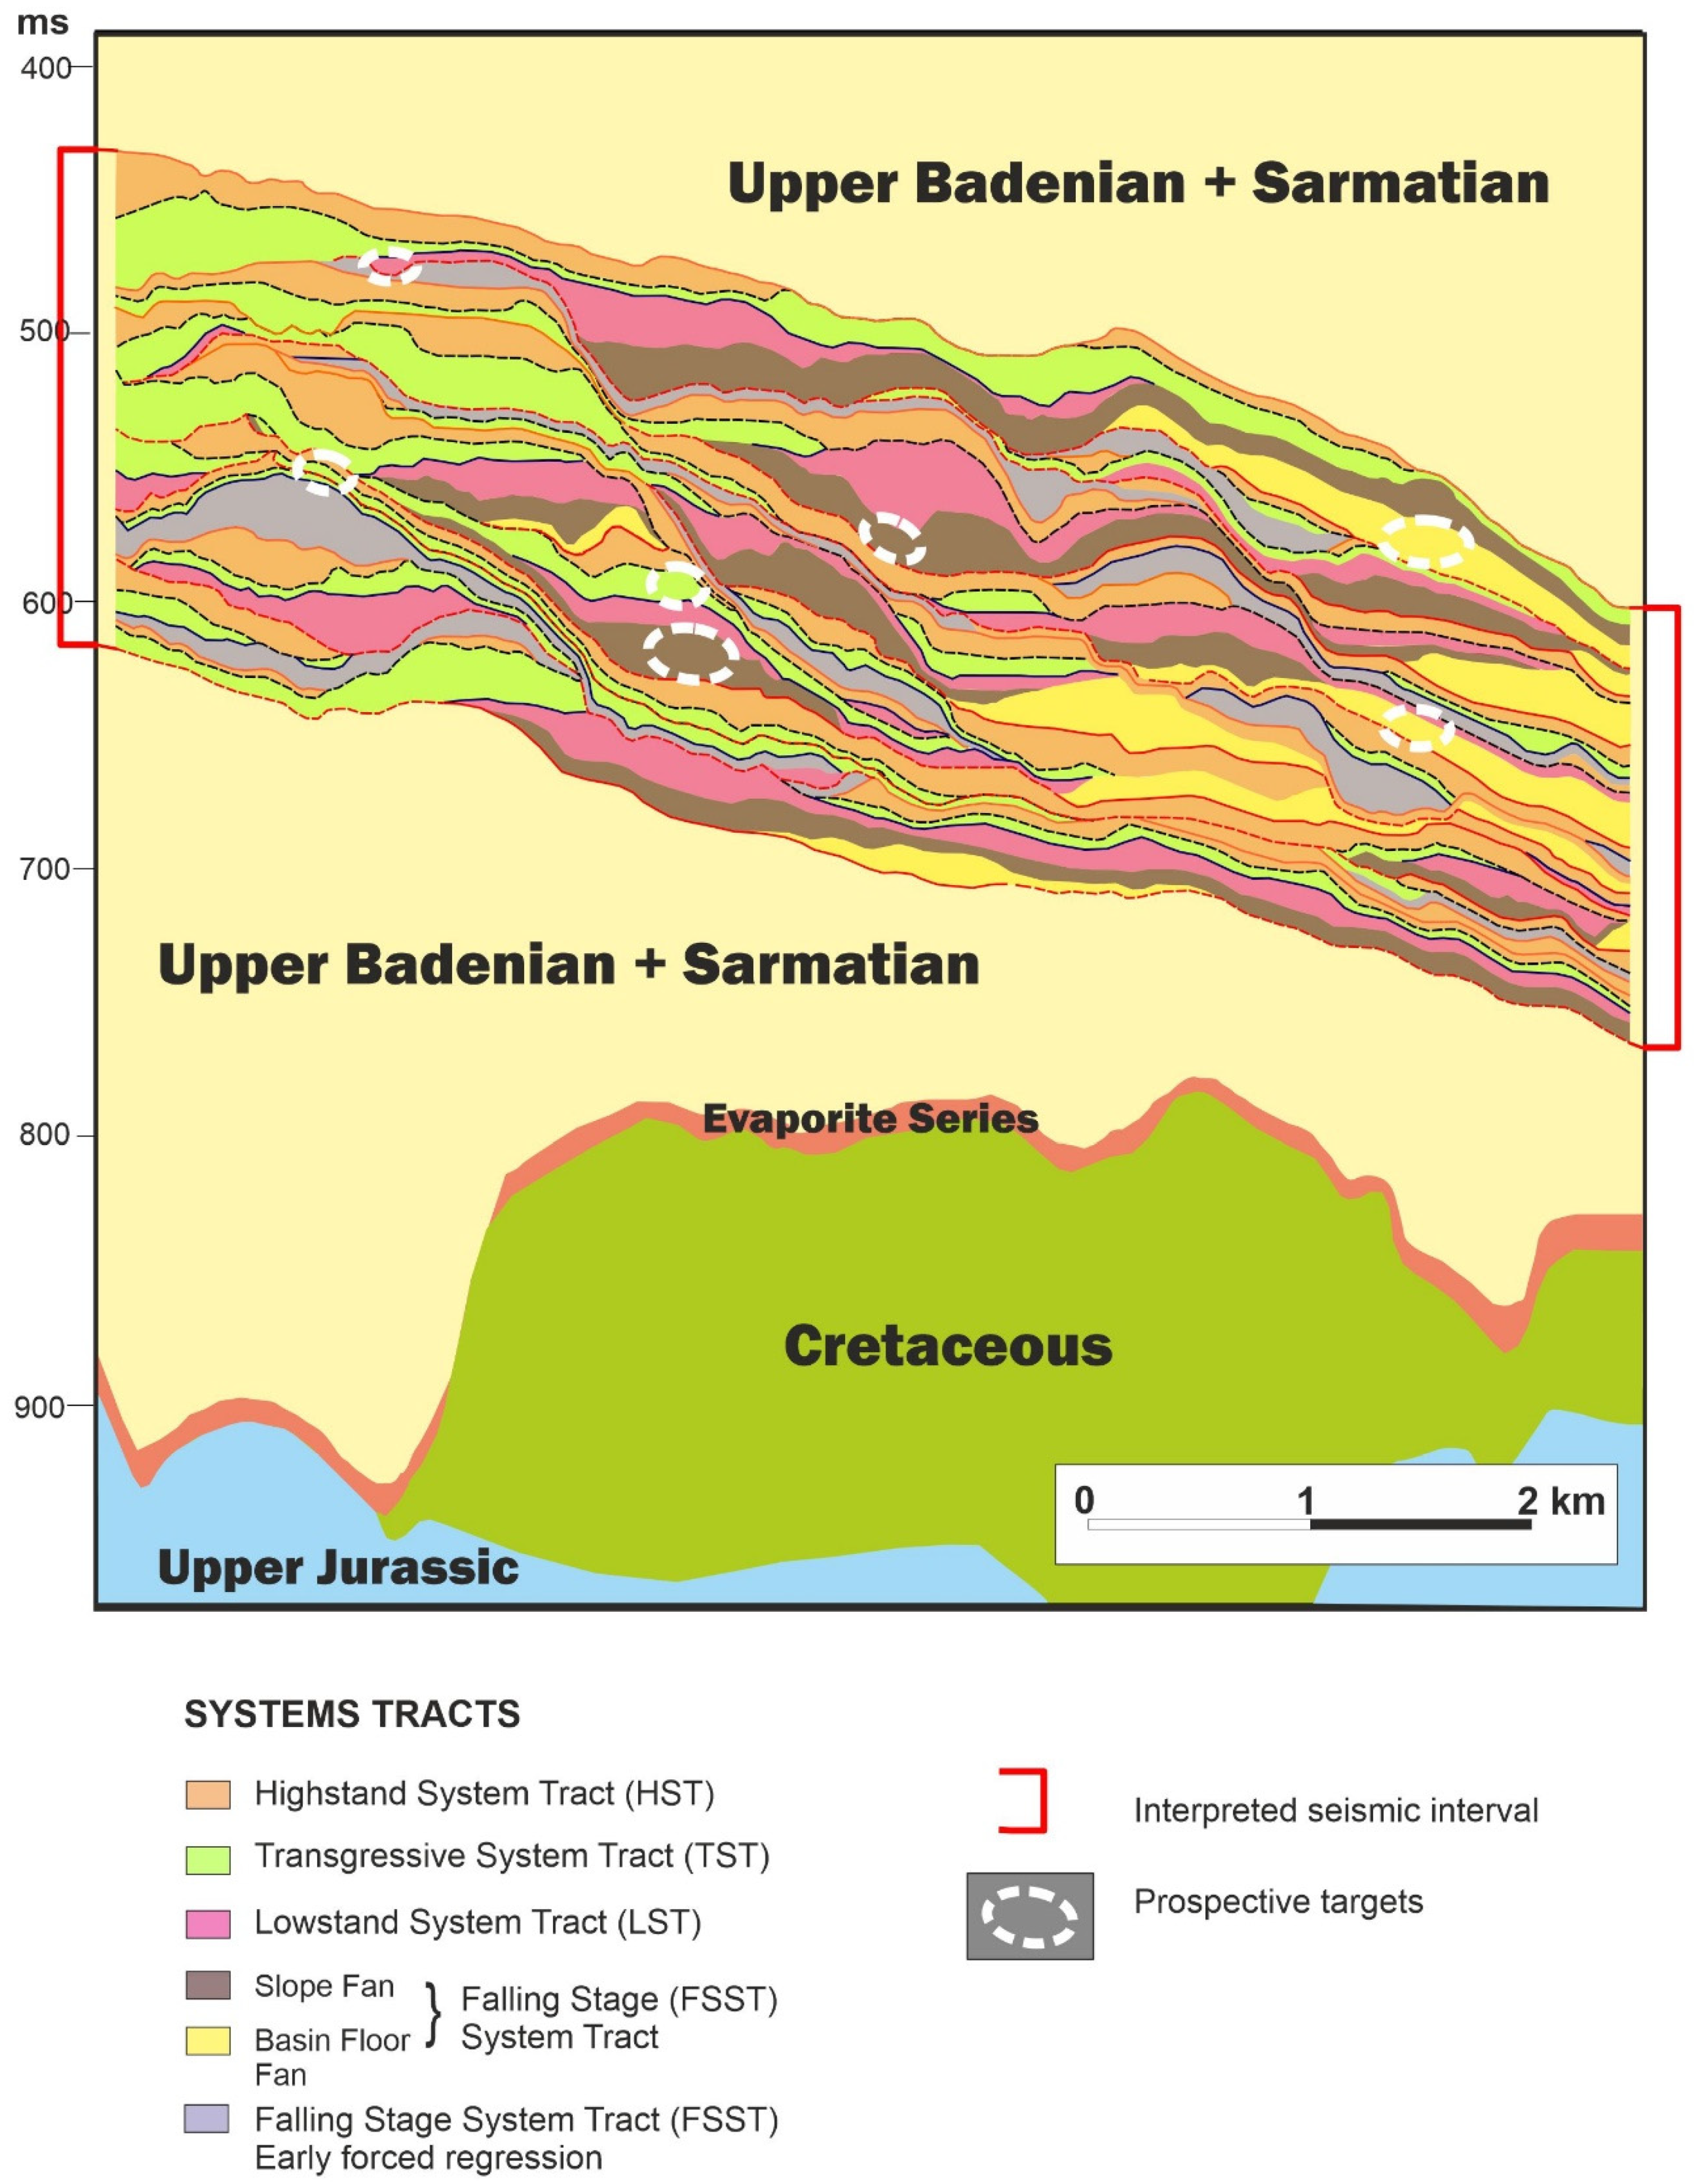
With the application of the seismic sequence stratigraphy method, it was possible to interpret system tracts and depositional sequences. This helped us to understand the depositional history and recovery of the depositional architecture of the sedimentary basin in the research area. Afterwards, seismic attributes were applied in order to verify the reservoir properties within the analyzed interval. The integration of these results enabled the identification of the prospective targets. Figure 5 summarizes the main findings of the analysis.
It should be stipulated that, otherwise all of the indicated prospective targets are both source and reservoir rocks, they should be considered as unconventional reservoirs. Moreover, there was no hydrocarbon migration to the Machów Formation from outside. Such an approach gives great insights into the interpretation of unconventional reservoirs.
Seismic sequence stratigraphy at the level of detail presented above is possible for high-resolution, preferably 3D, seismic surveys. A sufficient resolution, in this case, was acquired by the detailed design of the acquisition parameters, the importance of the survey design should be strongly advocated at this point. The data that were shown are unprecedented in the Carpathian Foredeep area, manifesting high vertical and horizontal resolutions. The results give weight to the argument that only high-resolution seismic data for heterogeneous sequence interpretation might reveal details that help to understand the depositional history of the Miocene formations in the Carpathian Foredeep sedimentary basin.
The detailed seismic image presented enabled accurate attribute interpretation, which was guided by sedimentary analysis. The attribute values are clearly changing, and the shapes of the presented anomalies are in agreement with the depositional interpretation. This proves that the choice of attributes and their parametrization suited the given problem.
For heterogeneous sequence interpretation, sedimentary analysis is a necessary step that can not only identify possible prospecting targets, but also define their geometry and tectonic involvement. The tectonic setting is crucial for a reliable estimation of the hydrocarbon reserves and for well planning. Such an approach is not routinely applied to the Miocene deposits of the Carpathian Foredeep. Instead, these prospects are mostly treated as convenient targets, for which structural positioning is almost exclusively applied. Based on the research results obtained, we propose a new methodological attitude utilizing both seismic sequence stratigraphy and attribute analysis, with a particular emphasis on frequency analysis.

Author Contributions

Conceptualization, A.K. and A.U.; methodology, A.K.; software, A.K.; validation, A.Ł.-B., A.U. and A.K.; formal analysis, A.U.; investigation, A.Ł.-B., A.K.; writing—original draft preparation, A.K., A.U., A.Ł.-B.; writing—review and editing, A.K.; visualization, A.Ł.-B. All authors have read and agreed to the published version of the manuscript.

Funding

This research received no external funding. The work was part of the ongoing investigation being carried out by the Department of Geophysics, University of Science and Technology (11.11.140.645). This paper was written on the basis of the statutory work entitled “Seismostratigraphic analyses of the Upper Jurassic carbonate complex in the central part of the Carpathian Foreland”. The work of the Oil and Gas Institute–National Research Institute was commissioned by the Ministry of Science and Higher Education (order number: 37/SR/2020; archive number: DK-4100-25/2020).

Acknowledgments

We would like to acknowledge the Polish Oil and Gas Company for sharing their data for research purposes and for their permission to publish the results. We extend our gratitude to DGB EarthSciences for granting the University of Science and Technology AGH’s OpendTect application for the HorizonCube plugin that was used for the depositional analysis. The authors would like to thank two anonymous reviewers for their suggestions and recommendations, which helped to improve the manuscript.

Conflicts of Interest

The authors declare no conflict of interest.

References

  1. Kotarba, M.J.; Wilczek, T.; Kosakowski, P.; Kowalski, A.; Wiȩcław, D. A study of organic matter and habitat of gaseous hydrocarbons in the Miocene strata of the Polish part of the Carpathian Foredeep. Prz. Geol. 1998, 46, 742–750. [Google Scholar]
  2. Kotarba, M.J. Origin of natural gases in the autochthonous miocene strata of the Polish Carpathian Foredeep. Ann. Soc. Geol. Pol. 2011, 81, 409–424. [Google Scholar]
  3. Matyasik, I.; Myśliwiec, M.; Leśniak, G.; Such, P. Relationship between Hydrocarbon Generation and Reservoir Development in the Carpathian Foreland (Poland). In Proceedings of the Thrust Belts and Foreland Basins; Springer: Berlin/Heidelberg, Germany, 2007; pp. 413–427. [Google Scholar]
  4. Kotarba, M.J.; Peryt, T.M.; Koltun, Y.V. Microbial Gassystem and Prospectives of Hydrocarbon Exploration in Miocene Strata of the Polish and Ukrainian Carpathian Foredeep. Ann. Soc. Geol. Pol. 2011, 81, 523–548. [Google Scholar]
  5. Thomas, R.G.; Smith, D.G.; Wood, J.M.; Visser, J.; Calverley-Range, E.A.; Koster, E.H. Inclined heterolithic stratification—Terminology, description, interpretation and significance. Sediment. Geol. 1987, 53, 123–179. [Google Scholar] [CrossRef]
  6. Lettley, C.D.; Pemberton, S.G. Speciation of McMurray Formation Inclined Heterolithic Strata: Varying Depositional Character Along a Riverine Estuary System. In Proceedings of the CSPG/CSEG GeoConvention, Calgary, AB, Canada, 31 May–4 June 2004; CSPG/CSEG Datapages: Calgary, AB, Canada, 2015; Volume 51067. [Google Scholar]
  7. Myśliwiec, M. Mioceńskie skały zbiornikowe zapadliska przedkarpackiego. Prz. Geol. 2004, 52, 581–592. [Google Scholar]
  8. Myśliwiec, M.; Plezia, B.; Świȩtnicka, G. Nowe odkrycia złȯz gazu ziemnego w osadach miocenu północno-wschodniej czȩści zapadliska przedkarpackiego na podstawie interpretacji bezpośredniego wpływu nasycenia wȩglowodorami na zapis sejsmiczny. Prz. Geol. 2004, 52, 395–402. [Google Scholar]
  9. Liszka, B.; Madej, K.; Paszkowski, M.; Porębski, S.J.; Ratusznik, Z.; Słyś, M.; Soliński, B.; Warchoł, M. Rozpoznanie heterolitowych obiektów złożowych w miocenie zapadliska przedkarpackiego pod kątem eksploatacji gazu otworami poziomymi. Pr. Inst. Naft. Gazu 2009, 158, 37–68. [Google Scholar]
  10. Nagymarosy, P.; Muller, P. Some Aspects of Neogene Biostratigraphic in the Pannonian Basin. In The Pannonian Basin: A Study in Basin Evolution Basin Evolution; American Association of Petroleum Geologists: Tulsa, OK, USA, 1988; pp. 69–77. [Google Scholar]
  11. Malvić, T. Review of Miocene shallow marine and lacustrine depositional environments in Northern Croatia. Geol. Q. 2012, 56, 493–504. [Google Scholar] [CrossRef] [Green Version]
  12. Pavelić, D.; Kovačić, M. Sedimentology and stratigraphy of the Neogene rift-type North Croatian Basin (Pannonian Basin System, Croatia): A review. Mar. Pet. Geol. 2018, 91, 455–469. [Google Scholar] [CrossRef]
  13. Sacchi, M.; Horváth, F. Towards a new time scale for the Upper Miocene continental series of the Pannonian basin (Central Paratethys). EGU Stephan Mueller Spec. Publ. Ser. 2002, 79–94. [Google Scholar] [CrossRef]
  14. Pietsch, K.; Porębski, S.J. The use of seismostratigraphy for exploration of Miocene gas-bearing reservoir facies in the NE part of the Carpathian Foreland Basin. Geologia 2010, 36, 173–186. [Google Scholar]
  15. Kwietniak, A.; Cichostępski, K.; Kasperska, M. Spectral Decomposition Using the CEEMD Method: A Case Study from the Carpathian Foredeep. Acta Geophys. 2016, 64, 1525–1541. [Google Scholar] [CrossRef] [Green Version]
  16. Łaba-Biel, A.; Smółka-Gnutek, P. Horizon cube i diagram Wheelera—Przykłady zastosowania w interpretacji obrazu sejsicznego. Pr. Nauk. INiG-PIB 2016, 209, 533–537. [Google Scholar]
  17. Łaba-Biel, A.; Smółka-Gnutek, P. Detaliczna, geologiczna analiza obrazu sejsmicznego w oparciu o interpretację diagramu Wheelera i Horizon Cube. Pr. Nauk. INiG-PIB 2016, 209, 223–229. [Google Scholar]
  18. Cichostępski, K.; Kwietniak, A.; Dec, J. Verification of bright spots in the presence of thin beds by AVO and spectral analysis in Miocene sediments of Carpathian Foredeep. Acta Geophys. 2019, 67, 1731–1745. [Google Scholar] [CrossRef] [Green Version]
  19. Oyem, A.; Castagna, J. Sorting and visualization of Spectral-decomposition data. Lead. Edge 2015, 34, 42–47. [Google Scholar] [CrossRef]
  20. Hart, B.S. Channel detection in 3-D seismic data sing sweetness. Am. Assoc. Pet. Geol. Bull. 2008, 92, 733–742. [Google Scholar] [CrossRef]
  21. Picha, F.J. Exploring for hydrocarbons under thrust belts—A challenging new frontier in the Carpathians and elsewhere. Am. Assoc. Pet. Geol. Bull. 1996, 80, 1547–1564. [Google Scholar]
  22. Porębski, S.J.; Warchoł, M. Hyperpycnal flows and deltaic clinoforms—Implications for sedimentological interpretations of late Middle Miocene fill in the Carpathian Foredeep Basin. Przegląd Geol. 2006, 54, 421–429. [Google Scholar]
  23. Moryc, W.; Jachowicz, M. Utwory prekambryjskie w rejonie Bochnia-Tarnów-Debica. Prz. Geol. 2000, 48, 601–606. [Google Scholar]
  24. Jachowicz-Zdanowska, M. Organic microfossil as sem blages from the late Ediacaran rocks of the Małopolska Block, southeast ern Poland. Geol. Q. 2011, 55, 85–94. [Google Scholar]
  25. Moryc, W.; Nehring-Lefeld, M. Ordovician between Pilzno and Busko in the Carpathian Foreland (Southern Poland). Geol. Q. 1997, 41, 139–150. [Google Scholar]
  26. Buła, Z.; Habryn, R. Precambrian and Palaeozoic basement of the Carpathian Foredeep and the adjacent outer Carpathians (SE Poland and Western Ukraine). Ann. Soc. Geol. Pol. 2011, 81, 221–239. [Google Scholar]
  27. Zając, R. Stratygrafia i rozwój facjalny dewonu i dolnego karbonu południowej części podłoza zapadliska przedkarpackiego. Kwart. Geol. 1984, 28, 291–316. [Google Scholar]
  28. Moryc, W. Budowa geologiczna podłoża miocenu w rejonie Kraków—Pilzno. Część 1. Prekambr i paleozoik (bez permu). Nafta-Gaz 2006, 62, 197–216. [Google Scholar]
  29. Urbaniec, A.; Bobrek, L.; Świetlik, B. Litostratygrafia i charakterystyka mikropaleontologiczna urworów krédy dolnej w środkowej czȩsci przedgórza Karpat. Prz. Geol. 2010, 58, 1161–1175. [Google Scholar]
  30. Gutowski, J.; Urbaniec, A.; Złonkiewicz, Z.; Bobrek, L.; Świetlik, B.; Gliniak, P. Upper Jurassic and Lower Cretaceous of the middle polish Carpathian foreland. Biul. Państwowego Inst. Geol. 2007, 426, 1–26. [Google Scholar]
  31. Urbaniec, A.; Bartoń, R.; Bajewski, Ł.; Wilk, A. Wyniki interpretacji strukturalnej utworów triasu i paleozoiku przedgórza Karpat opartej na nowych danych sejsmicznych. Nafta-Gaz 2020, 76, 559–568. [Google Scholar] [CrossRef]
  32. Jasionowski, M. Zarys litostratygrafii osadów mioceńskich wschodniej częsći zapadliska przedkarpackiego. Biul. Państwowego Inst. Geol. 1997, 375, 43–59. [Google Scholar]
  33. Urbaniec, A.; Stadtmüller, M.; Bartoń, R. Possibility of a more detailed seismic interpretation within the Miocene formations of the Carpathian Foredeep based on the well logs interpretation. Nafta-Gaz 2019, 75, 527–544. [Google Scholar] [CrossRef]
  34. Alexandrowicz, S.W.; Garlicki, A.; Rutkowski, J. Podstawowe jednostki litostratygraficzne miocenu zapadliska przedkarpackiego. Kwart. Geol. 1982, 26, 470–471. [Google Scholar]
  35. Báldi, K. Paleoceanography and climate of the Badenian (Middle Miocene, 16.4-13.0 Ma) in the Central Paratethys based on foraminifera and stable isotope (δ18O and δ13C) evidence. Int. J. Earth Sci. 2006, 95, 119–142. [Google Scholar] [CrossRef]
  36. De Leeuw, A.; Bukowski, K.; Krijgsman, W.; Kuiper, K.F. Age of the Badenian salinity crisis; Impact of Miocene climate variability on the circum-mediterranean region. Geology 2010, 38, 715–718. [Google Scholar] [CrossRef]
  37. Karami, M.P.; de Leeuw, A.; Krijgsman, W.; Meijer, P.T.; Wortel, M.J.R. The role of gateways in the evolution of temperature and salinity of semi-enclosed basins: An oceanic box model for the Miocene Mediterranean Sea and Paratethys. Glob. Planet. Change 2011, 79, 73–88. [Google Scholar] [CrossRef]
  38. Bukowski, K. Rozprawy i Monografie; Wydawnictwa AGH: Kraków, Poland, 2011; pp. 1–184. [Google Scholar]
  39. Gaździcka, E. Nannoplankton stratigraphy of the Miocene deposits in Tarnobrzeg area (northeastern part of the Carpathian Foredeep). Kwart. Geol. 1994, 38, 553–569. [Google Scholar]
  40. Lis, P.; Wysocka, A. Middle Miocene deposits in Carpathian foredeep: Facies analysis and implications for hydrocarbon reservoir prospecting. Ann. Soc. Geol. Pol. 2012, 82, 239–253. [Google Scholar]
  41. Reineck, H.; Wunderlich, F. Classification and Origin of Flaser and Lenticular Bedding. Sedimentology 1968, 11, 99–104. [Google Scholar] [CrossRef]
  42. Terwindt, J.H.J.; Breusers, H.N.C. Experiments on the Origin of Flaser, Lenticular and Sand-Clay Alternating Bedding. Sedimentology 1972, 19, 85–98. [Google Scholar] [CrossRef]
  43. Martin, A.J. Flaser and wavy bedding in ephemeral streams: A modern and an ancient example. Sediment. Geol. 2000, 136, 1–5. [Google Scholar] [CrossRef]
  44. Jackson, M.D.; Yoshida, S.; Muggeridge, A.H.; Johnson, H.D. Three-dimensional reservoir characterization and flow simulation of heterolithic tidal sandstones. Am. Assoc. Pet. Geol. Bull. 2005, 89, 507–528. [Google Scholar] [CrossRef]
  45. Donselaar, C.R.; Geel, M.E. Facies architecture of heterolithic tidal deposits: The Holocene Holland Tidal Basin. Neth. J. Geosci. 2007, 86, 389–402. [Google Scholar] [CrossRef] [Green Version]
  46. Catuneanu, O.; Galloway, W.E.; Kendall, C.G.S.C.; Miall, A.D.; Posamentier, H.W.; Strasser, A.; Tucker, M.E. Sequence Stratigraphy: Methodology and Nomenclature. Newsl. Stratigr. 2011, 173–245. [Google Scholar] [CrossRef] [Green Version]
  47. Krzywiec, P. Startygrafia sekwencji. Przegląd Geol. 1993, 41, 681–687. [Google Scholar]
  48. Taner, M.T.; Koehler, F.; Sheriff, R.E. Complex Seismic Trace Analysis. Geophysics 1979, 44, 1041–1063. [Google Scholar] [CrossRef]
  49. Semb, P.H. Possible seismic hydrocarbon indicators in offshore Cyprus and Lebanon. GeoArabia 2009, 14, 49–66. [Google Scholar]
  50. Zelenika, K.N.; Mavar, K.N.; Brnada, S. Comparison of the sweetness seismic attribute and porosity–thickness maps, sava depression, Croatia. Geosciences 2018, 8, 426. [Google Scholar] [CrossRef] [Green Version]
  51. Catuneanu, O. Principles of Sequence Similarity; Elsevier: Amsterdam, The Netherlands, 2006. [Google Scholar]
  52. Qayyum, F.; Catuneanu, O.; de Groot, P. Historical developments in Wheeler diagrams and future directions. Basin Res. 2015, 27, 336–350. [Google Scholar] [CrossRef]
  53. Morse, D.G. Siliciclastic resevoir rocks; the petroleum system—from source to trap. AAPG Mem. 1994, 60, 121–139. [Google Scholar]
  54. Embry, A.F. Sequence boundaries and sequence hierarchies: Problems and proposals. Stratigr. Northwest Eur. Margin Spec. Publ. 1995, 5, 1–11. [Google Scholar]
  55. Donaldson, W.S.; Plint, A.G.; Longstaffe, F.J. Tectonic and eustatic control on deposition and preservation of Upper Cretaceous ooidal ironstone and associated facies: Peace River Arch area, NW Alberta, Canada. Sedimentology 1999, 46, 1159–1182. [Google Scholar] [CrossRef]
  56. Porȩbski, S.J. Podstawy stratygrafii sekwencji w sukcesjach klastycznych. Prz. Geol. 1996, 44, 995–1006. [Google Scholar]
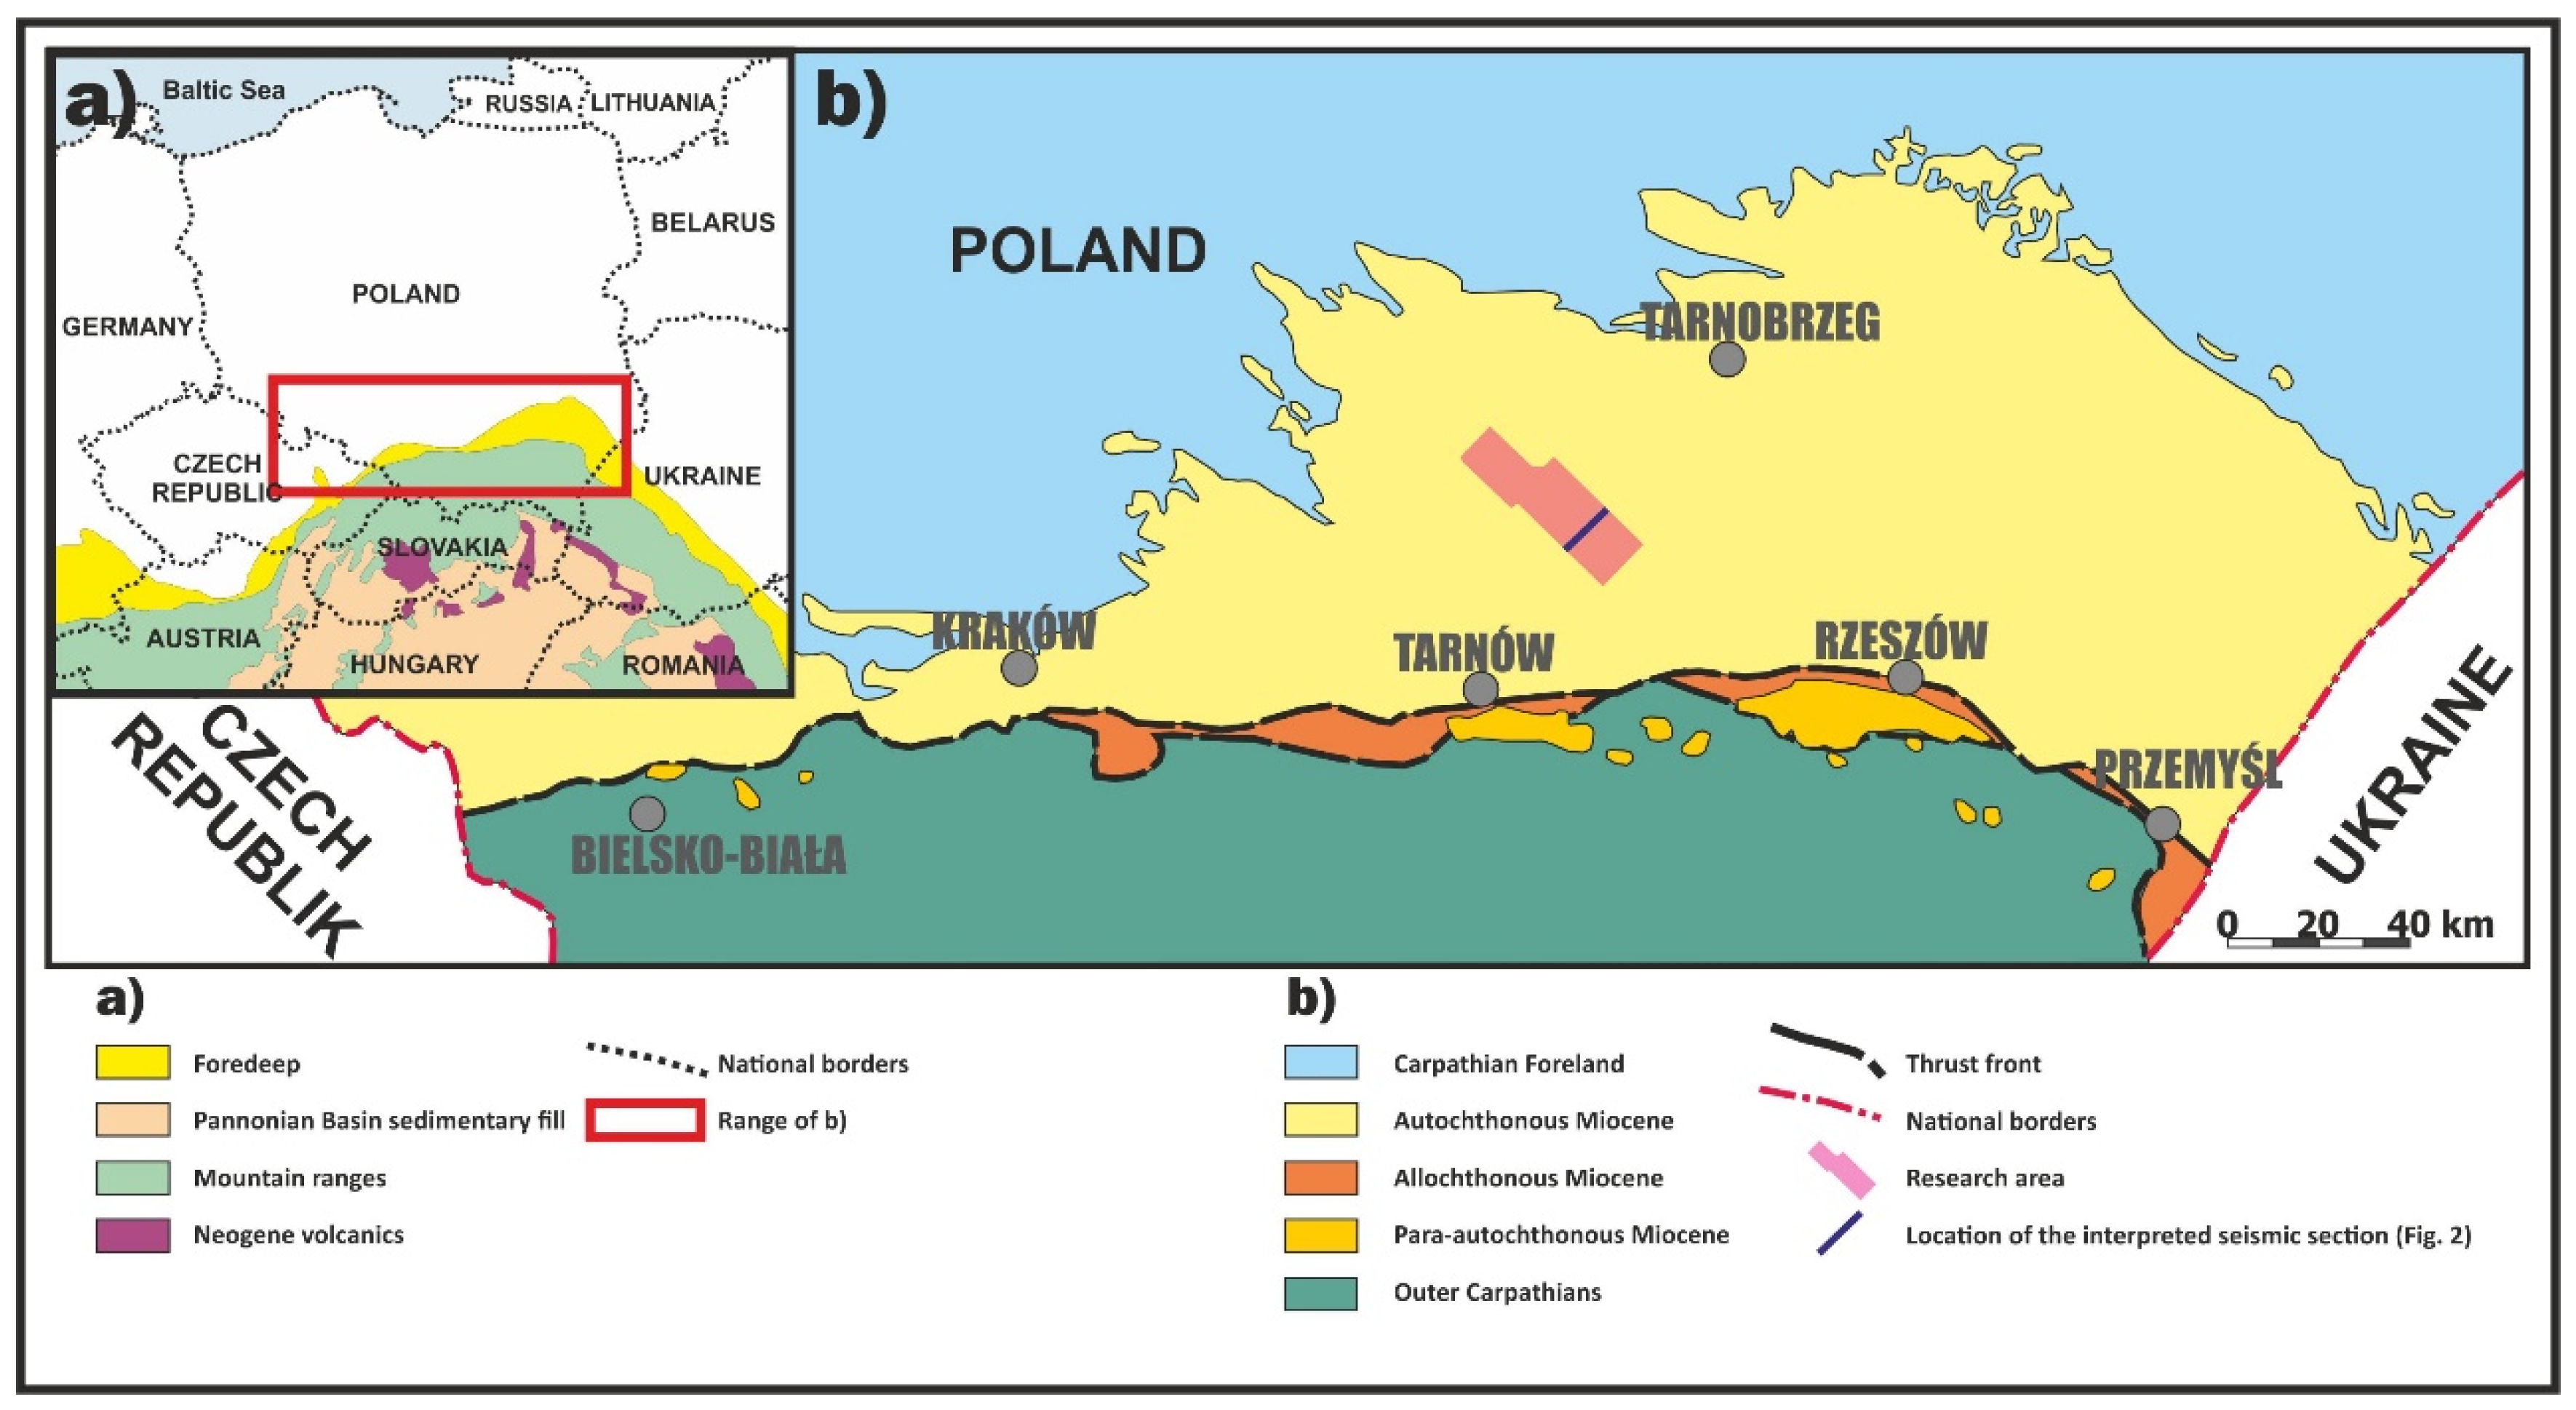
Figure 1. Geological map of the studied area: (a) generalized map of the Carpathian system range, after Picha [21] (modified); (b) location of the research area against the range of the Carpathian Foredeep in Poland; ranges of geological units according to Porębski and Warchoł [22].
Energies 13 06036 g001
Figure 2. Detailed interpretation of (a) chronostratigraphic horizons in structural domain showed against the migrated seismic section (b) and Wheeler diagram transformed from seismic data. (c) Model presenting a chronostratigraphic nature of the stratigraphic units (Reproduced from Qayyum et al. [52], John Wiley & Sons Ltd, European Association of Geoscientists & Engineers and International Association of Sedimentologists, 2015, Page: 340).
Energies 13 06036 g002
Figure 3. Detailed interpretation of (a) chronostratigraphic horizons in structural domain and (b) Wheeler diagram transformed from seismic data.
Energies 13 06036 g003
Figure 4. Depositional sequence interpretation: (a) interpreted sequences; (b) chronostratigraphic horizon interpretation; (c) sweetness attribute; (d) spectral decomposition. Depositional sequences: IVF—incised valley; FSST—failing stage system tract; sf—slope fans; bff—basin flow fans; TST—transgressive system tract.
Energies 13 06036 g004
Figure 5. Geological cross-section with marked system tracts and prospecting targets within the interpreted seismic interval.
Energies 13 06036 g005
Publisher’s Note: MDPI stays neutral with regard to jurisdictional claims in published maps and institutional affiliations.