Abstract
Efforts to achieve Sustainable Development Goals (SDGs) have resulted in enhancement of the position of microalgae in feedstocks for food, feed, healthcare, and biofuels. However, stabile microalgal biorefineries require a sustainable and reliable management system of microalgae, which are sensitive to environmental changes. To expand microalgal applicability, assessment and maintenance of microalgal quality are crucial. Compared with conventional methods, including hemocytometry and turbidity, an automated- and image-based cell counter contributes to the establishment of routine management of microalgae with reduced work burden. This review presents the principle of an automated cell counter and highlights the functional capacities of the device for microalgal management. The method utilizing fluorescence function to evaluate the chlorophyll integrity of microalgae may lay the groundwork for making a large variety of microalgal biorefineries, creating an important step toward achieving SDGs.
1. Introduction
Following the Millennium Development Goals, the United Nations established SDGs that consist of broader aspects than the former goals. These goals cover issues relating to people, prosperity, planet, peace, and partnership. All responsible stakeholders need to reflect on the concept of SDGs for individual policies and projects. Although several specialized approaches are required to achieve the agendas, biotechnology, including microalgal applications and their potential, might be flexible enough to respond to several SDGs.
Although biotechnology is an interdisciplinary branch of science and technology, it is most popularly classified using color codes. Based on the rainbow code of biotechnology, several biotechnology disciplines are classified as follows [1]: green biotechnologies are directed toward the development of agriculture; blue relates to marine and aquatic areas, including marine biotechnology; yellow relates to nutritional biotechnology; red relates to medicine and human health; and gray relates to those that target environmental protection, including earth-friendly approaches, products, and services.
In addition to the role of microalgae as a producer in ecosystems, they have the potential to serve as biomass-based feedstocks for several intermediates, food, feed, and bioenergy. Starting with an adoption to utilize microalgae as an ambitious strategy for developing bioeconomy in Europe by the European Union [2], microalgae are emerging as renewable and next-generation biological resources with the potential to achieve urgent industrial and agricultural demands [3]. Furthermore, integration of microalgal manufacturing technology with new technologies, such as synthetic biology, phenomics, and internet of things (IoT), might advance innovation in an algal-based bioeconomy [3]. To expand microalgal applicability in industrial applications, assessment and maintenance of microalgal quality are required in addition to selection of algal species with useful features. This review presents microalgal potential for application and discusses the availability of an automated- and image-based cell counter for microalgal management.
2. Present Applications of Microalgae and a Smoldering Challenge from a Practical Application Perspective
Conventional biomass-based feedstocks from agricultural residues, forestry residues, energy crops, and other organic residues are constantly produced as waste treatment streams. These biomass-based feedstocks have been converted into intermediates, resulting in sugars, chemical building blocks, bio-oils, and gaseous mixtures through degradation and fractionation procedures. These procedures are broadly applicable to both general plant biomass and microalgal biomass. In fact, microalgal biomass is expected to be a feedstock for food [4], fiber [5], biofertilizer [6,7], biodiesel [8,9], and other energy sources [9,10]. In addition to the above-described utilization, several microalgae can enhance the nutritional quality of food and animal feed and play a crucial role in cosmetics, pharmaceuticals, and healthcare [11,12,13,14,15].
Microalgal biorefineries have the following potential uses (Figure 1): as biofertilizer [6,7] (green biotechnology field, contributing to SDGs Nos. 2 and 15); in aquaculture, coastal, and marine areas, as prey for clam and crustacea in the fisheries industry, and as prey for zooplankton, such as rotifers, in farming fisheries [16,17] (contributing to SDGs Nos. 2 and 14); in the development of final products, such as supplements and drugs [9,11,18,19] (yellow and red biotechnology fields, contributing to SDG No. 3); and as alternatives to both first-generation biofuels using consumable biomass and second-generation biofuels using lignocellulosic feedstocks by becoming an important feedstock for third-generation biofuels [8,20,21,22] (gray biotechnology, contributing to SDG Nos. 7 and 9 as the achievement of SDG No. 7 will impact technology innovation). These expectations stem from the competitive advantage of microalgal biorefineries in terms of sustainability due to their dependence on light and inorganic materials.

Figure 1.
Relationship between the different colors of the rainbow color code of biotechnology and microalgal potentials as food, feed, and feedstocks for biorefinery. Several panels with label numbers are logos of Sustainable Development Goals.
Despite the potential of microalgae in a variety of industries, its current applications are mostly at the research and development stage. Compared with visible plant biomass, microscopic microalgae are harder to work with. Microalgae have high sensitivity to environmental changes [15,23]. Overlooked environmental changes impacting microalgae could determine the quality of each biomass-based product and diminish a product’s value in the worst-case scenario. Therefore, routine control, maintenance, and management of algal quality are more important than all other factors.
3. General Evaluation Methods of Microalgae
Figure 2 summarizes the conventional methods used to evaluate microalgae. These are categorized into two main types: optical measurements based on microscopy or spectrophotometry and other methods, such as the Coulter method, plate counting, and gravimetry. Optical measurements are based on visible radiation and fluorescence-based methods. Moreover, several methods have a direct cell counting function. Each method has both advantages and disadvantages.

Figure 2.
Present standard methods for detecting and evaluating microbes, including microalgae. Optical measurements, the electrical sensing zone method, the conventional plate count method, and weight measurements are categorized. The automated cell counter marked with an asterisk means a device without fluorescence detection.
Manual and microscopy-based hemocytometry are conventional and available at low cost but are also extremely time-consuming, which is not the case for high-throughput experiments. Highly accurate measurement requires considerable effort from operators with proficiency in hemocytometry to avoid user bias [24].
Similar to experiments using bacteria in microbiology, turbidity has been conventionally used for the determination of microalgal cell density [25,26]. Turbidity using infrastructure equipment in a standard laboratory can also be made available at low cost. Compared with manual hemocytometry, instrumental analysis contributes to reducing the operator’s burden. However, this method is markedly inferior to fluorescence-based methods, both in terms of sensitivity for the detection of low cell densities of samples and the selectivity of discrimination between microalgae and other interferers [26,27].
In contrast to turbidity without any molecular absorbance, several methods based on spectroscopy or fluorometry have been established that use photosynthetic pigmentary absorbance or emission, such as chlorophyll in microalgae. The representative tools and methods are chlorophyll meter, spectrofluorometry, and flow cytometry. Measurements of photosynthetic pigmentary absorbance or emission contribute to the diagnosis of algal health due to its crucial importance for photosynthesis [15,23,28,29,30,31,32]. An emerging issue is the discrimination between microalgae and other interferers in instrumental analysis without visual information. Visual data provide the information necessary to determine whether atypical algae are mixed into an algal culture. Although image cytometry (laser scanning cytometry) and imaging flow cytometry can solve the above challenge [33,34], they are generally an order of magnitude more expensive than standard instruments.
4. Automated Cell Counter Method for Cell Counting in Cell Biology
The cell counting function is an important evaluation item for culture maintenance. Apart from microscopy-based methods, such as hemocytometry and image cytometry, several methods, including the Coulter method [35], flow cytometry, and plate counting methods, have been used for cell counting (Figure 2). Among them, the plate counting method is not suitable for high-throughput experiments. The sophisticated setup of measurement parameters is a necessary step toward the accurate evaluation of target cells by flow cytometry and the Coulter method due to the absence of visual information [28].
Recently, automated cell counters with visual information have succeeded conventional hemocytometers in cell biology studies using standard target cells, such as cultured animal cells, including human, rat, and mouse cells. Unlike some optical measurements, such as turbidity and spectroscopy, this method has the advantage of a lack of a standard curve. Most devices have a competitive cost advantage over standard image cytometers and imaging flow cytometers. Using the principle of hemocytometry and the appurtenant sophisticated algorithm to recognize target cells, this method can provide accurate cell counting data without user bias for everyone, from beginners to experts.
An attached camera of each cell counter device captures a target cell image in this automated cell counter method. Using the CountessTM II FL cell counter (Thermo Fisher Scientific Inc., Waltham, MA, USA) as an example of a cell counter device, the above device has a five-megapixel digital and monochromatic camera with 2.5× optical zoom [15,36]. The attached camera of the CountessTM II FL cell counter captures an image size of 1920 × 2560 pixels (Figure 3). In addition to the measurement principle, the cell counter method is superior to manual hemocytometry in terms of measurement accuracy. An area of analysis using a conventional hemocytometer is 1 mm2, corresponding to just one field of view in an optical microscope when using both a field number of 18 of the eyepiece and 10× magnification of the objective (Figure 4a). Here, the field of view diameter can be calculated using Equation (1) [37]:
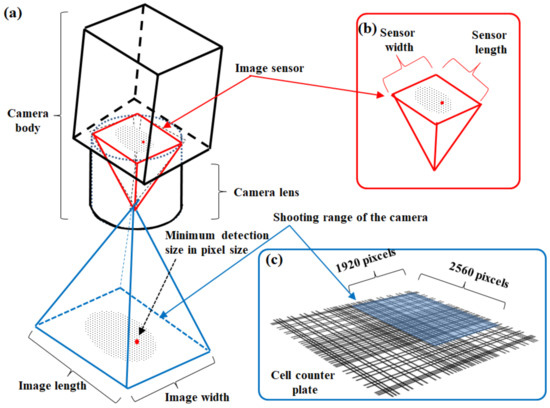
Figure 3.
Image recognition system of the automated CountessTM II FL cell counter (Thermo Fisher Scientific Inc.). (a) Conceptual diagram of the camera body and detection area. (b) Image sensor of the attached camera of the device. (c) Size of the detection area.
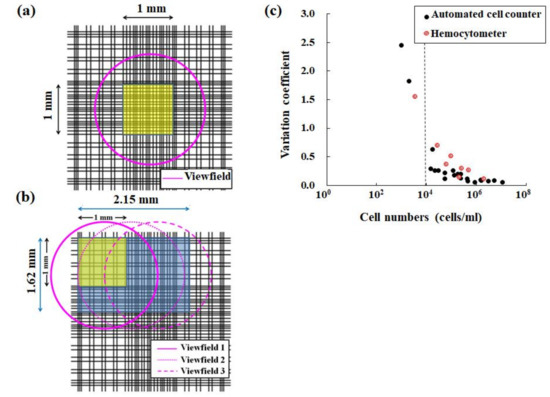
Figure 4.
Comparison of a hemocytometer with the automated CountessTM II FL cell counter. (a) A pink circle indicates the measurement area (yellow area) of a standard hemocytometer in an optical microscope when using both a field number of 18 for the eyepiece and 10× magnification for the objective. (b) Three pink circles indicate the measurement area (yellow + blue areas) of the cell counter device. (c) Changes in each variance coefficient obtained by both hemocytometry (red circle) and the automated cell counter method (black circle) in determining cell density. Here, panel (c) was obtained from another study [15].
For the CountessTM II FL cell counter device, the measurement area is 3.48 mm2, corresponding to three fields of view (Figure 4b). Therefore, the measurement area using this device is wider than that obtained using a hemocytometer. Therefore, the coefficient of variance values obtained using automated cell counter devices are, in principle, equivalent or superior to those obtained using a hemocytometer (Figure 4c) [15,36]. The features of this method, such as automation and usability without user bias, are suitable for the routine management of target cells.
5. Applicability of an Automated Cell Counter for the Evaluation of Microalgae
5.1. Selectivity to Detect Microalgae
Virtually all cell counter devices are designed as an alternative to a manual hemocytometer for the cell counting of mammalian cell lines and hemocytes. Cell line validation has been performed using several model cell lines, including human, mouse, rat, Chinese hamster (such as CHSE cells), African monkey (such as COS-7 cells), and insect (such as SF-21 cells) cell lines [37]. For the CountessTM II FL cell counter, the factory-recommended target cell size is 7–60 μm in diameter [36], which is larger than the cell size of microalgae. This limitation can be found in almost all cell counters and is ascribable to the trade-off between image resolution and keeping costs low. The standard optics for the bright field imaging of cell counter devices are insufficient for discriminating microalgae from other small particles, such as debris, small stains, and microbubbles, in a counting chamber. Therefore, it is difficult for many automated cell counter devices with default system settings to detect and evaluate microalgae.
Realistically, there is a possibility of microbubbles occurring during slide preparation for hemocytometry. Using a monochromatic camera in bright field, typical microbubbles appear to have 1–10 μm diameter [38], which is similar in size to microalgae. When evaluating microalgae selectively and sensitively, the detection of fluorescence from chlorophyll helps an automated cell counter device avoid falsely recognizing nontarget particles as target cells [15]. To cite chlorophyll as an example of photosynthetic pigments, the pigment excited by an appropriate excitation light emits red florescence at approximately 680 nm [15,27,28,31,32]. Several cell counter devices have filters optimized for frequently used fluorophores, such as Rhodamine and Texas Red, which have shorter wavelengths than chlorophyll. Figure 5 shows both fluorescence properties of fluorophores used as red fluorescence and several emission filters. In addition to fluorescence properties of fluorophores, Figure 6 shows detection characteristics for chlorophyll fluorescence of several cell counter devices. As seen in Figure 5, several fluorescence filters for the above red fluorescence are inappropriate for the selective detection of chlorophyll fluorescence in reality [28]. Considering the excitation efficiency of chlorophyll (Figure 6), a precisely detecting device is largely restricted to parts of commercially available devices.
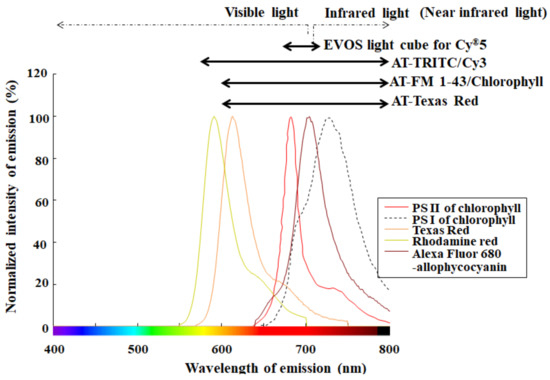
Figure 5.
Fluorescence properties and their corresponding emission filters. Each fluorescence spectrum of representative fluorophores, such as Texas Red, Rhodamine Red, and Alexa Fluor 680-allophycocyanin, was made using an online software (SpectraViewer; Thermo Fisher Scientific Inc., Waltham, MA, USA) and is shown here. A fluorescence spectrum for photosystem (PS) II, recognized mainly as red fluorescence, and that for PS I of chlorophyll were extracted from the cited pater [39] using the graph digitizing system software (GSYS2.4 software; Hokkaido University Nuclear Reaction Data Center) and are shown here. Each detection range of several emission filters, such as AT-series filters (AT-TRITC/Cy3, AT-FM 1/43/Chlorophyll and AT-Texas Red) [40] and EVOSTM light cube for Cy5 [36], is indicated by an arrow.

Figure 6.
Detection properties of chlorophyll fluorescence using several cell counter devices, such as the CountessTM II FL automated cell counter [15], the TaliTM Image-based cytometer [41], the LUNA-FLTM automated fluorescence cell counter [42], the CellDrop FL automated cell counter [43], and the Cellometer Spectrum image cytometry system [44]. Excitation (black curve) and emission (red curve) spectra of Chlorella-like algae isolated from a ciliate Paramecium bursaria are shown in the graph. Each curve is the fluorescence intensity emitted at 680 nm (black curve) and that excited at 488 nm (red curve). Each colored horizontal line shows the range of each excitation light (solid line) and the corresponding range of the emission filter (dotted line) for each cell counter device. The excitation and emission spectra of Chlorella-like algae were unpublished data from the literature [31].
Takahashi [15,28] suggested application of the automated Countess™ II FL cell counter (Thermo Fisher Scientific Inc., Waltham, MA, USA) with a Cy5 filter of EVOS light cubes detecting fluorescence at 672–712 nm [36] for the evaluation of chlorophyll fluorescence. Although the camera attached to the device does not have high resolution (Figure 3), it could detect algal fluorescence sensitively (Figure 7a) and capture a single cell of microalga (Figure 7a’). Even if nontarget particles are mixed into the test chamber of the device (arrowheads in Figure 7b), the device could discriminate between microalgae as the target organisms and others selectively (Figure 7b,c). These results indicate that the cell counter method with an adequate fluorescence filter for photosynthetic pigments is useful for the selective and rapid detection of microalgae.

Figure 7.
Measurement example of microalgae by the automated CountessTM II FL cell counter with a Cy5 filter. (a) Fluorescence image of the green algae Parachlorella kessleri. (a’) Magnified view of panel (a). (b) A superimposed image of a bright field on the corresponding fluorescence image. When using no fluorescence filter (bright field image), grimy nonalgal stains or microbubbles on the counting glass plate (arrowheads) were detected, which could lead to false recognition. (c) Image measurements under analysis to detect and evaluate microalgae. Numeric values enclosed by white and red lines are total particle numbers detected by the device without and with fluorescent selection function, respectively. Here, images (panels a–c) from the cell counter had no scale bar by default. Panel (b) was obtained from a previous study [15].
5.2. Multifaceted Evaluation of Microalgae
For the CountessTM II FL cell counter, remarkable parts of the device include the simultaneous evaluation of size and the fluorescent property of microalgae of interest along with the detection of microalgae. The device can evaluate the size of microalgae ≥2 μm in diameter (Figure 8a). The results obtained by the device were comparable in size to the precision of manual measurements by microscopy and image analysis [15].
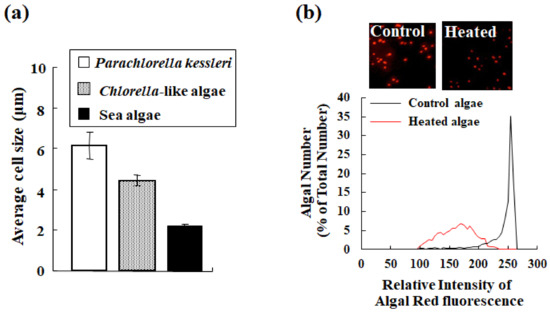
Figure 8.
Example of evaluation of microalgae by the automated CountessTM II FL cell counter with a Cy5 filter. (a) Size comparison (average ± standard deviation) of algal cells (Parachlorella kessleri, Chlorella-like algae isolated from a ciliate Paramecium bursaria, and sea algae related closely to stramenopiles) evaluated by the cell counter. (b) Changes of algal status evaluated by the cell counter before (black line in the graph; control in the inset image) and after (red line in the graph; heated in the inset image) heat treatment of P. kessleri. Here, the panels (a,b) were obtained from a previous study [15].
Chlorophyll, a typical photosynthetic pigment, is sensitive to changes in temperature, pH, and other uncertain factors [23]. Therefore, chlorophyll integrity serves as a barometer for microalgal health [15,28]. In actuality, compared to the control condition, heat treatment of microalgae decreases the fluorescence of chlorophyll (the inset images in Figure 8b). In addition to the apparent change in microalgae, the device qualified the fluorescence intensity of chlorophyll simultaneously and showed these changes graphically. The graph in Figure 8b shows the fluctuation of chlorophyll fluorescence with (red line) or without (black line) heat treatment. In analogy with visual data, the graph shows a difference between control and heated algae. Therefore, this function contributes to the rapid monitoring of the algal status based on chlorophyll integrity.
6. Conclusions
It is foreseen that the global algae market will expand at a 7.42% compound annual growth rate (CAGR) during the forecast tenure 2019 to 2027, contributing to earnings of around USD 1.37 billion by the end of 2027 [45]. Now is the best time to expand microalgal applications in industrial applications due to their potential to contribute to SDGs as social objectives throughout the international community. However, stabile microalgal biorefineries require a sustainable management system for microalgae, which has combined usefulness and sensitivity. In view of the timely approach of microalgal management, this review discusses the applicability of an automated- and image-based cell counter for the routine management of microalgae.
By equipping an automated cell counter with a hemocytometry-based reliable principle, selectivity based on fluorescence detection, and an elaborate algorithm to detect target cells, everybody from beginners to experts can automatically obtain diversified information, including cell counting estimation, cell size, and cell health, using the device. The automated cell counter method with fluorescence function may lay the groundwork for developing a wide variety of microalgal biorefineries. As an important step toward achieving SDGs, this method might contribute to algal management in culture and accelerate the expansion of microalgal applications in the future.
Funding
This research was funded in part by Grants-in-Aid for Exploratory Research from the Japan Society for the Promotion of Science (KAKENHI), grant numbers 19K06347 and 20K05695.
Conflicts of Interest
The author declares no conflict of interest.
References
- Kaferski, P. Rainbow code of biotechnology. Chemik 2012, 66, 811–816. [Google Scholar]
- Enzing, C.; Ploeg, M.; Barbosa, M.; Sijtsma, L. Microalgae-Based Products for the Food and Feed Sector: An Outlook for Europe. In JRC Scientific and Policy Reports; Vigani, M., Parisi, C., Cerezo, E.R., Eds.; Publications Office of the European Union: Luxembourg, 2014. [Google Scholar]
- Febris, M.; Abbriano, R.M.; Pernicce, M.; Sutheriand, D.L.; Commault, A.S.; Hall, C.C.; Labeeuw, L.; McCauley, J.I.; Kuzhiuparambil, U.; Ray, P.; et al. Emerging Technologies in Algal Biotechnology: Toward the Establishment of a Sustainable, Algae-Based Bioeconomy. Front. Plant Sci. 2020, 11, 279. [Google Scholar] [CrossRef] [PubMed]
- Ryo, A. Characteristics of the microalgae Euglena and its applications in foods and ecological fields. Jap. Soc. Photosynth. Res. 2012, 22, 33–38. [Google Scholar]
- Lee, H.-R.; Kim, K.; Mun, S.C.; Chang, Y.K.; Choi, S.Q. A new method to produce cellulose nanofibrils from microalgae and the measurement of their mechanical strength. Carbohydr. Polym. 2018, 180, 276–285. [Google Scholar] [CrossRef]
- Chaturvedi, V.; Nikhil, K. Effect of algal bio-fertilizer on the Vigna radiate: A Critical Review. Int. J. Eng. Res. Appl. 2016, 6, 85–94. [Google Scholar]
- Faheed, F.A.; Fattah, Z.A.-E. Effects of Chlorella vulgaris as bio-fertilizer on growth parameters and metabolic aspects of lettuce plant. J. Agric. Soc. Sci. 2008, 4, 165–169. [Google Scholar]
- Chisti, Y. Biodiesel from microalgae. Biotechnol. Adv. 2007, 25, 294–306. [Google Scholar] [CrossRef]
- Williams, P.J.L.B.; Laurens, L.M.L. Microalgae as biodiesel & biomass feedstocks: Review & analysis of the biochemistry, energetics & economics. Energy Environ. Sci. 2010, 3, 554–590. [Google Scholar]
- Ghayal, M.S.; Pandya, M.T. Microalgae biomass: A renewable source of energy. Energy Procedia 2013, 32, 242–250. [Google Scholar] [CrossRef]
- Chandra, R.; Iqbal, H.M.N.; Vishal, G.; Lee, H.-S.; Nagra, S. Algal biorefinery: A sustainable approach to valorize algal-based biomass towards multiple product recovery. Bioresour. Technol. 2019, 278, 346–359. [Google Scholar] [CrossRef]
- Seyidoglu, N.; Inan, S.; Aydin, C. A Prominent superfood: Spirulina platensis. In Superfood and Functional Food-Development of Superfood and its Role in Medicine, 1st ed.; Shiomi, N., Waisundara, V.Y., Eds.; InTechOpen: Rijeka, Croatia, 2017; pp. 1–27. [Google Scholar]
- Spolaore, P.; Joannis-Cassan, C.; Duran, E.; Isambert, A. Commercial applications of microalgae. J. Biosci. Bioeng. 2006, 101, 87–96. [Google Scholar] [CrossRef] [PubMed]
- Choi, J.A.; Oh, T.-H.; Choi, J.-S.; Chang, D.-J.; Joo, C.-K. Impact of β-1,3-glucan Isolated From Euglena gracilis on Corneal Epithelial Cell Migration and on Wound Healing in a Rat Alkali Burn Model. Curr. Eye Res. 2013, 38, 1207–1213. [Google Scholar] [CrossRef] [PubMed]
- Takahashi, T. Applicability of automated cell counter with a chlorophyll detector in routine management of microalgae. Sci. Rep. 2018, 8, 4967. [Google Scholar] [CrossRef] [PubMed]
- Okauchi, M. Selection of algal strains with high-growth rate as food organisms and development of their effective production techniques. Nippon Suisan Gakkaishi 2014, 80, 323–326. (In Japanese) [Google Scholar] [CrossRef][Green Version]
- Takahashi, T. Relationship between Algal Blooms and Marine-Ecosystem Services. In Book Marine Ecology: Current and Future Developments, 1st ed.; Takahashi, T., Ed.; Bentham Science Publishers: Sharjah, UAE, 2020; Volume 2, pp. 30–40. [Google Scholar]
- Koyande, A.K.; Chew, K.W.; Rambabu, K.; Tao, Y.; Chu, D.-T.; Show, P.-L. Microalgae: A potential alternative to health supplementation for humans. Food Sci. Hum. Wellness 2019, 8, 16–24. [Google Scholar] [CrossRef]
- Barzkar, N.; Jahromi, S.T.; Poorsaheli, H.B.; Vianello, F. Metabolites from Marine Microorganisms, Micro, and Macroalgae: Immense Scope for Pharmacology. Mar. Drag 2019, 17, 464. [Google Scholar] [CrossRef]
- Shiho, M.; Kawachi, M.; Horioka, K.; Nishita, Y.; Ohashi, K.; Kaya, K.; Watanabe, M.M. Business evaluation of a green microalgae Botryococcus braunii oil production system. Procedia Environ. Sci. 2012, 15, 90–109. [Google Scholar] [CrossRef]
- Chen, W.-H.; Lin, B.-J.; Huang, M.-Y.; Chang, J.-S. Thermochemical Conversion of Microalgal Biomass Into Biofuels: A Review. Bioresour. Technol. 2015, 184, 314–327. [Google Scholar] [CrossRef]
- Suganya, T.; Varman, M.; Masjuki, H.H.; Renganathan, S. Macroalgae and microalgae as a potential source for commercial applications along with biofuels production: A biorefinery approach. Renew. Sustain. Energy Rev. 2016, 55, 909–941. [Google Scholar] [CrossRef]
- Kaplan, D. Absorption and adsorption of heavy metals by microalgae. In Handbook of Microalgal Culture: Applied Phycology and Biotechnology, 2nd ed.; Richmond, A., Hu, Q., Eds.; John Wiley & Sons, Ltd.: Hoboken, NJ, USA, 2013; pp. 602–611. [Google Scholar]
- Ongena, K.; Das, C.; Smith, J.L.; Gil, S.; Johnston, G. Determining cell number during cell culture using the Scepter cell counter. J. Vis. Exp. 2010, 45, e2204. [Google Scholar] [CrossRef]
- Koch, A.L. Turbidity measurements of bacterial cultures in some available commercial instruments. Anal. Biochem. 1970, 38, 252–259. [Google Scholar] [CrossRef]
- Sutton, S. Measurement of microbial cells by optical density. J. Validation Technol. 2011, 17, 46–49. [Google Scholar]
- Chiocciodi, M.; Hankamer, B.; Ross, I.L. Flow cytometry pulse width data enables rapid and sensitive estimation of biomass dry weith in the microalgae Chlamydomonas reinhardtii and Chlorella vulgaris. PLoS ONE 2014, 9, e97269. [Google Scholar]
- Takahashi, T. Routine Management of Microalgae Using Autofluorescence from Chlorophyll. Molecules 2019, 24, 4441. [Google Scholar] [CrossRef] [PubMed]
- Takahashi, T. Quality assessment of microalgae exposed to trace metals using flow cytometry. In Superfood and Functional Food-Development of Superfood and its Role in Medicine, 1st ed.; Shiomi, N., Waisundara, V.Y., Eds.; InTechOpen: Rijeka, Croatia, 2017; pp. 29–45. [Google Scholar]
- Takahashi, T.; Yokoyama, S. Bioassay of components eluted from electric arc furnace steel slag using microalgae Chlorella. ISIJ Int. 2016, 56, 1495–1503. [Google Scholar] [CrossRef]
- Takahashi, T. Direct evaluation of endosymbiotic status in Paramecium bursaria using capillary flow cytometry. Cytom. Part A 2014, 85, 911–914. [Google Scholar] [CrossRef]
- Takahashi, T. Application of phytoplankton. In Corrosion Control and Surface Finishing–Environmentally Friendly Approaches, 1st ed.; Kanematsu, H., Barry, D.M., Eds.; Springer Japan: Tokyo, Japan, 2016; pp. 213–224. [Google Scholar]
- Doan, M.; Vorobjev, I.; Rees, P.; Filby, A.; Wolkenhauer, O.; Goldfeld, A.E.; Lieberman, J.; Barteneva, N.; Carpenter, A.E.; Hennig, H. Diagnostic Potential of Imaging Flow Cytometry. Cell Press Rev. 2018, 36, 649–652. [Google Scholar] [CrossRef]
- Poulton, N.J. Imaging Flow Cytometry for Phytoplankton Analysis: Instrumentation and Applications. J. Biomol. Tech. 2019, 30, S52. [Google Scholar]
- Vembadi, A.; Menachery, A.; Qasaimeh, M.A. Cell Cytometry: Review and Perspective on Biotechnological Advances. Front. Bioeng. Biotechnol. 2019, 7, 147. [Google Scholar] [CrossRef]
- Thermo Fisher Scientific Inc. Countess II FL Automated Cell Counter. Available online: https://www.thermofisher.com/jp/en/home/life-science/cell-analysis/cell-analysis-instruments/automated-cell-counters/countess-ii-fl-automated-cell-counter.html (accessed on 20 September 2020).
- Nikon Instruments Inc. MICROSCOPY U: The Source for Microscopy Education. Available online: https://www.microscopyu.com/microscopy-basics/field-of-view (accessed on 20 September 2020).
- Satinover, S.J.; Dove, J.D.; Eorden, M.A. Single-Particle Optical Sizing of Microbubbles. Ultrasound Med. Biol. 2014, 40, 138–147. [Google Scholar] [CrossRef]
- Pedrós, R.; Moya, I.; Goulas, Y.; Jacquemoud, S. Chlorophyll fluorescence emission spectrum inside a leaf. Photochem. Photobiol. Sci. 2008, 7, 498–502. [Google Scholar] [CrossRef] [PubMed]
- Chroma Technology Japan. Spectra Viewer. Available online: https://jp.chroma.com/spectra-viewer#tabs-spectra_viewer_plot-left-2 (accessed on 2 November 2020).
- Thermo Fisher Scientific Inc. Tali Image-Based Cytometer. Available online: https://assets.thermofisher.com/TFS-Assets/LSG/manuals/mp10796.pdf (accessed on 2 November 2020).
- Logos Biosystems Inc. LUNA-FL Automated Fluorescence Cell Counter. Available online: https://www.biocat.com/logos/manuals/LUNA-FL_User_Manual_VL1712-01.pdf#search='LUNAFL%E2%84%A2+Automated+fluorescence+cell+counter (accessed on 2 November 2020).
- DeNovix Inc. CellDrop FL Automated Cell Counters. Available online: https://www.denovix.com/products/celldrop (accessed on 2 November 2020).
- Nexcelom Inc. Cellometer Spectrum Image Cytometry Systems. Available online: https://www.nexcelom.com/nexcelom-products/cellometer-and-celigo-image-cytometers/cellometer-spectrum-image-cytometry-system/#specs (accessed on 2 November 2020).
- Transparence Market Research. ALGAE MARKET TO REACH VALUATION OF ~US$ 10.7 BN BY 2027, Press Releases. Available online: https://www.transparencymarketresearch.com/pressrelease/algae-market.htm (accessed on 30 April 2020).


Publisher’s Note: MDPI stays neutral with regard to jurisdictional claims in published maps and institutional affiliations. |
© 2020 by the author. Licensee MDPI, Basel, Switzerland. This article is an open access article distributed under the terms and conditions of the Creative Commons Attribution (CC BY) license (http://creativecommons.org/licenses/by/4.0/).