1. Introduction
Fossil fuel depletion and its negative influence on the environment has spawned the opportunity for Renewable Energy Sources (RES) to take on a significant role in global energy distribution. Because of its huge potential and technology in terms of CO
2 emissions mitigation, solar energy has become one of the most promising energy sources to cover the growing electricity demand [
1]. Supportive energy policies and treaties have generated huge investment flows into PVs that have resulted in technology advancement and a huge increase in the capacity integrated into the grid. According to REN21, the global installed PV capacity in 2019 reached 627 GW [
2]. Due to the increasing integration of PV plants into the existing power system, intensive research is being carried out to improve the PV equipment characteristics as well as to reduce investment costs. Thus, one direction of research covers the different technologies of PV modules [
3], while the other deals with the development of electronic equipment for PV plants, more specifically, inverter topologies used to connect DC PV modules and the AC power grid [
4,
5,
6,
7,
8].
Testing of inverters for PV plants requires a repetition of the meteorological conditions to which PV modules were exposed. This task is not easy, given the sensitivity of the current–voltage (
i–v) characteristic of the module to various influences such as discontinuous time-dependent solar irradiation and change in daytime ambient temperature [
9,
10]. In addition, to test the operation of a PV power plant, it is necessary to provide a large surface area for installing PV modules. All of this makes the testing of electronic equipment a challenging task. A process that mimics
i–v characteristics of PV modules or arrays of a PV power plant is called PV emulation. If
i–v characteristics of modules are known in advance, depending on the knowledge of meteorological conditions, a prerequisite for the testing of electrical equipment will be fulfilled.
There are several approaches to obtaining an
i–v characteristic needed for PV emulation. The most popular approach to PV cell modelling is utilization of an electrical equivalent circuit which consists of both non-linear and linear components. Many models have been developed over time, starting with the single diode model with
Rs and
Rp, to the two-diode and three-diode models [
11]. The more complicated the model is, the more parameters are involved in the modelling. For example, the most commonly used single diode
Rp model requires five parameters to describe the PV cell or panel. Many approaches to model parameter extractions have been developed over the years. Parameters can be extracted by measurements or by numerical calculation techniques as well as by a combination of these two approaches [
12,
13]. One must be familiar with all necessary elements of the PV cell electrical model that depend on the performance of different module technologies [
14]. According to [
15], in addition to being familiar with the PV cell electrical model, this approach requires the choice of a control strategy for reaching the Maximum Power Point (MPP), and finally, the corresponding power converter. This approach requires good knowledge of the module technical characteristics based on long-term measurements.
Contrary to that, this paper proposes a programmable power supply-based PV emulator equipped with the possibility of operating in PV mode. The advantage of such a PV emulator is that the emulation of
i–v characteristics requires knowledge of only three specific points, hence an electrical model of a PV cell is not mandatory. There are various sizes of PV emulators available on the market, from the size of a single module (<300 Wp) to the size of a PV array (5–10 kWp) [
16]. These PV emulators are more expensive than their own developed PV emulator based on the PV cell diode model, but they are much more flexible in operation in terms of emulating electricity generation from different module technologies [
17].
The paper proposes a fast PV power emulation procedure using a PV emulator that consists of two programmable power sources and a PV plant inverter. Fast PV power emulation enables the emulation of PV power plant operation from identical or different arrays based on knowing the specific points of i–v characteristics of only one PV module. This can be obtained by various methods, and in this paper, the authors use a measurement database of i–v module characteristics for different PV technologies. The advantage of fast PV power emulation lies in significantly shorter emulation times compared to standard emulation with programmable power sources, which lasts as a daily power diagram.
A description of the proposed fast PV power emulation procedure is given in
Section 2, while
Section 3 gives a description of the Data Acquisition System (DAQ system), which acquires measurements used for the
i–v module characteristic database.
Section 4 gives a description of the algorithms developed for determining PV plant configuration and filtering measurement data for fast PV power emulation as well as indices used for emulation results evaluation. Case study analysis of the results obtained by fast PV power emulation of a 6 kW and a 12 kW PV plant with different PV module technologies is presented in
Section 5. Concluding remarks about the PV power emulation results are given in the last section of the paper, i.e.,
Section 6.
2. Fast PV Power Emulation Procedure
As described in the introduction, a PV emulator is an electronic device that is capable of producing an
i–v characteristic of the PV module or array, thus enabling us to create a repeatable testing condition. The PV emulator used in this paper uses a programmable power supply as a power converter system that does not require a converter controller, since it is already included therein, which makes it less complex than other power converter types of emulators such as a linear regulator [
18,
19,
20] and switched-mode power supply [
21,
22,
23,
24]. Programmable power supply requires only the values of currents and voltages for three specific points of the PV module
i–v characteristic.
One of the advantages of a programmable power supply is the automatic process of PV emulation executed through the commands, which also shortens the PV emulation time. The main idea of this paper is to propose the procedure of an advanced PV emulation technique called fast PV power emulation of PV plants. Compared to standard PV emulation, the proposed technique, allows the emulation of PV plants of arbitrarily determined size and made of different technologies in a shorter period of time [
25]. Special measurement data filtering and an arbitrary number of commands entered into programmable DC power supplies, written in the form of a script, enable time reduction of the PV emulation process.
The procedure of fast PV power emulation of the PV plants given in
Figure 1 starts with measurements obtained by a DAQ system on PV modules made of different technologies, which are recorded simultaneously and continuously in real-time. Before the start of the fast PV power emulation process, measurements taken from the DAQ system referring to PV modules need to be adjusted to PV plant configuration by the algorithm for filtering measurement data. After that, programmable DC power supplies use commands in order to generate
i–v characteristics of PV arrays. Programmable DC power supplies use an AC distribution network to generate DC output.
The PV plant inverter connected to the output of programmable DC power supplies is equipped with Maximum Power Point Trackers (MPPT), which extract the maximum output power of PV arrays generated by programmable DC power supplies. It converts the PV array DC power supplied by programmable DC power supplies back to AC power. The efficiency of this system is up to 95%, since most of the energy used for generating the DC power of PV arrays is supplied back to the AC distribution grid. The only energy losses occurring in this process are created by nonideal MPPTs of the PV plant inverter and power conversion losses occurring in the power electronic switching components.
3. Data Acquisition System with the Database
Measurement data used for fast PV power emulation are obtained by the DAQ system developed by the Laboratory for Renewable Energy Sources at the Faculty of Electrical Engineering, Computer Science and Information Technology (FERIT) Osijek [
26]. The DAQ system simultaneously and continuously measures electrical output parameters of the 10 kWp power plant and five PV modules made of different technologies and meteorological parameters at the test site. The PV plant and modules are installed on the roof of FERIT Osijek building, with a tilt angle of 7°. Measurement data are stored in the local and the cloud database for further analysis. Currently, the database contains measurement data obtained by continuous measurements since March 2017.
This paper uses measurements of the power output of PV modules connected to micro grid-tie inverters. Inverters are equipped with MPPTs which extract maximum DC power from the PV module and then, convert it to AC power injected into a 230 VAC, 50 Hz distribution network. The PV modules under study are as follows: monocrystalline silicon (m-Si) Bisol BMO 250, polycrystalline silicon (p-Si) Bisol BMU 250, amorphous silicon (a-Si) Masdar MPV100-S, copper–indium–selenide (CIS) Solar Frontier SF150-S, and heterojunction with intrinsic thin layer (HIT) Panasonic VBHN240SE10. Technical characteristics of PV modules under study that are used for analysis in this paper are given in
Table 1.
A schematic diagram of the DAQ system used for measuring the PV module’s electrical output analyzed in this paper is given in
Figure 2. Five PV modules made of different technologies installed on the roof, a pyranometer for solar irradiance measurements, and PV module micro grid-tie inverters can be seen in
Figure 3. The system measures the output DC current and output DC voltage of each PV module under study. Measurements are recorded every second and sent to the microcontrollers, which process the data further. After that, the data are sent to the main PC, which averages the measurements over a one-minute period and stores the data both locally and in a cloud database. Furthermore, every second, the DAQ system also measures meteorological data such as solar irradiance, ambient temperature, and cell temperatures of the PV modules, but that will not be the focus of this paper. A detailed description of the DAQ system can be found in [
32].
4. A Developed Approach to Fast PV Power Emulation
The process of fast PV power emulation is described in this section. An algorithm developed for determining PV plant configuration is described in the first subsection, which is a precondition for the second algorithm developed for fast PV power emulation measurement data filtering. In the last part of the section, fast PV power emulation validation indices are defined.
4.1. PV Plant Configuration Determination
The fast PV power emulation process begins with determining PV plant configuration. A system developed for fast PV power emulation in this paper assumes that a PV plant consists of the same nominal output power PV arrays (the same number of PV modules). These PV arrays consist of series-parallel combinations of PV modules. Furthermore, it is assumed that every PV module in a PV array has identical characteristics, while line losses between PV modules are neglected.
Figure 4 shows the algorithm for determining PV array configuration, which is used in the system developed for fast PV power emulation.
The algorithm starts with the selection of the PV module (technology) followed by the input of the desired nominal output power of the PV plant
Pnom and the number of PV arrays
i. If the desired nominal output power exceeds the limitations of the equipment (DC programmable power supplies or the PV plant inverter) determined by
Pmax_emul, the algorithm redirects back to determining the nominal output power of the PV plant until this condition is satisfied. The next step is to determine the nominal output power of the PV array
Parray by dividing
Pnom with the number of PV arrays
i, which is determined by the number of inputs of the PV plant inverter. The number of modules in a PV array
n is calculated as the floor function of the
Parray and
Pmod_nom quotient, since this number must be an integer. Next, the algorithm calculates the number of parallels
p and the number of modules in one parallel
m, i.e., PV array configuration. For a better understanding, a visual representation of PV array topology and corresponding variables calculated by the proposed algorithm
n,
m, and
p is given in
Figure 5.
Calculation of the number of parallels p and the number of modules in one parallel m is constrained by the following conditions:
The open-circuit voltage of the PV array at standard test conditions (STC) UOC_array, calculated as the product of m and the PV module open-circuit voltage at STC UOC_mod, must be equal to or lower than the maximum output voltage of the DC programmable power supply and the maximum input voltage of the PV plant inverter UOC_max.
The maximum power point (MPP) array voltage at STC UMPP_array, calculated as the product of m and the MPP module voltage at STC UMPP_mod, must be within the MPPT operating range of the PV plant inverter, where UMPP_min is the minimum, while UMPP_max is the maximum MPP voltage.
The short-circuit current of the PV array at STC ISC_array, calculated as the product of p and the short-circuit current of the PV module at STC ISC_mod, must be equal to or lower than the maximum output current of the DC programmable power supply and the maximum input current of the PV plant inverter ISC_max.
At the end of the algorithm, new nominal output power of the PV array Parray is calculated, since integer division is performed and the remainder is neglected; therefore, this value can be different than the one originally determined by dividing Pnom by i.
4.2. Measurement Data Filtering for Fast PV Power Emulation
The next step of the fast PV power emulation process is measurement data filtering, aimed at satisfying all constraints imposed by PV emulation system equipment (a DC programmable power supply and a PV plant inverter). The algorithm starts with the selection of the measurement day with
j samples, which is imported from the DAQ system described in
Section 3. The number of samples (current and voltage values of the
i–v array characteristic)
j in a chosen day should meet the constraint of the number of commands that can be executed by the DC programmable power supply, given with variable
jmax; thus, measurement data should have as many time points as the DC programmable power supply can execute commands. This means that each sample represents the mean value of a certain parameter for the time period
t, consequently enabling the fast PV power emulation process.
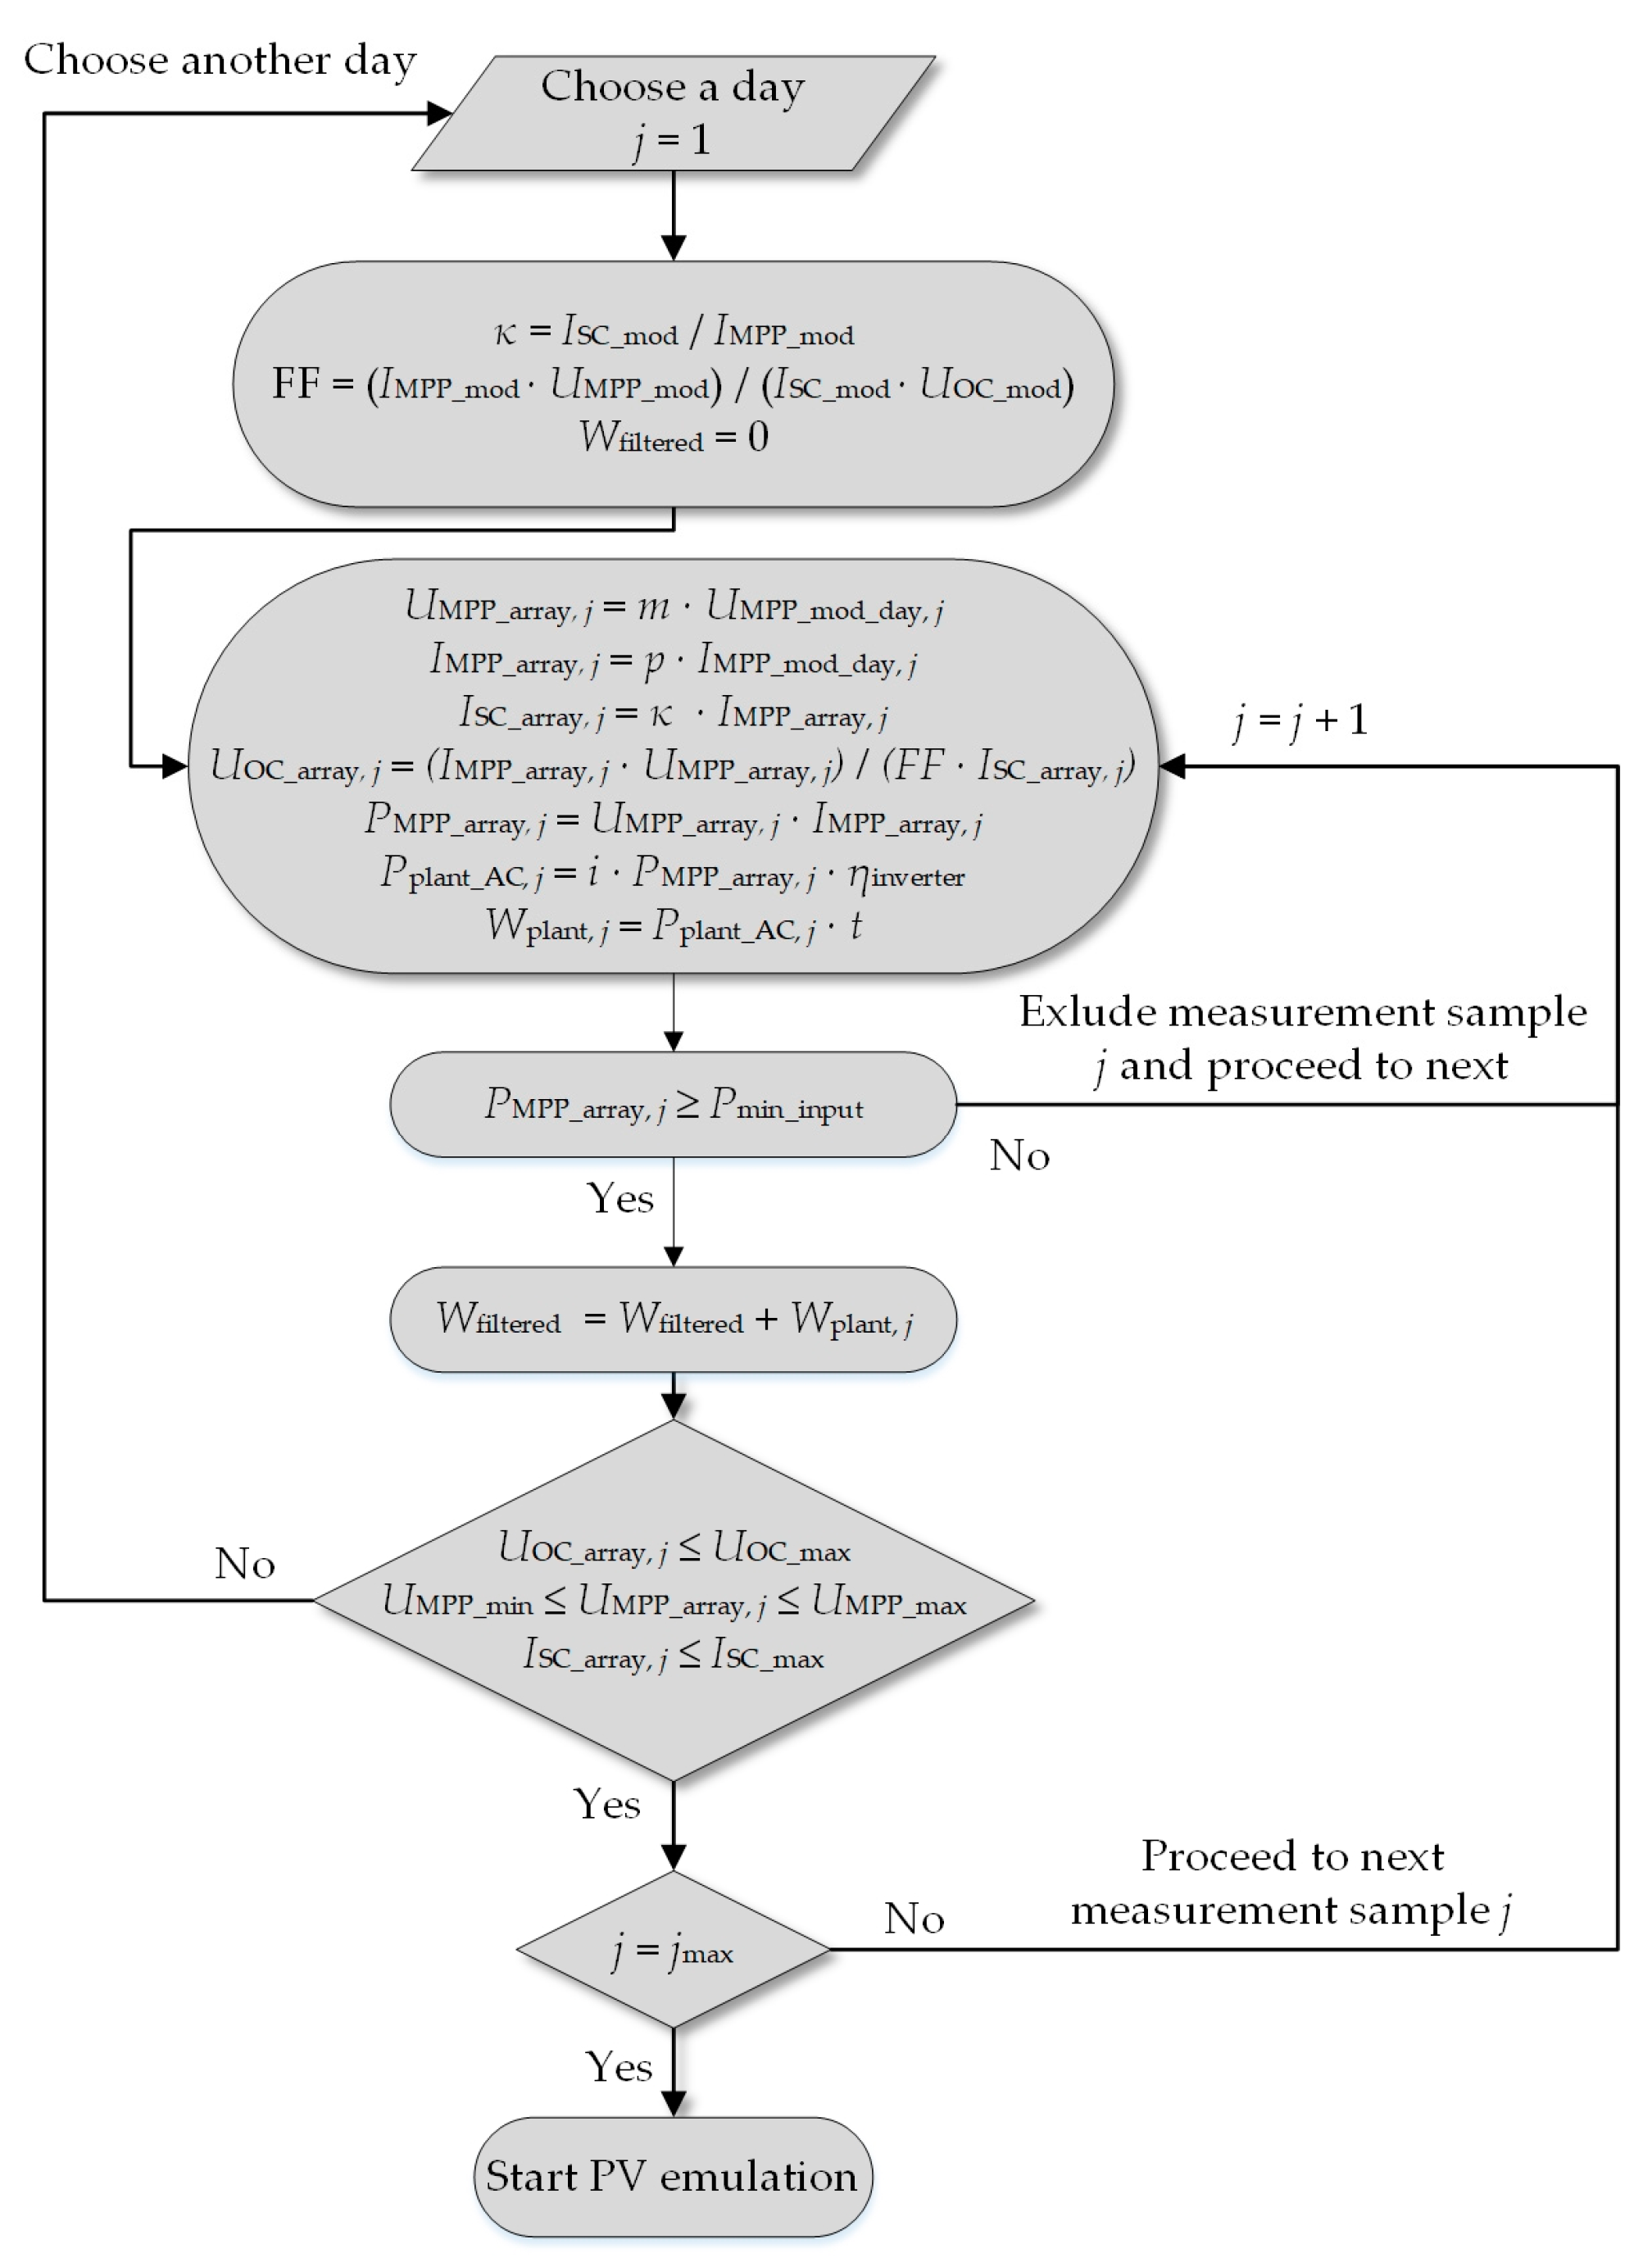
Figure 6 shows the algorithm for the measurement data filtering process used in the system developed for fast PV power emulation.
Since the DAQ system records only the MPP voltage and the current determined by the operating point of the PV module, coefficients κ and FF are determined to calculate the open-circuit voltage UOC_array, j and the short-circuit current ISC_array, j of the PV array for every measurement sample j, which are mandatory operating points for the input of i–v characteristics into DC programmable power supplies. Coefficient κ is determined by dividing the short-circuit current of the PV module at STC ISC_mod by the MPP current of the PV module at STC IMPP_mod, as given in (1). This ratio is considered as a constant, since the most important operating point for the DC programmable power supply is the MPP and this assumption does not affect the emulation accuracy significantly.
Furthermore, the fill factor
FF is calculated with the PV module manufacturer data given in the datasheet for STC in order to calculate the open-circuit voltage of the PV array
UOC_array, j, as given in (2). The MPP array voltage for the measurement sample
j,
UMPP_array, j, is calculated as the product of
m and the MPP voltage of the PV module measured by the DAQ system
UMPP_mod, j. An analogy can be drawn for the calculation of the MPP current of the PV array for the measurement sample
j; only the number of parallels
p is used. Upon the calculation of
UOC_array, j,
ISC_array, j,
UMPP_array, j, and
IMPP_array, j, the algorithm calculates output power of the PV array
PMPP_array, j, AC output power of the PV plant
Pplant_AC, j, and electricity generation of the PV plant
Wplant, j for the measurement sample
j, where
ηinverter is the efficiency of the PV plant inverter.
Before the algorithm proceeds to the next measurement sample j, it checks if the PV array output power PMPP_array, j is greater than the minimum value (threshold) of input DC power per array that should be produced by the PV array in order for the PV plant inverter to start converting DC to AC power, defined by Pmin_input. If it is not, the measurement sample is excluded from data filtering. This constraint excludes measurements at nighttime. Furthermore, the algorithm checks if the calculated data are within limits with respect to the following:
The maximum output voltage of the DC programmable power supply and the maximum input voltage of the PV plant inverter UOC_max.
The MPPT voltage operating range of the PV plant inverter given by UMPP_min and UMPP, max.
The maximum output current of the DC programmable power supply and the maximum input current of the PV plant inverter ISC_max.
If the constraints are not satisfied, the algorithm returns to the selection of the day and the process starts again. If the constraints are fulfilled, the algorithm proceeds to the next measurement sample j until all measurement samples in a day are processed and total daily electricity generation by the PV plant Wfiltered is calculated. The PV emulation process is initiated in the last step of the algorithm.
4.3. Fast PV Power Emulation Validation
After the fast PV power emulation process is performed, the developed system extracts the output power of the PV plant inverter
Pinverter, j for each measurement sample
j and calculates the real electricity generation of the PV plant during the fast PV power emulation process
Winverter, as given in (3). Furthermore, the system extracts electricity generation measured by the electricity meter
Wcounter in order to validate the accuracy of electricity generation measured by the inverter
Winverter. Due to time scaling, electricity generation measured by the electricity meter
Wcounter should also be recalculated into a new parameter
Wmeter, as given in (4).
where:
Wmeter—a recalculated value of electricity generation measured by the electricity meter;
t—time interval of each measurement sample j;
tc—time duration of one command (60 s).
Finally, percentage errors
δemulated and
δmeter can be calculated as in (5) and (6) in order to evaluate the accuracy of the fast PV power emulation process.
5. Fast PV Power Emulation Results and Analysis
The system developed for fast PV power emulation is tested and the results are analyzed for two different PV plants with respect to their PV technology and nominal output power. The first case study refers to three PV plants with nominal output power of 6 kW made of a-Si Masdar MPV100-S, CIS Solar Frontier SF150-S and HIT Panasonic VBHN240SE10 PV modules, whereas the second case study refers to two PV plants with nominal output power of 12 kW made of m-Si Bisol BMO 250 and p-Si Bisol BMU 250 PV modules.
5.1. Fast PV Power Emulation Equipment Settings
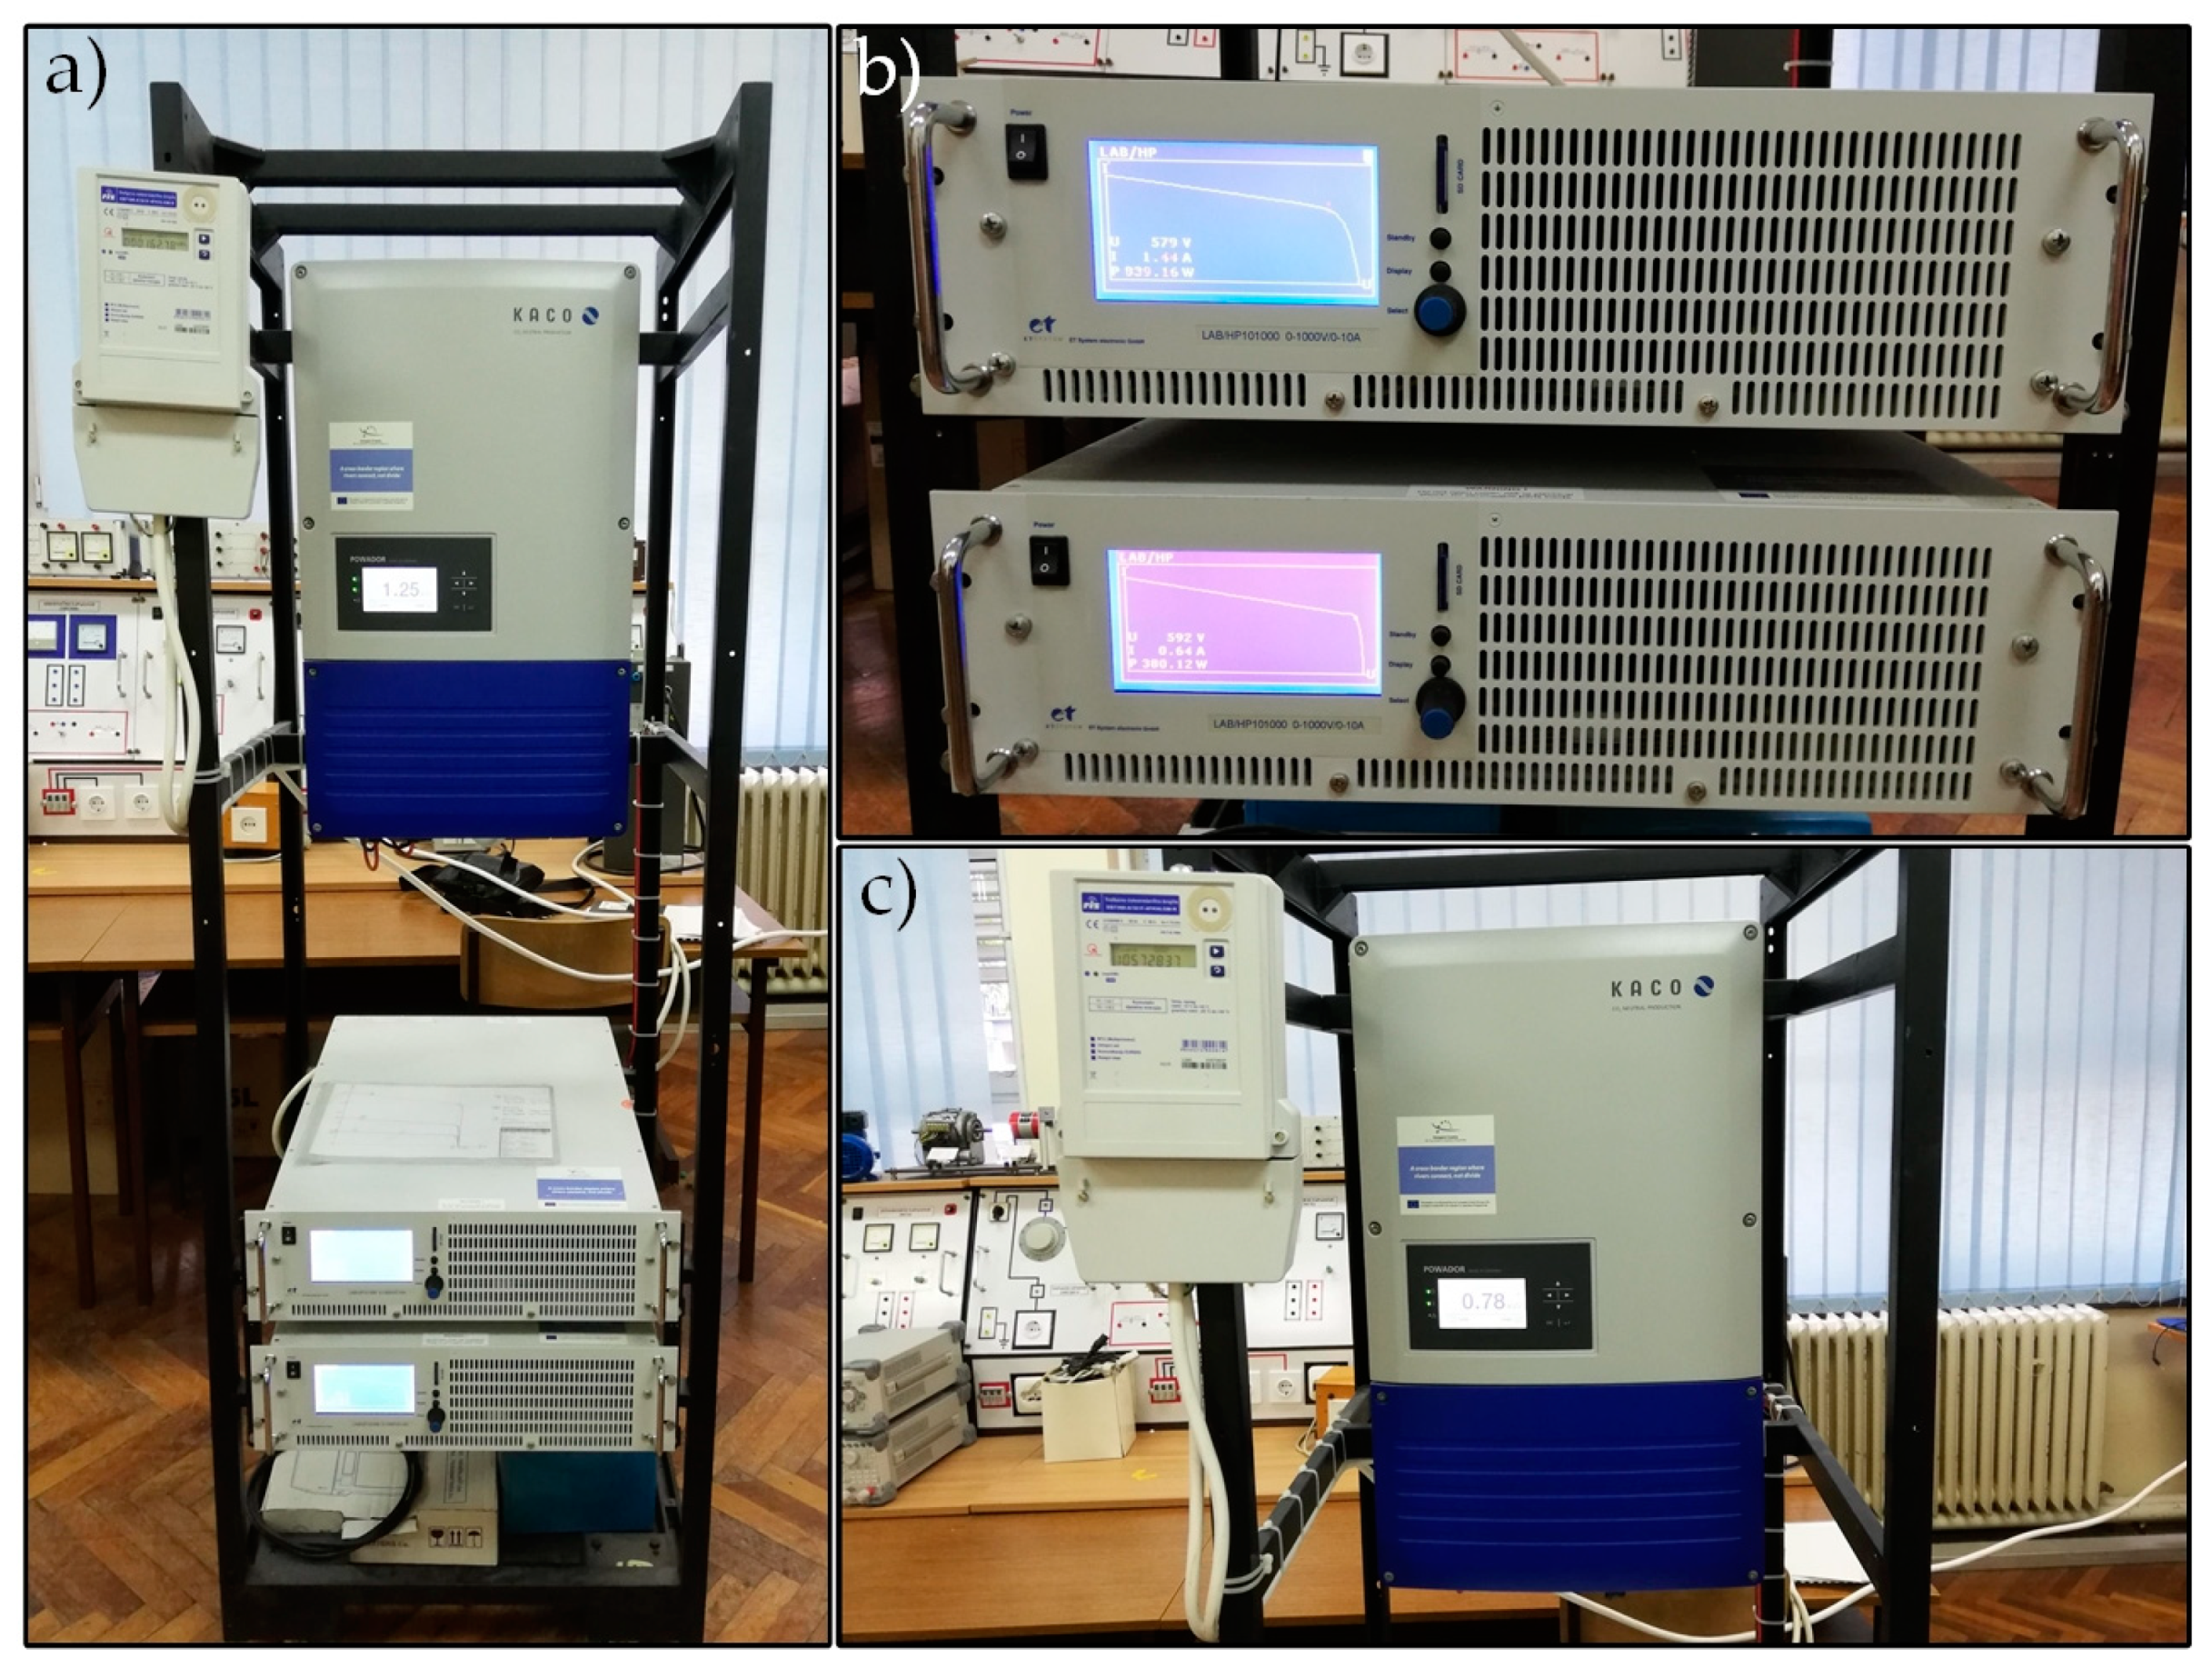
Fast PV power emulation is performed in the Power Electronics Laboratory at FERIT Osijek. The laboratory is equipped with a PV emulation system that consists of two DC programmable power supplies, a PV plant inverter, and a digital electricity meter, which can be seen in
Figure 7.
Table 2 shows only technical parameters of the PV plant inverter Kaco Powador 12.0 TL3 and DC programmable power supplies LAB/HP 101000, which are used in this paper for the purpose of analysis. Each DC programmable power supply represents a single PV array.
In the emulation process, the
PVsim mode and script mode of the DC programmable power supplies are used. The
PVsim mode allows input of the PV
i–v characteristic by four parameters: the open-circuit voltage, the short-circuit current, the MPP voltage, and the MPP current. Script mode enables control of the unit by the commands loaded from an SD card in the form of a script. The maximum number of commands that can be entered into one PV emulation system through the SD card slot is 35. The maximum duration of one command is limited to 65,536 ms [
34].
When the fast PV power emulation process starts, the PV plant inverter starts a self-test process, which lasts 65 s, to become synchronized with the AC distribution grid. In order to avoid measurement error, which would arise if this constraint were neglected, a 65 s lasting compensation command is executed at the beginning of the PV emulation script. Furthermore, during the fast PV power emulation process, it was noticed that the PV plant inverter needs the minimum power of 100 W as a threshold of DC power per input, in order for the PV plant inverter to start converting DC power into AC power, which is also defined by the parameter Pmin_input in the algorithm.
Furthermore, it is observed that at the beginning of the fast PV power emulation process, the operating point of the PV arrays is not in the MPP. This is a result of the MPPT circuit inertia (sluggishness), which cannot set an operating point of the PV arrays immediately into the MPP at the beginning of their operation. The maximum time duration of the operating point set into the MPP by the MPPTs is determined by trial-and-error emulations and is 6 min. For the purpose of compensating for this behavior, an additional five compensation commands lasting 60 s each are executed at the beginning of the PV emulation script along with one compensation command executed due to the PV plant inverter self-test.
Due to six compensation commands executed at the beginning of every PV emulation script, the maximum number of real PV emulation commands decreased from 35 to 29. In every fast PV power emulation process, every command duration is set to 60 s. This means that the results obtained after performing fast PV power emulation need to be recalculated due to time scaling, as given in (3) and (4). Each fast PV power emulation process is performed three times with the same methodology in order to check the reproducibility of results.
5.2. Fast PV Power Emulation of a 6 kW PV Plant
Fast PV power emulation of the 6 kW PV plant is performed for PV plants made of a-Si Masdar MPV100-S, CIS Solar Frontier SF150-S and HIT Panasonic VBHN240SE10. PV plant array configurations for a-Si Masdar MPV100-S, CIS Solar Frontier SF150-S, and HIT Panasonic VBHN240SE10 are given in
Table 3. Configurations of PV plant arrays made of a-Si Masdar MPV100-S and CIS Solar Frontier SF150-S are determined by means of the algorithm described in
Section 4.1, while configuration of PV plant arrays made of HIT Panasonic VBHN240SE10 PV modules is slightly modified, since PV arrays have a different number of PV modules (13 and 12 PV modules) in order to satisfy nominal output power of 6 kW.
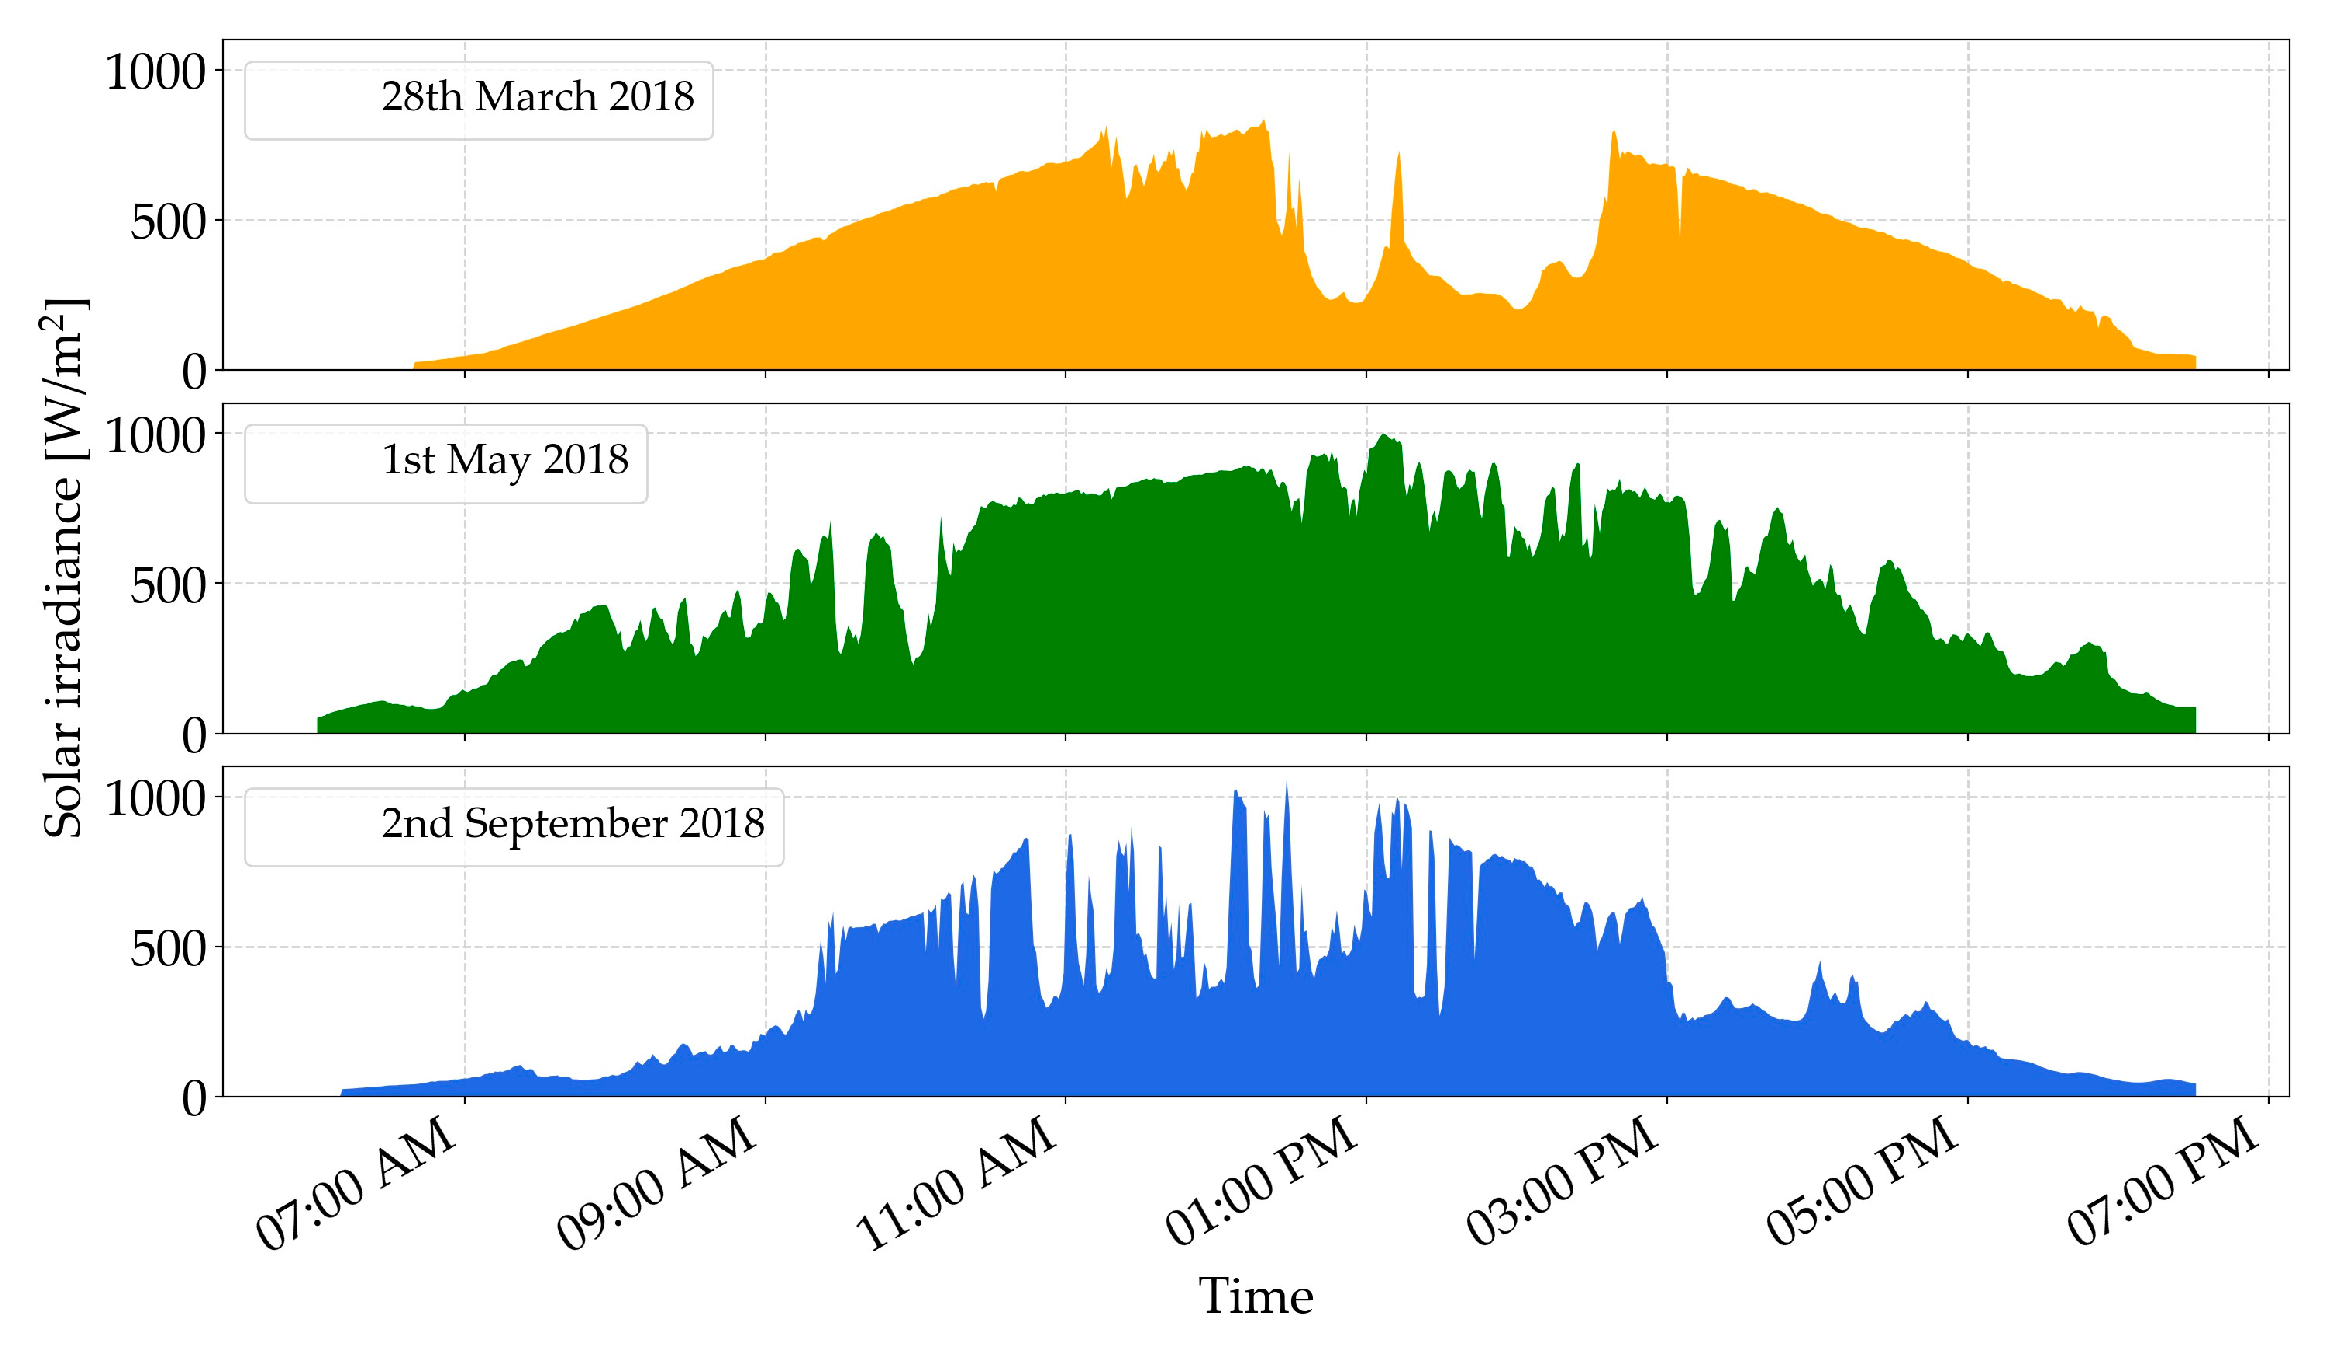
The fast PV power emulation process is performed for 28 March 2018, 1 May 2018, and 2 September 2018, for which solar irradiance profiles are given in
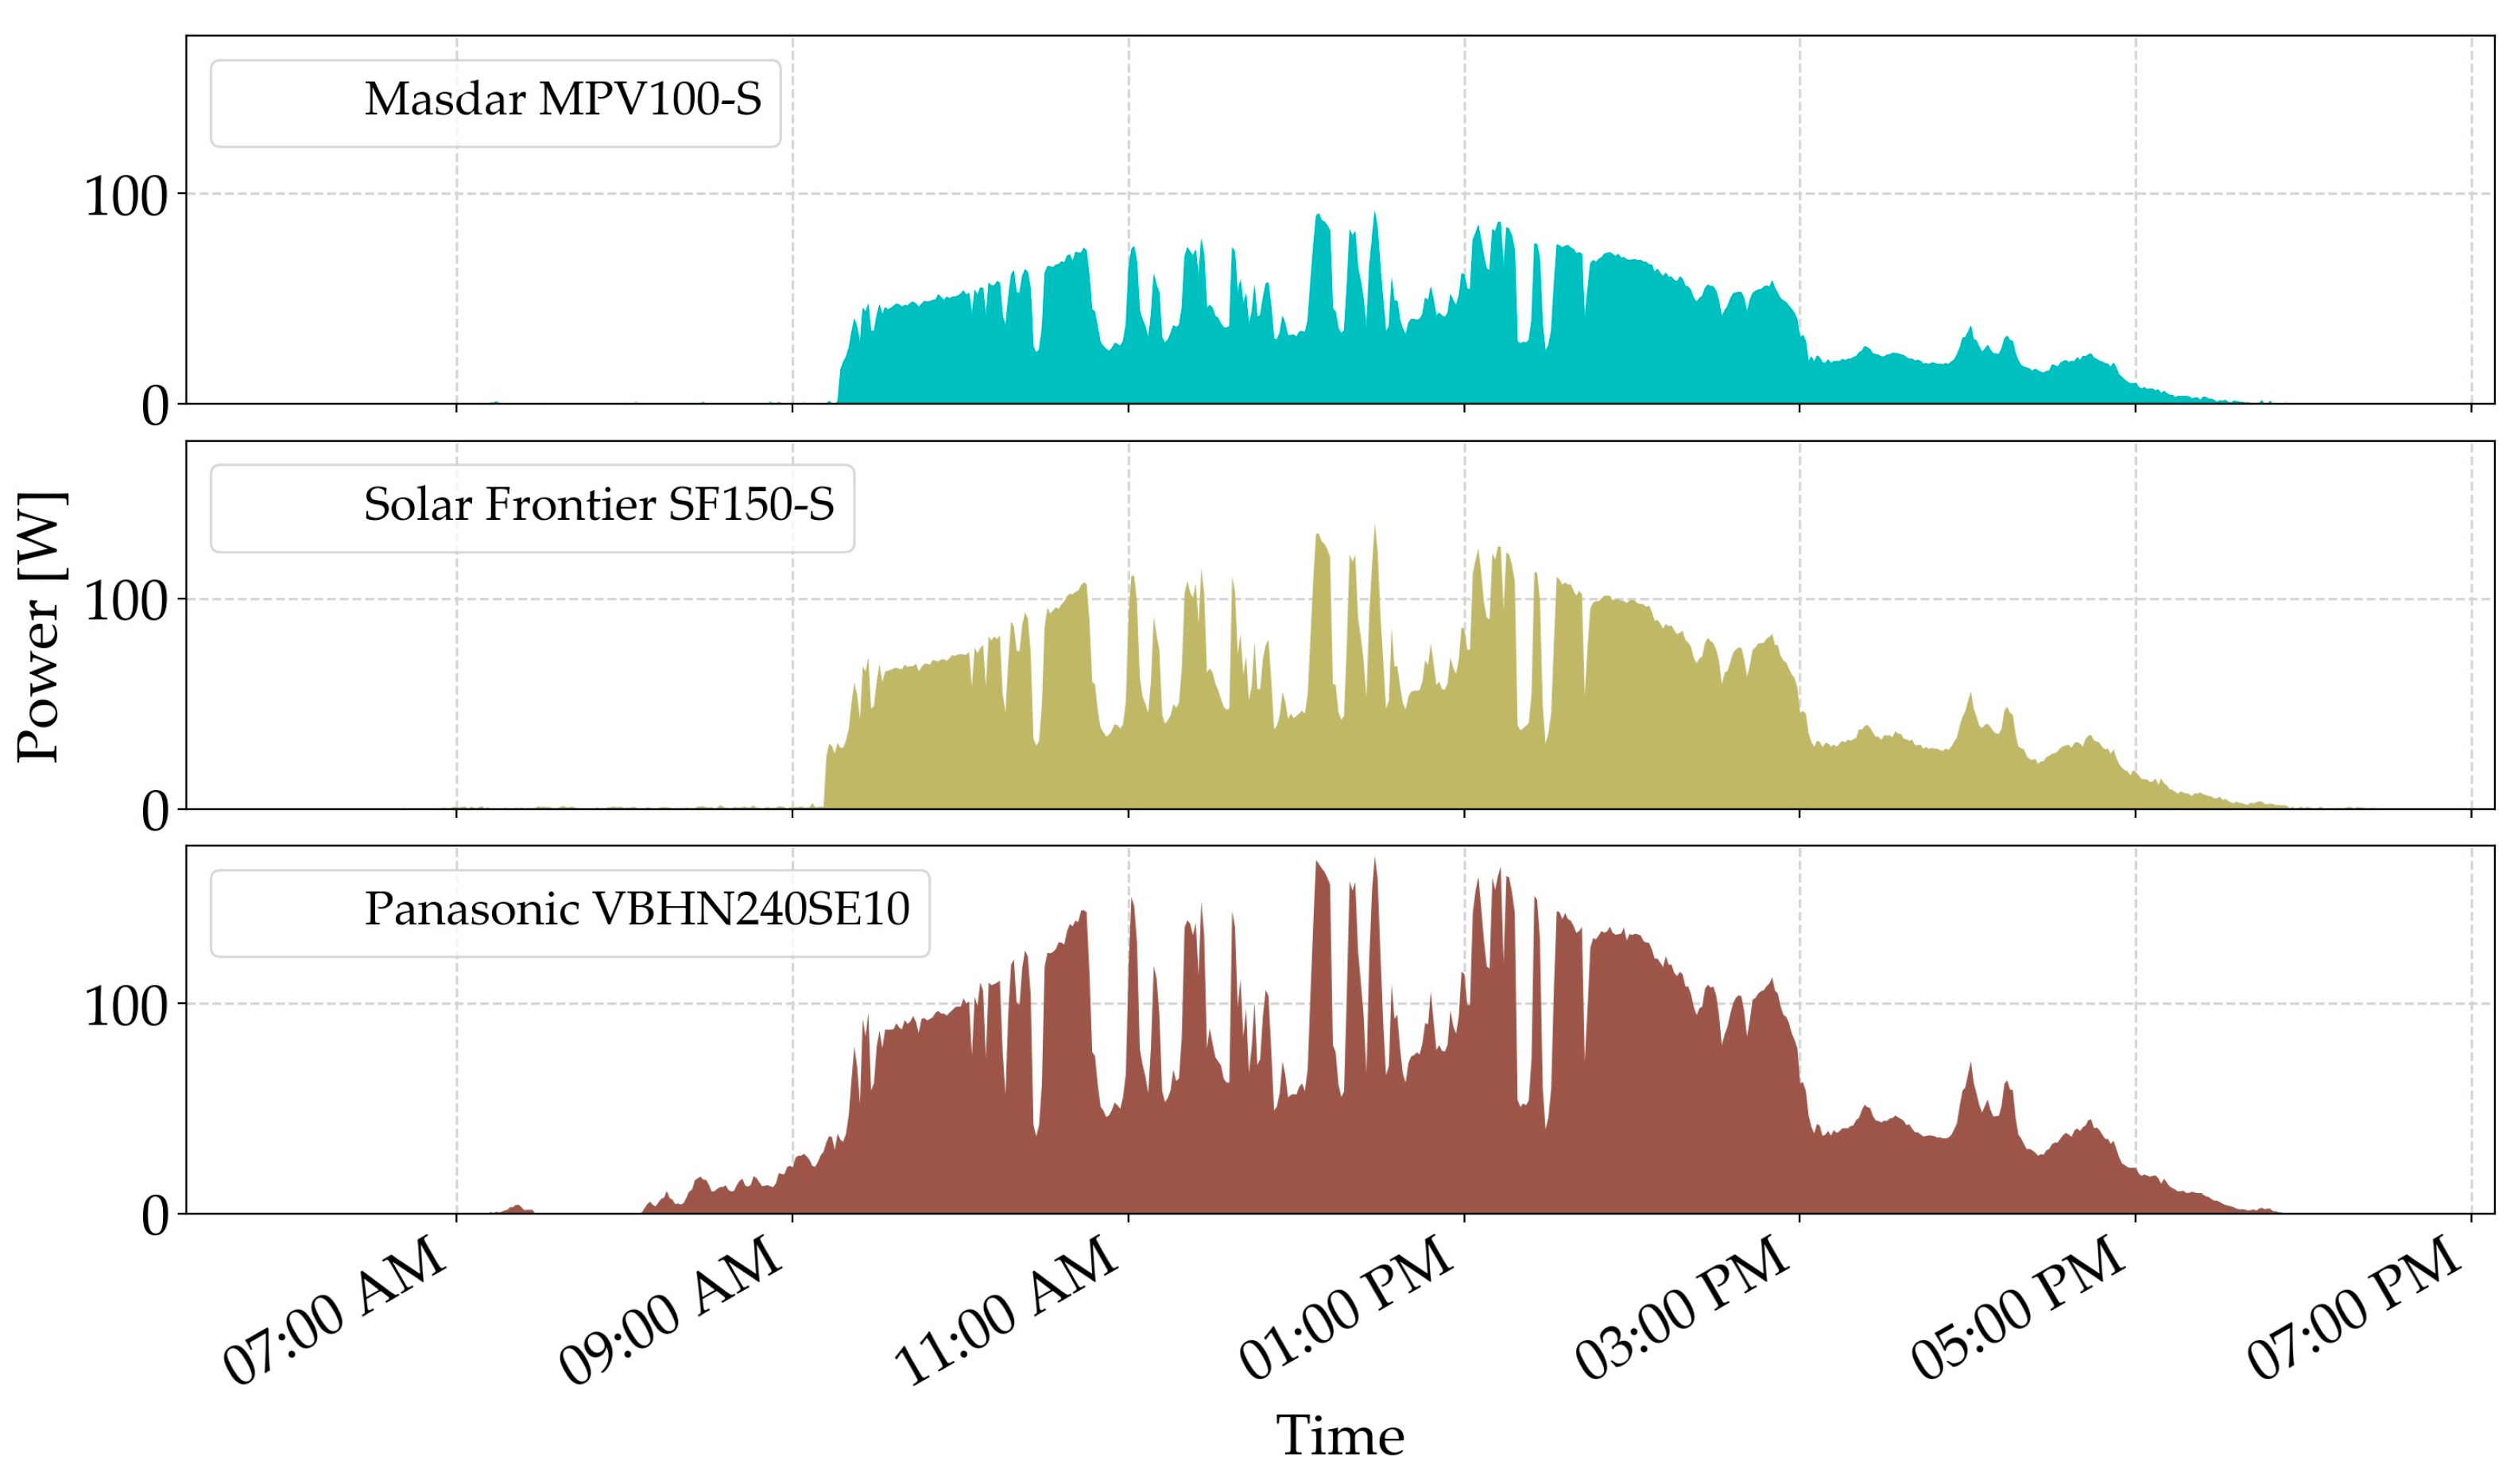
Figure 8. The process of fast PV power emulation is described in detail only for 2 September 2018. One-minute average values of output power of the a-Si Masdar MPV100-S, Solar Frontier SF150-S, and HIT Panasonic VBHN240SE10 PV modules on 2 September 2018 are given in
Figure 9.
In order to satisfy the maximum number of commands that can be entered into the DC programmable power supply and the minimum input DC power per array that should be produced in order for the PV plant inverter to start working (parameter Pmin_input), each measurement sample j extracted from the DAQ system represents a 30-min average value of a certain parameter, resulting in a total number of 24 commands, 18 j measurement samples and 6 compensation commands. This means that fast PV power emulation with known current and voltage values of i–v characteristics of the array obtained by various module technologies can make an estimation of electricity generation of the PV plant in approximately 25 min.
Table 4 shows data extracted from the PV plant inverter after fast PV power emulation of the 6 kW PV plant made of Masdar MPV100-S PV modules and AC output power of the PV plant entered into DC programmable power supplies
Pplant_AC, j for each measurement sample (command)
j.
In addition, fast PV power emulation results are given in
Figure 10, which shows a comparison of AC output power of the PV plant entered into DC programmable power supplies
Pplant_AC, j and AC output power of the PV inverter
Pplant_AC, j for each measurement sample
j.
Table 5,
Table 6 and
Table 7 show the results of fast PV power emulation of the 6 kW PV plant for 2 September 2018, 28 March 2018, and 1 May 2018.
The results given in
Table 5,
Table 6 and
Table 7 show technically acceptable errors
δemulated and
δmeter for every day emulated. The days with sudden and pronounced changes in solar irradiation, i.e., partially cloudy days (
Figure 8), were deliberately selected to test the most severe cases given the limitations imposed by electronic equipment. The maximum value of percentage errors, i.e., 6%, was recorded for the third day, which is technically acceptable for daily based emulation.
5.3. Fast PV Power Emulation of a 12 kW PV Plant
The second case study is fast PV power emulation of a 12 kW PV plant performed for PV plants made of m-Si Bisol BMO 250 and p-Si Bisol BMU 250. Configurations of PV plant arrays made of m-Si Bisol BMO 250 and p-Si Bisol BMU 250 are given in
Table 8. Configurations of PV plant arrays are determined by means of the algorithm described in
Section 4.1.
The fast PV power emulation process is performed for 4 June 2017, for which the solar irradiance profile is given in
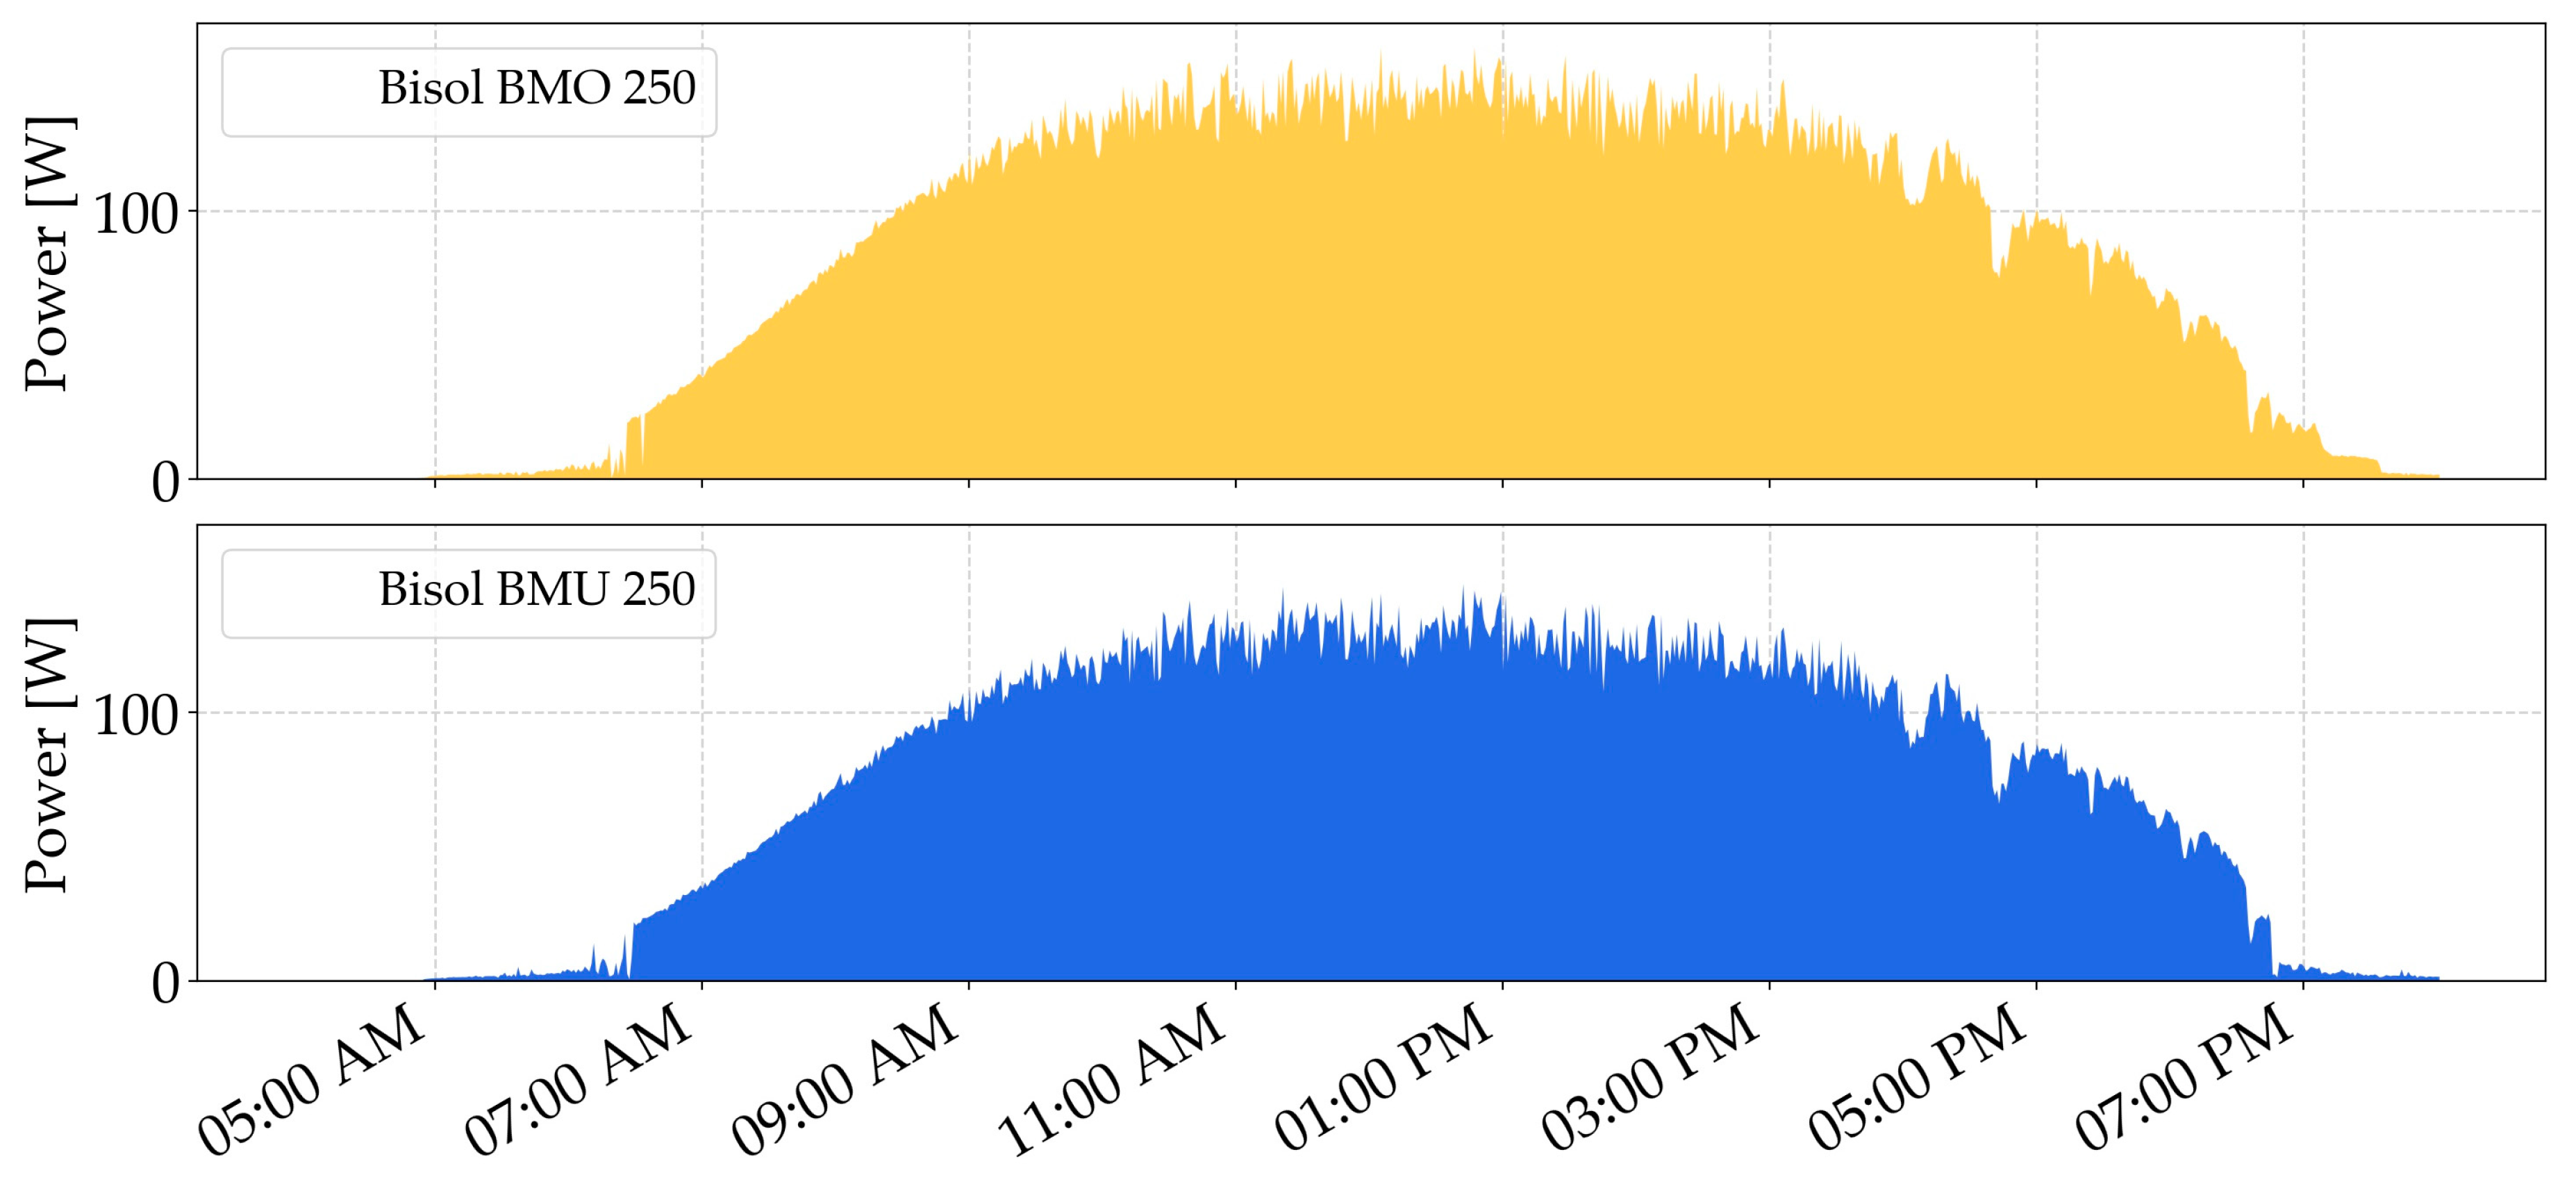
Figure 11. One-minute average values of output power of m-Si Bisol BMO 250 and p-Si Bisol BMU 250 PV modules on 4 June 2017 are given in
Figure 12. In order to satisfy the maximum number of commands that can be entered into DC programmable power supplies and the minimum input DC power per array that should be produced in order for the PV plant inverter to start working (parameter
Pmin_input), each measurement sample
j extracted from the data acquisition system represents a 30-min average value of a certain parameter resulting in a total number of 29 commands, 23
j measurement samples and 6 compensation commands.
According to
Figure 11, a day with no sudden changes in solar radiation, i.e., a sunny day for the second PV power plant, is deliberately selected to evaluate the fast PV power emulation process. The percentage error was expected to be smaller in comparison to the 6 kW PV plant case. Therefore, only one day was chosen, unlike the previous case when three days were selected. As expected for a sunny day, the percentage errors (
δemulated and
δmeter) are significantly reduced compared to days with a sudden change in solar radiation—a maximum of 2% (
Table 9). The evaluations carried out for both cases indicate that with the data collected from only one module, fast PV power emulation can be used to estimate electricity generation from PV power plants based on PV modules made of different technologies. Depending on the number of commands, each fast PV power emulation takes up to a maximum of 30 min, which is required to estimate a one-day PV power plant electricity generation.
6. Conclusions
An advanced fast PV power emulation technique, called fast PV power emulation of PV plants based on different module technologies and different peak power, is proposed. The algorithm for selecting the number of modules for the desired nominal (peak) power of a PV power plant is elaborated in detail, depending on technical characteristics of the selected modules. An algorithm for filtering data collected from modules of different technologies has also been developed, considering the limitations of programmable sources as well as the limitations of the PV inverter.
Fast PV power emulation of PV plants shortens the time required for emulation in comparison to standard PV emulation. The fast PV power emulation process is demonstrated for two case studies, i.e., one for a 6 kW PV plant made of a-Si Masdar MPV100-S, CIS Solar Frontier SF150-S, and HIT Panasonic VBHN240SE10 PV modules, and the other for a 12 kW PV plant made of m-Si Bisol BMO 250 and p-Si Bisol BMU 250. The results indicate that the fast PV power emulation procedure can estimate one-day PV power plant operation in 30 min maximum. A prerequisite for carrying out fast PV power emulation is the i–v characteristics of the PV arrays obtained in our work by collecting current and voltage values from a single PV module of each technology, even though other methods are available. Percentage errors as indicators of the performed fast emulation accuracy for a partially cloudy day with variable (intermittent) solar radiation and for a sunny (clear sky) day are 6% and 2%, respectively, i.e., they are acceptable for PV power plant emulation on a daily basis.
Furthermore, the developed fast PV power emulation procedure has high efficiency of up to 95%, since most energy used for generating PV array DC power is supplied back to the AC distribution grid by the PV plant inverter. Energy losses occurring in this process are created by nonideal MPPTs of the PV plant inverter and switching losses in power electronic circuit components.


