Abstract
The global occurrences of natural gas hydrates lead to the conclusion that tremendous amounts of hydrocarbons are bonded in these hydrate-bearing sediments, serving as a potential energy resource. For the release of the hydrate-bonded CH4 from these reservoirs, different production methods have been developed during the last decades. Among them, the chemical stimulation via injection of CO2 is considered as carbon neutral on the basis of the assumption that the hydrate-bonded CH4 is replaced by CO2. For the investigation of the replacement process of hydrate-bonded CH4 with CO2 on a µm-scale, we performed time-resolved in situ Raman spectroscopic measurements combined with microscopic observations, exposing the CH4 hydrates to a CO2 gas phase at 3.2 MPa and 274 K. Single-point Raman measurements, line scans and Raman maps were taken from the hydrate phase. Measurements were performed continuously at defined depths from the surface into the core of several hydrate crystals. Additionally, the changes in composition in the gas phase were recorded. The results clearly indicated the incorporation of CO2 into the hydrate phase with a concentration gradient from the surface to the core of the hydrate particle, supporting the shrinking core model. Microscopic observations, however, indicated that all the crystals changed their surface morphology when exposed to the CO2 gas. Some crystals of the initial CH4 hydrate phase grew or were maintained while at the same time other crystals decreased in sizes and even disappeared over time. This observation suggested a reformation process similar to Ostwald ripening rather than an exchange of molecules in already existing hydrate structures. The experimental results from this work are presented and discussed in consideration of the existing models, providing new insights on a µm-scale into the transformation process of CH4 hydrates to CO2-rich mixed hydrates.
1. Introduction
Natural gas hydrates are non-stoichiometric crystalline inclusion compounds where the hydrogen-bonded water molecules form a three-dimensional framework of water cavities. The cavities are stabilized by hosting guest molecules (e.g., methane, ethane, carbon dioxide, hydrogen sulfide or other hydrocarbons) of suitable sizes and shapes [1]. Natural gas hydrates occur at all active and passive continental margins, permafrost regions and also in deep lakes such as Lake Baikal [2]. The widespread global occurrence and the high energy density of natural gas hydrates lead to the assumption that large amounts of natural gas, predominantly CH4, are stored in natural gas hydrate deposits/reservoirs [3,4,5]. Motivated by their potential as a future energy source, exploration and production of CH4 from natural gas hydrates are attracting considerable attention.
The main technologies tested during the last decades for the productions of gas from hydrate-bearing sediments were (1) depressurization [6,7,8,9], (2) thermal stimulation [10,11,12], and (3) chemical stimulation via injection of chemical inhibitors (such as salts or alcohols) [13,14], or a combination of these techniques [15,16]. For the conventional methods, natural gas hydrates dissociate in response to the pressure–temperature conditions being shifted outside of the hydrate stability zone [17]. Although these methods have been successfully employed to produce gas from marine or permafrost hydrates, there are still some concerns of decomposing natural gas hydrates based on these stimulations. One important aspect that needs to be accounted for is the change in the mechanical properties of the hydrate-bearing sediments as a result of hydrate dissociation, which may trigger slope instability and subsidence [18,19].
Another technology for the production of gas from natural gas hydrates is a variant of chemical stimulation, namely, the injection of CO2. In this scheme, the chemical disequilibrium between the initial CH4 hydrate and the CO2 gas phase induces the transformation of the original CH4 hydrate into a CO2-rich hydrate. Ideally, this process may not result in a dissociation of the hydrate phase, but a replacement of the hydrate-bonded CH4 with CO2 molecules and thus resulting in the production of CH4 and simultaneously the capturing of CO2 in the hydrate phase. In addition, CO2 is thermodynamically favored in the hydrate phase compared to CH4 at relevant conditions and they both form a structure I hydrate [2], as do mixtures of these gases [20]. Hence, this gas replacement strategy may be considered as an emission-free approach, with higher stability of the hydrate-bearing sediments and reduced geo-hazards [21,22].
During the past decades, efforts have been made on experimental studies to investigate the kinetics of CH4–CO2 swapping. Lee et al. [23] investigated hydrate samples prepared from powdered ice (the particle size of the ice and resulting hydrates were 5–50 μm) in porous silica gel (pore size 15 nm). They injected gaseous CO2 into the CH4 hydrate phase and observed the establishment of a steady state after 5 h with a CH4 recovery rate of about 50%, which indicated a mixed hydrate phase with a 50/50 ratio of CO2/CH4. Similar results were observed by Schicks et al. [24], who also formed a CH4 hydrate from powdered ice with a particle size of <10 μm in a small pressure cell (~400 µL) and exposing the CH4 hydrate phase to a continuous CO2 gas flow. Raman spectroscopic measurements indicated the transformation of the initial CH4 hydrate phase into a mixed hydrate phase with the large 51262 cavities partly filled with CO2 and CH4 and the small 512 cavities filled with CH4. After 116 h, the gas incorporated into the mixed hydrate phase was composed of 50% CO2 and 50% CH4, indicating that 50% of the CH4 was released from the initial CH4 hydrate phase. These are two examples carried out with gaseous CO2, but in the first example a porous medium was used, which may have had an effect on the kinetics of the transformation process. This indication is also given when researchers applied liquid CO2 to prove the feasibility of replacing CH4 in hydrates, as the following examples might show. Hirohama et al. [25] filled about 560 mL of water (31 mol) into a pressure vessel, pressurized the cell with CH4 and converted 24 mol of the water into a bulk CH4 hydrate phase. Thereafter, the CH4 gas phase was replaced by liquid CO2, which induced the conversion of the remaining free water phase (7 mol) into CO2 hydrate. In addition, they observed the transformation of about 15% of the initial CH4 hydrate into CO2 hydrate after 800 h. A higher conversion rate was observed by Ota et al. (2005) [26], who conducted similar experiments but on a smaller scale. They formed CH4 hydrates from 1.05–1.38 mol water and the CH4 hydrate phase was exposed to liquid CO2. The results indicated that after 307 h the mole fraction of CH4 in the hydrate phase reached 0.65. The authors assumed that the CH4 hydrate decomposed and they observed that the amount of decomposed CH4 hydrate was almost the same as that of the formed CO2 hydrate. They suggested that the released CH4 transferred into the liquid CO2 phase was re-occupied into the small cavities again, whereas the CO2 molecules were incorporated into the large cavities. Zhou et al. [27] conducted the replacement of CH4 by use of liquid CO2 under the same conditions as in Ota’s experiment. The recovery ratio was about 18.6% after 96 h. However, when porous media were added, the recovery ratio of CH4 could be increased to approximately 45% after 288 h under otherwise identical conditions as reported by Xiong et al. [28]. The effect was even more pronounced when sandstone cores were used: Ersland et al. [19] investigated the swapping process on hydrates in the pores of sandstone cores. After the CH4 hydrate formation, the core was exposed to liquid CO2. Within 300 h up to 60% of the CH4 was recovered from the hydrate phase. Besides the effects from sediments, additional heat supply can help overcome the mass transfer limitations and thus improve the efficiency of the transformation process, as observed by Deusner et al. [29]. They investigated the production of CH4 hydrates in quartz sand with pure ice by injecting hot supersaturated CO2 at 368.15 K in a flow-through apparatus instead of a typical batch, fixed-bed reactor. This unique method permitted a higher CH4 recovery rate of 40.7% in a relatively short duration of 44 h. To further improvement the slow transformation process, Park et al. [21] investigated the effect of additional N2 on the transformation kinetics. They synthesized CH4 hydrate from powdered ice and CH4 gas in a stirred reactor before exposing about 1 mL of the pure CH4 hydrate sample to a N2–CO2 gas mixture (80% N2, 20% CO2). After about 24 h, 85% of the CH4 from the hydrate phase was recovered. It is noteworthy that the production of CH4 via CO2 + N2 injection was already tested in 2012 at the Alaskan North Slope in the Ignik Sikumi Field Trial [30]. A mixture of 23 mol% CO2 and 77 mol% N2 was injected into the target sediments. According to its final report, 70% of the injected N2 and 40% of the injected CO2 were recovered along with 24,210 m3 of CH4 during the flowback phase. However, 1421 m3 of N2 and 82 m3 of CO2 remained in the formation, which indicated the occurrence of CH4–CO2 replacement in the solid phase or dissolution of the gases into the brine [30,31].
The above mentioned examples are chosen to show how much the efficiency of the transformation process and thus the CH4 recovery rate differ depending on the chosen scale and experimental conditions. In addition to those studies focusing on the optimization of the process with regard to the recovery rate of CH4, there are other studies that deal with the transformation process on a µm-scale, to understand the mechanisms on a molecular scale. Due to the high complexity of the experimental systems, only some common assumptions may be allowed from previous research: (1) the exchange process is incomplete and reversible to a certain degree [24,32]; (2) the kinetics of the replacement process appears to follow a variant of the shrinking-core model, involving two stages that are similar but not identical to the formation of methane hydrate from ice [33,34]; (3) the initial exchange takes place at the interface of the CH4 hydrate, which is rapid and heterogeneous [24,35]; and (4) the subsequent reaction, requiring the penetration of gas molecules through the previously formed mixed hydrates, is found to be generally slow [36,37,38]. However, although it is now generally accepted that the driving force for the CH4–CO2 swapping process is the difference in the chemical potential between the coexisting CH4 hydrate phase and surrounding gas phase when exposed to a CO2 gas [24], the transformation mechanism on a molecular scale is still under discussion. The replacement process is neither simply the dissociation of the initial CH4 hydrate followed by the CO2 hydrate formation, nor the one-to-one replacement of a CH4 molecule with a CO2 molecule. A recent study on the CH4–CO2 replacement by Mok et al. [39] provides time-dependent information on the guest exchange behaviors and cage occupancies during the replacement process applying in situ Raman spectroscopy together with NMR and PXRD. They quantitatively analyzed the CO2 enclathrated in each cage of the structure I hydrate throughout the whole replacement process. However, it is still not yet clarified if this replacement process is correlated with a diffusion of the CO2 molecules in the hydrate phase through “holes-in-the-cages”, as suggested by Falenty et al. 2016 [40], a recrystallization and re-arrangement of the water molecules or a (partial) dissociation and reformation, as suggested by, e.g., Ota et al. and others [24,36].
The uncertainty of the mechanism originated in the use of different analytical methods, such as in situ Raman spectroscopy [24,26,32,38,41], PXRD [42,43], NMR [23,44], in situ Neutron Diffraction [40,45] and MRI [19,37], to study the in situ dynamic replacement reactions or visualize the transformation process on a µm scale. Among these methods, Raman spectroscopy is the most widely used method for determining the composition and cage occupancies of the hydrate. Since it allows an analysis of the compositions of each phase and the changes in molecules in the corresponding hydrate cavities, promising results can be given for the guest replacement experiments. For instance, Yoon et al. [38] investigated the guest replacement reaction applying in situ Raman spectroscopy. They monitored the changes in the relative intensities of the Raman peaks corresponding to CH4 and CO2 in large and small cages of sI hydrate. A sharp increase in the Raman peaks of CO2 in the hydrate phase was observed in the first 100 min, but the increase in intensity slowed down after 100 min, which may indicate an effect from the surface shielding of the CO2 hydrate formed in the outer layer. Another example is from Zhou et al. [41], who also studied the swapping process. Real-time Raman spectra monitoring the changes in composition for CO2 and CH4 in the hydrate phase depicted no significant fluctuations throughout the transformation process. The observation suggested that the transformation was simply not a dissociation process followed by a reformation process. Up to now, most researches applying Raman spectroscopy only provided spectroscopic evidence but did not provide enough real-time visualization information for the transformation process.
Against such a background, the ultimate goal of our research was to advance our understanding on the transformation process of the hydrate-bonded CH4 with CO2 on a µm-scale, applying in situ Raman spectroscopy and microscopic observations. Time-resolved Raman measurements were performed on pure CH4 hydrates exposed to a continuous CO2 gas flow, recording changes in compositions and cage occupancies during the whole transformation process. In addition to the single-point measurements, line scans and Raman maps were also taken from the hydrate phase. With the help of a confocal microscope and a motorized sample stage, hydrate crystals were analyzed in all three dimensions with a high spatial resolution. In this paper, the transformation kinetics of the CH4 hydrates to CO2-rich mixed hydrates are discussed in detail based on the experimental data. For a better understanding, the µm-scale investigation results from this research are compared and discussed in consideration of the previous kinetic models that were originally developed for other solid-state reactions. The microscopic investigations on specific hydrate crystals at defined depths expand our understanding on the transformation process and reveal more detailed information.
2. Materials and Methods
2.1. Experimental Setup
Experiments were performed with a specialized experimental setup. The main part of this setup is a high-pressure cell made of Hastelloy with a volume of 550 µL for the sample chamber. A quartz window (diameter 18 mm/thickness 10 mm) on the top of the cell allows for microscopic observations of the process in the sample area and the in situ Raman spectroscopic investigations. The pressure in the sample cell was adjusted by a pressure regulator (ER3000, Tescom); it can be used at pressures up to 10 MPa. A thermostat controlled the temperature of the sample cell with a precision of 0.1 K by means of a Peltier cooling device, which provides a quick temperature change. Another unique feature of the pressure cell is that it operates with a continuous gas flow as two valves outside the sample chamber control the inlet and outlet of the gas phase. The gas flow was measured and regulated with a commercial flowmeter (Bronkhorst HI-TEC digital mass flow controller F230M-AAD-11-K). A supply line with a diameter of max 1.6 mm and a length of 45 mm for the feed gas was drilled into the cell body so as to cool the incoming gas and avoid any heating effects. The pressure cell was mounted on a motorized, software-controlled, Märzhauser Scan+ sample stage attached to the microscope. For the in situ Raman measurements, a confocal Raman spectrometer (LABRAM HR Evolution, Horiba Jobin Yvon) with a 1800 grooves/mm grating and 20× microscope objective was used. The Raman spectrometer was equipped with a frequency-doubled Nd:YAG solid-state laser with an output power of 100 mW working at 532 nm. The laser power at the sample reaches a maximum of ~48 mW at the sample surface and can be reduced by use of various filters. With a focal length of 800 mm, this spectrometer achieves a maximum spectral resolution of 0.5 cm−1. In order to determine the spectral resolution under the chosen experimental conditions, a Raman spectrum of neon light was recorded and the full width at half maximum of the neon band at 1706 cm−1 was determined, from which a spectral resolution of 0.6 cm−1 resulted. A motorized confocal pinhole enabled to increase the spatial resolution of the laser-spot measurements, which in the x–y direction is ~0.5 µm in maximum and ~1.5 µm in the z direction. In this study, by using a long-working distance objective and selecting a pinhole number of 30 μm, an optimum spatial resolution of 1.6 μm in the planar and 6.2 μm in the z direction was reached. The Raman spectral positions were calibrated employing the silicon peak (521 cm−1). Further details regarding the experimental setup and the confocal Raman spectroscopic method can be found in Schicks et al. [46].
2.2. Experimental Procedures
The experiment started with the formation of pure CH4 hydrate by following the same procedures as described in Schicks and Ripmeester [47]. The empty pressure cell was first flushed with the CH4 gas for about one hour with a gas flow of 1 mL/min. Next, 150 µL of deionized and degassed water was filled into the sample cell. The cell was carefully sealed and flushed again with the CH4 gas at room temperature. After the system was pressurized to the experimental value of 3.2 MPa in 60 s, the cell was cooled down to 253 K with ca. 2 K/min to induce the spontaneous crystallization of hydrate and ice. Since the spontaneous formation of the hydrates came along with the formation of ice at this condition, the cell was slowly warmed up to be above the ice melting point to ensure all the ice was melted, and then the temperature was increased slightly above the CH4 hydrate equilibrium curve to melt most of the hydrate crystals. After only a few hydrate crystals remained, the system temperature was lowered to 274 K. At this point, euhedral crystals of CH4 hydrate started to grow. The experimental p-T condition allowed the formation of CH4 hydrates and CO2 hydrates (see Figure 1) without the presence of liquid CO2. All the phase data were calculated using CSMGem [2]. At least 15 of the formed hydrate crystals were selected for continuous in situ Raman measurements to record the changes in the clathrate structure, composition and cage occupancy. Morphology changes of the hydrate surface were also monitored regularly. It took 5–6 days until the pure CH4 hydrate reached a steady state where no further changes in the hydrate compositions with regard to the cage occupancy were recorded (see also Section 3.1, CH4 Hydrate Formation). It should be noted that a steady state is not synonymous with an equilibrium state [48]. The steady state is a stationary non-equilibrium state that is characterized by the fact that the chemical potential in the system is not constant, but the changes are so minimal that they cannot be detected in the framework of the experiment [49]. In this context, a steady state means that the hydrate composition did not change significantly within hours. Nevertheless, the composition of the steady state does not necessarily correspond to the composition of the equilibrium state.
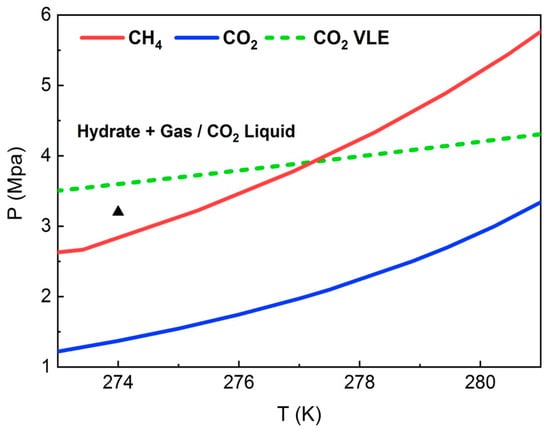
Figure 1.
Phase boundaries of the hydrates formed from pure CH4 (red line), and pure CO2 (blue line) calculated using CSMGem [2]. Also shown is the CO2 vapor–liquid boundary (green dashed line) and experimental p-T condition (triangle symbol) at 3.2 MPa and 274 K that is maintained throughout the entire process, including CH4 formation and the gas replacement process.
To initiate the hydrate transformation process, the feed gas composition was changed from the initial CH4 gas to CO2 gas, conducting similar steps as described in the publication of Beeskow-Strauch and Schicks [32] at a constant pressure and temperature. First, the CH4 gas flow was stopped by closing the gas inlet valve at the sample cell. The gas line was then flushed with CO2 gas to ensure that the gas flowing into the sample cell from this step onwards was pure CO2 gas. However, the very last part of the gas line could not be flushed, which resulted in a certain delay until CO2 entered the sample cell. Afterwards, the gas inlet valve was reopened to a continuous stream of CO2 gas into the sample cell at a flow rate of 1 mL/min. Raman measurements were performed both on the gas phase and at different depths in the hydrate phase from the surface to the core of each crystal (surface, 15 µm, 30 µm, 60 µm and 90 µm) with a confocal pinhole of 30 µm to record the progression of the gas replacement process in the crystal in terms of the relative guest molecular composition. In order to obtain more information on the spatial composition of the guest molecules in the hydrate phases, a specific area of a well-structured crystal with large flat surfaces was selected for mapping. The selected area was automatically scanned step-by-step in one direction for the line scans and both the x and y directions for the area maps. The whole experiment was repeated three times and similar results were achieved as discussed in the following section.
2.3. Data Processing
In this study, the whole process of CH4 hydrate formation and CH4–CO2 transformation was analyzed using in situ confocal Raman spectroscopy. The Raman spectra were obtained from several points, starting from the surface to the core of the selected hydrate crystals. The measured Raman band positions were in good agreement with the literature data, as summarized in Table 1.

Table 1.
Spectroscopic information for the CH4 and CO2 molecules in the gas phase and for different cavities in the hydrate phase.
The molar compositions in the gas and hydrate phase were determined on a semi-quantitative basis following the same calculation routine as described in Beeskow-Strauch et al. [52]. The Raman peak areas of the components in a mixed system are proportional to the number of molecules present in the sample; thus, the molar fraction of a component a ( can be calculated using the following equation:
where Aa represents the area of the Raman band of component a, is the Raman scattering cross-section factor of component a and represents instrumental efficiency. The index i represents the values for all species present in the sample and Σ is their sum.
The Raman band areas were corrected with wavelength-independent cross-section factors for each specific molecule type, assuming that the cross-section factors do not vary with pressure, inclusion of the component into different cage types of the hydrate phase or the presence of other components in the different phases [50,53,54]. In this work, the molar compositions of the CH4 and CO2 in the gas and hydrate phase were given as relative percentages, assuming the total Raman bands for the guest molecules were set to 100%.
Since we consider and discuss the relative changes in the hydrate compositions over time in this work, this method for the determination of the semi-quantitative composition of the hydrate phase is sufficient. If a more precise determination of the hydrate composition is necessary, the method developed by Qin and Kuhs [55] should be considered.
3. Results
3.1. CH4 Hydrate Formation
During the formation of CH4 hydrate, the initial Raman measurements detected the appearance of Raman bands at 2905 cm−1 and 2915 cm−1, as shown in Figure 2, which illustrated the C–H stretching mode of the CH4 molecules in the hydrate phase. This figure indicated the enclathration of CH4 molecules into the hydrate cavities, with the Raman bands of 2905 cm−1 and 2915 cm−1 assigned as the CH4 encased into the large 51262 and small 512 cavities of the structure I hydrate, respectively, as tabulated in Table 1. The ratios for the integrated intensities of the Raman bands at 2905 cm−1 and 2915 cm−1 were calculated to ensure that the CH4 hydrate followed the structure I equilibrium 3:1 ratio of large to small cavities. The equilibrium ratio was achieved after 24 h for some of the well-developed crystals, whereas it took longer than 24 h for the less-developed crystals to reach the expected equilibrium ratio. After 6 days, the cage occupancy ratio for most of the CH4 hydrate crystals reached 3.1 (±0.2):1, which indicated that the system was close to an equilibrium state. It should be noted that the presence of the CH4 gas peak in the Raman spectra at 2917 cm−1 may have an effect on the calculation of the cage occupancy ratio. In this case, we considered the CH4 gas peak in the Raman spectra. However, after careful calculation, it turned out that the impact from the CH4 gas peak was lower than 2%rel on average whether it was considered or not.
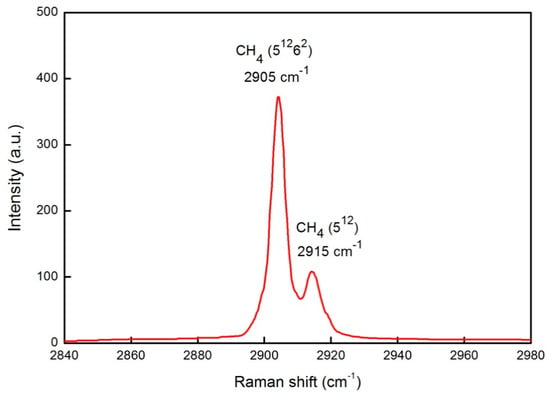
Figure 2.
Raman spectra for the C–H stretching mode of the CH4 molecules enclathrated into the large 51262 (2905 cm−1) and small 512 (2915 cm−1) cavities of the structure I hydrate. The spectral resolution achieves 0.6 cm−1 as described in Section 2.1.
Microscopic observations indicated no remaining free water phase after that time. In addition, the shape of the Raman bands of the water indicated that at least most water molecules were bonded into the hydrate structure: according to the literature, the left shoulder of the band shape (2800–3350 cm−1) is attributable to the strongly hydrogen-bonded water molecules in the hydrate or ice structure, whereas the right shoulder (3350–3800 cm−1) is attributable to weakly hydrogen-bonded water molecules such as in liquid water [56,57]. Please note that in this context the terms “strong” and “weak” refer to the number of hydrogen bonds a water molecule forms with its neighboring water molecules.
3.2. Changes in Composition of the Initial Gas and Hydrate Phase When Exposed to CO2
After there were no further changes in the CH4 hydrate composition with regard to the ratio of large to small cavities occupied with CH4 that signify a steady-state condition has been reached, the gas flow was changed from CH4 to CO2 to induce the transformation process at a temperature of 274 K and pressure of 3.2 MPa. Both CH4 hydrate and CO2 hydrate were considered to be stable under these conditions following the phase diagram shown in Figure 1. The time when the gas flow was changed is defined as time zero (t = 0 min). Single point Raman measurements of the gas phase and on different hydrate crystals were continuously taken over time.
It took more than 50 min before the CO2 could be detected in the gas phase besides CH4. CO2 gas was represented by the Raman bands at 1285 cm−1 and 1388 cm−1, which could be assigned to the ν1 C–O symmetric stretching and 2ν2 overtone of bending for the CO2 molecules, respectively. The delay in detecting CO2 in the gas phase may result from several reasons. There might be CH4 gas left in the pipe line between the gas bottle and pressure cell. The very last part of the gas line also could not be flushed. It is also possible that the CO2 concentration in the cell is too low at the beginning to be clearly detected with Raman spectroscopy. As for CH4 gas, the Raman band occurs at 2917 cm−1. With longer time, the intensities for the CH4 gas band in the Raman spectra reduced, while the intensities for the CO2 gas bands in the Raman spectra continued to increase, as shown in Figure 3a. Figure 3b shows the changes in gas composition versus time in two separate tests. The blue diamonds and red circles in Figure 3b represent the gas composition in Test 1 while the pink and light blue symbols show the results from Test 2. Within the first 100 min after the feed gas was changed, the CO2 proportion (given as molar composition in %) increased dramatically. Thereafter, the gas exchange process slowed down until almost 100% CH4 in the gas phase was replaced by CO2 after 4000 min. Even though the respective times of measurements varied slightly in these two tests, similar trends for the gas phase composition were observed when repeating the transformation process, indicating a high reproducibility of the measurements.
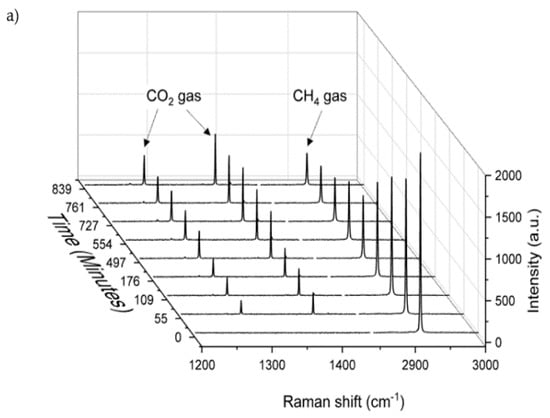
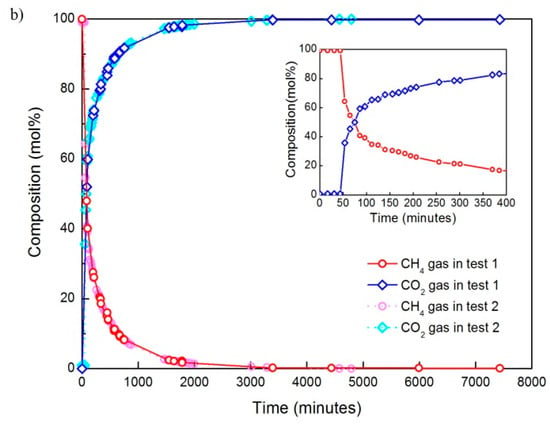
Figure 3.
Changes in the gas phase composition as a result of the continuous gas flow after the exchange from CH4 gas to CO2 gas: (a) real-time Raman spectra monitoring, and (b) the relative molar composition of the gas phase over time in two separate tests. For a better overview, the time axis in Figure 3a is displayed value-independent.
Raman measurements on the hydrate crystal surfaces revealed the enclathration of the CO2 molecules in the hydrate phase by detecting the first appearance of the Raman bands at 1277 cm−1 and 1382 cm−1 after around 500 min (8.3 h). The CO2 gas peaks were still detectable due to the effects of the surrounding gas phase on the hydrate surface during measurements. As shown in Figure 4, the intensities for the CO2 hydrate bands increased with time, while the intensities of the Raman bands representing CH4 in the hydrate phase decreased.
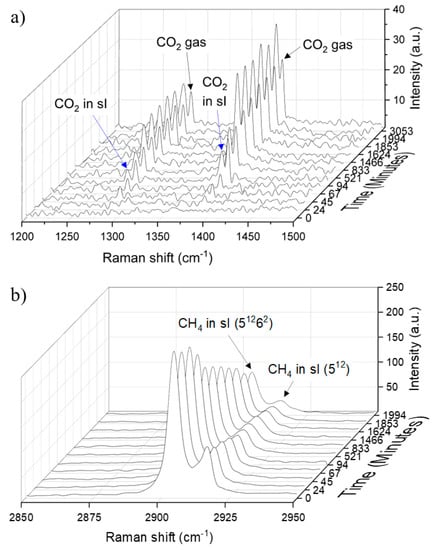
Figure 4.
Real-time Raman spectra monitoring of the (a) CO2 hydrate and (b) CH4 hydrate for changes in the solid phase as a result of the shift in gas phase from CH4 gas to CO2 gas. Blue arrows in Figure 4a point out the first appearance of Raman bands at 1277 cm−1 and 1382 cm−1 for the CO2 hydrate after around 500 min. The time axes are displayed value-independent.
At least 15 different hydrate crystals within the sample were closely monitored and measured for their transformation behavior. By referring to the plot of changes in composition over time for these selected hydrate crystals in Figure 5, it was found that the relative compositions for all the selected hydrate crystals scattered over a wide range. By repeating the Raman measurements on one crystal three times, a good reproducibility of the measurements was confirmed with a standard deviation of 0.2 mol% for the measuring points. Therefore, the scattered composition of hydrate crystals indicated the heterogeneity of the hydrate phase with regard to the content of CH4 and CO2. Using these data, the average molar composition for CH4 and CO2 in the hydrate phase was determined, and plotted on the same graph. The experiment was repeated three times and the standard deviation of the average molar composition was calculated for all the depths and all days. It turned out that the standard deviation ranged from 0.6 mol% to 5.3 mol% over the 8 days for the hydrate surface whereas the range was 0.1 mol% to 9.4 mol% for deeper depths. The steep slope from the plot of average molar compositions at the surface of the crystals shown in Figure 5 represented a faster reaction for the transformation of the pure CH4 hydrate into mixed CH4–CO2 hydrate during the first 2 days (around 2880 h) after the gas flow was changed compared to a much slower conversion that was recorded afterwards. The integrated Raman intensity of CH4 in the 51262 cavities and the 512 cavities also changed from nearly 3:1 to a ratio of 2.0 (± 0.2):1, which signified that a mixed hydrate has formed during the exchange process containing CO2 and CH4 in the 51262 cavities and CH4 in the 512 cavities. It should be noted that no CH4 gas peaks were observed at that time in the Raman spectra taken from the hydrate phase due to a low concentration of CH4 in the gas phase. Therefore, CH4 gas peak did not impact the calculation of the cage occupancy ratio. After more than 7000 min (116.7 h), the average composition of the resulting hydrate phase contained ~80% CO2 and 20% CH4, which was defined as CO2-rich mixed hydrates. However, it should be noted that for some of the hydrate crystals the CO2 concentration is still much less.
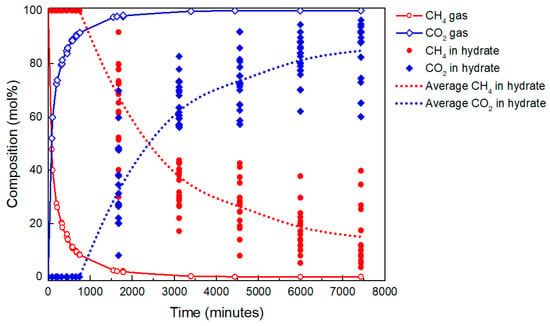
Figure 5.
Results of the Raman spectroscopic measurements on the surfaces of 15 selected hydrate crystals, illustrating the exchange process of pure CH4 hydrates to CO2-rich mixed hydrates when exposed to CO2 gas. The dashed lines show the average molar composition changes in CH4 (red) and CO2 (blue) in the hydrate phase fitted by smooth curves. The standard deviation of the average molar composition ranged from 0.6 mol% to 5.3 mol% according to the data from three repeated experiments.
With the use of confocal Raman spectroscopy and a motorized sample stage, Raman spectra were acquired not only on the surface of the hydrate crystals, but also at different penetration depths inside the crystals by focusing the laser beam at a defined depth. For this purpose, the laser beam was initially focused on the surface of the hydrate crystal and the position of the sample stage was recorded as zero at the Z-axis. With the help of the software Labspec 6.5, this position of the motorized stage was changed vertically in such a way that the focus of the laser beam moved into the hydrate crystal. With a spatial resolution of 6.2 µm in the z direction, measurements were therefore made at penetration depths of 15 µm, 30 µm, 60 µm and 90 µm into the hydrate crystals to ensure that the measurements had covered the whole range of depths. A curve fit was created in Figure 6 for the individual measurement points in order to better illustrate the trend of the transformation process. Each curve represents the average composition changes for 15 different hydrate crystals at a specific depth. The standard deviations of the average composition at specific depths from the three experiments serve as the error bars in Figure 6. The measurements on different hydrate crystals and different depths for each crystal serve as a better representation for the whole system. The results clearly indicated the incorporation of CO2 into the hydrate phase with a concentration gradient from the surface to the core of the hydrate particle. It was shown from Figure 6 that after the pure CH4 hydrate crystals were exposed to a CO2 gas for around 1.5 days, the average conversion to a mixed CH4–CO2 hydrate composition was 50 mol% CH4/50 mol% CO2 on the surface of the hydrate crystals. However, at 60 µm depth into the hydrate crystals, the average conversion to mixed CH4–CO2 hydrate composition was 80 mol% CH4/20 mol% CO2 after 1.5 days. With time, a higher conversion to CO2 hydrate was recorded for all depths. However, after Day 6, small fluctuations to the hydrate compositions were observed at all depths (see Supplementary Information).
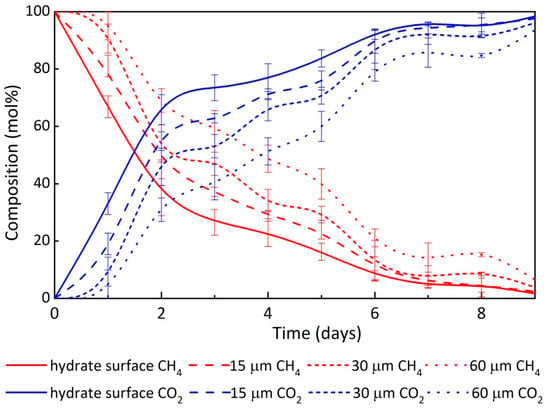
Figure 6.
Changes in the average composition in mol% of the hydrate phase at defined depths over time after the initial CH4 hydrate was exposed to a CO2 gas phase. The standard deviation of the average composition in three repeated CH4–CO2 exchange experiments were used for the descriptive error bars.
It was confirmed that the transformation process from pure CH4 hydrates to CO2-rich mixed hydrates took place initially at the interface of CH4 hydrate and CO2 gas as the results showed the faster composition changes at the surface. Since there was no direct contact between the inner layers of the hydrate crystal and the CO2 gas, the reaction into the hydrate crystals became diffusion-limited with depths. The driving force of the concentration gradient also decreases with depth. Over longer time, the results from the Raman spectroscopy indicated that the CO2 molecules penetrated from the surface to the deeper depths through the hydrate layer. It started with the enclathration of the CO2 molecules on the surface and was then followed by the enclathration of the CO2 molecules into the hydrate structure in the deeper layers. Therefore, these observations support in general the hypothesis of the “shrinking-core model” and are similar to the findings by Lee et al. (2014) [34] and Falenty et al. (2016) [40].
Apart from the single-point Raman measurements on the hydrate crystals during the transformation process, line scans and Raman maps were also performed at the surface of the hydrate crystals after 5 days. Figure 7a depicts the line scan on one of the well-developed hydrate crystals, where 50 measuring points along 37 µm across the surface were scanned step-by-step in one direction. This process took over 60 min for the 50 points. One has to assume that the transformation process will continue during this time. It is therefore not possible to repeat the line scan in order to prove the reproducibility of the measurements. As such, the reproducibility of the Raman line scans was tested before the experiment on a hydrate crystal with only a few measuring points. The standard deviation was 0.2 mol% for 12 measuring points on a crystal surface over three repeated tests. Therefore, the results presented in Figure 7b indicate the measured variations in local composition of the hydrate crystal. Interestingly, the concentration recorded for CO2 in the mixed hydrate crystal was higher at the edges of the crystal, compared to the CO2 concentration towards the center of the crystal. Since the edge of this hydrate crystal had a wider contact surface with the gas phase, CO2 molecules could attack the hydrate crystal from different sides and were available to be incorporated into the hydrate phase. Similar trends were observed while repeating the experiment on different hydrate crystals.
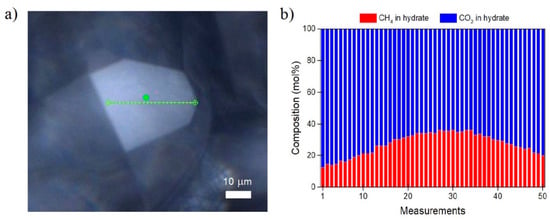
Figure 7.
(a) Raman line scan across hydrate crystal surface was scanned step-by-step in one direction. (b) Composition variations for the CH4 and CO2 encased into the hydrate phase at 50 measuring points across the formed hydrate crystal. The standard deviation for the line mapping was 0.2 mol%.
Raman mapping conducted on a specific rectangle area (42 µm × 61 µm), scanning both in the x and y directions on the surface of the hydrate crystal (see Figure 8), demonstrated the inhomogeneous nature of the formed CH4–CO2 mixed hydrates. There was also overall a higher CH4/CO2 ratio towards the center of the measured crystal, as shown in Figure 8b, indicating more CH4 remained in the hydrate phase. It should be noted that pixels in Figure 8b only show results of each measuring point. The X axis in Figure 8b corresponded to the direction parallel to the short side of the rectangle in Figure 8a, while the Y axis indicated the direction parallel to the long side of the rectangle.
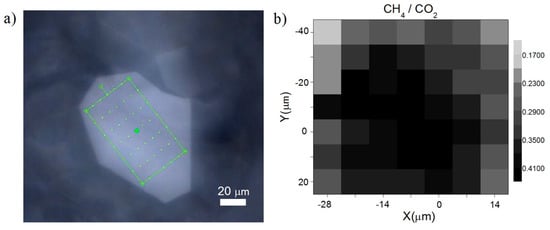
Figure 8.
(a) Raman mapping on a hydrate crystal surface. A total of 49 (7 × 7) measuring points were chosen to be analyzed to determine the composition of the hydrate crystal. (b) The calculated CH4/CO2 ratio in the mapped area based on the integrated Raman band areas of CH4 and CO2, respectively, without a correction with the Raman scattering cross section factor or instrumental efficiency. Increasing darkness reflects a higher CH4/CO2 ratio, whereas lighter points represent a lower CH4/CO2 ratio.
3.3. Changes in Morphology of Hydrate Crystals When Exposed to CO2
For the microscopic observations during the transformation of the initial CH4 hydrate to mixed gas hydrates, a series of snapshots were acquired periodically using a digital camera mounted on the confocal microscope. These snapshots were used to systematically study the morphology of the pure CH4 hydrate crystals when the gas phase was changed to CO2. In this observation, at least ten crystals of pure CH4 hydrate were initially selected. The ratio of large to small cavities for the structure I hydrate has reached 3:1 for these crystals. They were also categorized as well-developed crystals that exhibited a polyhedral shape with sharp edges and flat surfaces when they were first exposed to the CO2 gas. However, when the transformation process started, the crystals’ appearance changed significantly over time.
Figure 9 presents two crystals as examples, showing the evolution of the hydrate crystals from the initial pure CH4 hydrates to CO2-rich mixed hydrates. As shown in Figure 9a, the initial flat rectangular shape surface of the crystal shrank on Day 1 and Day 2. On Day 3, it started to grow again until Day 6. However, on the last day of the experiment, the hydrate crystal surface was found to be smaller. The calculation of the diameter for the entire crystal showed that it decreased by 57.8% on Day 7 (39.8 µm) compared to the diameter before it was exposed to CO2 gas (94.2 µm). As for the crystal in Figure 9b, it experienced a continuous dwindling within the 7 days of the experiment. Already on Day 2, the sharp edges of the crystal were invisible. The complete shape of the crystal disappeared at the end. For this reason, a comparison for the diameter of the crystal could not be conducted. Other crystals changed their surface morphology over time without showing a clear trend in decrease or increase regarding their sizes. It should be noted that the dwindling of the hydrate crystals was not considered as an effect from the irradiated laser beam during the Raman measurements. No physical damage was observed on the hydrate crystal surfaces where the laser beam was hitting. Besides, no significate changes were recorded in the Raman spectra regarding the shapes and sizes of the O–H stretching bands, which indicated that the hydrate crystals were fully intact.
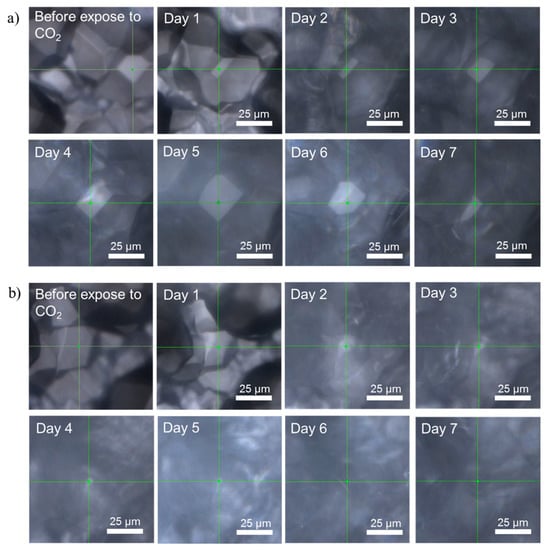
Figure 9.
Changes in surface morphology on two CH4 hydrate crystals (shown in (a) and (b), separately) after the shift of gas phase to CO2 gas at experiment conditions of p = 3.2 MPa and T = 274 K. The CH4 hydrate crystal in Figure 9a was found to grow in the first few days followed by a shrinking on the last day. However, the crystal in Figure 9b experienced a continuous dwindling and disappeared on Day 7. The green point with crossed lines was the exact measuring spot site on the hydrate crystal.
It is noteworthy that the crystals that experienced a continuous dwindling according to the microscopic observations showed a different transformation profile compared to those crystals that grew or maintained their sizes. Two types of transformation curves can be observed from Figure 10, which presents the changes in CH4 concentration on the surfaces of the hydrate crystals over time. Different symbols represented the plots from different crystals. Blue full symbols represented the dwindling crystals that decreased continuously regarding their sizes while the red empty ones were the crystals that grew or at least maintained similar sizes. It becomes clear that the dwindling crystals (blue symbols) tend to have a higher CH4 composition in the hydrate phase, which means a slower transformation rate especially at the very beginning when the CH4 hydrates were exposed to a CO2 gas. The reaction rate was almost constant throughout the whole experimental period. For the crystals that grew or maintained their size (red symbols), a faster transformation was observed at the beginning of the reaction, which slowed down with time. It should be noted that the growing of the hydrate crystals’ size was not due to the growth of a CO2 hydrate layer on the initial CH4 hydrate crystal. This could be proved by the results from the Raman measurements. With the present setup, we were also not able to detect the formation of an aqueous phase in which the CO2 could dissolve during the decomposition of the hydrates. However, the existence of free water molecules could still be possible during the transformation process. Since the cage structure has to open to a certain extent for the replacement of guest molecules, the observed dwindling phenomena after the exposure of the pure CH4 hydrate crystal to the CO2 gas may be an indication for at least a rearrangement of the molecules.
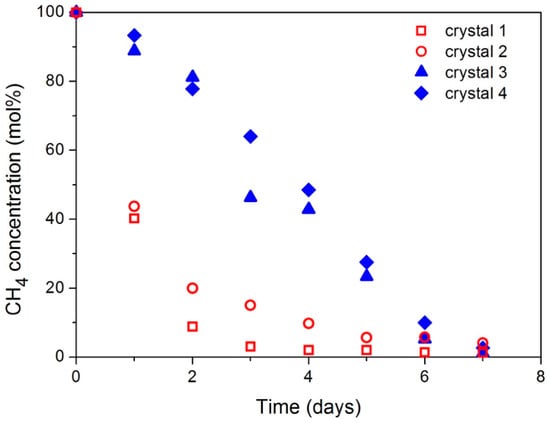
Figure 10.
Changes in CH4 concentration on the surface of the hydrate crystals over time. Crystals marked in blue experienced a clear decrease regarding their size while those marked in red either grew or maintained their size.
4. Discussion
There are several theories proposed to explain the mechanism behind the CH4–CO2 replacement process. However, whether the transformation refers to a substitution of guest molecules, a re-arrangement of the hydrate cavities or a recrystallization still remains uncertain. To gain more insight into the transformation kinetics, the experimental data obtained in this work were applied to the Avrami equation and the shrinking-core model, which have been widely used for describing the nucleation and growth process of the solid-state reaction [58,59]. Although not developed for the description of hydrate kinetics, they have been successfully applied before to fit data from hydrate formation [60,61,62] and also the CH4–CO2 swapping process [63].
Random nucleation followed by the growth of the nuclei is often modelled using the Avrami rate law. The Avrami rate law is in principle also applicable for the initial stage of the CH4–CO2 exchange reaction [34]. It assumes that an initial layer of mixed CH4–CO2 hydrate is formed with a quick exchange with CH4 hydrate on the surface after the CH4 hydrate is exposed to the CO2 gas. A general expression for the Avrami rate law [58] can be presented as
where α is the degree of hydrate conversion at time t, k is the rate constant for the enclathration-controlled reaction step of hydrate formation and n is the Avrami exponent that accounts for the dimensions of crystal growth. Once the initial layer of mixed CH4–CO2 hydrate was formed, which can be mathematically described by the Avrami model (the first stage), the growth of the mixed hydrates slowed down, as shown in Figure 5 and Figure 6, which corresponds to a diffusion-controlled process (the second stage). The presence of mixed CH4–CO2 hydrate on the surface limited the mass transfer for the subsequent hydrate growth. The shrinking-core model was employed in this stage, when the diffusion of the gas and water molecules through a continuously growing mixed hydrate layer controlled the rate of the reaction. Three different equations for the simple shrinking-core model, expressed as follows, were applied, and their results were compared:
Jander [64]:
Levenspiel [65]:
Fujii-Kondo [66]:
where t is referred to as time, and α is the hydrate conversion ratio after the first stage reaction has taken place, at time t. r in both the Jander and Fujii-Kondo equations is the radius of the hydrate particle. k1 in Jander’s model is the formation rate constant composed of the diffusion coefficient D and the concentration of the diffusing component (CO2) c0 at the contact surface. While in the model of Levenspiel, k2 = r2ρ/6bDeCA, whereby r is the particle radius, De is the diffusion coefficient of the CO2 gas in the mixed hydrate layers, CA is the concentration of CO2 in the gas phase, ρ is the molar density of the hydrate and b is the stoichiometric ratio of the CH4 hydrate. In the Fujii-Kondo model, k3 is referred to as the diffusion rate constant. These three rate constants are obtained from the slope of the curves when plotting the t against the relevant terms according to the equations. The amount of hydrate formed during the first step is deducted in the Jander and Levenspiel models and the corrected reaction time t was introduced starting with t = 0 min. In addition to time t, a measurable amount of time t* is also introduced into the equation after which the hydrate formation is diffusion-controlled. The corresponding hydrate conversion ratio at time t* was defined as α*.
In general, all the three equations mentioned above provide mathematical descriptions for the general shrinking-core model, which was developed for heterogeneous reactions between a gas phase or a liquid phase and a spherical solid particle. The model of Jander [64] was one of the first models that described solid-state reactions. The model describes the contact of two non-ideal crystal faces with an immediate formation of a product layer on the surface of one crystal. A concentration gradient is created for the educt molecules from the unreacted crystal through the product layer, leading to a diffusion-controlled reaction. It has to be noted that the Jander equation implicitly assumes that both of the two reacting spherical crystals do not change their sizes during the whole reaction and only the product layer and the diffusion way change. It is also assumed that only the unreacted crystal diffuses through the product layer. In this way, Jander’s model is also applicable for the reaction from a gas and a solid phase. However, it completely neglects the decrease in the reaction surface due to the shrinking of the unreacted core. The model of Levenspiel [65] was developed for gas–solid reactions with a product in the gas phase while considering the shrinking core effect. In this model, the concentration gradient of the gas is considered as a constant based on the assumption that the shrinking of the unreacted core is far slower than the flow rate of the reactant through the product layer. Moreover, the stoichiometry of the reaction is also assumed to be constant so that the ratio of the consumed number of gas reactant particles and the solid particles are constant, too. However, care has to be taken when applying the model for gas hydrate formation as they are non-stoichiometry compounds. The Fujii-Kondo model [66] was originally modified from the Jander model and has been used to fit the diffusion-controlled step during the process of hydration of cement grains. When the surface of the initial hydrate crystal is entirely covered by the product layer, the nucleation stage stops and the reaction proceeds only by diffusion of the molecules inward to the unreacted cores. In consideration of the time taken for the surface nucleation, a critical measurable time t* with a corresponding conversion rate α* is introduced into the equation when the reaction starts to be diffusion-controlled. It is apparent that the model does not apply to the vicinity of the assumed transition time t* as it predicts the formation rate constant k3 to approach infinity (Equation (4)). This is due to a simplification of the model, which assumes that the transition from the nucleation stage to the diffusion-controlled stage occurs instantaneously for a single particle while in reality this should occur over a period of time. In addition, the best way to model the reaction would be to apply the equation to an individual particle with a given size to avoid the effect of particle size distribution on the reaction kinetics.
With all the calculations performed using these three different equations, the compositions for mixed CH4–CO2 hydrates in mol% were back-calculated, and the values were compared with the experimental data to find which equation best described the kinetics of the CH4–CO2 transformation process. Figure 11 shows the results of these calculations for two crystals with different transformation patterns: (a) a “survived” crystal with a remaining or growing size and (b) a dwindling crystal that experienced a continuous decrease regarding the size. For most of the remaining crystals, the results clearly indicated the incorporation of CO2 into the hydrate phase with two stages involved: (1) a fast surface reaction on the gas–solid interface, and (2) a gradual slow process due to the resistance to diffusion of gas through the formed mixed hydrate layer. The experimental data satisfactorily fitted with the Avrami rate law in the first stage of the exchange process. As for the second stage, all the three equations fitted the data to certain extents. Among them, the Fujii-Kondo equation suited best compared to Levenspiel and Jander (see Figure 11a). Similar findings were also recorded by Lee et al. [34], where they showed the well-fitted trend of the Avrami and Fujii-Kondo models with their experimental data. It is also possible that the transformation process is only weakly influenced by the diffusion. Therefore, the Avrami rate law fitted the complete transformation process for some crystals. However, for the dwindling crystal, the experimental data still fitted with the Avrami rate law at the beginning of the process. After about 100 h the experimental data no longer followed the trend calculated with the Avrami rate law; also, none of the three kinetic models matched well for the dwindling crystal (as shown in Figure 11b) since they were all based on the assumption that the solid crystal did not change its size but only the unreacted core shrank. Instead, a linear regression was achieved between the time and the measured CO2 composition in the hydrate phase with an R-value of 0.994. This indicated a constant reaction rate during the complete transformation process rather than a two-stage process. The dwindling process of the hydrate crystals as a result of hydrate dissociation may prevent the establishment of a stable CO2-rich mixed hydrate phase as a diffusion layer at the surface of the hydrate crystal. Therefore, the chemical disequilibrium between the crystals and the gas phase was maintained. This may explain why there is no significant change in the reaction rate shown in Figure 11b.
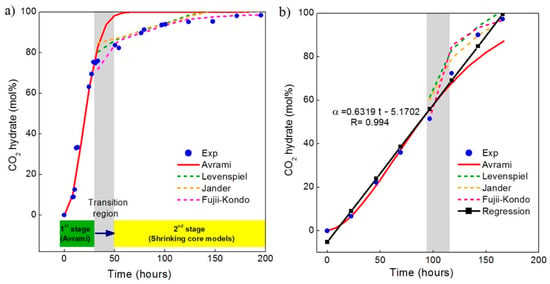
Figure 11.
Comparison of the Avrami (solid line) and shrinking core models (dashed lines) with experimental data for the formation reaction of two different mixed CH4–CO2 hydrate crystals: (a) a “survived” crystal with a remaining or growing size and (b) a continuously dwindling crystal. Blue dots show the experimental results taken at the surface of each crystal. The black dotted line in Figure 11b represents a linear regression for the experimental data and R is the coefficient of correlation.
The parameters for the models are listed in Table 2 and Table 3, respectively. Table 2 shows the formation rate constants and the Avrami exponents for the enclathration-controlled step for three runs, using two crystals each time. The values for the formation rate constant range over two orders of magnitude. This indicates that the speed of the enclathration-controlled step significantly varies from crystal to crystal. This is applicable for the single experiment as well as for the different runs, which is a further indication of the heterogeneous nature of the transformation process. In addition to the k-values, the Avrami model also provides information about the dimension of the crystal growth. For the experiments shown here, the values vary between 1 and 2, indicating that the growth of the mixed crystals is one- to two-dimensional. Table 3 shows the rate constants for the diffusion-controlled step, which were determined according to the Fuji-Kondo model, as well as the radius of the examined crystal. The fitting with this model gives the best results. Although the rate constants are of the same order of magnitude for the three runs, they vary significantly for the individual crystals.

Table 2.
Formation rate constants and Avrami exponents obtained from the enclathration-controlled step for six crystals.

Table 3.
Formation rate constants of the Fujii and Kondo equation obtained from the diffusion-controlled step for six crystals (the radius of the crystals was obtained from the microscopic images of crystals and determined with the software “ImageJ”).
In addition to these kinetic data, microscopic observations on the hydrate phase revealed alterations in hydrate morphology, which were an indication for potentially different transformation behaviors of hydrate crystals. Changes in the morphology directly affected the sizes of the hydrate crystals. As a consequence, the crystal would either expand, shrink or completely disintegrate.
One assumption for the morphology change would be the dissociation of pure CH4 hydrates and a parallel growth of mixed hydrates. This effect was observed by Schicks et al. [31], who studied the exchange process of CO2/N2–CH4 in gas hydrates, simulating the Iġnik Sikumi field trial. The coexistence of initial pure CH4 hydrates and secondary mixed gas hydrates containing CH4, CO2 and N2 was detected in the solid phase. While continuously measuring the decomposing CH4 hydrate crystals, the Raman spectra of the solid phase clearly indicated only the CH4 molecules in the hydrate phase and the composition did not change until the dissociation process ended after about 20 h at the given pressure and temperature conditions. In contrast, coexistence of pure CH4 hydrate and mixed hydrate was not observed in the solid phase for this study. Within the first few hours (around 8.3 h), when the enclathration of the CO2 molecules were not detected in the hydrate phase, the morphological changes of the hydrate crystals may be attributed to the decomposition of the pure CH4 hydrates. However, after 8.3 h, only the CH4–CO2 mixed hydrates were confirmed from the depth profile analysis by applying Raman spectroscopy. All Raman spectra taken from the hydrate crystals after this time showed Raman bands at 1277 cm−1 and 1382 cm−1, assigned as CO2 in the hydrate phase, besides Raman bands at 2905 cm−1 and 2915 cm−1 for CH4 in the hydrate cavities. The observed shrinking of the crystals for the remaining time was therefore clearly the dissociation of the mixed hydrates. This kind of dissociation process of some mixed hydrate crystals while other mixed hydrate crystals grow or maintain their size is reminiscent of a process similar to Ostwald ripening.
Ostwald ripening, known as a grain coarsening process, has been observed by previous researchers with different visualization techniques such as X-ray computed tomography [67], optical microscopy [68,69] and X-ray diffraction [70]. The process has been studied not only in simple materials like metals ceramics but also in more complexed crystalline hydrates [71]. It differs from the normal hydrate grain growth process and has a strong effect on hydrate pore-scale habit and spatial distribution, in which larger crystals grow at the expense of the dissolution of smaller crystals [67]. The thermodynamic basis of the ripening is the size-dependence of the stability of a crystal. According to the Gibbs–Thomson effect, the solubility limit is inversely proportional to the radius of the spherical particle [72], which means a molecular concentration gradient may develop in the surroundings between a small crystal and a nearby large one [69]. This leads to a diffusive transport from the higher concentrations around smaller crystals toward larger crystals. Eventually, smaller crystals that are energetically less stable are consumed by larger ones to minimize surface area and lower the free energy. In this case, we could also speculate a CO2 gas concentration gradient surrounding the existing mixed hydrate crystals. Thus, a thermodynamically driven spontaneous process occurs, resulting in a net flux of molecules flowing to larger crystals that can be described as a rearrangement of molecules (see Figure 12). This shrinking process may take place simultaneously with the diffusion process as described in the shrinking core model, which partly explained the observed compositions and morphology changes of the crystals in our experiment. It may also lead to small fluctuations in the hydrate compositions in the surrounding area.
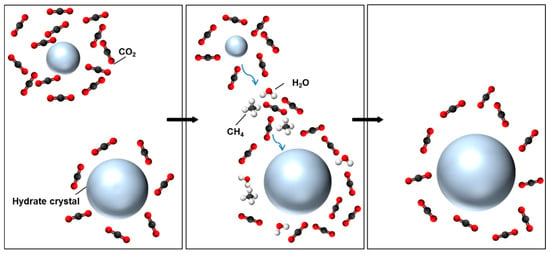
Figure 12.
Schematic illustration of the growth of CH4–CO2 mixed hydrate at the expense of smaller hydrate crystals considering the Ostwald ripening effect. The left panel indicates a CO2 molecular concentration gradient between the large and small hydrate crystals based on the Gibbs–Thomson effect. Therefore, the diffusion of CO2 molecules due to the concentration gradient is initiated from the small crystal towards the large crystal together with CH4 molecules and water molecules so as to minimize the surface area and lower the free energy. Finally, the large crystal grows and the small crystal disappears, as shown in the right panel.
5. Summary and Conclusions
The transformation process of pure CH4 hydrates into CO2-rich mixed hydrates was unveiled in this study on a µm scale by use of time-resolved in situ Raman spectroscopic measurements and microscopic observations. The results from the Raman spectroscopic measurements clearly indicated the incorporation of CO2 into the hydrate phase with a concentration gradient at different penetration depths rather than the growth of a CO2 layer on the existing CH4 hydrate crystal. The heterogeneity of the hydrate composition at defined depths was confirmed. It was shown from the line scans and Raman maps that the transformation process was more advanced at the edge of a crystal than that in the center. The analysis of the results suggested that most of the crystals displayed a two-stage reaction, supporting, in general, the hypothesis of the shrinking-core model. It involved a fast formation of the mixed hydrates on the surface of the initial CH4 hydrate crystals, which was rate-limiting, followed by a slow diffusion-controlled process that was dominated by the molecules penetrating inwards for the formation of mixed hydrates at deeper depths. This behavior was found for the crystals that kept their size or even started to grow after their exposure to CO2 gas. The formation rate constants for the kinetic models varied from crystal to crystal, indicating again the heterogeneity of the transformation process.
Microscopic observations indicated that all crystals of the initial CH4 hydrate phase changed their surface morphology when exposed to a CO2 gas. Some crystals of the initial CH4 hydrate phase decreased in size and some completely disappeared over time. In contrast to the two-stage reaction mechanism described above, these crystals showed an almost constant reaction rate for the complete transformation process. This observation supports the assumption of a rearrangement of the molecules and a (partial) dissociation followed by the formation of a mixed hydrate phase and not a replacement of the guest molecules in the existing hydrate cavities. A possible explanation for the morphology changes would be the Ostwald ripening effect as the large crystals grow at the expense of small ones, resulting in changing sizes and shapes of the mixed hydrate crystals.
In summary, our research provides time-resolved and quantified information for the whole CH4–CO2 exchange process on a µm level. The reaction mechanism of the CH4/CO2 transformation process seems to be influenced by how the hydrate morphology changes after the crystals are exposed to CO2 gas. On a long-term perspective, more work should be done to clarify the reaction mechanisms in consideration of a CO2 injection as an attractive gas production method from the natural hydrate reservoirs.
Supplementary Materials
The following are available online at https://www.mdpi.com/1996-1073/13/22/5908/s1, Figure S1: Composition of the selected hydrate crystals as a function of time at penetration depths of (a) surface, (b) 15 μm, (c) 30 μm, (d) 60 μm, and (e) 90 μm, after the exchange from CH4 gas to CO2 gas.
Author Contributions
M.P.: writing—original draft, data curation and analysis; N.A.I.: writing—review and editing, data curation and analysis; M.L.-H.: writing—review and editing and data interpretation; C.A.K.: writing—review and editing; J.M.S.: supervision, writing—review and editing and data interpretation. All authors have read and agreed to the published version of the manuscript.
Funding
This research received no external funding.
Acknowledgments
Mengdi Pan is thankful for the financial support from the program of the China Scholarship Council (No. 201704910817). Nur Aminatulmimi Ismail acknowledges the funding received from the Deutscher Akademischer Austauschdienst (DAAD) Scholarship.
Conflicts of Interest
The authors declare no conflict of interest.
References
- von Stackelberg, M. Feste Gashydrate. Naturwissenschaften 1949, 36, 327–333. [Google Scholar] [CrossRef]
- Sloan, E.D.; Koh, C.A. Clathrate Hydrates of Natural Gases, 3rd ed.; CRC Press Taylor and Francis Group: Boca Raton, FL, USA, 2008. [Google Scholar]
- Makogon, Y.F. Natural gas hydrates—A promising source of energy. J. Nat. Gas Sci. Eng. 2010, 2, 49–59. [Google Scholar] [CrossRef]
- Sloan, E.D. Fundamental principles and applications of natural gas hydrates. Nature 2003, 426, 353–359. [Google Scholar] [CrossRef] [PubMed]
- Kvenvolden, K.A. Gas hydrates—Geological perspective and global change. Rev. Geophys. 1993, 31, 173–187. [Google Scholar] [CrossRef]
- Hunter, R.B.; Collett, T.S.; Boswell, R.; Anderson, B.J.; Digert, S.A.; Pospisil, G.; Baker, R.; Weeks, M. Mount Elbert Gas Hydrate Stratigraphic Test Well, Alaska North Slope: Overview of scientific and technical program. Mar. Pet. Geol. 2011, 28, 295–310. [Google Scholar] [CrossRef]
- Kurihara, M.; Sato, A.; Funatsu, K.; Ouchi, H.; Yamamoto, K.; Numasawa, M.; Ebinuma, T.; Narita, H.; Masuda, Y.; Dallimore, S.R.; et al. Analysis of production data for 2007/2008 mallik gas hydrate production tests in Canada. In Proceedings of the International oil and Gas Conference and Exhibition in China, Society of Petroleum Engineers, Beijing, China, 8–10 June 2010; pp. 2908–2931. [Google Scholar]
- Yamamoto, K.; Terao, Y.; Fujii, T.; Ikawa, T.; Seki, M.; Matsuzawa, M.; Kanno, T. Operational overview of the first offshore production test of methane hydrates in the Eastern Nankai Trough. In Proceedings of the Offshore Technology Conference, Houston, TX, USA, 8 May 2014; pp. 1–15. [Google Scholar]
- Moridis, G.; Kowalsky, M.B.; Pruess, K. Depressurization-Induced Gas Production From Class 1 Hydrate Deposits. Soc. Pet. Eng. 2007, 10, 458–481. [Google Scholar] [CrossRef]
- Schicks, J.M.; Spangenberg, E.; Giese, R.; Luzi-Helbing, M.; Priegnitz, M.; Beeskow-Strauch, B. A counter-current heat-exchange reactor for the thermal stimulation of hydrate-bearing sediments. Energies 2013, 6, 3002–3016. [Google Scholar] [CrossRef]
- Zhang, Y.Q.; Liang, J.; Li, K.; Wang, H.B.; Li, X.M.; Wu, J.X. Research Progress of Drilling Coring and Mining on the Permafrost Natural Gas Hydrates in China. In Proceedings of the Geological Engineering Drilling Technology Conference (IGEDTC), Chengdu, China, 20–22 June 2014; Volume 73, pp. 362–367. [Google Scholar]
- Fitzgerald, G.C.; Castaldi, M.J. Thermal Stimulation Based Methane Production from Hydrate Bearing Quartz Sediment. Ind. Eng. Chem. Res. 2013, 52, 6571–6581. [Google Scholar] [CrossRef]
- Kamath, V.A.; Mutalik, P.N.; Sira, J.H.; Patil, S.L. Experimental study of brine injection and depressurization methods for dissociation of gas hydrates. SPE Form. Eval. 1991, 6, 477–484. [Google Scholar] [CrossRef]
- Li, X.S.; Wan, L.H.; Li, G.; Li, Q.P.; Chen, Z.Y.; Yan, K.F. Experimental Investigation into the Production Behavior of Methane Hydrate in Porous Sediment with Hot Brine Stimulation. Ind. Eng. Chem. Res. 2008, 47, 9696–9702. [Google Scholar] [CrossRef]
- Dallimore, S.R.; Collett, T.S. Summary and implications of the Mallik 2002 Gas Hydrate Production ResearchWell Program. In Scientific Results from the Mallik 2002 Gas Hydrate Production Research Well Program, Mackenzie Delta, Northwest Territories, Canada; Dallimore, S.R., Collett, T.S., Eds.; Geological Survey of Canada: Ottawa, ON, Canada, 2005; pp. 1–36. [Google Scholar]
- Falser, S.; Uchida, S.; Palmer, A.C.; Soga, K.; Tan, T.S. Increased gas production from hydrates by combining depressurization with heating of the wellbore. Energy Fuels 2012, 26, 6259–6267. [Google Scholar] [CrossRef]
- Moridis, G.J.; Collett, T.S.; Boswell, R.; Kurihara, M.; Reagan, M.T.; Koh, C.A.; Sloan, E.D. Toward production from gas hydrates: Current status, assessment of resources, and simulation-based evaluation of technology and potential. SPE Reserv. Eval. Eng. 2009, 12, 745–771. [Google Scholar] [CrossRef]
- Gunn, D.A.; Nelder, L.M.; Rochelle, C.A.; Bateman, K.; Jackson, P.D.; Lovell, M.A.; Hobbs, P.R.N.; Long, D.; Rees, J.G.; Schultheiss, P.; et al. Towards improved ground models for slope instability evaluations through better characterization of sediment-hosted gas-hydrates. Terra Nov. 2002, 14, 443–451. [Google Scholar] [CrossRef]
- Ersland, G.; Husebø, J.; Graue, A.; Kvamme, B. Transport and storage of CO2 in natural gas hydrate reservoirs. Energy Procedia 2009, 1, 3477–3484. [Google Scholar] [CrossRef]
- Everett, S.M.; Rawn, C.J.; Chakoumakos, B.C.; Keffer, D.J.; Huq, A.; Phelps, T.J. Insights into the structure of mixed CO2/CH4 in gas hydrates. Am. Mineral. 2015, 100, 1203–1208. [Google Scholar] [CrossRef]
- Park, Y.; Kim, D.-Y.; Lee, J.-W.J.; Huh, D.-G.; Park, K.-P.; Lee, J.-W.J.; Lee, H. Sequestering carbon dioxide into complex structures of naturally occurring gas hydrates. Proc. Natl. Acad. Sci. USA 2006, 103, 12690–12694. [Google Scholar] [CrossRef]
- Khlebnikov, V.N.; Antonov, S.V.; Mishin, A.S.; Bakulin, D.A.; Khamidullina, I.V.; Liang, M.; Vinokurov, V.A.; Gushchin, P.A. A new method for the replacement of CH4 with CO2 in natural gas hydrate production. Nat. Gas Ind. B 2016, 3, 445–451. [Google Scholar] [CrossRef]
- Lee, H.; Seo, Y.; Seo, Y.T.; Moudrakovski, I.L.; Ripmeester, J.A. Recovering Methane from Solid Methane Hydrate with Carbon Dioxide. Angew. Chem. Int. Ed. 2003, 42, 5048–5051. [Google Scholar] [CrossRef]
- Schicks, J.M.; Luzi, M.; Beeskow-Strauch, B. The Conversion Process of Hydrocarbon Hydrates into CO2 Hydrates and Vice Versa: Thermodynamic Considerations. J. Phys. Chem. A 2011, 115, 13324–13331. [Google Scholar] [CrossRef]
- Hirohama, S.; Shimoyama, Y.; Wakabayashi, A.; Tatsuta, S.; Nishida, N. Conversion of CH4-hydrate to CO2-hydrate in liquid CO2. J. Chem. Eng. Jpn. 1996, 29, 1014–1020. [Google Scholar] [CrossRef]
- Ota, M.; Morohashi, K.; Abe, Y.; Watanabe, M.; Lee Smith, R.; Inomata, H. Replacement of CH4 in the hydrate by use of liquid CO2. Energy Convers. Manag. 2005, 46, 1680–1691. [Google Scholar] [CrossRef]
- Zhou, X.; Fan, S.; Liang, D.; Du, J. Replacement of methane from quartz sand-bearing hydrate with carbon dioxide-in-water emulsion. Energy Fuels 2008, 22, 1759–1764. [Google Scholar] [CrossRef]
- Xiong, L.J.; Li, X.-S.; Zeng, Z.Y.; Li, G.; Chen, Z.Y.; Zhang, Y.; Li, Q.P. Experimental investigation into replacement of CH4 in hydrate in porous sediment with liquid CO2 injection. In Proceedings of the 7th International Conference on Gas Hydrate, Edinburgh, Scotland, UK, 17–21 July 2011. [Google Scholar]
- Deusner, C.; Bigalke, N.; Kossel, E.; Haeckel, M. Methane production from gas hydrate deposits through injection of supercritical CO2. Energies 2012, 5, 2112–2140. [Google Scholar] [CrossRef]
- Boswell, R.; Schoderbek, D.; Collett, T.S.; Ohtsuki, S.; White, M.; Anderson, B.J. The Iġnik Sikumi field experiment, Alaska North Slope: Design, operations, and implications for CO2-CH4 exchange in gas hydrate reservoirs. Energy Fuels 2017, 31, 140–153. [Google Scholar] [CrossRef]
- Schicks, J.M.; Strauch, B.; Heeschen, K.U.; Spangenberg, E.; Luzi-Helbing, M. From Microscale (400 μl) to Macroscale (425 L): Experimental Investigations of the CO2/N2-CH4 Exchange in Gas Hydrates Simulating the Iġnik Sikumi Field Trial. J. Geophys. Res. Solid Earth 2018, 123, 3608–3620. [Google Scholar] [CrossRef]
- Beeskow-Strauch, B.; Schicks, J.M. The Driving Forces of Guest Substitution in Gas Hydrates-A Laser Raman Study on CH4-CO2 Exchange in the Presence of Impurities. Energies 2012, 5, 420–437. [Google Scholar] [CrossRef]
- Falenty, A.; Murshed, M.M.; Salamatin, A.N.; Kuhs, W.F. Gas replacement in clathrate hydrates during CO2 injection—Kinetics and micro-structural mechanism. In Proceedings of the ISOPE Ocean Mining Symposium, Szczecin, Poland, 22–26 September 2013; pp. 109–115. [Google Scholar]
- Lee, B.R.; Koh, C.A.; Sum, A.K. Quantitative measurement and mechanisms for CH4 production from hydrates with the injection of liquid CO2. Phys. Chem. Chem. Phys. 2014, 16, 14922–14927. [Google Scholar] [CrossRef]
- Murshed, M.M.; Schmidt, B.C.; Kuhs, W.F. Kinetics of methane-ethane gas replacement in clathrate-hydrates studied by time-resolved neutron diffraction and Raman spectroscopy. J. Phys. Chem. A 2010, 114, 247–255. [Google Scholar] [CrossRef]
- Ota, M.; Abe, Y.; Watanabe, M.; Smith, R.L.; Inomata, H. Methane recovery from methane hydrate using pressurized CO2. Fluid Phase Equilib. 2005, 228, 553–559. [Google Scholar] [CrossRef]
- Kvamme, B.; Graue, A.; Buanes, T.; Kuznetsova, T.; Ersland, G. Storage of CO2 in natural gas hydrate reservoirs and the effect of hydrate as an extra sealing in cold aquifers. Int. J. Greenh. Gas Control 2007, 1, 236–246. [Google Scholar] [CrossRef]
- Yoon, J.H.; Kawamura, T.; Yamamoto, Y.; Komai, T. Transformation of methane hydrate to carbon dioxide hydrate: In situ Raman spectroscopic observations. J. Phys. Chem. A 2004, 108, 5057–5059. [Google Scholar] [CrossRef]
- Mok, J.; Choi, W.; Seo, Y. Time-dependent observation of a cage-specific guest exchange in sI hydrates for CH4 recovery and CO2 sequestration. Chem. Eng. J. 2020, 4, 1–10. [Google Scholar] [CrossRef]
- Falenty, A.; Qin, J.; Salamatin, A.N.; Yang, L.; Kuhs, W.F. Fluid Composition and Kinetics of the in Situ Replacement in CH4–CO2 Hydrate System. J. Phys. Chem. C 2016, 120, 27159–27172. [Google Scholar] [CrossRef]
- Zhou, X.; Lin, F.; Liang, D. Multiscale Analysis on CH4-CO2 Swapping Phenomenon Occurred in Hydrates. J. Phys. Chem. C 2016, 120, 25668–25677. [Google Scholar] [CrossRef]
- Kang, H.; Koh, D.Y.; Lee, H. Nondestructive natural gas hydrate recovery driven by air and carbon dioxide. Sci. Rep. 2014, 4, 1–8. [Google Scholar] [CrossRef] [PubMed]
- Shin, K.; Park, Y.; Cha, M.; Park, K.P.; Huh, D.G.; Lee, J.; Kim, S.J.; Lee, H. Swapping phenomena occurring in deep-sea gas hydrates. Energy Fuels 2008, 22, 3160–3163. [Google Scholar] [CrossRef]
- Cha, M.; Shin, K.; Lee, H.; Moudrakovski, I.L.; Ripmeester, J.A.; Seo, Y. Kinetics of methane hydrate replacement with carbon dioxide and nitrogen gas mixture using in situ NMR spectroscopy. Environ. Sci. Technol. 2015, 49, 1964–1971. [Google Scholar] [CrossRef]
- Salamatin, A.N.; Falenty, A.; Kuhs, W.F. Diffusion Model for Gas Replacement in an Isostructural CH4-CO2 Hydrate System. J. Phys. Chem. C 2017, 121, 17603–17616. [Google Scholar] [CrossRef]
- Schicks, J.M.; Pan, M.; Giese, R.; Poser, M.; Aminatulmimi, N.I.; Luzi-Helbing, M.; Bleisteiner, B.; Lenz, C. A new high-pressure cell for systematic in situ investigations of micro-scale processes in gas hydrates using confocal micro-Raman spectroscopy. Rev. Sci. Instrum. 2020, 91, 115103. [Google Scholar] [CrossRef]
- Schicks, J.M.; Ripmeester, J.A. The coexistence of two different methane hydrate phases under moderate pressure and temperature conditions: Kinetic versus thermodynamic products. Angew. Chem. Int. Ed. 2004, 43, 3310–3313. [Google Scholar] [CrossRef]
- Aktins, P.; Jones, L. Chemical Principles: The Quest for Insight, 3rd ed.; W.H. Freeman: New York, NY, USA, 1940. [Google Scholar]
- Wedler, G.; Freund, H.-J. Lehrbuch der Physikalischen Chemie, 6th ed.; Wiley-VCH: Weinheim, Germany, 2012. [Google Scholar]
- Beeskow-Strauch, B.; Schicks, J.M.; Spangenberg, E.; Erzinger, J. The influence of SO2 and NO2 impurities on CO2 gas hydrate formation and stability. Chem. A Eur. J. 2011, 17, 4376–4384. [Google Scholar] [CrossRef] [PubMed]
- Burke, A.J.E. Raman microspectrometry of fluid inclusions. Lithos 2001, 55, 139–158. [Google Scholar] [CrossRef]
- Schrader, B. Infrared and Raman Spectroscopy: Methods and Applications; VCH Verlagsgesellschaft mbH: Weinheim, Germany, 1995. [Google Scholar]
- Schrötter, H.W.; Klöckner, H.W. Raman Scattering Cross Sections in Gases and Liquids. In Raman Spectroscopy of Gases and Liquids. Topics in Current Physics, Volume 11; Springer: Berlin/Heidelberg, Germany, 1979; pp. 123–166. [Google Scholar]
- Qin, J.; Kuhs, W.F. Quantitative analysis of gas hydrates using Raman spectroscopy. AIChE J. 2013, 59, 2155–2167. [Google Scholar] [CrossRef]
- Eaves, J.D.; Loparo, J.J.; Fecko, C.J.; Roberts, S.T.; Tokmakoff, A.; Geissler, P.L. Hydrogen bonds in liquid water are broken only fleetingly. Proc. Natl. Acad. Sci. USA 2005, 102, 13019–13022. [Google Scholar] [CrossRef]
- Pakoulev, A.; Wang, Z.; Dlott, D.D. Vibrational relaxation and spectral evolution following ultrafast OH stretch excitation of water. Chem. Phys. Lett. 2003, 371, 594–600. [Google Scholar] [CrossRef]
- Hester, K.C.; White, S.N.; Peltzer, E.T.; Brewer, P.G.; Sloan, E.D. Raman spectroscopic measurements of synthetic gas hydrates in the ocean. Mar. Chem. 2006, 98, 304–314. [Google Scholar] [CrossRef]
- Avrami, M. Kinetics of phase change. I: General theory. J. Chem. Phys. 1939, 7, 1103–1112. [Google Scholar] [CrossRef]
- Schmalzried, H. Chemical Kinetics of Solids; VCH: Weinheim, Germany, 1995. [Google Scholar]
- Susilo, R.; Ripmeester, J.A.; Englezos, P. Methane conversion rate into structure H hydrate crystals from ice. AIChE J. 2007, 53, 2451–2460. [Google Scholar] [CrossRef]
- Wang, X.; Schultz, A.J.; Halpern, Y. Kinetics of methane hydrate formation from polycrystalline deuterated ice. J. Phys. Chem. A 2002, 106, 7304–7309. [Google Scholar] [CrossRef]
- Luzi, M.; Schicks, J.M.; Naumann, R.; Erzinger, J. Systematic kinetic studies on mixed gas hydrates by Raman spectroscopy and powder X-ray diffraction. J. Chem. Thermodyn. 2012, 48, 28–35. [Google Scholar] [CrossRef]
- Zhao, J.; Zhang, L.; Chen, X.; Fu, Z.; Liu, Y.; Song, Y. Experimental Study of Conditions for Methane Hydrate Productivity by the CO2 Swap Method. Energy Fuels 2015, 29, 6887–6895. [Google Scholar] [CrossRef]
- Jander, W. Reaktionen im festen Zustande bei höheren Temperaturen. Reaktionsgeschwindigkeiten endotherm verlaufender Umsetzungen. Zeitschrift für Anorg. Allg. Chem. 1927, 163, 1–30. [Google Scholar] [CrossRef]
- Levenspiel, O. Chemical reaction engineering. In Industrial and Engineering Chemistry Research; John Wiley & Sons: New York, NY, USA, 1999; pp. 4140–4143. [Google Scholar]
- Fujii, K.; Kondo, W. Kinetics of the Hydration of Tricalcium Silicate. J. Am. Ceram. Soc. 1974, 57, 492–497. [Google Scholar] [CrossRef]
- Chen, X.; Espinoza, D.N. Ostwald ripening changes the pore habit and spatial variability of clathrate hydrate. Fuel 2018, 214, 614–622. [Google Scholar] [CrossRef]
- Kuang, Y.; Feng, Y.; Yang, L.; Song, Y.; Zhao, J. Effects of micro-bubbles on the nucleation and morphology of gas hydrate crystals. Phys. Chem. Chem. Phys. 2019, 21, 23401–23407. [Google Scholar] [CrossRef]
- Jung, J.W.; Santamarina, J.C. Hydrate formation and growth in pores. J. Cryst. Growth 2012, 345, 61–68. [Google Scholar] [CrossRef]
- Uchida, T.; Kishi, D.; Shiga, T.; Nagayama, M.; Gohara, K. Sintering process observations on gas hydrates under hydrate-stable and self-preservation conditions. J. Chem. Eng. Data 2015, 60, 284–292. [Google Scholar] [CrossRef]
- Chaouachi, M.; Neher, S.H.; Falenty, A.; Kuhs, W.F. Time Resolved Coarsening of Clathrate Crystals: The Case of Gas Hydrates. Cryst. Growth Des. 2017, 17, 2458–2472. [Google Scholar] [CrossRef]
- Perez, M. Gibbs-Thomson effects in phase transformations. Scr. Mater. 2005, 52, 709–712. [Google Scholar] [CrossRef]
Publisher’s Note: MDPI stays neutral with regard to jurisdictional claims in published maps and institutional affiliations. |
© 2020 by the authors. Licensee MDPI, Basel, Switzerland. This article is an open access article distributed under the terms and conditions of the Creative Commons Attribution (CC BY) license (http://creativecommons.org/licenses/by/4.0/).