Article

Experimental Investigation and Energy Performance Simulation of Mongolian Ger with ETS Heater and Solar PV in Ulaanbaatar City

by
Bat-Erdene Bayandelger
1,2,*,
Yuzuru Ueda
3 and
Amarbayar Adiyabat
2
1
Department of Natural and Social Science, Institute of Railway, bldg. 2, Peace avenue, Bayangol district, Ulaanbaatar 18104, Mongolia
2
Renewable Energy Laboratory, Department of Electronics and Communication Engineering, School of Engineering and Applied Science, National University of Mongolia, bldg. 3, Ikh Sruguuliin gudamj-3, Sukhbaatar District, Ulaanbaatar 14201, Mongolia
3
Department of Electrical Engineering, Graduate School of Engineering, Tokyo University of Science, Katsushika campus, 6 Chome-3-1, Niijuku, Katsushika City, Tokyo 123-8585, Japan
*
Author to whom correspondence should be addressed.
Energies 2020, 13(21), 5840; https://doi.org/10.3390/en13215840
Submission received: 26 July 2020 / Revised: 30 September 2020 / Accepted: 19 October 2020 / Published: 9 November 2020
(This article belongs to the Section G: Energy and Buildings)

Abstract

:
There are approximately 200,000 households living in detached houses and gers (yurts) with small coal stoves that burn raw coal in Ulaanbaatar city. A proper heating system and improvement of the energy efficiency of residential dwellings are vitally important for Ulaanbaatar city to reduce air pollution as well as for the operation of the current central energy system. This study shows the experimental results for two gers with two different heating systems and different thermal insulation, for investigating the merits of each. The technical feasibility of the system consisting of an electric thermal storage (ETS) heater with a daytime charging schedule and areal photovoltaic (PV) system was also examined by using a simulation with software developed in MATLAB (R2020a, MathWorks, USA). As a result of the experiment, the indoor comfort level and energy efficiency of the ger with added insulation and an ETS heater with nighttime charging were shown to be enhanced compared with those of the reference ger. The ger with added insulation and the ETS heater consumed 3169 kWh for electric appliances and 5989 kWh for the heating season. The simulation showed that the PV self-consumption rate is 76% for the Ger 2 with the ETS heater because of the daytime charging schedule of the ETS heater. The PV system supplied 31% of the total energy consumed, with the remaining 69% from the main grid.

1. Introduction

Energy-efficient buildings with proper heating systems reduce air pollution, fuel consumption, and electricity costs. In addition, with rapidly growing world energy use, climate change is necessitating energy-efficient buildings, proper heating systems, and energy sources for them [1].
Ulaanbaatar city is one of the coldest cities in the world and has a long space-heating season, which continues annually from October to May. About 70% of the total energy consumed is used for space heating. There are, in total, 184,000 households that have 3–7 kW individual coal-burning stoves. Their pollutant emissions have recently been becoming a big problem and impacting the health of citizens. About 40% of these households live in Mongolian gers (yurts) [2,3].
Therefore, improving the energy efficiency of Mongolian gers and the choice of proper heating systems is vitally important for reducing pollutant emissions [4,5]. This paper investigates the energy performance of Mongolian gers with electric thermal storage (ETS) heaters and added envelope insulation through comparative experimentation with a reference ger, which has a traditional heater and envelope materials. Benoit et al. introduced the design and architectural data for gers in his article about the sun clock, while Tsovoodavaa et al. provided more detailed historical, design, and structural information on the yurt [6,7]. Additionally, her extended article presents the results of thermal dynamic simulations in the Mongolian climate [8].
In 1980, the ETS heater was designed, in which the electricity converted by a heating element to thermal energy is accumulated in a magnesium brick for later use. Various developments in terms of design, numerical and experimental studies based on the designed ETS heater, performance evaluation, and feasibility studies of the ETS heater were carried out [9,10,11,12,13]. Additionally, it plays a big role in the integration of renewable energy generation with the main grid. It also brings various benefits to customers such a lowered electricity cost and to the main grid by load shifting and peak shaving [14,15]. In the second section of this study, a 5 kW ETS heater, which is to be installed in the ger with additional insulation and supplied from a grid-connected 3.12 kW p solar photovoltaic (PV) (hereafter referred as the proposed system), was simulated for evaluating its technical feasibility.

2. Methodology

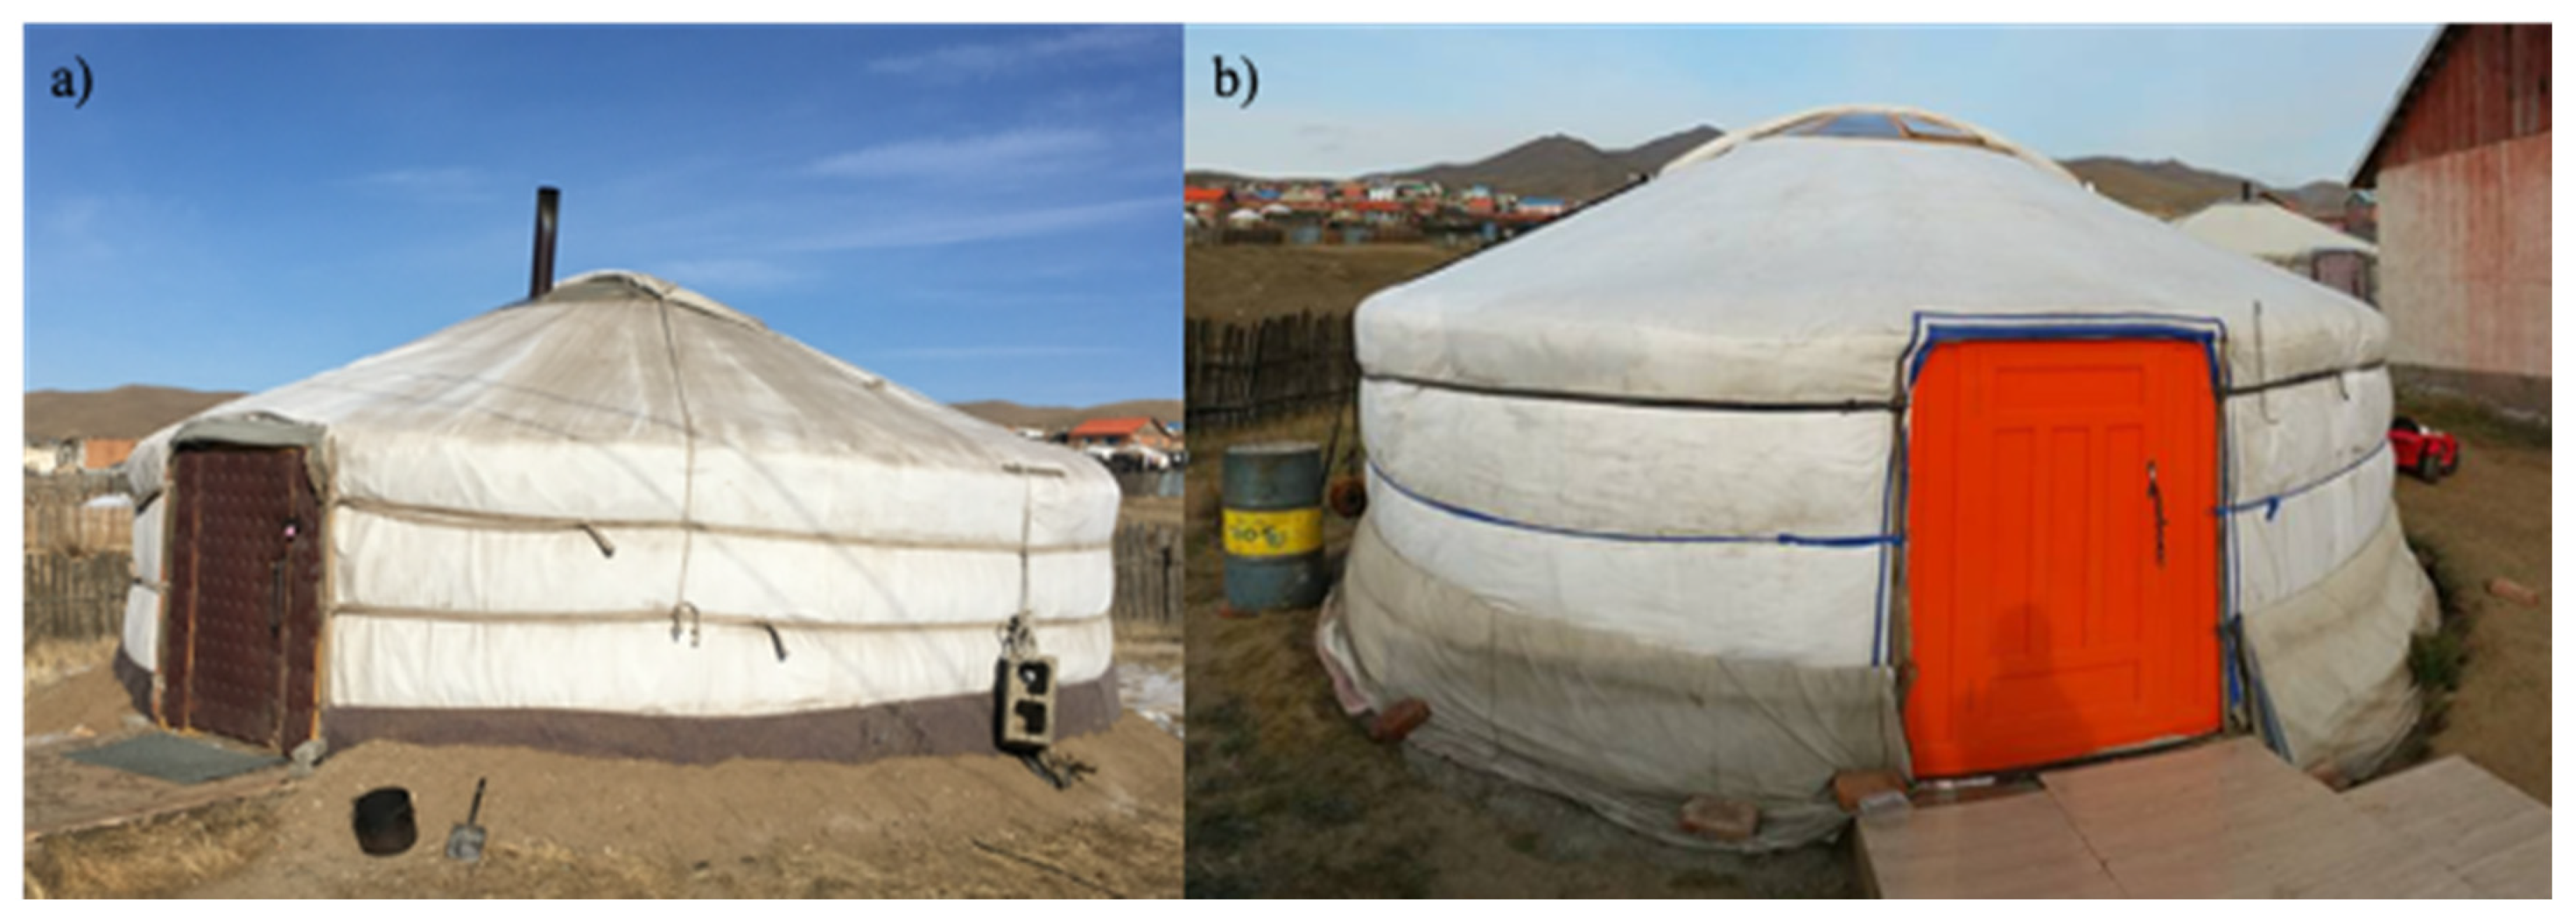
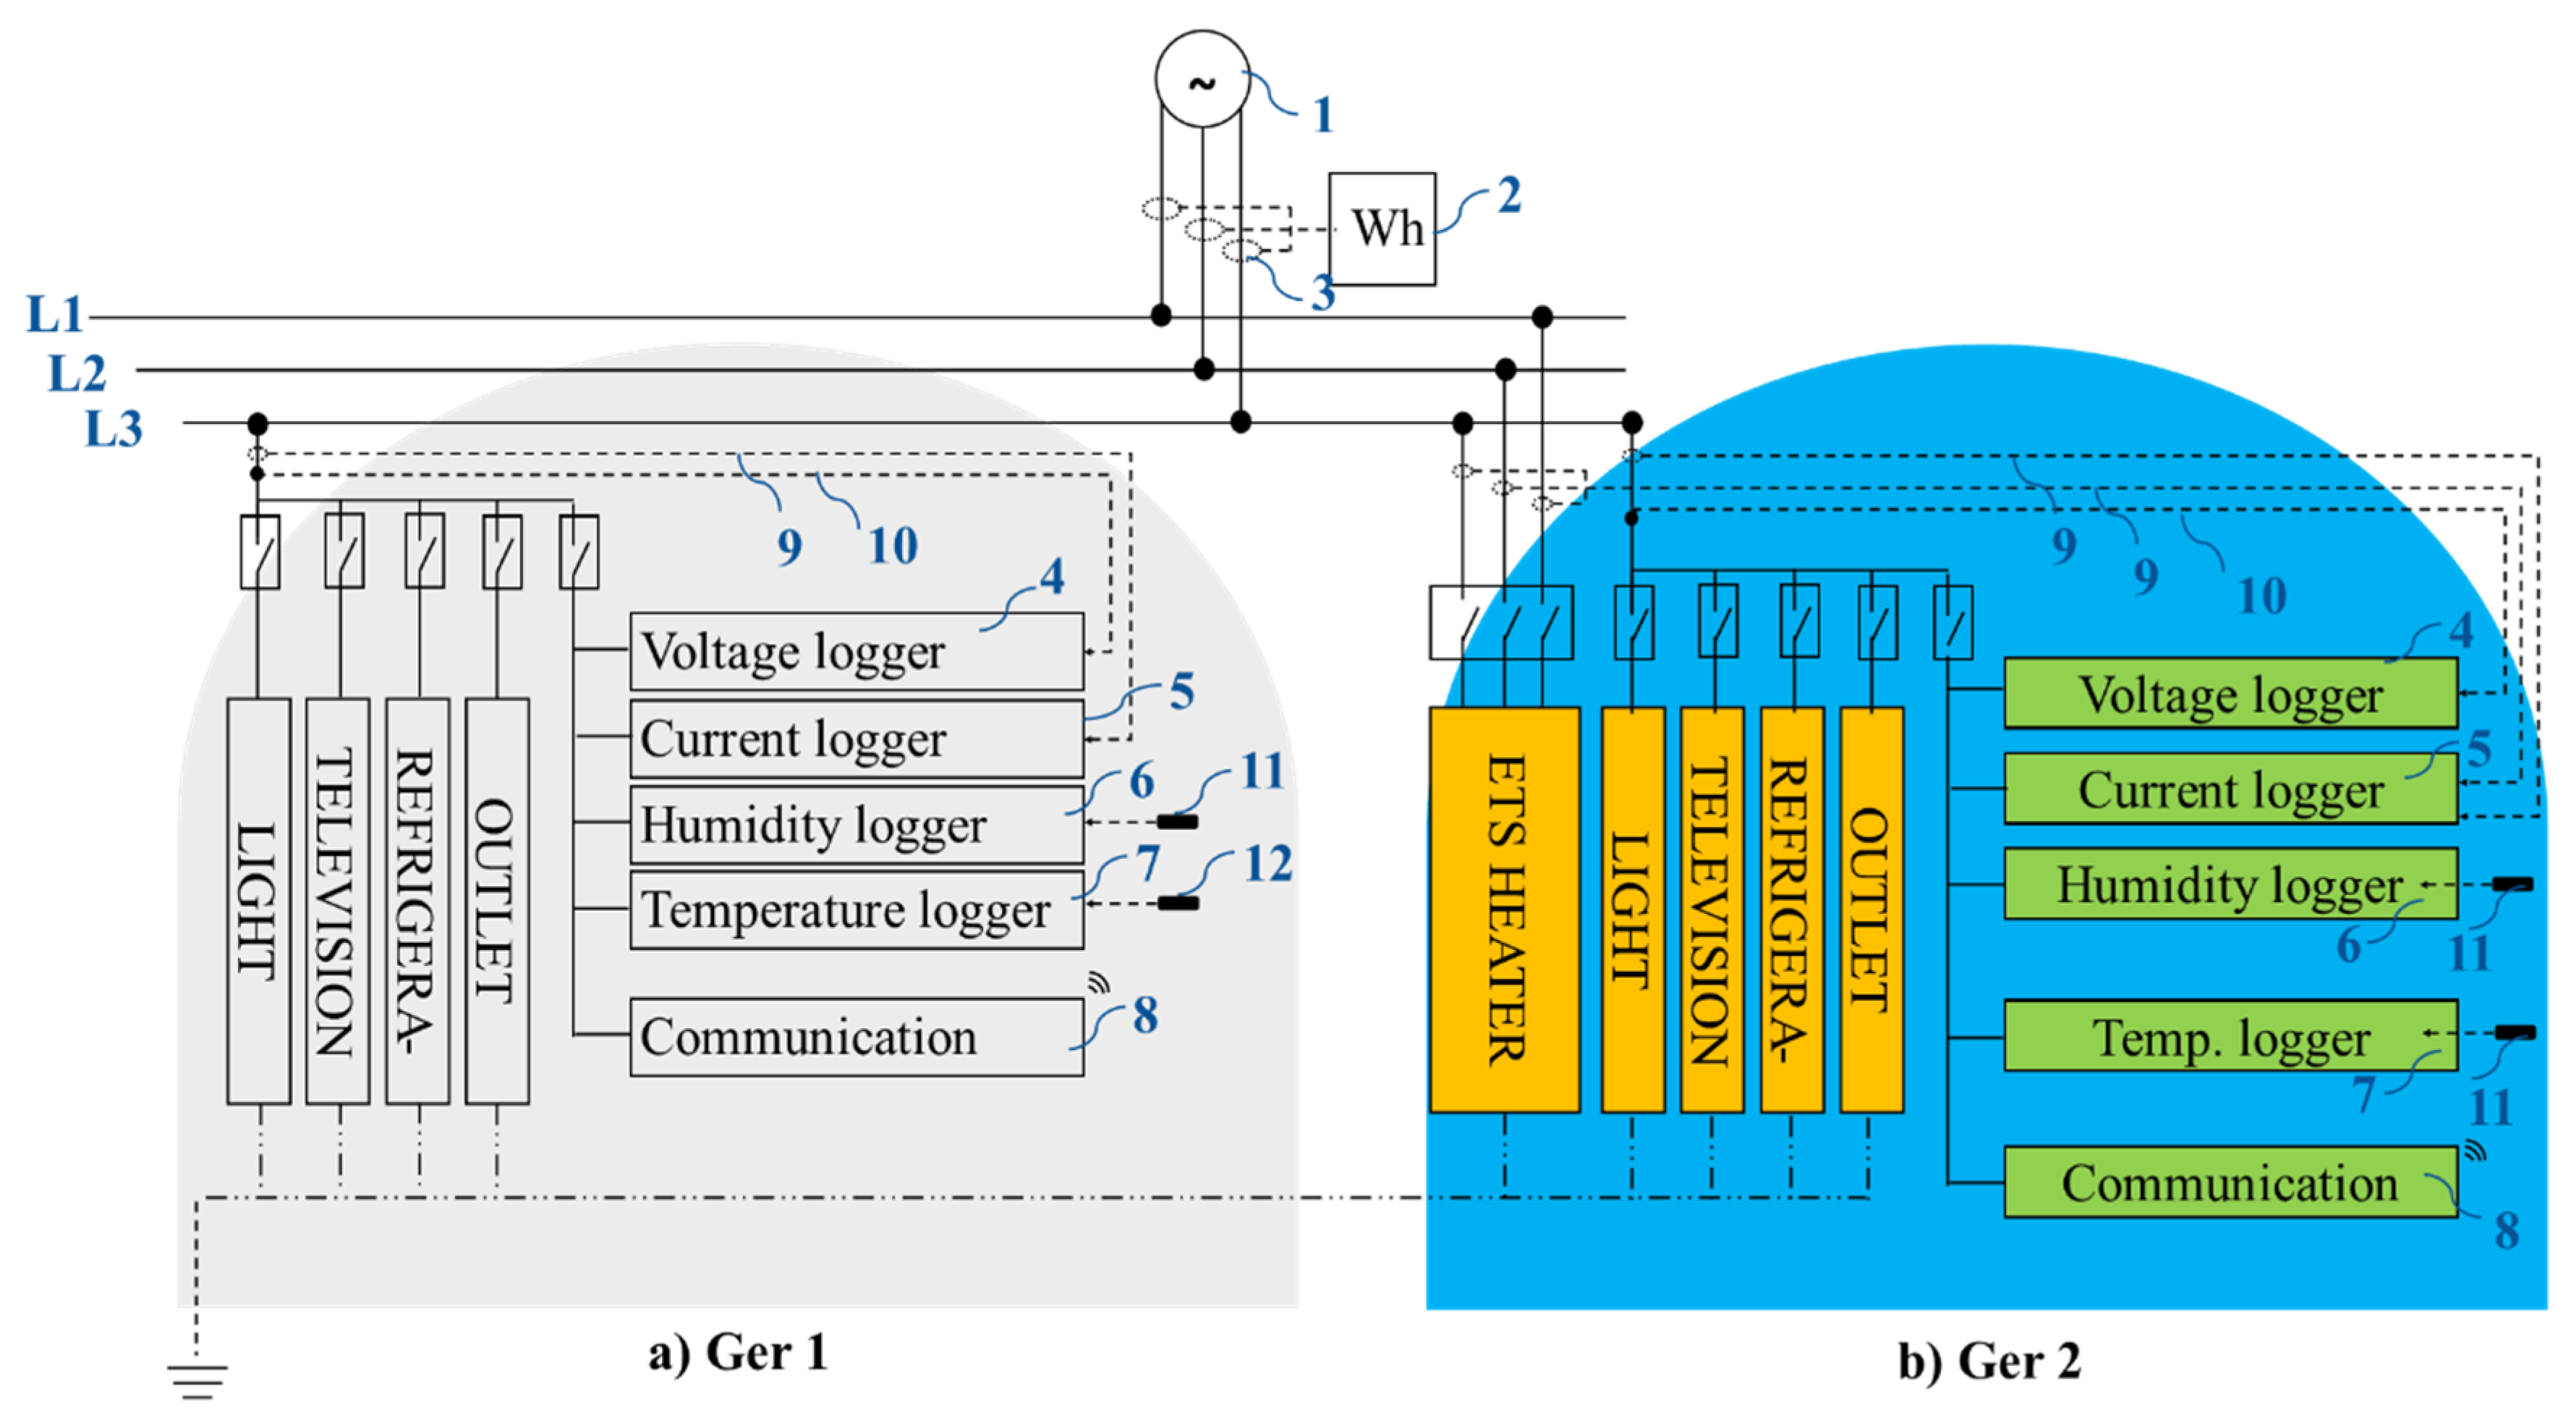
2.1. Experimentation with the Insulated Ger with ETS Heater

We installed two Mongolian gers for evaluating the enhancements of energy performance (47° 52′ 8″ N and 107° 7′ 22″ E).
Figure 1 shows a view of the installed gers at the Urgakhnaran test site. The ger shown in Figure 1a has standard envelope materials and a coal-burning stove (hereafter referred to as Ger 1). The ger in Figure 1b has added envelope materials and the ETS heater (hereafter referred to as Ger 2).
The thermal and technical details of the envelope materials of these gers are explained in Appendix A. Here, the added insulation material on the envelope of Ger 2 is highlighted. The crown wheel of Ger 2 is insulated by a 4 mm polycarbonate sheet, while 3 mm aluminum foils are aligned through the roof, wall, door, door frame, and floor for blocking the radiation of thermal energy in Ger 2. We used 30 mm thicker felt for the wall and 100 mm thicker Styrofoam for the floor of Ger 2 than Ger 1′s. Figure 2 shows an electrical diagram of the experimental setup and electrical wiring of the two gers. As shown in Figure 2a, the light, television, refrigerator, and outlet, etc.—the major electrical appliances—of Ger 1 were supplied from the main grid (1), and the total electricity consumption of both gers was measured using a power meter (2) with a three-phase current sensor (3). Voltage (10), current (9), temperature (12), and humidity (11) sensors attached to module loggers for the voltage (4), current (5), humidity (6), and temperature (7) measured the electricity consumption, indoor air temperature, and humidity. Figure 2b shows an electrical diagram of Ger 2.
The electricity consumption of the ETS heater was measured by voltage (4) and current (5) loggers with a voltage probe (9) and current clamp (10). The communication base (8) collected all the parameters via radio signals. The measurement resolution was 2 min. The measurement continued between 28 October 2017 and 8 June 2018 (refer to Table A2 of Appendix B).
Ger 1 used a lignite coal for heating and cooking. We measured the coal weight just before use in the coal stove. The measurement continued for 20 days in the annually coldest month, which is January. The lignite coal was extracted from the Baganuur coal reserve, and the coal weight was converted to kWh units according to Kyle’s converter [16].
Table 1 shows the electrical and technical details of the ETS heater installed in Ger 2. The ETS heater is factory equipped with an electronically integrated room-temperature control unit and a clock-signal-controlled relay. The charging mode of the ETS heater is controlled through the charging intensity selected by the customer, and the off-peak time for the electricity load in the main grid (between 21:00 and 05:00). For the period of the off-peak tariff, the K1 relay switches on the thermal relay of the heating element. The charging intensity is set by using a 47 potentiometer. If the signal received from the core temperature sensor PT100 exceeds a set value of resistance, the temperature regulator disconnects. The maximum value of the core temperature is 460 °C. If the room temperature sinks below the temperature set by the 47 potentiometer, the temperature regulator switches on the heater fan, dissipates warm air into the room, and turns off at the set temperature. The 450 resistance regulates the fan speed. Immediate heating on demand can provide a day-acting element. The day-acting element is run using an integrated rocker switch and works on the on-peak tariff.

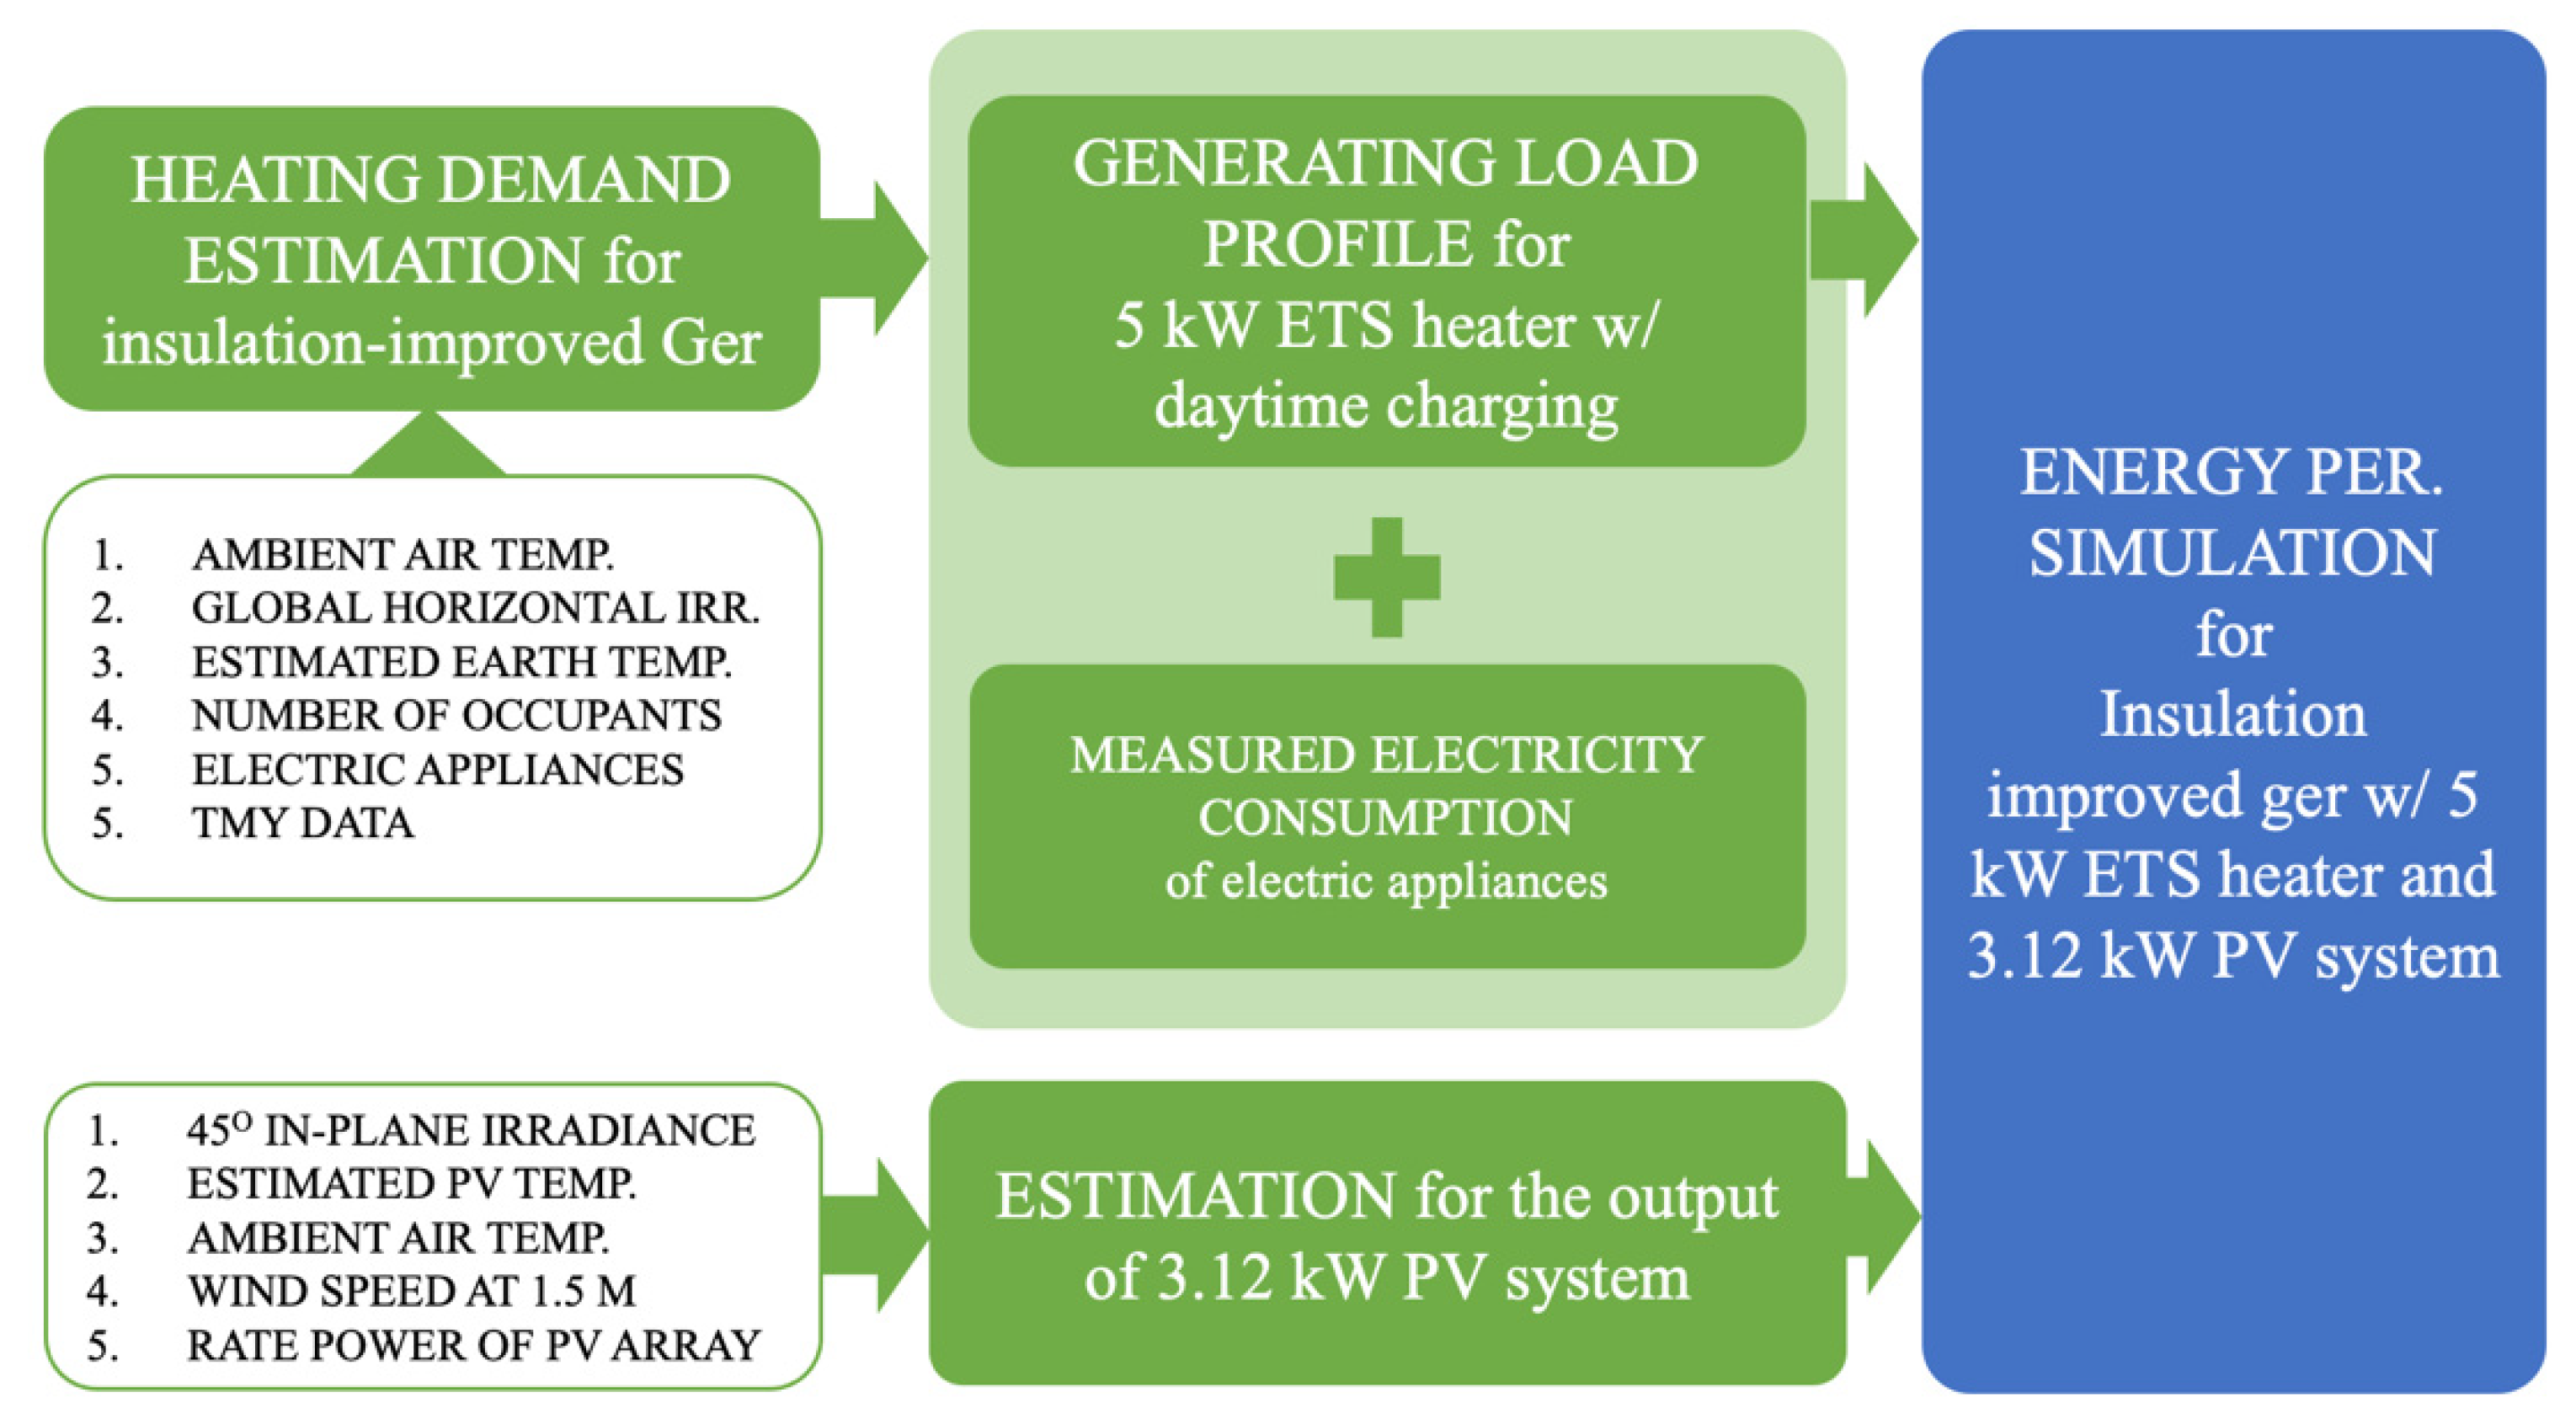
2.2. Simulation of the Proposed System

We simulated the operation of the solar PV combined with the ETS heater for evaluating its energy performance for the heating season. The simulation was carried out by using software developed in MATLAB. The system configuration was imagined consisting of a 5 kW electric heater with 40 kWh of thermal storage and a 3.12 kW PV system. We proposed using the ETS heater specified in Table 1 in the ger insulated according to Appendix A.
The electricity-generating solar PV system was connected to the main grid. The rated nominal capacity of the PV array is 3.12 kW; the inclined angle of the PV array is 45°.
The energy performance simulation procedure for the ger with the ETS heater and solar PV is presented in Figure 3. The simulation data generally consisted of the total electricity consumption and the estimated output of the solar PV. The data resolution was 2 min, and the data set had the same period as the measurements from experimentation. The sum of the electricity consumption of the electric appliances and the generated electricity consumption of the ETS heater made up the total electricity consumption. Here, we used the electricity consumption of the electric appliances in Ger 2 measured from the experimentation. The load profile of the ETS heater scheduled to charge in the daytime was generated from the estimated daily heating demand of the Mongolian ger, which had an envelope material specified in Appendix A.
The estimation method for heating demand is defined in Section 2.3, while Section 2.5 details the estimation of solar PV output (refer to Table A2 of Appendix B).
The electricity flow from the PV system to the main grid can be calculated by subtracting the total electricity consumed in the ger from the output power of the PV system. The amount of electricity consumed in the ger from the PV system can be expressed by subtracting the electricity flow from the PV system to the main grid from the output power of the PV system. The amount of electricity consumed in the ger from the main grid can be expressed by subtracting the electricity of the PV system consumed in the ger from the total electricity consumed in the ger. See Equations (1)–(3).
P g r i d , t p v 0 ,           P g r i d , t p v = P p v , t   P g e r , t
P g e r , t p v = P p v , t   P g r i d , t p v
P g r i d , t = P g e r , t   P g e r , t p v
Y = d = 1 D t = 1 T X t / D
where P g r i d , t p v stands for the electricity flow from the solar PV to the main grid at timestep t (kW), P p v , t stands for the electricity generated from the PV system at timestep t (kW), and P g e r , t stands for the electricity consumed in the ger at timestep t (kW). P g e r , t p v is the electricity consumed in the ger from the PV system. P g r i d , t stands for the electricity consumed in the ger from the main grid.
The daily amounts of P g r i d , t p v , P g e r , t p v , and P g r i d , t were calculated from the sums of 24 h values. The monthly average daily amounts can be expressed by dividing the monthly total value by the days per month. See Equation (4), where X t stands for the amounts of P g r i d , t p v , P g e r , t p v , and P g r i d , t at timestep t (kW). T stands for the number of hours per day (24). D stands for the number of days per month. d stands for the day number of the month.

2.3. Estimation of Heating Demand

There are various modelling techniques, which are generally categorized as bottom-up and top-down, available [17]. Building physics-based modelling is used to estimate heating demand. The heating demand of a ger, in another words, the thermal energy supply from the ETS heater ( H E T S ) to the ger, can be expressed by subtracting the conduction ( H C o n ), ventilation ( H V e n ), infiltration ( H I n f ), etc. heat losses through building envelope elements from the heat gains including irradiance ( H I r r ), occupants ( H O c c ), and electric appliances ( H A p p ) (refer to Equation (5). The heat loss conducted through walls, doors, crown wheels, ceilings, floors, etc. can be calculated as expressed in Equation (6). There is 15% extra heat, which is the radiation loss through the roofs to outside that is kept inside the ger by the aluminum foil materials. Since the ger has natural ventilation, Equation (7) can express the ventilation heat loss, whereas the heat loss caused by infiltration can be calculated as shown in Equation (8).
H E T S , t = H C o n , t + H V e n , t + H I n f , t + H O c c , t + H A p p , t + H I r r , t
H C o n , t = A · U · ( T i n d , t T a i r , t )
H V e n , t = C p · ρ · q v · ( T i n d , t T a i r , t )
H C o n , t = C p · ρ · n · V · ( T i n d , t T a i r , t )
H O c c , t = ( n a d u l t , t · b a d u l t , t · P c h i l d + n c h i l d , t · b c h i l d , t · P c h i l d )
H A p p , t =   i = 1 n b i ,     t ·   P A p p , i · F i ,     t
H I r r , t = G G H I · A C W
where A is the area of exposed surface ( m 2 ), U is the overall heat transmission coefficient ( W / m 2 K ), and T i n d , t is the indoor air temperature (20 ° C ). T out , t is the outdoor air temperature at timestep t. C p is the specific heat capacity of the air (1000 W / kgK ); ρ is the density of the air (1.2 kg/ m 3 ). q v is the air volume flow ( m 3 / s ). n is the number of air replacements in the room per second. V is the room volume ( m 3 ). n a d u l t , t is the number of adults at the timestep t . n c h i l d , t is the number of children at the timestep t. b a d u l t , t and b c h i l d , t are binary numbers that express occupied (1) or unoccupied (0). P A p p , i is the energy rate of the i th electric appliance. F i ,   t is the heat gain rate for the i th electric appliance (0.734). b i ,   t is a binary number that indicates either an on or off state for the i th electric appliance. G G H I is the global horizontal irradiance ( W / m 2 ). A C W is the surface area of the crown wheel.
Refer to Table A2. The measured ambient air temperature is used for estimating the conduction, ventilation, and infiltration heat losses. Heat gain due to irradiance is estimated by using global horizontal irradiance (GHI). Physical characteristic data for the Mongolian ger and thermal and technical data of its envelope materials are used in the calculations of heat gain and losses.
Estimating the conduction heat loss through the floor is not the same as estimating the conduction heat loss above ground. The estimation of the conduction heat loss through the floor involves two significant difficulties, including the fact that soil has a specific heat, so the heat can both flow and be stored as it flows. Second, the soil temperature changes with both the season and depth from the surface. However, the heat conducted from the ger to the ground ( H f , t ) can be calculated with the following simplified Equation (12). The conductance and the earth temperature are modelled according to Equations (13) and (14) [18].
H f , t = A f · U f , t · ( T i n d , t T e , t )
U f , t = 0.1140 4 + R f + 0.8768 16 + R f
T e = T o a , y r T a m p e D π / 365 α c o s ( 2 π 365 ( t y e a r t s h i f t D 2 365 π α ) )
where U f , t is the effective heat transmission coefficient ( W / m 2 K ). R f is the thermal resistivity of the ger floor ( m 2 K / W ).
T e is the effective earth temperature ( ° C ). T oa , yr is the annual average ambient air temperature ( ° C ). T amp is the amplitude of the surface temperature ( ° C ). D is the depth below the surface. α is the thermal diffusivity of the ground soil ( 10 6   m 2 / s ). t y e a r is the current time. t s h i f t is the day of the year with the minimum surface temperature.
The modelling of the earth temperature uses typical meteorological year (TMY) data. Detailed information including the rate of power, time schedule of the occupants, and operation time of major electric appliances are presented in Table 2. Equations (5)–(14) are entered into the software developed in MATLAB.

2.4. Load Profile Generation of ETS Heater Daytime Charging

The load profile of the ger with daytime charging of the ETS heater was generated for simulating the proposed system. The daily overall heating demand of the ger was calculated from the estimated heating demand with a 2 min resolution (refer to Equation (15)). The charging hours per day can be calculated with Equation (16). The binary number with a 2 min interval was created from the calculated charging hours of the ETS heater. The ETS charging hours were symmetrically aligned before and after midday (12:00 PM. Thus, the ETS heater has the ability to accumulate the electricity from the PV system as much as possible, and the PV self-consumption increases. The load profile with the daytime charging can be expressed as a multiplication between the created binary numbers and nominal rated power of the ETS heater (refer to Equation (17)).
H E T S , D = h = 1 H t = 1 T H E T S , t / T
T c h a r , h / D = H E T S , D / P E T S , n o m
P E T S _ c h a r g i n g , t = b c h a r g e , t · P E T S , n o m
where T is the number of measurements per hour. P E T S , n o m is the nominal rated power of the ETS heater. b c h a r g e , t is the binary file, which indicates on (1) and off (0) states for the ETS heater.

2.5. Estimation of Solar PV Output

Here, we estimated the output power of the 3.12 kW solar PV array with a 45° inclined angle for simulating the energy performance of the proposed system.
The plane of array (POA) irradiance, wind speed, and ambient air temperature of Ulaanbaatar were used for modelling the array temperature and output power of the PV. The data resolution was 2 min , while the data collection continued from 28 October of 2017 to 8 June of 2018. Equation (18) was referred to for estimating the output power of the solar PV.
P p v , t = P p v , s t c · ( G P O A / 1000 ) · ( 1 + γ ( T A + 25 ) ) · K
T A = G P O A · ( e a + b * W S ) · T a i r
where P p v , s t c is the rated capacity under the standard test condition (STC), γ is the temperature correction coefficient of the maximum power, and K is the loss factor including the incident angle, soil, snow, shading, degradation, conversion, and other unknown losses (0.87). G P O A is the irradiance received at the 45 °   inclined plane of the array. T A is the array temperature.
The estimation of the array temperature is expressed by Equation (19). T a i r is the ambient air temperature, W S is the wind speed, and b and a are parameters that depend on the array construction and materials as well as on the mounting configuration of the module (−3.56 and −0.075) [19].

3. Results and Discussion

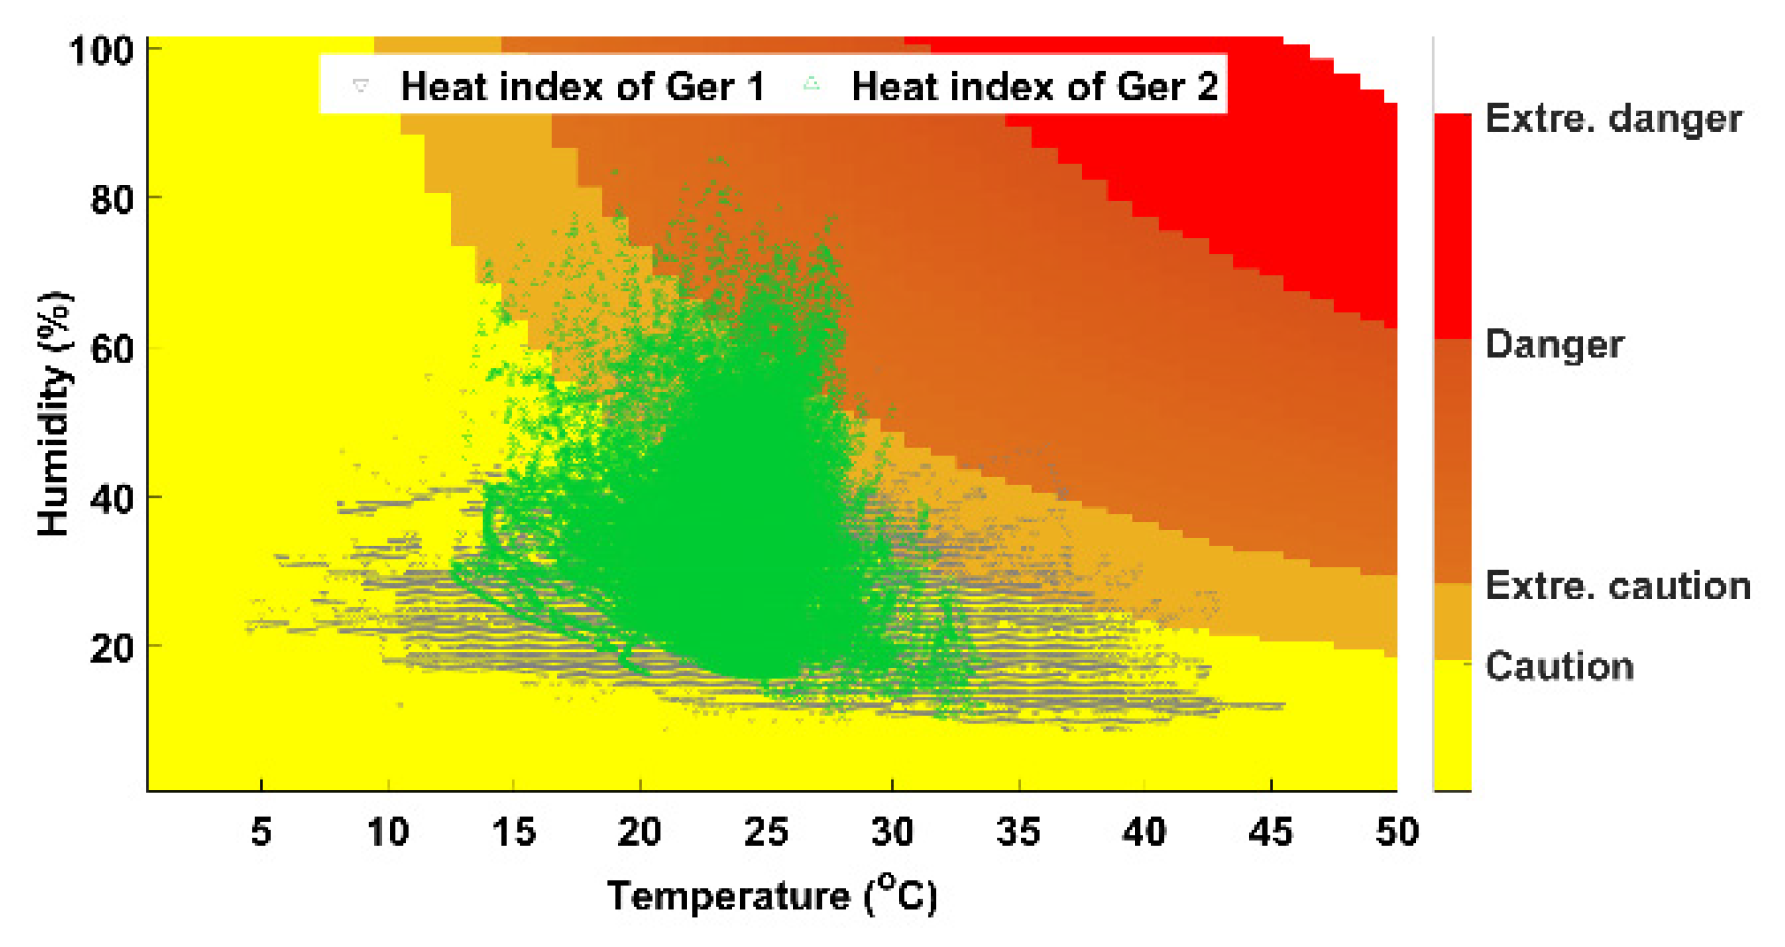
3.1. Experimental Results

Figure 4 shows the indoor heat indices of the two experimental gers against the standard heat index. The indoor air temperature of Ger 1 measured across a wider range than that of Ger 2, while the humidity of Ger 2 was increased compared to that of Ger 1, as shown by the heat indices of Ger 1 and 2 illustrated by black triangles and green triangles.
The wide fluctuation of temperature can be explained through the difference between the electronically integrated room temperature control of the ETS heater in Ger 2 and the uncontrolled combustion of coal in the small coal stove in Ger 1. Since conduction, ventilation, and infiltration heat gains are direct functions of the indoor air temperature, the heat consumption also follows the temperature rise. The aluminum foil material could have increased the indoor air humidity of Ger 2. Furthermore, the radiation barrier materials should be carefully selected for insulating the ger.
Figure 5 shows the daily energy performance of Ger 1 and 2 on the annually coldest days of the year, which are January 1 to January 20. The grey- and blue-colored bars indicates the daily heating consumption and electricity consumption of the electric appliances of Ger 1, and the daily energy consumption of Ger 2 is presented by green- and aqua-colored bars for the ETS heater and electric appliances.
The cooking and hot water are supplied by the coal combustion in the coal-burning stove. Thus, the electricity consumption of the electric appliances in Ger 2 is ~10% higher than that in Ger 1. On the other hand, the total heating consumption of Ger 1 is 30% higher than the electricity consumption of the ETS heater. The added insulation of Ger 2, and the electronically integrated room-temperature control unit of the ETS heater etc., could reduce the heating consumption. Households living in detached houses and gers should use the various heaters equipped with electronically integrated room-temperature control units and clock-signal-controlled relays. This is because they allow energy saving for space heating and effectively interact with the central energy system (CES).
The ETS heater was set to charge the thermal energy at nighttime. Even the electricity tariff from 21:00 PM to 06:00 AM is exempted, in accordance with the energy regulations set by the government; as 0 ₮ for the period of heating, there is a lack of implementation of the three tariff; people still prefer cheap coal with its low operational costs vs. the initial cost of the ETS heater and electricity meter. Therefore, there are economic challenges.
Ger 1 uses 3880 kg / yr of lignite-coal and 490 kg / yr of wood for space heating and cooking [20]. Meanwhile, the electric appliances and ETS heater of Ger 2 used 3169 kWh (electric appliances) and 5989 kWh (ETS heater) of electricity for the period of experimentation. The changing of a heating system from a coal-burning stove to an ETS heater that is supplied from a thermal power plant (TPP) reduces the amount of pollutant emission. Direct combustion in coal stoves emits approximately 787.56 kg/yr of pollutant emissions including total suspended particles (TSP), SOx, CO, and particulate matter (PM) 2.5, while the emission of Ger 2 for the period of experimentation was 40.84 kg. The annual amount of Ger 1’s emission and emission amount per kWh of the TPP were obtained from [20].

3.2. Simulation Results

Figure 6 shows a daily operational profile of the ger with the ETS heater and solar PV for one week, which is 5th of February to 12th of February, as a simulation result. The validation results for the estimated PV output and heating demand are presented in Table A3 of Appendix C. The numerical values indicate the monthly average of the mean average percentage error (MAPE), mean absolute error (MAE), and root mean square error (RMSE).
The amount of electricity from the PV system used in the ger is sufficiently high in the first three days because of the availability of solar irradiance, while on the 8th and 9th of February, PV self-consumption represents a small fraction.
Figure 7 shows the profile of the energy performance of the Ger with the ETS heater and solar PV for the heating season. The energy performance is represented by monthly average daily energy consumption. For the period of the heating season, the fraction of electricity consumed in the ger from the solar PV is 31% of the total energy consumption. The remaining 69% is the amount of electricity imported from the main grid. The ger used 76% of the output of the PV system, while the PV system exported 24% of the total output of the PV to the main grid. The amount of solar PV exported to the main grid was a small fraction when the highest amount of heating energy was demanded in November, December, January, and February, and the self-consumption of PV increases because of the daytime charging of the ETS heater.
Furthermore, the potential for satisfying the demand for hot water through the surplus power of solar PV has been prospected when there is no heating demand in summer. Therefore, various types of thermal storage materials, for instance, water, ceramic, and phase-change material (PCM), need to be considered in the system configuration of this study. The optimal operation of the ETS heater powered by the solar PV and the main grid has the potential to reduce electricity costs for customers and increase renewable energy installation in the main grid.

4. Conclusions

This study experimentally investigated the potential of a ger with an ETS heater and added insulation material in the cold climate of Ulaanbaatar city by comparison with a reference ger from the viewpoint of energy consumption. In addition to this, the technical feasibility of a ger with an ETS heater scheduled to charge during the daytime and solar PV was evaluated by using a simulation based on in-house software developed in MATLAB.
The indoor comfort level and energy efficiency of Ger 2 were enhanced compared with those of Ger 1. In Ger 2, the electric appliances consumed 3169 kWh of electricity, while 5989 kWh was used for the space heating. For Ger 1, lignite coal and wood were used for space heating, and 1046 kWh of electricity was used. From the viewpoint of economy, it is still challenging. The reduction of pollutant emissions is feasible when using an ETS heater instead of a coal stove. Moreover, the ETS heater combined with solar PV is very effective for reducing pollutant emissions.
The ETS heater installed in Ger 2 increased the PV self-consumption rate by 76% because of the daytime charging schedule of the ETS heater. The PV system supplied 31% of the total energy consumed, with the remaining 69% from the main grid.

Author Contributions

Conceptualization, B.-E.B., Y.U. and A.A.; methodology, B.-E.B.; software, B.-E.B.; validation, B.-E.B.; formal analysis, B.-E.B.; investigation, B.-E.B.; resources, A.A., Y.U.; data curation, B.-E.B.; writing—original draft preparation, B.-E.B.; writing—review and editing, Y.U., A.A.; visualization, B.-E.B.; supervision, U.Y.; project administration, A.A.; funding acquisition, B.-E.B., A.A. All authors have read and agreed to the published version of the manuscript.

Funding

This research was funded by the Mongolia-Japan Engineering Education Development (MJEED) program” and “The APC was funded by B. Bat-Erdene, National University of Mongolia, and Institute of Railway”.

Acknowledgments

The authors would like to acknowledge the Mongolian-Japan Engineering Education Development (MJEED) program.

Conflicts of Interest

The authors declare no conflict of interest.

Appendix A. Envelope Elements of Mongolian Ger

Table A1. The thermal and technical descriptions of envelope materials used in Gers 1 and 2.
Description of Ger 1′s Envelope ElementsDescription of Ger 2′s Envelope Elements
1Crown wheel Layer 1: 150 mm wooden frame with 0.17 W / k · m ther. cond.
Layer 2: 50 mm felt with 0.04 W / k · m thermal conductivity
Layer 3: 3 mm glass with 0.8 W / k · m thermal conductivity
Layer 1: 150 mm wooden frame with 0.17 W / k · m thermal cond.
Layer 2: 50 mm felt with 0.04 W / k · m thermal conductivity
Layer 3: 3 mm glass with 0.8 W / k · m thermal conductivity
Layer 4: 4 mm polycarbonate sheet
2Roof Layer 1: Φ30 mm wooden pole with 0.17 W / k · m ther. cond.
Layer 2: 2 mm linen with 0.04 W / k · m thermal conductivity
Layer 3: 50 mm felt with 0.04 W / k · m thermal conductivity
Layer 4: 2 mm linen with 0.04 W / k · m thermal conductivity
Layer 1: Φ30 mm wooden pole with 0.17 W / k · m thermal cond.
Layer 2: 2 mm linen with 0.04 W / k · m thermal conductivity
Layer 3: 50 mm felt with 0.04 W / k · m thermal conductivity
Layer 4: 2 mm linen with 0.04 W / k · m thermal conductivity
Layer 5: 3 mm alum. foil with 0.04 W / k · m thermal cond.
3WallLayer 1: 2 mm linen with 0.04 W / k · m thermal conductivity
Layer 2: 14 mm wooden lattice with 0.17 W / k · m therm. cond.
Layer 3: 2 mm linen with 0.04 W / k · m thermal conductivity
Layer 4: 50 mm felt with 0.04 W / k · m thermal conductivity
Layer 5: 2 mm linen with 0.04 W / k · m thermal conductivity
Layer 1: 2 mm linen with 0.04 W / k · m thermal conductivity
Layer 2: 14 mm wooden lattice with 0.17 W / k · m thermal cond.
Layer 3: 2 mm linen with 0.04 W / k · m thermal conductivity
Layer 4: 80 mm felt with 0.04 W / k · m thermal conductivity
Layer 5: 2 mm linen with 0.04 W / k · m thermal conductivity
Layer 6: 3 mm alum. foil with 0.04 W / k · m thermal cond.
4DoorLayer 1: 20 mm wood with 0.17 W / k · m thermal cond.
Layer 2: 20 mm felt with 0.04 W / k · m thermal conductivity
Layer 1: 20 mm wood with 0.17 W / k · m thermal cond.
Layer 2: 20 mm felt with 0.04 W / k · m thermal conductivity
Layer 3: 3 mm alum. foil with 0.04 W / k · m thermal cond.
5Door frameLayer 1: 30 mm wood with 0.17 W / k · m thermal cond.
Layer 2: 40 mm felt with 0.04 W / k · m thermal conductivity
Layer 1: 30 mm wood with 0.17 W / k · m thermal cond.
Layer 2: 40 mm felt with 0.04 W / k · m thermal conductivity
Layer 3: 3 mm alum. foil with 0.04 W / k · m thermal cond.
6FloorLayer 1: 20 mm wood with 0.17 W / k · m thermal cond.
Layer 2: 50 mm Styrofoam with 0.03 W / k · m thermal cond.
Layer 1: 20 mm wood with 0.17 W / k · m thermal cond.
Layer 2: 150 mm Styrofoam with 0.03 W / k · m thermal cond.
Layer 3: 3 mm alum. foil with 0.04 W / k · m thermal cond.

Appendix B. Data Description

Table A2. The description of the data.
ParametersPeriodResolutionApplication of Data
Experimental InvestigationEstimation of Heating DemandEstimation of Solar PV OutputSimulation of Proposed System
1. Wireless communication base modular logger
1.1Indoor air temperature of Ger 1 ( ° C ) 28/Oct/17–08/Jun/182 min+
1.2Indoor air humidity of Ger 1 ( % )28/Oct/17–08/Jun/182 min+
1.3Consumption of major elec. app. of Ger 1 ( kW )28/Oct/17–08/Jun/182 min+
1.4Coal weight ( kg )01/Jan/18–20/Jan/183 h+
1.5Indoor air temperature of Ger 2 ( ° C ) 28/Oct/17–08/Jun/182 min+
1.6Indoor air humidity of Ger 2 ( % )28/Oct/17–08/Jun/182 min+
1.7Consumption of major elec. app. of Ger 2 ( kW )28/Oct/17–08/Jun/182 min+ +
1.8Consumption of ETS heater ( kW )28/Oct/17–08/Jun/182 min+
2. Meteorological weather station data
2.1Outdoor air temperature ( ° C ) 28/Oct/17–08/Jun/182 min+++
2.2Outdoor air humidity ( % )28/Oct/17–08/Jun/182 min
2.3Global horizontal irradiance ( kW / m 2 )28/Oct/17–08/Jun/182 min +
2.445o plane of array irradiance ( kW / m 2 )28/Oct/17–08/Jun/182 min +
2.5Wind speed (m/s)28/Oct/17–08/Jun/182 min +
3. Other data
3.1Typical Meteorological Year (TMY) data +
3.2Physical characteristic data for ger +
3.3Thermal and technical data of ger’s envelope materials++
4. Composed and estimated data
4.1Estimated earth temperature, T e 28/Oct/17–08/Jun/182 min +
4.2Binary number of adult occupants28/Oct/17–08/Jun/182 min + +
4.2Binary number of child occupants28/Oct/17–08/Jun/182 min +
4.3Binary number of elec. application operation28/Oct/17–08/Jun/182 min +
4.4Estimated heating demand 28/Oct/17–08/Jun/182 min +
Binary numbers of the ETS heater operation28/Oct/17–08/Jun/182 min +
4.5Generated load profile of daily heating demand28/Oct/17–08/Jun/182 min +
4.6Estimated output power of solar PV28/Oct/17–08/Jun/182 min +

Appendix C. The Validation of the Estimated Heating Demand and Solar PV Output

Table A3. The MAPE, MAE, and RMSE of estimated heating demand and PV output.
YearEstimated Heating DemandEstimated PV Output
MAPE, %MBE, kWhRMSE, kWhMAPE, %MBE, kWhRMSE, kWh
2017/1017.963.581.525.381.000.985
2017/1113.314.172.2316.132.151.26
2017/1211.983.992.3323.941.840.51
2018/015.542.020.369.780.800.54
2018/023.831.260.916.261.060.42
2018/03245.213.473.400.510.51
2018/04 23.403.583.45
2018/05 2.60.560.57
2018/06

References

  1. Conti, J.; Holtberg, P.; Diefenderfer, J.; LaRose, A.; Turnure, J.T.; Westfall, L. International Energy Outlook 2016 with Projections to 2040; USDOE Energy Information Administration (EIA): Washington, DC, USA, 2016.
  2. Mongolian Statistical Information Service. National Statistics Office. Available online: www.1212.mn (accessed on 10 November 2019).
  3. Edwards, R. Irvine Understanding and Addressing the Impact of air Pollution on Children’s Health in Mongolia; University of California, UNICEF Mongolia, and Mongolia’s Public Health Institute: Ulaanbaatar, Mongolia, 2016. [Google Scholar]
  4. Davy, P.K.; Gerelmaa, G.; Andreas, M.; Trompetter, W.J.; Barry, B.J.; Shagjjambe, D.; Sereeter, L. Air particulate matter pollution in Ulaanbaatar, Mongolia: Determination of composition, source contributions and source locations. Atmos. Pollut. Res. 2011, 2, 126–137. [Google Scholar] [CrossRef] [Green Version]
  5. Guttikunda, S.K.; Lodoysamba, S.; Bulgansaikhan, B.; Dashdondog, B. Particulate pollution in Ulaanbaatar, Mongolia. Air Qual. Atmos. Health 2013, 6, 589–601. [Google Scholar] [CrossRef]
  6. Gantumur, T.; Lim, S.R.R.; Ganjali, M.R.; Kistelegdi, I. A review and systemization of the traditional Mongolian yurt (GER). Pollack Period. 2018, 13, 19–30. [Google Scholar]
  7. Mauvieux, B.; Alain, R.; Yvan, T. The yurt: A mobile home of nomadic populations dwelling in the Mongolian steppe is still used both as a sun clock and a calendar. Chronobiol. Int. 2014, 31, 151–156. [Google Scholar] [CrossRef] [PubMed]
  8. Gantumur, T.; Kistelegdi, I. Comparative analysis for traditional yurts using thermal dynamic simulations in Mongolian climate. Pollack Period. 2019, 14, 97–108. [Google Scholar]
  9. Cooke, W.B.H.; Stephen, H.R.; Sulatisky, M.T. Thermal energy storage in forced-air electric furnaces. IEEE Trans. Ind. Appl. 1980, IA-16, 127–133. [Google Scholar] [CrossRef]
  10. Miriam, V.G. Electric thermal-storage heaters. Electron. Power 1964, 10, 68–71. [Google Scholar]
  11. Coleman, W.R.; Grastataro, C.M. American electric power system electric thermal storage program: An evaluation of performance within the home. IEEE Trans. Power Appar. Syst. 1981, 12, 4741–4749. [Google Scholar] [CrossRef]
  12. Bedouani, B.Y.; Moreau, A.; Parent, M.; Blaise, L. Central electric thermal storage (ETS) feasibility for residential applications: Part 1. Numerical and experimental study. Int. J. Energy Res. 2001, 25, 53–72. [Google Scholar] [CrossRef]
  13. Bedouani, B.Y.; Labreque, B.; Parent, M.; Legault, A. Central electric thermal storage (ETS) feasibility for residential applications: Part 2. Techno-economic study. Int. J. Energy Res. 2001, 25, 73–83. [Google Scholar] [CrossRef]
  14. Steven, W.; Pinard, J.-P. Opportunities for smart electric thermal storage on electric grids with renewable energy. IEEE Trans. Smart Grid 2016, 8, 1014–1022. [Google Scholar]
  15. Patrick, S.S.; Bharatkumar, V.S.; Claudio, A.C.; Soren, K.H. Electric thermal storage system impact on northern communities’ microgrids. IEEE Trans. Smart Grid 2017, 10, 852–863. [Google Scholar]
  16. Kylesconverter. Available online: http://www.kylesconverter.com/ (accessed on 10 November 2019).
  17. Kavgic, M.; Mavrogianni, A.; Mumovic, D.; Summerfield, A.; Stevanovic, Z.; Djurovic-Petrovic, M. A review of bottom-up building stock models for energy consumption in the residential sector. Build. Environ. 2010, 45, 1683–1697. [Google Scholar] [CrossRef]
  18. Tamami, K.; Paul, R.A. Earth Temperature and Thermal Diffusivity at Selected Stations in the United States; National Bureau of Standards: Gaithersburg, MD, USA, 1965.
  19. Luketa-Hanlin, A.; Stein, J. Improvement and validation of a transient model to predict photovoltaic module temperature. In World Renewable Energy Forum; Denver, CO, USA, 2012. Available online: https://energy.sandia.gov (accessed on 10 November 2019).
  20. SUURI-KEIKAKU Co., Ltd.; Japan International Cooperation Agency (JICA). Capacity Development Project for Air Pollution Control in Ulaanbaatar City-Phase 1, 2, Mongolia. June 2017. Available online: https://openjicareport.jica.go.jp/pdf/12289195.pdf (accessed on 10 August 2020).
Figure 1. Two Mongolian gers installed for the experimentation: (a) The view of Ger 1; (b) Ger 2.
Energies 13 05840 g001
Figure 2. Diagram of the experimental setup and electrical wiring of (a) Ger 1 and (b) Ger 2. Grey color presents Ger 1. Its electric appliances were supplied from the main grid, and its measurements are shown, while the light blue color indicates Ger 2.
Energies 13 05840 g002
Figure 3. The flow chart of the energy performance simulation.
Energies 13 05840 g003
Figure 4. The indoor heat indices of the two experimental gers. The black triangular mark indicates the heat index of Ger 1, and the heat index of Ger 2 is presented by the green triangular mark.
Energies 13 05840 g004
Figure 5. Daily energy performance of Ger 1 and 2 on the annually coldest day of the year. The grey- and blue-colored bars indicate the daily heating consumption and electricity consumption of the electric appliances of Ger 1, and the daily energy consumption of Ger 2 is presented by green- and aqua-colored bars for the ETS heater and electric appliances.
Energies 13 05840 g005
Figure 6. The daily operational profile of the ger with the ETS heater and solar PV for one week. The yellow color indicates the amount of electricity consumed in the ger from the PV system. The blue color indicates the amount of electricity consumed in the ger from the main grid. The orange color is the electricity flow from the PV system to the main grid.
Energies 13 05840 g006
Figure 7. Profile of the energy performance of the ger with the ETS heater and solar PV for the heating season. The energy performance is represented by the monthly average daily energy consumption. The orange color is the amount of electricity consumed in the ger from main grid. The blue color is the amount of electricity consumed in the ger from the PV system. The yellow color is the electricity flow from the PV system to the main grid.
Energies 13 05840 g007
Table 1. Electrical and technical detail of the Electric Thermal Storage (ETS) heater.
DetailsValue
Nominal rating, kW5
Thermal capacity, kWh3
Voltage, V3/N/PE~400
Dimension, mm850 × 450 × 600
Weight, kg184
Table 2. Detailed information of the additional heating sources.
DetailsQuantity, pcsRate Power, W Weekday ScheduleWeekend Schedule
Occupants2 adults and
2 children
93
69
00:00–09:00
18:00–24:00
00:00–24:00
Major electric appliance1 elect. stove1500 07:30–07:50
18:30–18:50
09:30–09:50
13:30–13:50
19:30–19:50
Light1 halo. lamp5018:00–23:0018:00–23:00
Publisher’s Note: MDPI stays neutral with regard to jurisdictional claims in published maps and institutional affiliations.

