Article

Fluctuation Suppression of DC-Link Voltage Using Control of Converters Connected with DC Distributed Generation

Department of Electrical Engineering, Soongsil University, 369, Sangdo-ro, Dongjak-gu, Seoul 156-743, Korea
*
Author to whom correspondence should be addressed.
Energies 2020, 13(21), 5832; https://doi.org/10.3390/en13215832
Submission received: 3 October 2020 / Revised: 1 November 2020 / Accepted: 4 November 2020 / Published: 8 November 2020
(This article belongs to the Section A1: Smart Grids and Microgrids)

Abstract

:
Due to the increase in DC load and DC Power generation, the need for DC power system is emerging. Accordingly, FRT (fault ride through) and LVRT (low voltage ride through), which are related regulations for renewable energy sources, have been enacted, and operation algorithms of each converter are required for this. However, the operation of the converter according to LVRT regulations causes DC voltage fluctuations. In the current study, DC voltage fluctuation is suppressed through converter control of DC-linked battery. The controller was designed from the relational equation between DC voltage and instantaneous power of battery. The pattern of DC voltage fluctuations to the output of the PV (photovoltaic), which is a DC power generation source, was confirmed, and voltage fluctuation suppression was verified by applying the designed converter cooperation algorithm and controller.

1. Introduction

Around the world, population density around large cities has caused the power load density to continue to increase. The increase in load density has led to the demand for the expansion of new large-scale power plants, but the construction of large-scale power plants is in a state of being impossible due to the NIMBI (not in my back yard) phenomenon. Therefore, distributed power sources such as PV (photovoltaic) were distributed around the metropolitan area. In addition, the need for DC microgrid has emerged as the DC load increases.
Since PV has a characteristic that the amount of power generation varies greatly depending on the time or weather, it causes a large power change in the DC link, and the change in power causes the voltage fluctuation in the DC link. In general, a DC link capacitor used for ripple suppression may increase or decrease the current flowing through the capacitor when a power imbalance occurs. Since the voltage of the DC link capacitor is proportional to the amount of electric charge charged at both electrodes of the capacitor, an overvoltage occurs when a large current flows, whereas an undervoltage can occur when a small current flows. The change in DC link power depends on the PV dependence of the main system. The greater the PV capacity compared to the power system’s load consumption, the greater the fluctuation in the DC link voltage will be caused.
On the other hand, when the distributed power generation is connected to the AC power system, the FRT (fault ride through) and LVRT (low voltage ride through) regulations must be satisfied. However, as the LVRT regulation is satisfied, the active power of VSC (voltage sourced-converter) decreases, which causes DC voltage fluctuations. This is a little different from the principle that power imbalance occurs due to PV fluctuations. The PV output can operate as long as the voltage of the DC link does not exceed the appropriate voltage. Therefore, even if AC fault occurs, the output of PV is constant. However, as mentioned earlier, VSC had to reduce the active power to meet the LVRT regulations. Therefore, the overall input of the DC link is constant, but the output decreases, so the DC link voltage increases. DC voltage fluctuations cause malfunction of protection equipment such as DC circuit breaker and SA (surge arrestor), and may affect the control stability of the converter. In order to reduce such secondary damage, countermeasures to suppress DC voltage fluctuations have been proposed [1,2,3,4].
The chopper resistor is forced to resolve the power imbalance by installing a resistor with a power semiconductor in parallel to the DC link. In this case, cost is incurred due to equipment of power semiconductors and resistors, and a site is required accordingly. Second, the de-loading technique aims to resolve the power imbalance through torque control of the wind turbine. This technique has a long transient response time of DC link voltage control. Therefore, there is a problem in suppressing the rapidly changing voltage [5,6,7,8,9,10,11]. The technique proposed in this paper aims to resolve the power imbalance and suppress the DC voltage through input/output power control of the battery installed in the DC link. In general, batteries are essentially used when distributed power sources such as PV are connected, so unlike chopper resistors, no additional site or cost is required. Furthermore, when battery control is used, the power dissipated due to the use of chopper resistor or de-loading technique can be used later by charging. Therefore, it is advantageous in terms of energy saving and cost.
In this paper, the DC power system (DC link) is connected to the power distribution system by using the simulation tool PSCAD/EMTDC (power system computer aided design/electro-magnetic transient including direct current), and a simulation system is constructed in which PV, DC load, and BESS (battery energy storage system) are connected to the DC power system. In order to cause the DC link voltage fluctuation, it is assumed that a fault occurs on the distributed power generation side, and through this, the DC link voltage will rise rapidly. The battery control technique was proposed by conceiving that the DC link voltage can be controlled according to the input/output active power to the DC power system.

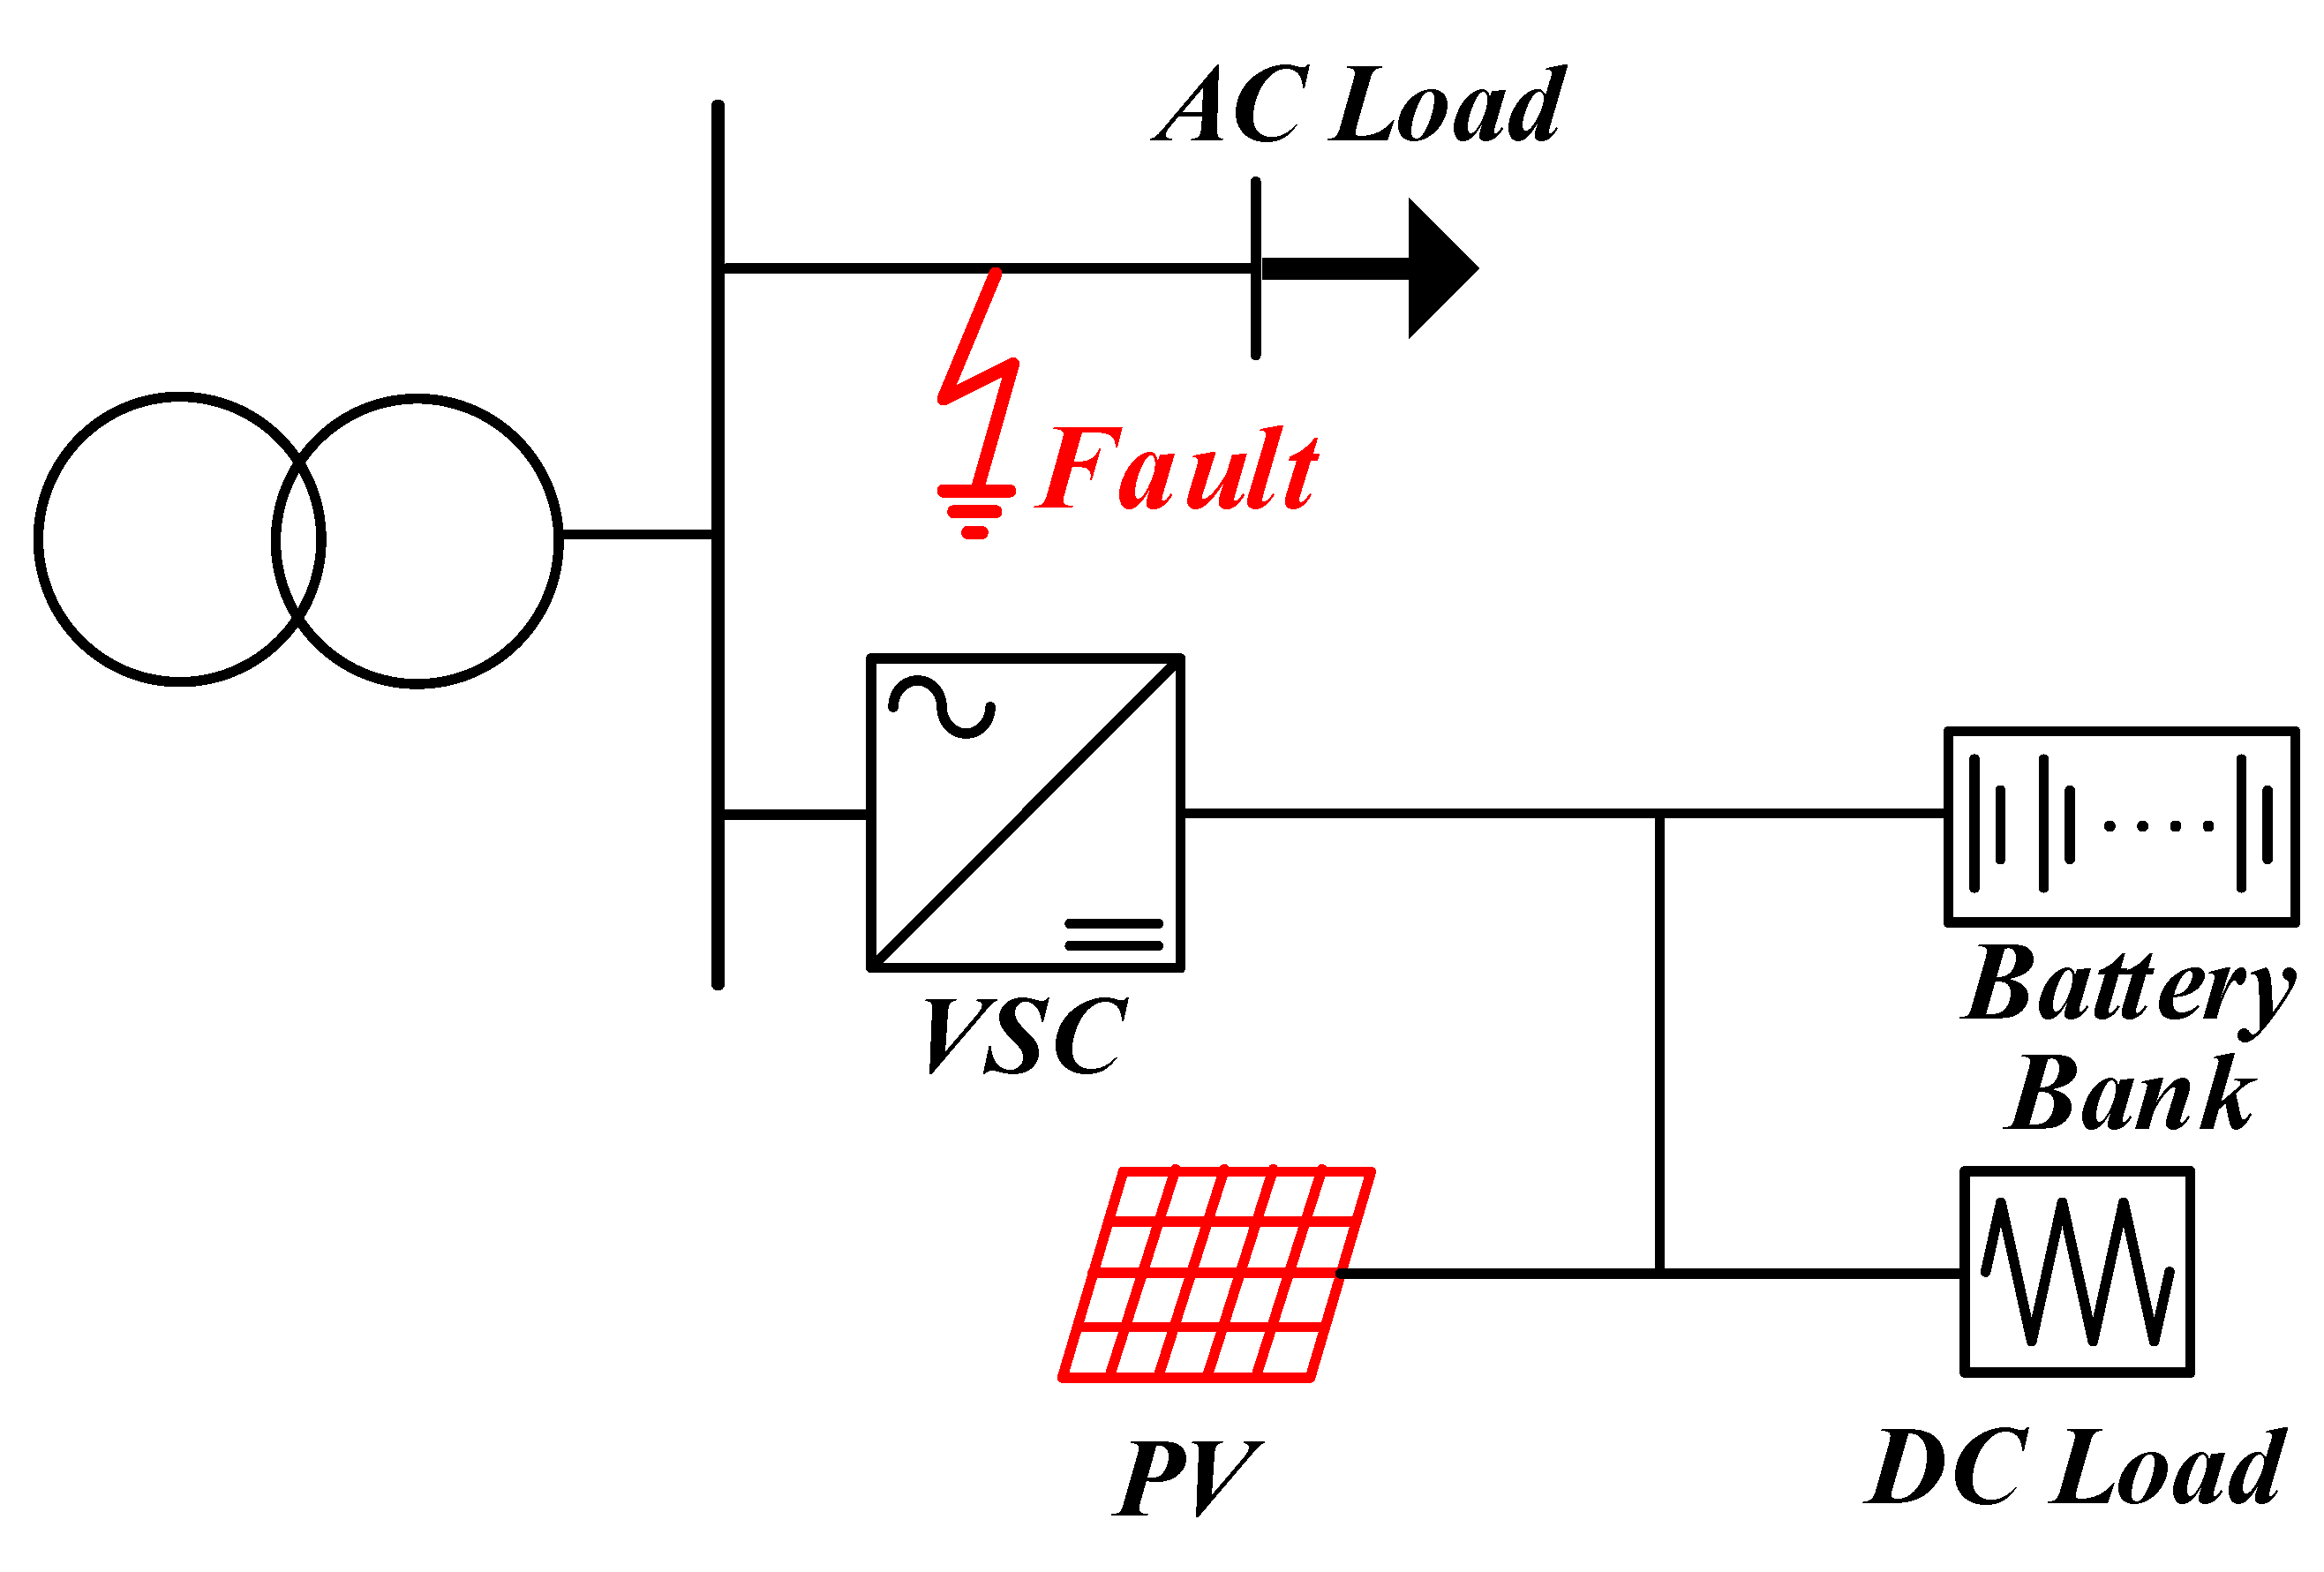
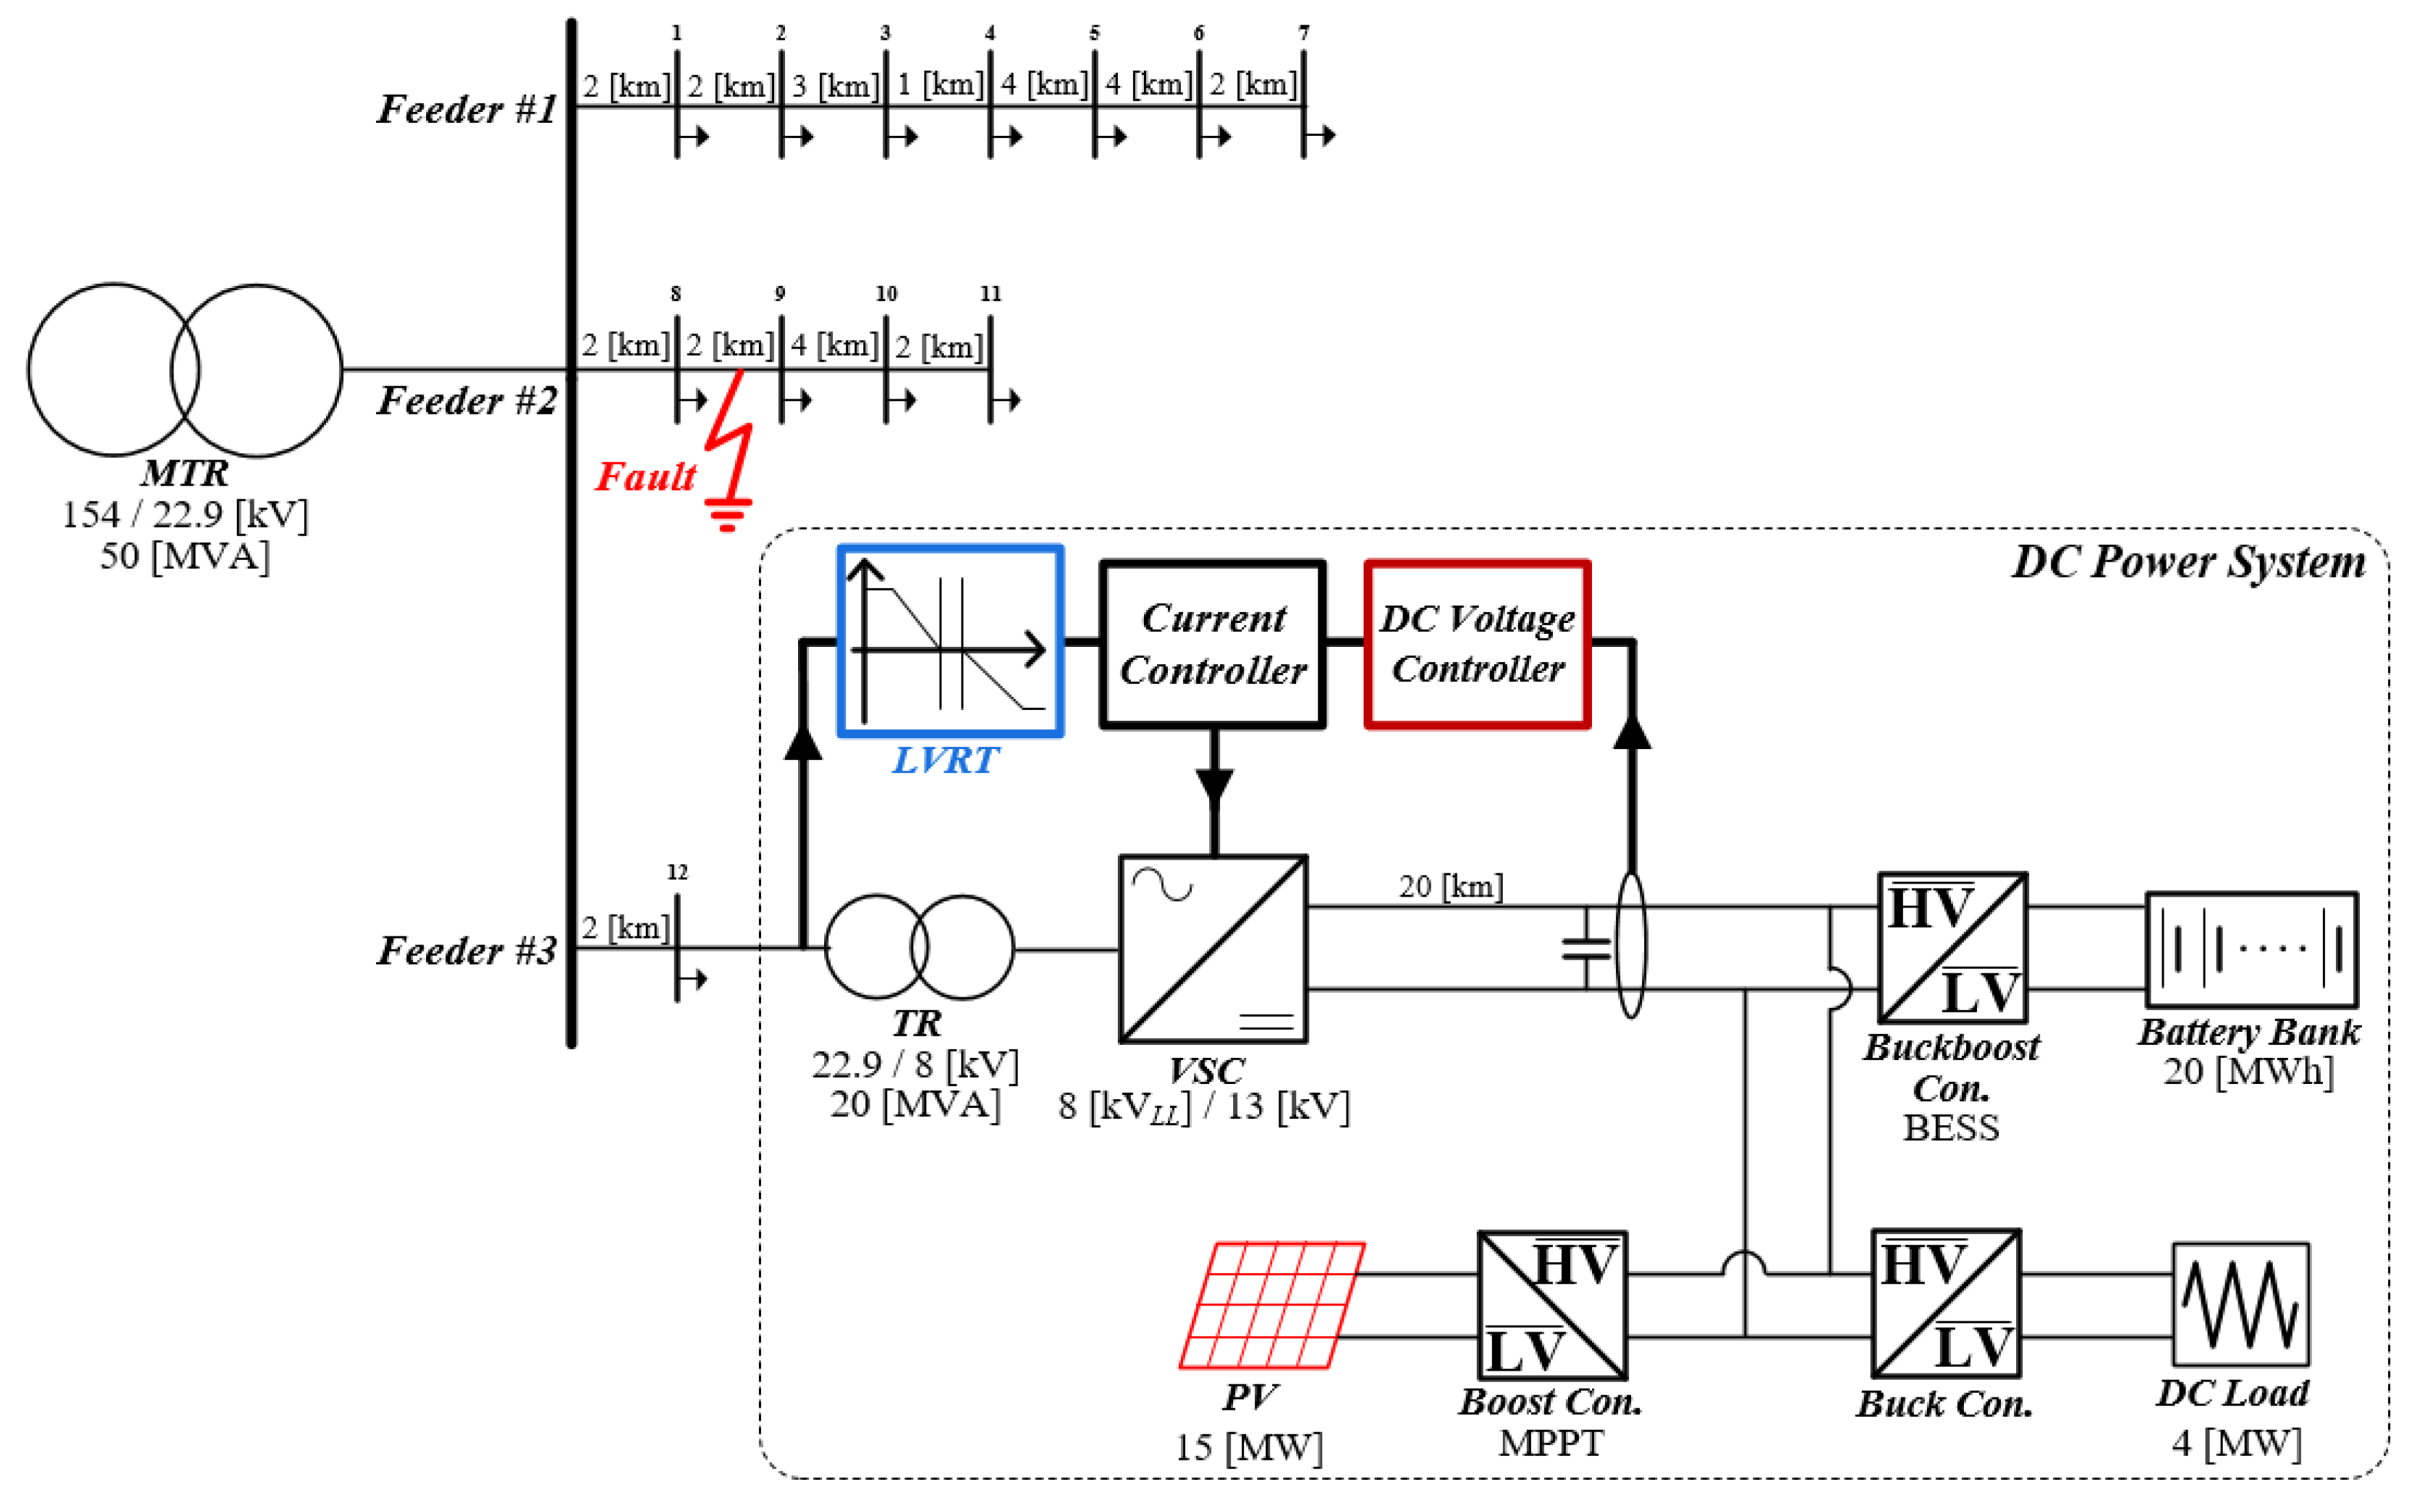
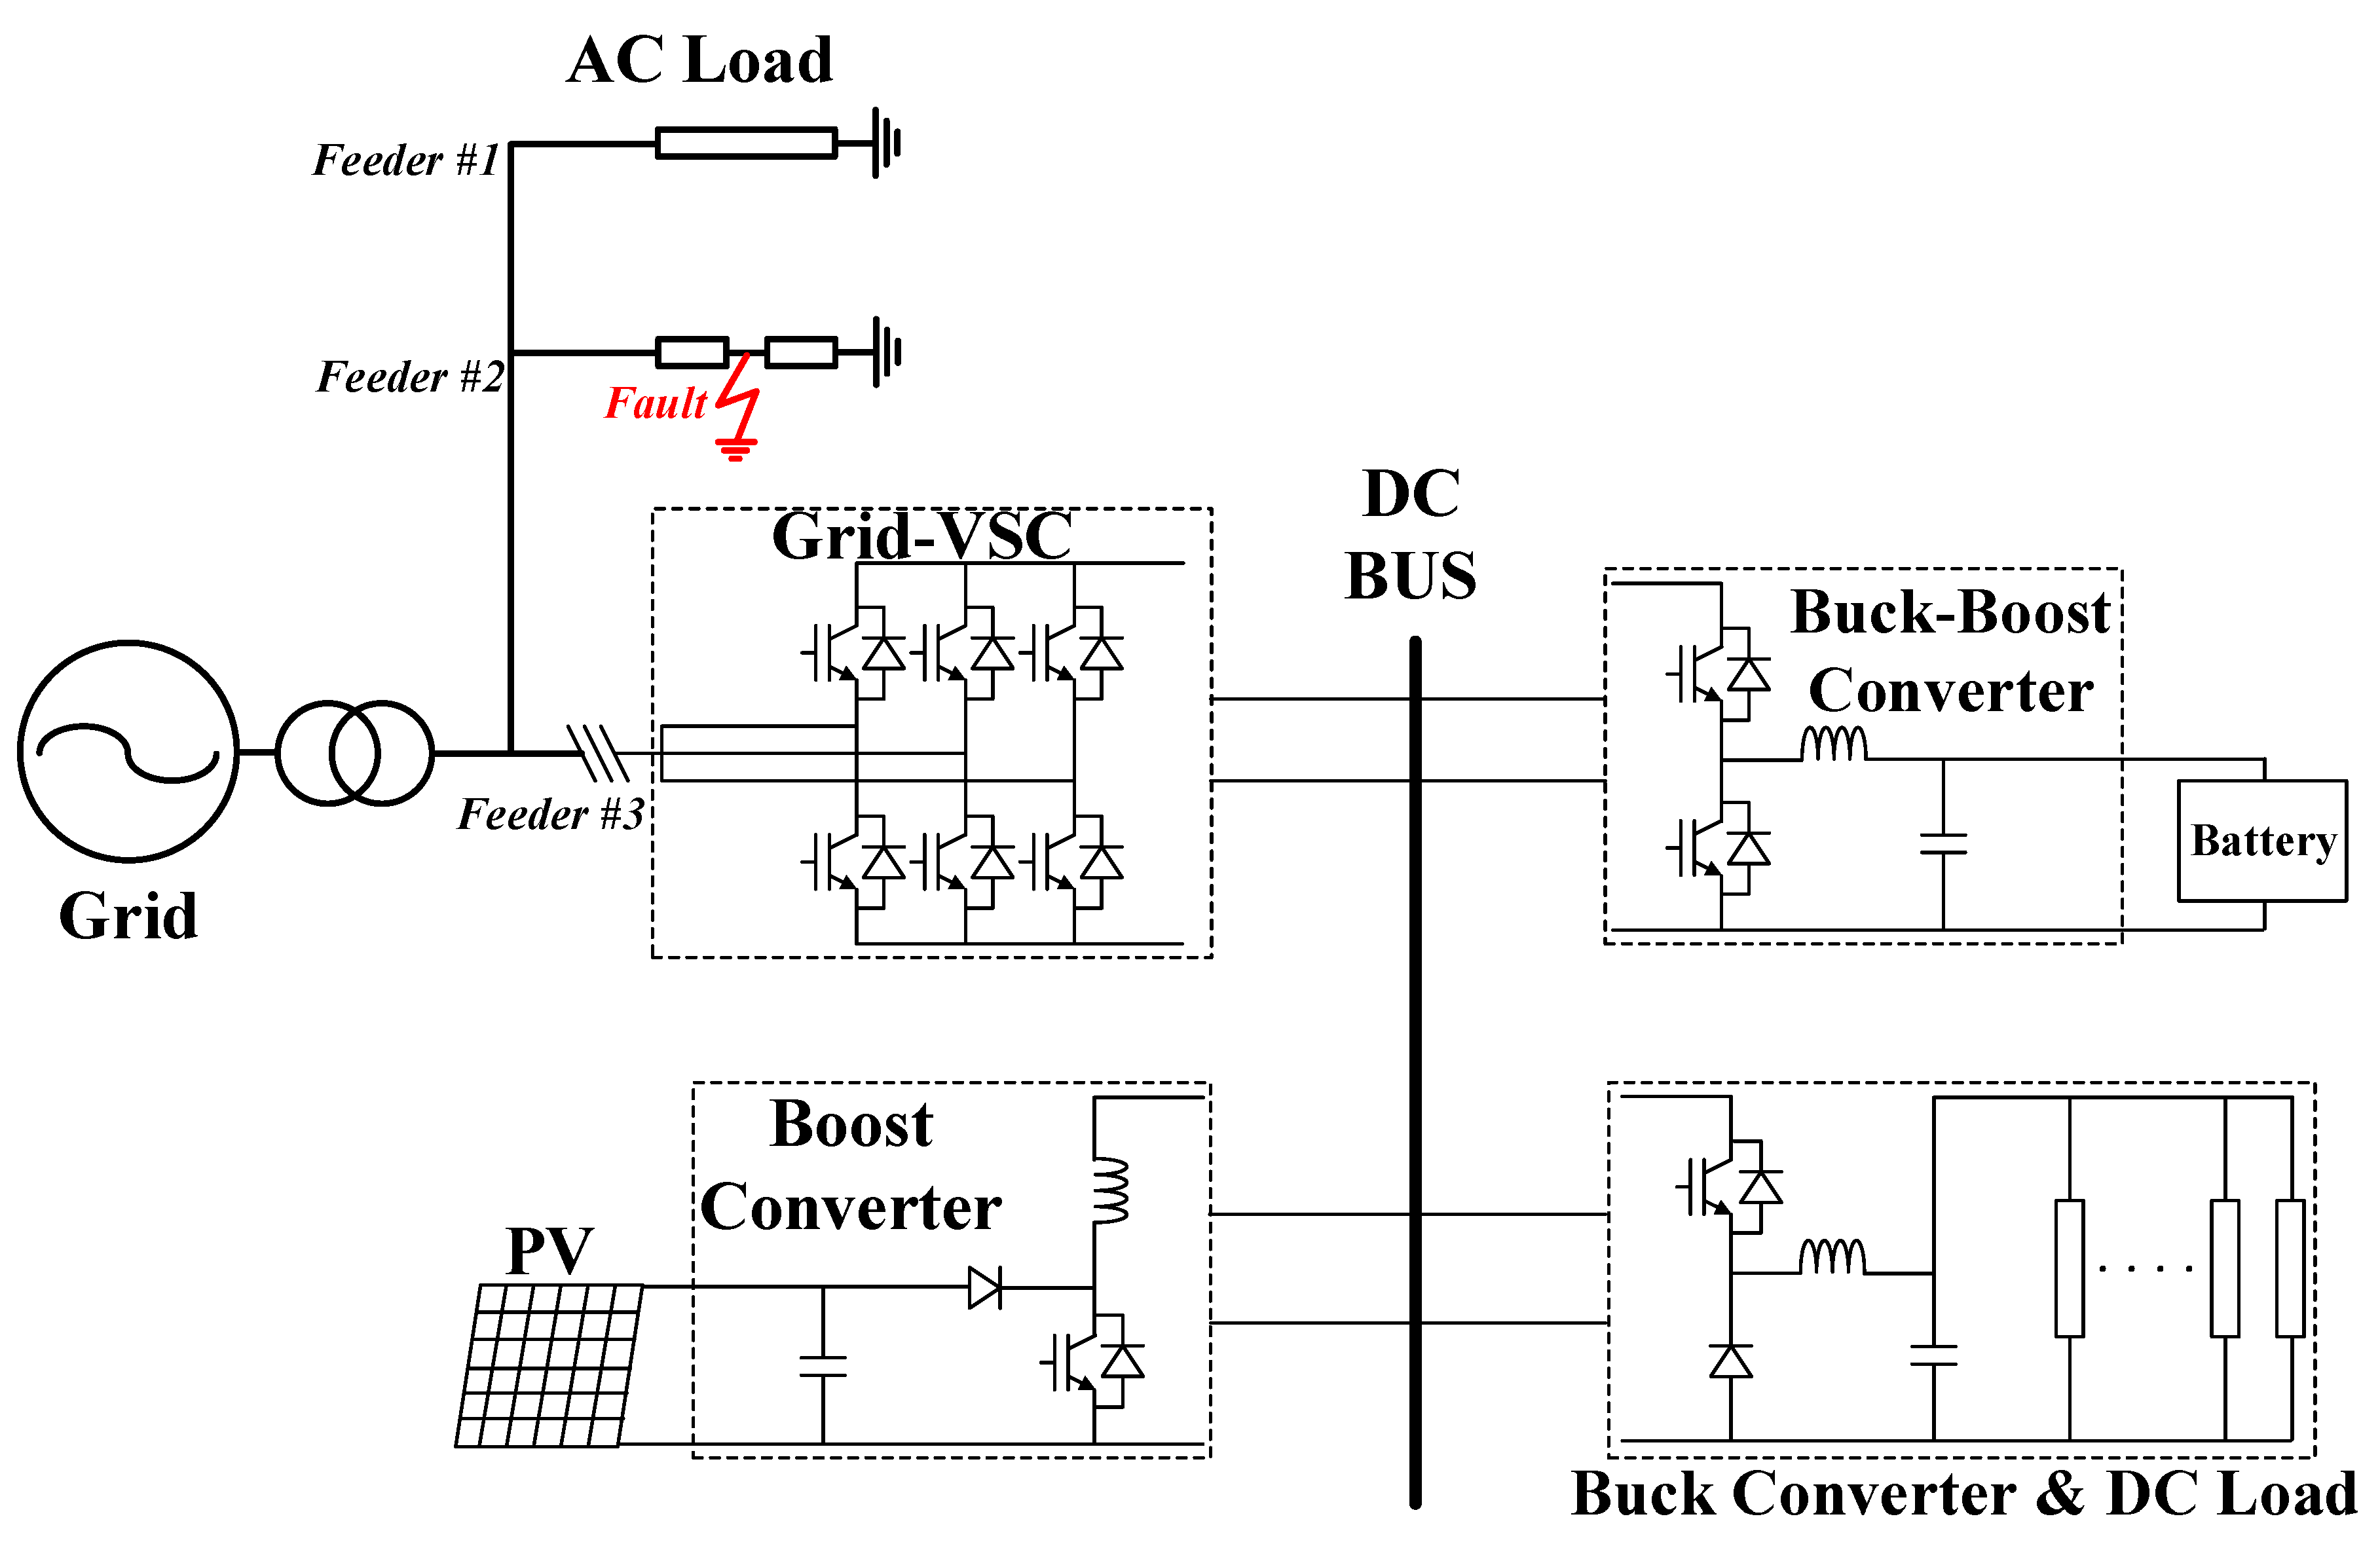
2. Power System Configuration

In the current study, the fluctuations in which the DC link voltage increases or decreases are simulated. When a fault occurs in the AC system connected to the DC power system, reactive power is supplied by the LVRT operation. At this time, since the AC/DC VSC (voltage-sourced converter) has an acceptable output capacity, reactive power is supplied and the active power decreases. Therefore, in the DC power system, VSC output cannot be adjusted according to PV output, and power imbalance occurs. This causes the DC link voltage to fluctuate.
Since the output power of PV is affected by weather conditions, weather, and season, it is used with BESS. When the PV output is large, such as during the day, it charges power, and at night, the PV output is small, so it discharges. Therefore, in the entire system, the main transformer and distribution system were modeled for the AC system, and the AC/DC VSC, PV, DC Load (buck converter) and BESS (buck-boost converter and battery bank) were designed in the DC power system. Figure 1 below is a schematic of the entire system.

2.1. Power Distribution Sytem and OCR(Over-Current Relay) Modeling

In the power distribution system, there are transformers, distribution lines, loads and OCRs (over -current relays) that must be modeled. The loads’ location and line length are closely related with AC voltage fluctuation. Therefore, load capacity and feeder length considering voltage fluctuation are generally determined to be around 10 MW and 20 km per each feeder. Figure 2 below shows the location of the load and the length of the line. Also, the overall power system configuration to which the DC link is connected, such as MTR (main transformer) capacity and rated voltage, is specified in Figure 2 and Table 1.
In the distribution system, modeling of circuit breakers and overcurrent relays is essential in addition to the capacity and location of the line and load MTR. The OCR generates a trip signal to cause the circuit breaker to open. OCRs are generally installed at the feeder inlet or at critical loads. This is to minimize the fault section and prevent unnecessary fault from spreading. Therefore, it is set so that faster interruption occurs where the fault current is large. The following (Equations (1) and (2)) show characteristic equations generally used in Korea when modeling a relay [12,13,14].
T t r i p = T D ( A M p 1 + B )  
M = I p o s i t i v e I p i c k u p  
Ttrip (trip time) refers to the time it takes for the relay to detect a fault and trip. The trip time is calculated by Equation (1), where TD, A, and B are the constants of the relay, and the M value is the value calculated by the current measured in the relay. M is calculated by Equation (2), where Ipositive is the 3-phase positive current, and Ipickup is the current magnitude at which the relay starts to trip. Each relay constant is specified in Table 2 below.

2.2. DC Power System Configuration

Currently, in Korea, the supply of PV continues to increase and the DC load is steadily increasing. Therefore, DC power system is indispensable in future systems. In this paper, PV as a power supply source, a boost converter that controls it, a battery bank that reduces PV output fluctuations, and a bidirectional buck-boost converter that controls input and output of the battery are modeled. In addition, an AC/DC VSC to connect the configured DC power system to the AC system is modeled. Figure 3 visually shows the connection of each power electronic device on the DC link.
Basically, VSC is a DC voltage source, as the name implies, and the voltage of the DC link is kept constant. Therefore, the direction of transmission power is the same as the direction of the current. In general, VSC uses IGBT (insulated gate bipolar transistor) or GTO (gate turn off) thyristor. The design of the input/output voltage can vary depending on the modulation method, and the square wave modulation method, SPWM (sinusoidal pulse width modulation), SVPWM (space-vector PWM), etc. are used. When the DC voltage is constant, the modulation method with the highest voltage on the AC side is the square wave modulation method, but the magnitude and harmonic control of the voltage is impossible. SPWM is generally used because its operating principle is intuitive and easy to control, and SVPWM is the most widely used technique in the motor control field because it has the least harmonics and can increase the AC side voltage the most after the square wave modulation method. In this paper, the SPWM method was used for ease of control.
The control target of VSC is the phase and magnitude of AC current, through which reactive power and active power can be adjusted. The reactive power is related to the AC side voltage, and the active power is related to the DC link voltage. Based on this relationship, the DC link voltage can be controlled, and in this paper, the DC link voltage and reactive power are controlled [15,16,17,18,19,20,21,22].
Figure 4 shows the control block diagram of VSC that connects AC system and DC system. Active and reactive power reference value (Ps_VSC_ref, Qs_VSC_ref) are entered as inputs. Each can be a constant or variable value, and the variable is mainly inputted by a value calculated from an external circuit when controlling DC voltage or AC voltage. As shown in the figure, when receiving input through DC link voltage controller, variable active power reference value is received. Finally, the three-phase modulating signal ma,b,c_VSC values are exported, and through this, SPWM is modulated and input as a gate signal of VSC.
Generally, for DC linked PV modeling, a PV panel, a boost converter, and an MPPT (maximum power point tracker) are essential. Below Figure 5 is commonly used for the equivalent model of PV panels [23,24,25].
Each index can be expressed by Equations (3)–(5) below.
I d = I o [ e x p ( V + I R s h n k T ) 1 ]
I s h = V + I R s R s h
I g = I s c R G G R [ 1 + α T ( T T R ) ]
From above equations, n is the diode ideal coefficient, k is the Boltzmann constant, T is the cell temperature, and G is the solar irradiation of the cell. q is the charge amount of electrons, and αT is the photocurrent temperature coefficient. One side, Io is called dark current (=saturation current) and means current flowing without irradiation of sunlight. Most of them occur due to ionization caused by radiation entering the panel and electron emission due to thermal vibration. It is usually predicted from 10−9 to 10−12 [A] and assumed to be 10−9 [A] in this paper.
According to the equivalent circuit, each current can be expressed as the total output current I, and the final formula is expressed as Equation (6).
I = I s c R G G R [ 1 + α T ( T T R ) ] I o [ e x p ( V + I R s h n k T ) 1 ] ( V + I R s R s h ) = f ( G ,   T ,   V )
As can be seen from Equation (6), the current I can be expressed as a function of the solar irradiation G, the cell temperature T, and the output voltage V. At this time, if current I is multiplied by voltage V, it can be expressed as a function of instantaneous power P, and P becomes a function of G, T and V. The maximum value of this function can be obtained by numerical analysis through the gradient descent method. If the PV output voltage V can be adjusted through a boost converter, it can be adjusted to the maximum power voltage found using the gradient descent method. The algorithm that adjusts the PV output voltage V to the maximum power voltage through the gradient descent method is called MPPT (maximum power point tracker), and there is a representative InCond (incremental conductance) method. The InCond method is basically a method of differentiating P by V, calculating the slope of the current P-V curve, predicting the present operating point through this, and adjusting the voltage command value of the boost converter [26,27].
If dP/dV is equal to 0, it is assumed that the present operating point has reached the maximum power operating point (MPOP). If dP/dV < 0, it is located on the left side of the MPOP, and if dP/dV > 0, the present operating point is located on the right side of the MPOP. For dP/dV, Equation (7) holds due to the characteristics of the differential operation, and the present operating point can be expressed as follows.
d P / d V = d ( i v ) / d v = i + v d i / d v
[ d i / d v = i v   a t   t h e   M P O P     d i / d v > i v   t o   t h e   l e f t   o f   t h e   M P O P   d i / d v < i v   to   t h e   l e f t   o f   t h e   M P O P  
Figure 6 shows the InCond method algorithm. Due to the characteristic of numerical analysis, it is impossible to calculate when dv/di is 0, so the case of dv = 0 is determined first. If dv = 0 and di = 0, even in this case, it is judged that the present operating point has reached MPOP, and the present voltage command value is maintained. Otherwise, the voltage is adjusted by the value of Δv. If the size of Δv is decreased, the tracking time is lengthened, and if the value of Δv is increased, vibration may occur at the convergence point. To prevent this problem, there is a method of determining the value of Δv through a Jacobian matrix [26,27].

2.3. DC Link Voltage Fluctuation

In this paper, the fluctuations in which the DC link voltage rises or falls are simulated. When a fault occurs in the AC system connected to the DC power system, reactive power is supplied by VSC for the LVRT operation. At this time, since the VSC has an acceptable output capacity, reactive power is supplied and the active power decreases. Therefore, in DC link, VSC output cannot be adjusted according to PV output, and power imbalance occurs. This causes the DC link voltage to fluctuate.
Figure 7 shows the principle of controlling the DC voltage when VSC is operating in inverter mode. If the loss of VSC is negligible, the output power Pt_VSC and the input power Pt_dc are the same. At this time, if Pt_VSC is adjusted according to the change of Pext, the amount of PC can be also adjusted. This is expressed mathematically as follows.
P C = d d t ( 1 2 C v d c 2 )
P e x t P l o s s d d t ( 1 2 C v d c 2 ) = P t _ d c
As mentioned above, the PC is affected by Pt_VSC and Pext. If the amount of Pt_VSC decreases due to LVRT operation, the PC and vdc increase. Conversely, if Pext fluctuates, PC may decrease or increase. If the PV panel output decreases due to a sudden cloudiness, Pext decreases. In this case, if the output of Pt_VSC is reduced together, the PC becomes going to remain constant and the vdc also remains constant, but if the amount of Pext decreases largely, the vdc may decrease.

3. BESS and Voltage Regulation Algorithm

BESS contributes to system stability by using the charging/discharging function of the battery or makes it possible to create greater economic benefits in the power market. BESS is largely used for four purposes [28]. Management system and installation advantages of BESS is listed in Table 3 below.
Each management system type is determined by who the user is, the ‘Load Leveling’ and ‘Ancillary Service’ are used by the system operator, while ‘Power Quality Compensation’ and ‘Renewable Energy Output Power Control’ are used by the power consumer. In this paper, ‘Renewable Energy Output Power Control’ is applied to the BESS used in the PV-connected system, or it operates to suppress the voltage drop in case of a system emergency.

3.1. BESS in DC Power System

BESS is usually applied to AC power systems, so bidirectional AC/DC converter modeling is required. However, if BESS is applied to a DC power system, a bidirectional buck-boost converter must be modeled. Figure 8 shows a typical bidirectional buck-boost converter that connects the battery and the DC power system. In this section, it is modeled the power control of the battery through a bidirectional buck-boost converter [29,30].
As can be seen in the Figure 8, two IGBTs are used, and an antiparallel diode is used for each IGBT. The upper IGBT is called a positive pole (=arm) IGBT, and the lower IGBT is called a negative arm IGBT. Generally, the voltage of the battery side is lower than voltage of the DC power system. Therefore, when the battery is charged, it must be operated as a buck converter, and when the battery is discharged, it must be operated as a boost converter. The positive pole IGBT is opened when used as a boost converter due to the characteristics of the bidirectional buck-boost converter circuit. Since the direction of current flows from the battery to the DC power system, the current will flow through the positive pole antiparallel diode and the negative pole IGBT acts as a chopper. Conversely, while the battery is charging, current will flow from the DC power system to the battery and the negative pole IGBT will open. Therefore, the current flows through the negative pole antiparallel diode and the positive pole IGBT becomes the chopper.
In both modes, the reference duty rate of each IGBT is determined as following equations.
B u c k   m o d e   :   D p _ r e f =   v L _ r e f v H  
B o o s t   m o d e   :   D n _ r e f = 1 v H v L _ r e f  
Dp_ref refers the reference duty ratio of the positive pole IGBT, and Dn_ref means the reference duty ratio of the negative pole IGBT. On the other hand, vL_ref denotes the voltage reference signal on the low voltage side, and this voltage signal determines the power [Watt] to be charged and discharged on the battery. The power [Watt] for charging and discharging of the battery is determined according to Equation (12).
P b a t t = ( v S o C v L _ r e f ) v L _ r e f R b a t t
vSoC means the SoC (state of charge) voltage of the battery. Equation (12) is a quadratic equation and has two solutions, which can be expressed as Equation (13).
v L _ r e f = a ± a 2 + 4 b 2  
( a = v S o C ,   b = P b a t t × R b a t t )
It is verified that Pbatt control is possible through the bidirectional buck-boost converter modeled above. In the next chapter, it will be described the technique of regulating the DC link voltage through this verification.

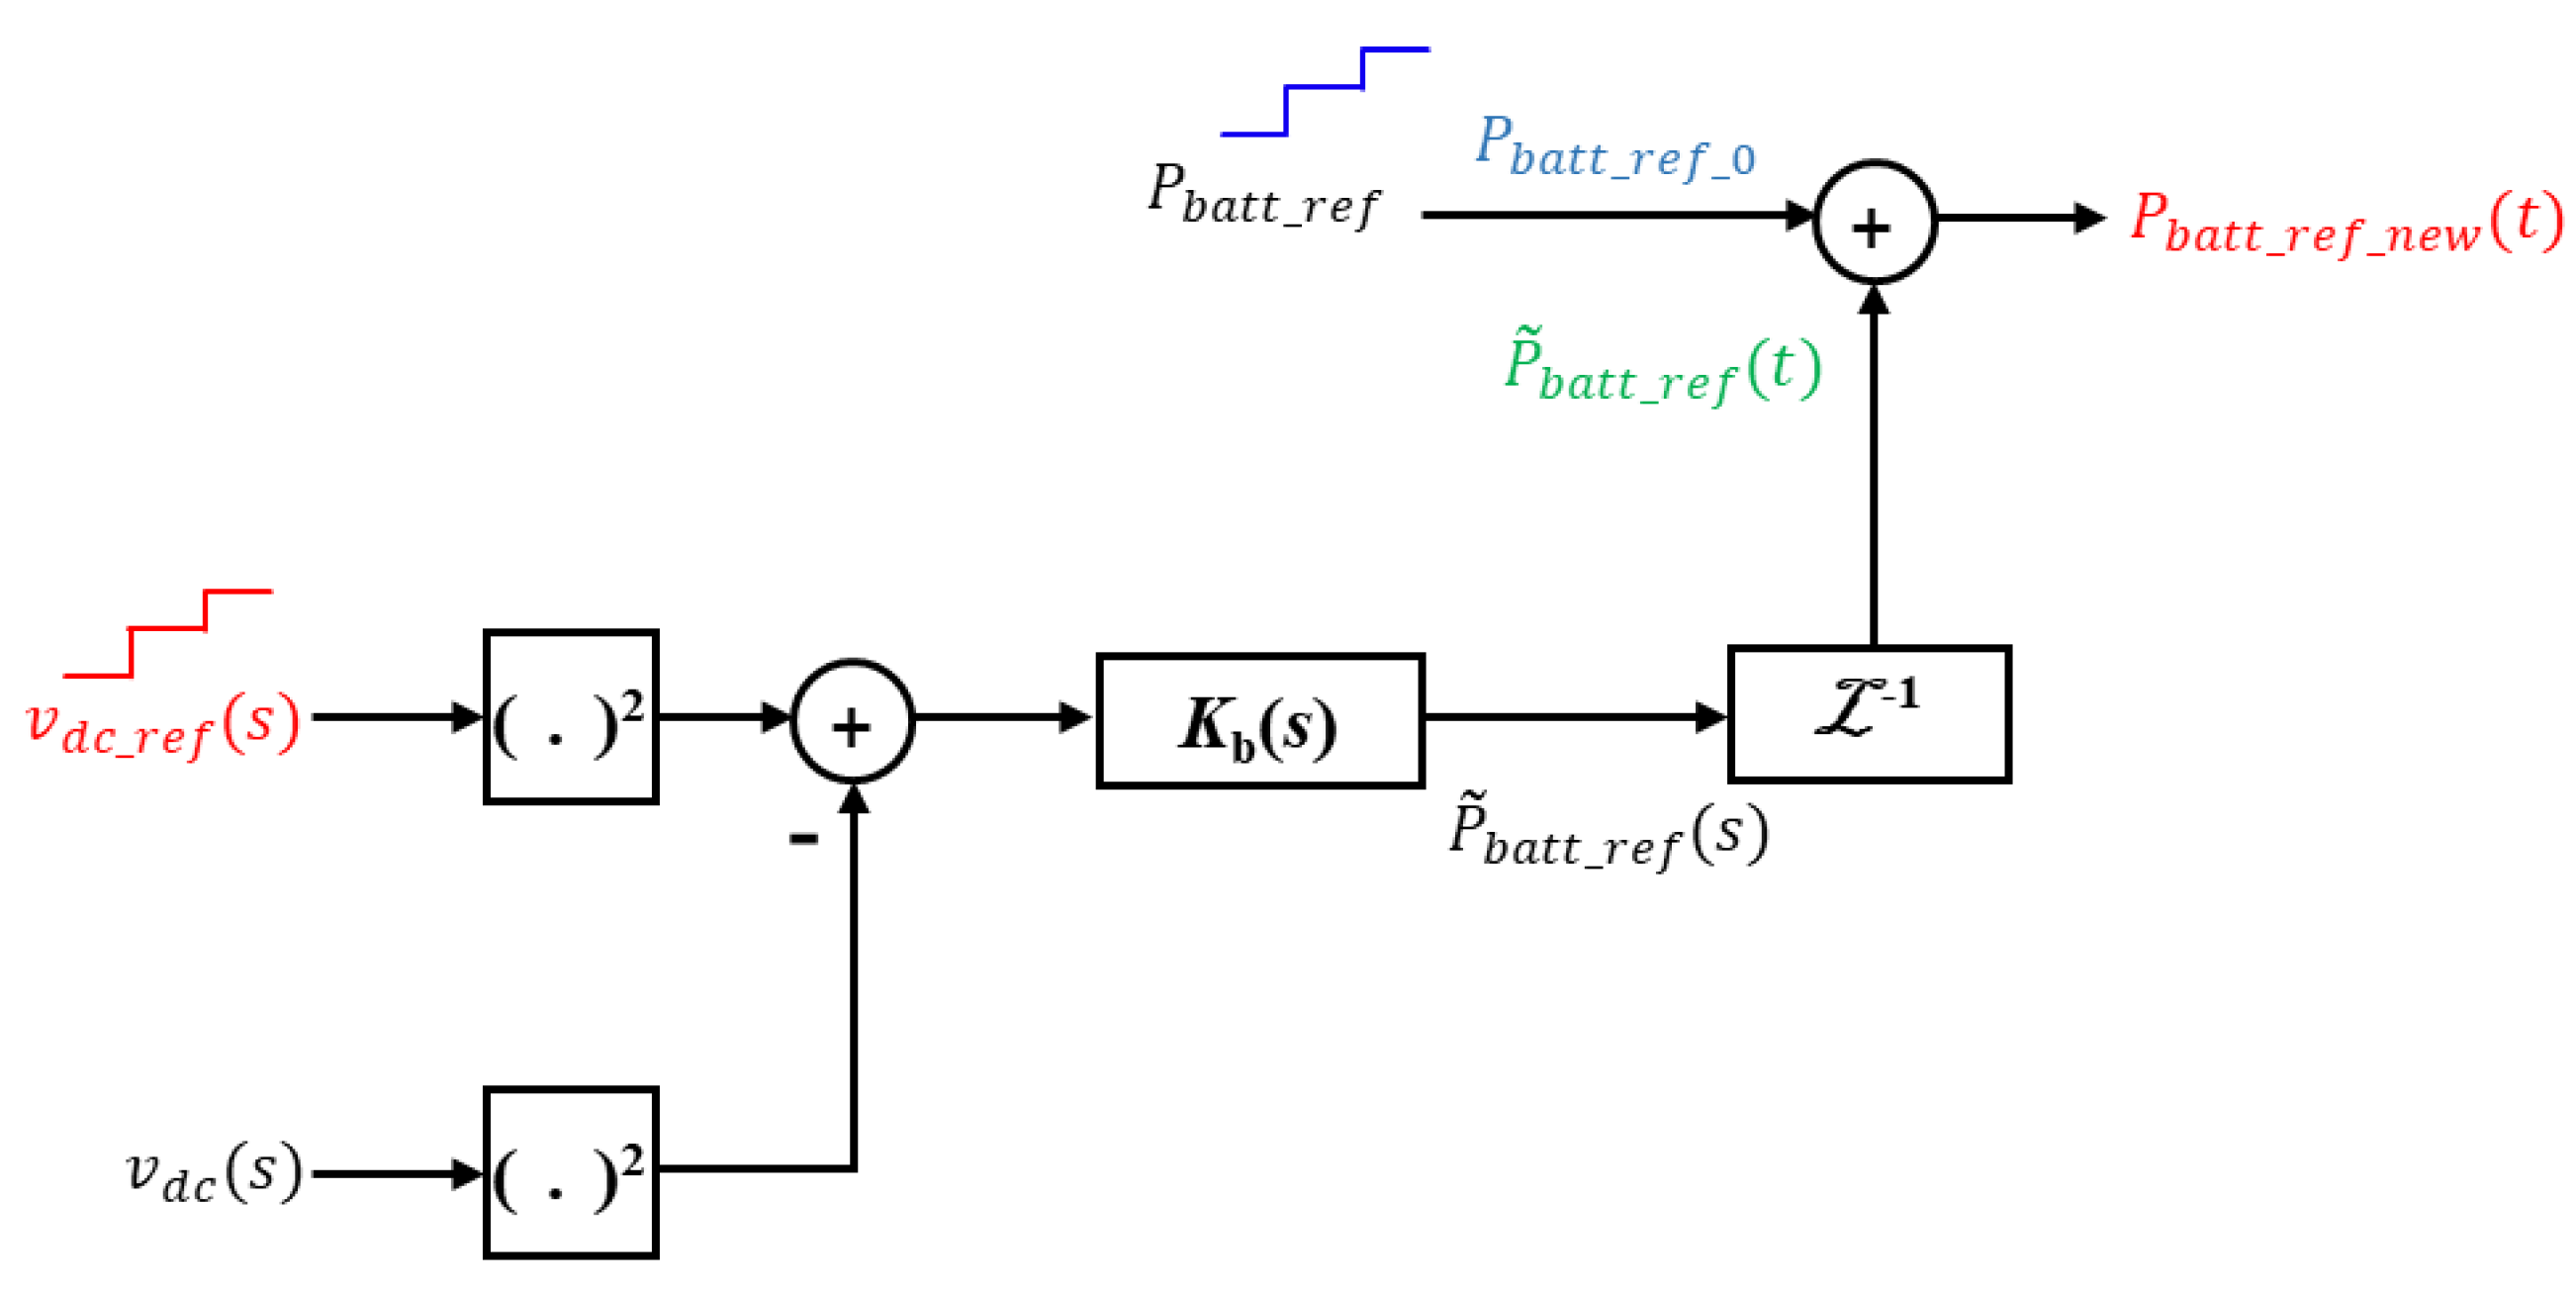
3.2. DC Link Voltage Fluctuation Suppression

As confirmed in Section 2.3, DC voltage fluctuation is caused by power imbalance. Therefore, eliminating this power imbalance will be a solution to suppressing the DC link voltage fluctuation. Pbatt needs to be adjusted to compensate for the power imbalance, and it is important to find out how much to adjust it. The following is a schematic diagram of the modeled DC system.
As shown in the Figure 9, Pt_dc means power flowing from DC power system to AC power system through VSC. PPV means the sum of power generated by PV and power consumed by DC load. In addition, the power charged and discharged from the battery is expressed as PBatt. The sum of PBatt and PPV was expressed as PS. The Equation (14) is the power equation for capacitor C.
P s u m ( t ) = d d t ( 1 2 C v d c 2 ( t ) ) + P t _ d c ( t )  
Psum appears as the sum of the power consumed by Ps and L. Expressed in a formula, it is as follows.
P s u m ( t ) = P s ( t ) + L i s u m ( t ) d d t ( i s u m ( t ) )
Equations (14) and (15) can be combined and expressed as a power equation for vdc like Equation (16). At this time, Equation (17) can be linearized using the small-signal perturbation method. The symbol ~ denotes small-signal perturbation and ‘0′ denotes the steady-state value of variable.
d d t ( v d c 2 ( t ) ) = 2 C { P s ( t ) + L v d c _ s 2 P s ( t ) d d t ( P s ( t ) ) } 2 C P t d c ( t ) .  
d ( v d c _ 0 2 + v ˜ d c 2 ( t ) ) d t
=   2 C { P s _ 0 + P ˜ s ( t ) + L v d c _ s 2 ( P s _ 0 + P ˜ s ( t ) ) d d t ( P s _ 0 + P ˜ s ( t ) ) } 2 C ( P t _ d c _ 0 + P ˜ t d c ) + 2 C P P V
At this time, Equation (17) can be derived using the microfluidic separation method. In summary, the equation in the steady state and the equation in the transient state can be obtained.
0 = 2 C { P b a t t _ 0 + P P V } 2 C ( P t _ d c _ 0 )   :   Steady
d ( v ˜ d c 2 ( t ) ) d t = 2 C { P ˜ b a t t ( t )   + L ( P b a t t _ 0 + P P V ) v d c _ s 2 d d t ( P ˜ b a t t ( t ) ) } 2 C ( P ˜ t _ d c ( t ) )   :   Transient
Through the Equation (18), the plant of the vdc squared variation and the Pbatt variation can be obtained. Therefore, transformation of Equation (19) into Laplace domain in a transfer function from P ˜ b a t t ( s ) to v ˜ d c 2 ( s ) as
v ˜ d c 2 ( s ) P ˜ b a t t ( s ) = 2 ( 1 + s τ ) C s
where the time constant τ is
τ = L ( P b a t t _ 0 + P P V ) v d c _ s 2
From Equation (20), the compensator Kb(s) can be designed. Finally, the control block diagram can be constructed by superimposing the steady state equation and the transient state equation. Figure 10 shows a control block diagram of the output power on the battery for the DC link voltage fluctuation control.
Therefore, it is possible to obtain the output power of the battery to be adjusted to suppress the DC link voltage fluctuation. This method can be used without any change, both when the battery is charging and when it is discharging stage.

4. Simulation and Results

In the current study, we used PSCAD/EMTDC (power system computer aided design/electro-magnetic transient including direct current) simulator to verify that the voltage fluctuation of the DC link is suppressed by battery control. Therefore, the simulation was conducted with 6 cases. It is largely divided into when the PV output is larger than DC load demand (case 1, 2, 3) and when the PV output is smaller than DC load demand (case 4, 5, 6). And there is a simple AC fault (case 1, 4), AC fault with LVRT (low voltage ride through) operation (case 2, 5), AC fault with LVRT and battery control (case 3, 6).
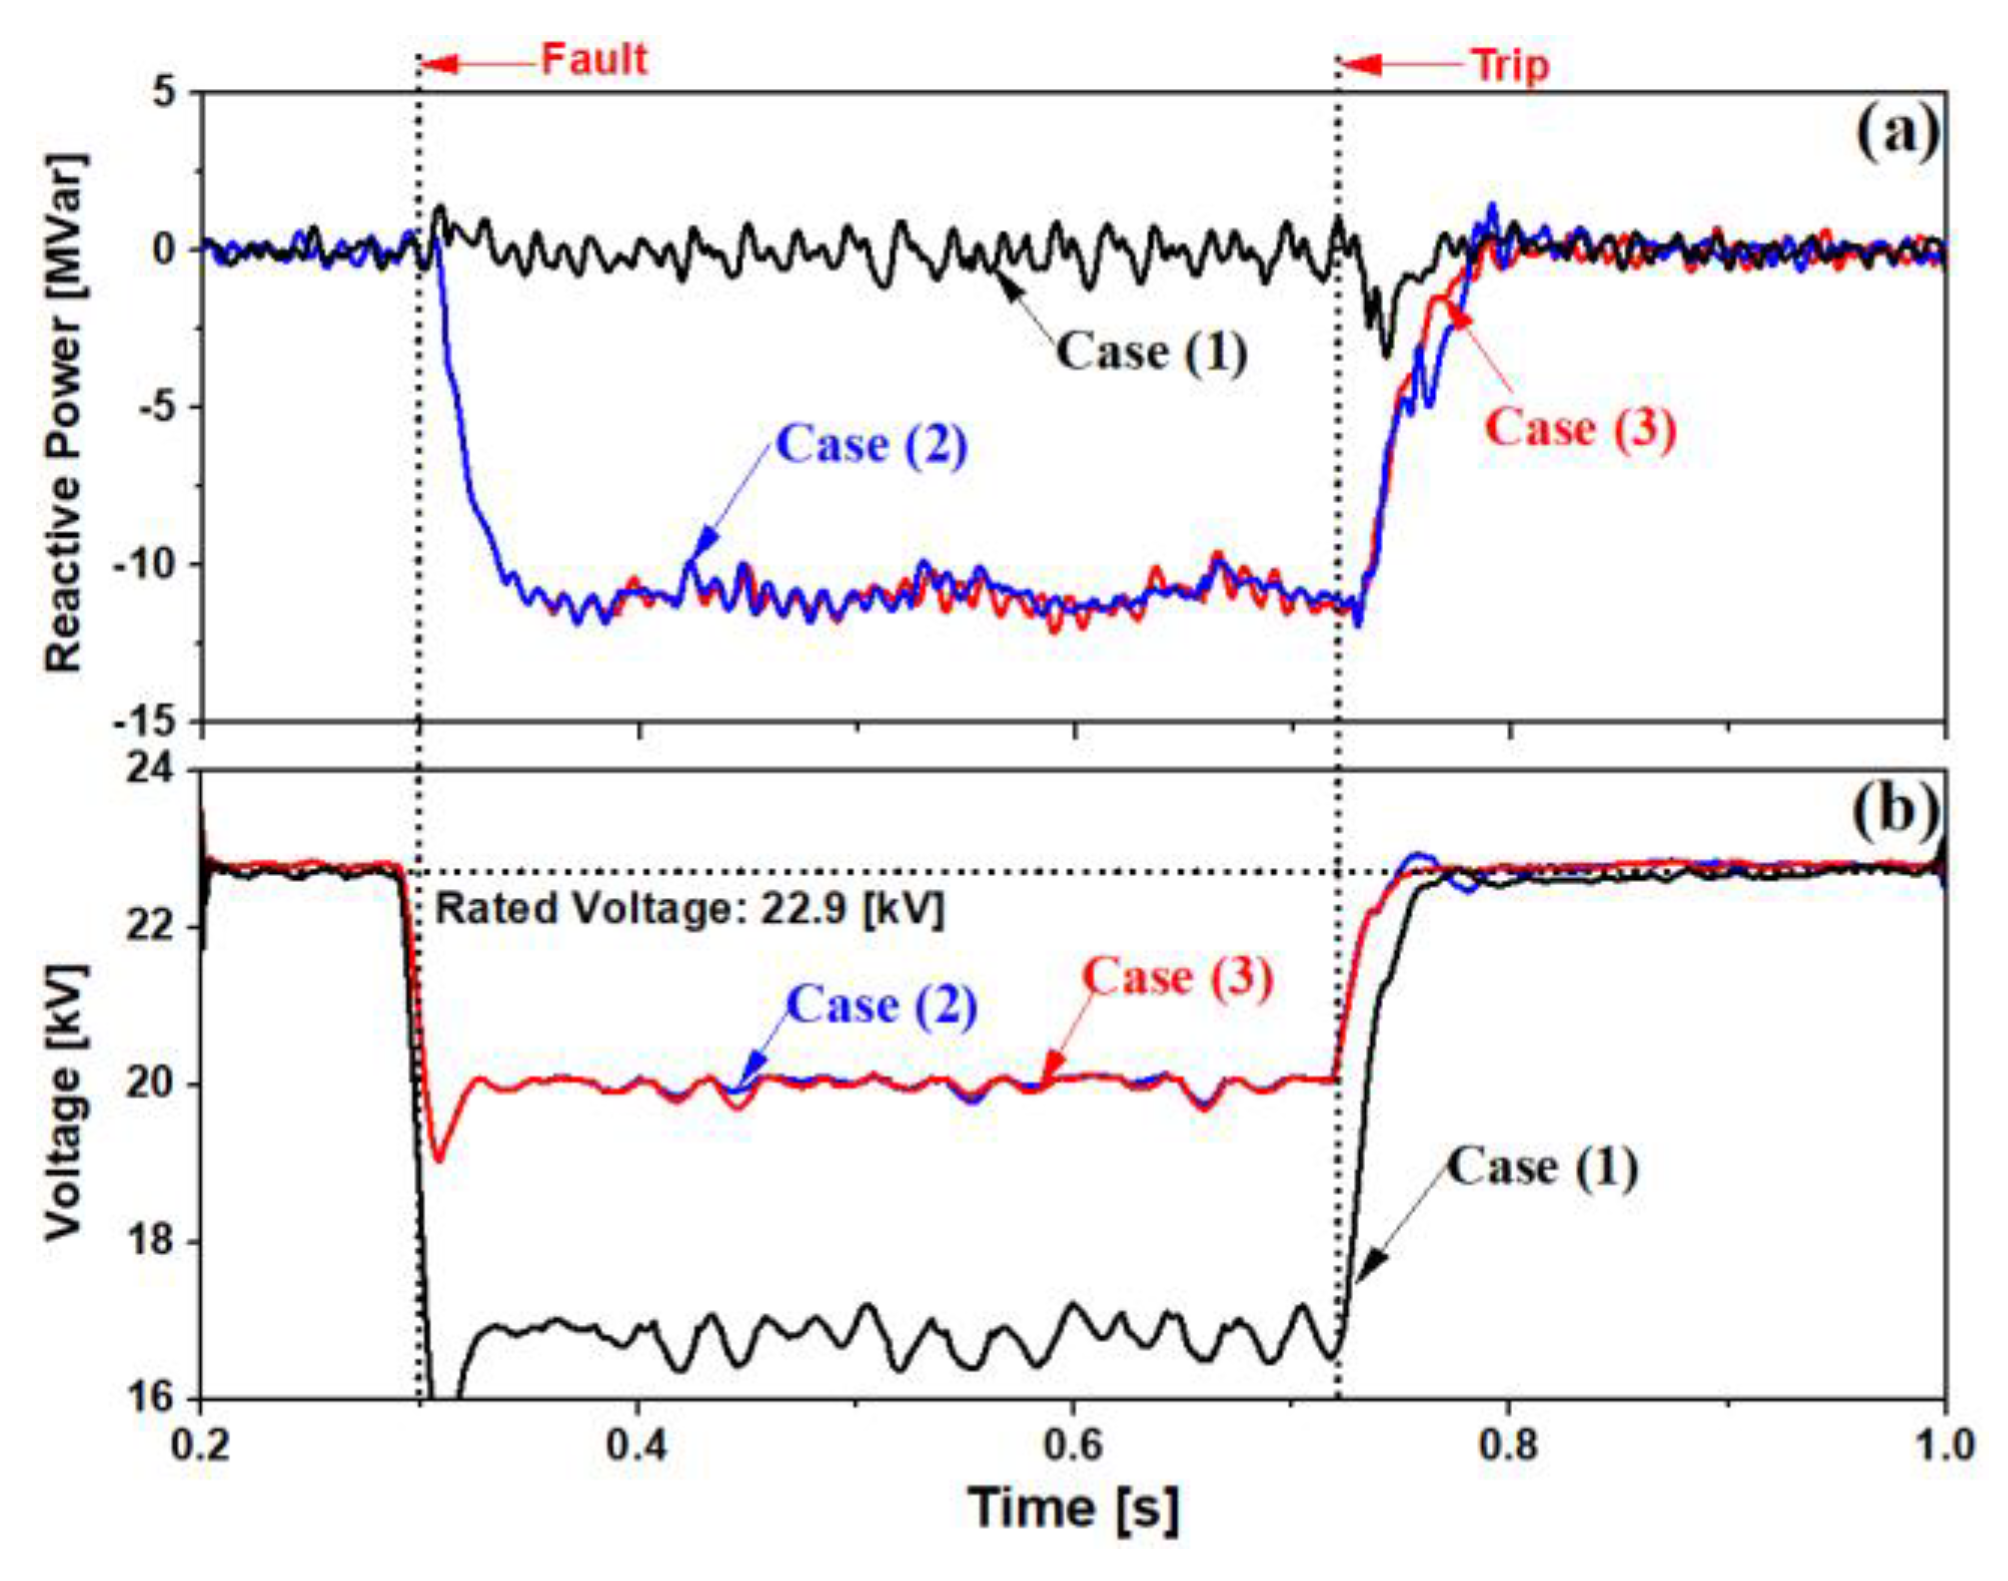
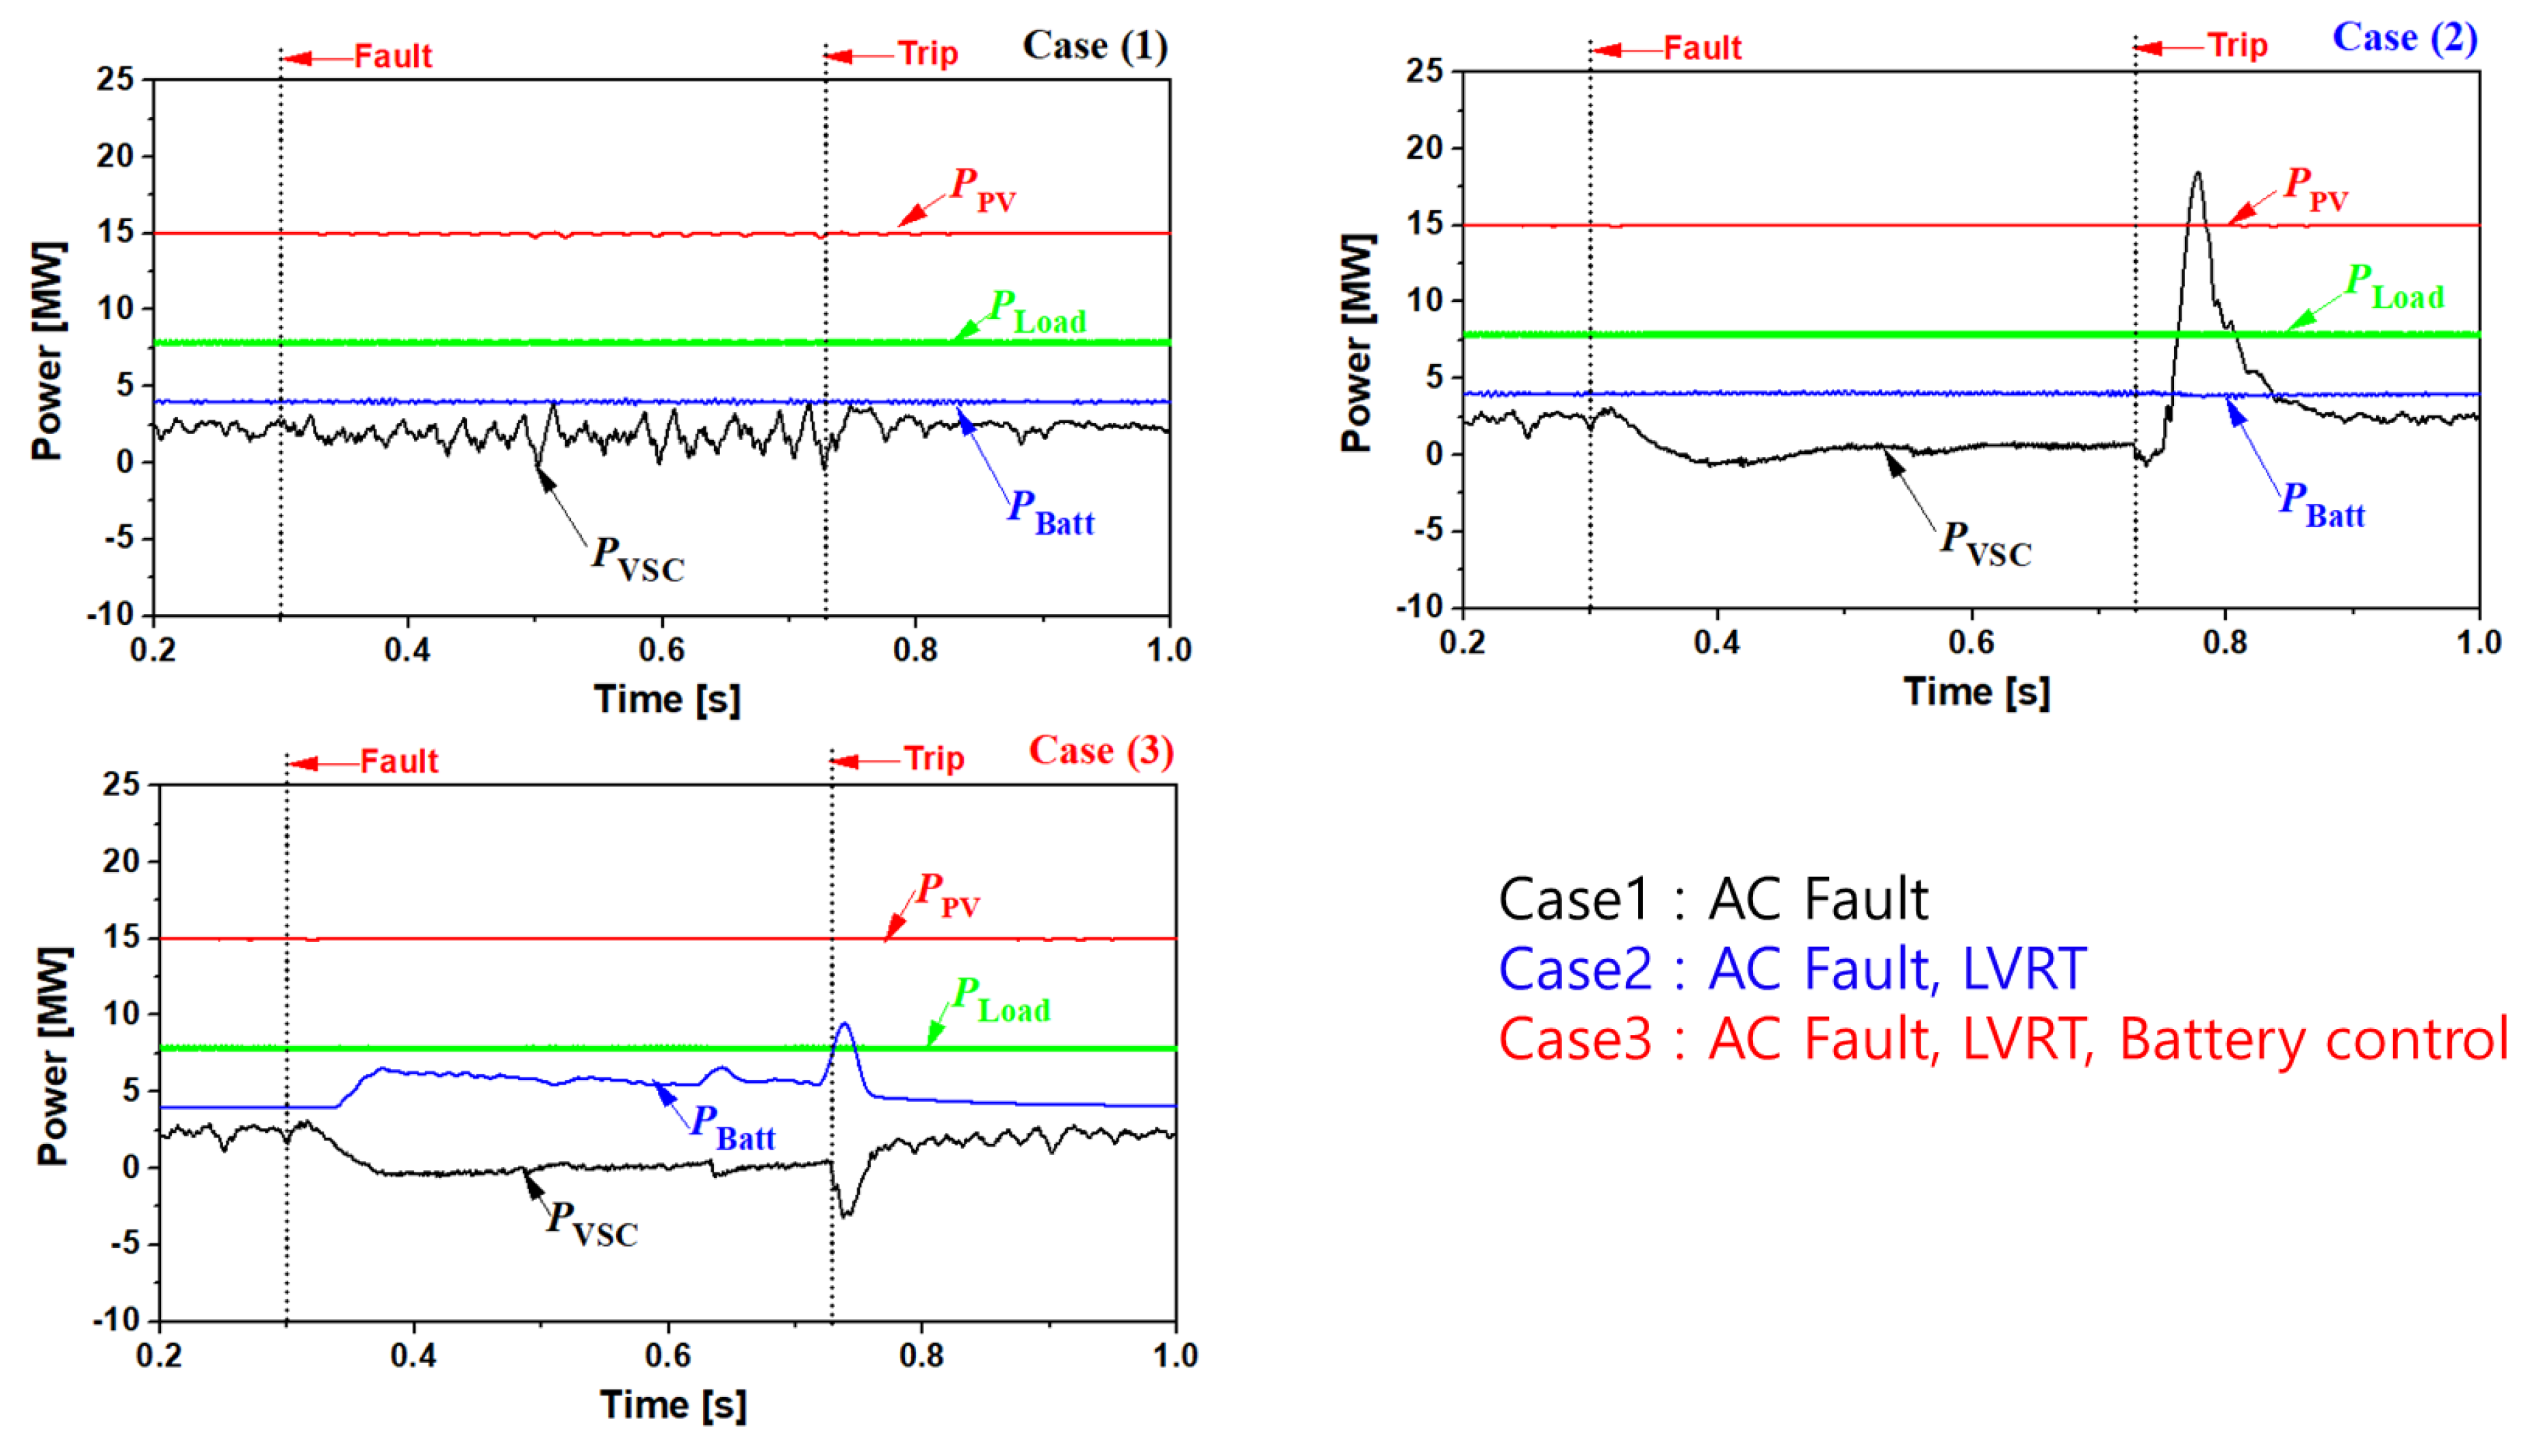
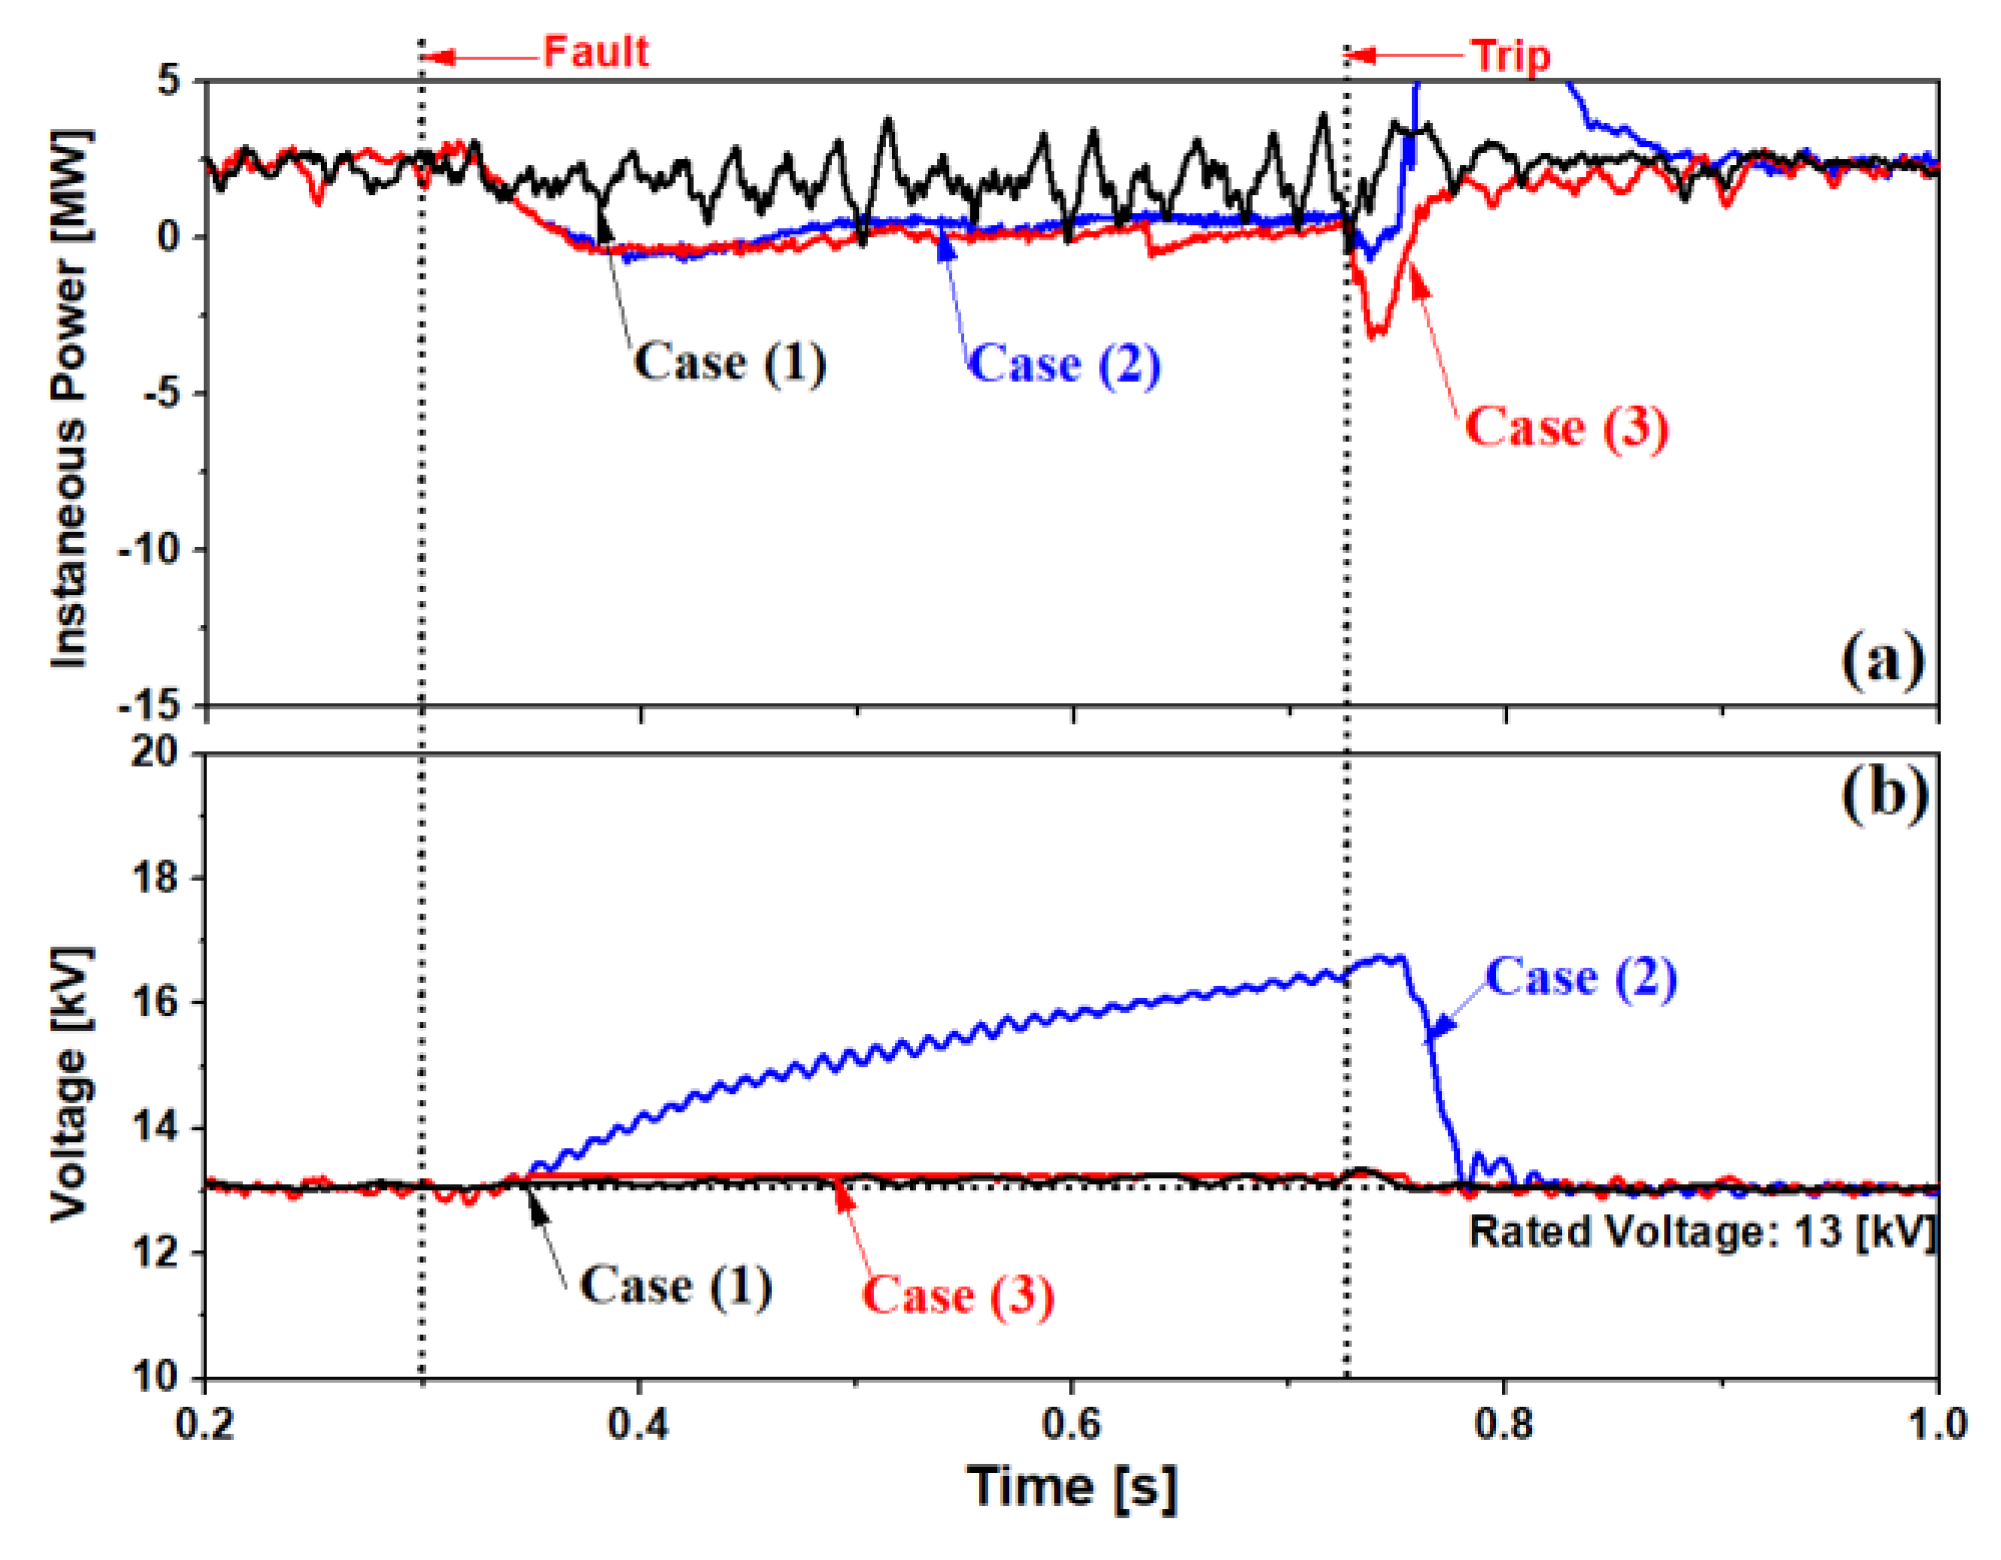
  • Case (1): PV (15 [MW]) > DC Load (8 [MW]), Fault;
  • Case (2): PV (15 [MW]) > DC Load (8 [MW]), Fault, LVRT;
  • Case (3): PV (15 [MW]) > DC Load (8 [MW]), Fault, LVRT, Battery Control;
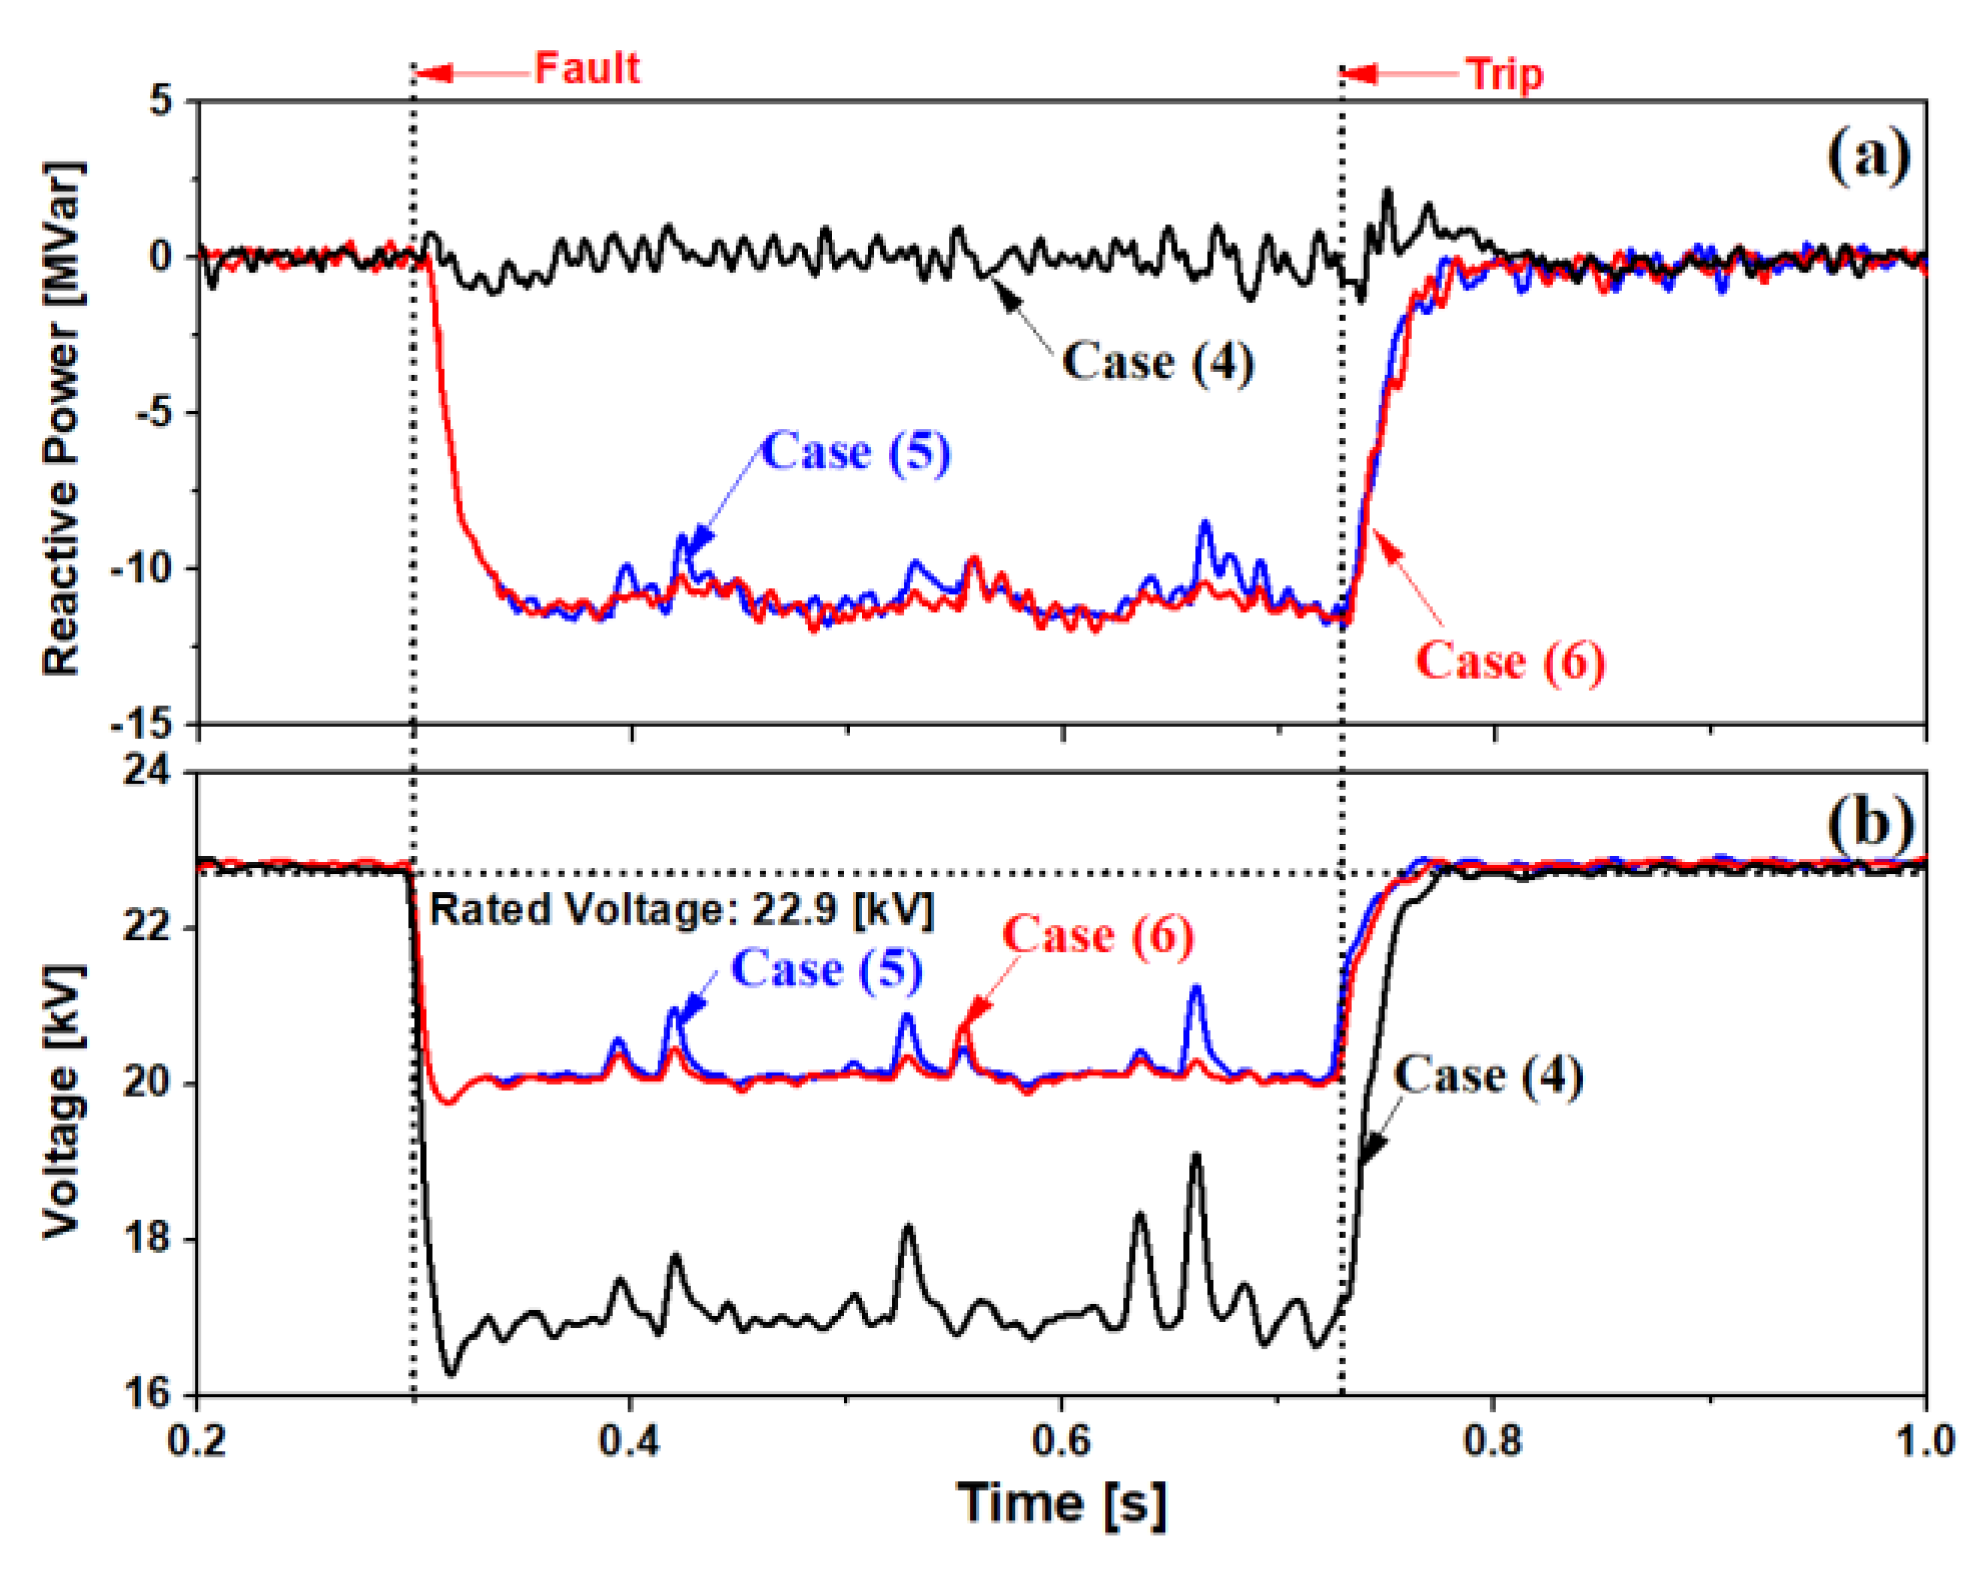
  • Case (4): PV (1 [MW]) < DC Load (8 [MW]), Fault;
  • Case (5): PV (1 [MW]) < DC Load (8 [MW]), Fault, LVRT;
  • Case (6): PV (1 [MW]) < DC Load (8 [MW]), Fault, LVRT, Battery Control;
In case (1, 2, 3), under normal state, the battery is charging at 4 [MW]. Since the battery is being charged, the buck-boost converter is operating as a buck converter. And VSC (voltage sourced converter) converts 3 [MW] from DC link to AC distribution system direction. However, when a fault occurs and the VSC operates LVRT (case 2), the converting active power becomes zero. Therefore, in the DC link, the output power becomes smaller compared to the input, the amount of electric charge charged in the capacitor increases, and the voltage rises. On the other hand, in case (4, 5, 6), the battery is discharging to 4 [MW] before fault. Since the battery is being discharged, the buck-boost converter is operating as a boost converter. And VSC converts 3 [MW] from AC distribution system to DC link direction. In this case, the output of the DC link is constant at 8 MW at DC load, and the input is at VSC and PV. If a fault occurs, VSC operates LVRT (case 5) and the converting active power becomes zero. As the VSC input decreases, the charged electric charge of the capacitor discharges and the DC link voltage drops.
Through case (3) and case (6), it can be confirmed that voltage fluctuation is suppressed when the DC link voltage drops and rises.

4.1. Simulation Conditions

As indicated in Figure 2, three-phase short-circuit fault was simulated in F location at 0.3 [s]. Simulation studies were carried out in EMTDC/PSCAD and the parameters for simulation in a whole system were given in the Table 4. In the event of the fault, the voltage of the fault location F of the feeder drops to 0 [V] at 0.3 [s]. The current flowing through the feeder increases and also the current through current transformer (CT) increases beyond pickup current of OCR.

4.2. Results and Discussion

During the daytime, the PV output is generally larger than the DC load consumption, so the battery charges the power and the remaining power is transferred to the AC distributed power supply through the VSC. When a fault occurs on the AC distributed power side, the bus voltage to which the DC system is connected decreases. If the bus voltage decreases severely, the VSC may open and the DC voltage may rise according to the LVRT operation. In case (1), it can be seen that the AC bus voltage is severely reduced. At this time, the opening of the VSC was not specified. Therefore, the rise of DC voltage cannot be confirmed. Figure 11 below shows the DC voltage of case (1)–(3).
In cases (2) and (3), since LVRT operation was applied, reactive power was supplied. Since the amount supplied is proportional to the DC voltage reduction, the amount of reactive power supplied is almost the same.
Figure 12 shows the change of DC power before and after the fault for cases (1)-(3). In Case (1), since reactive power is not supplied, the active power does not decrease, but the amount of fluctuation increased due to the decrease in AC side voltage. In Case (2), the supply of active power is reduced because reactive power is supplied from VSC. After a fault, the active power increases significantly. This occurs because the amount of charge in the DC capacitor increases during the fault period, the fault is removed, the power supply resumes, and the large power charged in the capacitor flow to the VSC side. At this time, PV and load battery output are constant. On the other hand, in case (3), since the output of the battery is controlled through calculation, it can be confirmed that it changes. In this case, unlike case (2), a large increase in active power when a fault is removed can be gradually increased through battery output control.
In Figure 13, it can be seen that the DC power rises to 16.2 kV in case (2) where the battery output is not controlled. Due to this, when the fault was removed, a large amount of active power flowed to the VSC. However, when the battery control is applied, the DC voltage does not rise, and there is no increase in active power when the fault is removed.
Unlike so far, PV output may decrease due to clouds or rain, or PV output may be almost zero in the evening. Cases (4)-(6) show when PV output is reduced. Before fault, the battery discharges 4 [MW] to supply power to the DC load, and VSC supplies 4 [MW] from the AC power system to the DC power system.
When a fault occurs as shown in Figure 14, the RMS (root mean square) voltage of the AC power system greatly decreases as in case (1). On the other hand, in cases (5) and (6) where LVRT is applied, voltage reduction is suppressed. In AC power system, there is not much difference between case (5) and (6).
Figure 15 shows the DC power graphs of cases (4)–(6). In case (4), since reactive power is not supplied to the AC power system, there is no significant change in DC power except for small vibrations of active power. In case (5), unlike cases (2), (3), and (6), the VSC power does not become 0 after a failure occurs. That is, it can be seen that the control of the VSC has failed. This is because the DC voltage decreased as shown in case (5) of Figure 16. On the other hand, in case (6), it can be seen that the VSC power converges to 0 and the DC voltage decrease is suppressed.
In the current study, we used SPWM (sinusoidal pulse width modulation) as a modulation method of VSC, and in this method, the AC side line-to-line voltage is 0.78 times that of the DC voltage. Therefore, there was no problem of controlling VSC in case (2) where the DC voltage increases, but in case (5) where the DC voltage decreases, there is a problem that the control of VSC is not properly performed. However, if the DC voltage reduction is suppressed through battery control, the same problem as case (5) can be solved.

5. Conclusions

This paper proposes a battery control that is used together with a renewable energy distributed power source to suppress DC link voltage fluctuations. For battery control, the equation derived through the relationship between the DC link voltage and the active power was used, and the controller was designed through the relationship between the variation of the DC voltage and the output variation of the battery. In order to verify the effectiveness of proposed battery control, a DC power system connected with battery and DC load, a PV (photovoltaic) as a distributed power source for renewable energy, and an AC power system connected with a DC power system and VSC (voltage sourced converter) were modelled. In this system, the simulation was carried out by dividing the case with the large PV output and the case with the small PV output. Each scenario was composed of 3 cases depending on whether LVRT (low voltage ride through) was applied and whether or not battery control was applied.
The modelled power system components were simulated through PSCAD/EMTDC software. The following contents were verified through this simulation.
-
When PV output is greater than DC load demand, DC link voltage rises due to LVRT operation;
-
When the DC link voltage rises, the overcurrent flows to the AC system when the fault is eliminated due to the increase in the amount of power charged in the capacitor;
-
When battery control is applied, DC link voltage rise is suppressed and overcurrent flowing to the AC system can be limited;
-
When PV output is less than DC load demand, DC link voltage drop due to LVRT operation;
-
Due to DC link voltage drop, PWM is included in the over-modulation area and control is not properly performed;
-
DC link voltage drop is suppressed through battery control and PWM is maintained in a linear- modulation area;
DC link voltage fluctuation could be effectively suppressed through the proposed battery control of the BESS connected to DC power system. The proposed control method can also be applied in the case of DC voltage fluctuations caused by DC fault situations, PV output power fluctuations, or DC load increase. Therefore, battery control may contribute to the construction or reconstruction of the AC/DC power system.

Author Contributions

Writing-original draft, S.-J.C.; Writing-review and editing, S.-H.L. All authors have read and agreed to the published version of the manuscript.

Funding

This research was supported by Korea Electric Power Corporation (Grant number: R19XO01-19) and was also supported by the National Research Foundation of Korea (NRF) grant funded by the Korea government (MOE) (No. 2017R1D1A1B03036530).

Conflicts of Interest

The authors declare no conflict of interest.

References

  1. Van Der Meer, A.A.; Ndreko, M.; Gibescu, M.; Van Der Meijden, M.A.M.M. The Effect of FRT Behavior of VSC-HVDC-Connected Offshore Wind Power Plants on AC/DC System Dynamics. IEEE Trans. Power Deliv. 2015, 31, 878–887. [Google Scholar] [CrossRef]
  2. Christian, F.; Holger, W.; Friedrich, K. Fault ride-through of DFIG-based wind farms connected to the grid through VSC-based HVDC link. In Proceedings of the 2008 16th PSCC, Glasgow, UK, 14–18 July 2008. [Google Scholar]
  3. Balaguer, I.J.; Lei, Q.; Yang, S.; Supatti, U.; Peng, F.Z. Control for Grid-Connected and Intentional Islanding Operations of Distributed Power Generation. IEEE Trans. Ind. Electron. 2010, 58, 147–157. [Google Scholar] [CrossRef]
  4. Christian, F.; Holger, W.; Friedrich, K.; Erlich, I. Enhanced Fault Ride-Through Method for Wind Farms Connected to the Grid Through VSC-Based HVDC Transmission. IEEE Trans. Power Syst. 2009, 24, 1537–1546. [Google Scholar] [CrossRef]
  5. Ramtharan, G.; Arulampalam, A.; Ekanayake, J.B.; Hughes, F.M.; Jenkins, N. Fault ride through of fully rated converter wind turbines with AC and DC transmission systems. IET Renew. Power Gener. 2009, 3, 426. [Google Scholar] [CrossRef]
  6. Arulampalam, A.; Ramtharan, G.; Ekanayake, J.; Tennakoon, A.; Abeyratne, S.; Jenkins, N. Fault Ride Through operation of a DFIG wind farm connected through VSC HVDC. In Proceedings of the 2010 5th International Conference on Industrial and Information Systems, Mangalore, India, 29 July–1 August 2010; pp. 520–525. [Google Scholar]
  7. Wang, L.; Wen, J.; Cai, M.; Zhang, Y. Distributed Optimization Control Schemes Applied On Offshore Wind Farm Active Power Regulation. Energy Procedia 2017, 105, 1192–1198. [Google Scholar] [CrossRef]
  8. Yao, Q.; Liu, J.; Hu, Y. Optimized Active Power Dispatching Strategy Considering Fatigue Load of Wind Turbines During De-Loading Operation. IEEE Access 2019, 7, 17439–17449. [Google Scholar] [CrossRef]
  9. Chaudhary, S.K.; Teodorescu, R.; Rodriguez, P.; Kjar, P.C. Chopper controlled resistors in VSC-HVDC transmission for WPP with full-scale converters. In Proceedings of the 2009 IEEE PES/IAS Conference on Sustainable Alternative Energy (SAE), Valencia, Spain, 28–30 September 2009; pp. 1–8. [Google Scholar]
  10. Xu, C.; Zhang, X.; Yu, Z.; Zhao, B.; Chen, Z.; Zeng, R. A Novel DC Chopper With MOV-Based Modular Solid-State Switch and Concentrated Dissipation Resistor for ±400 kV/1100 MW Offshore Wind VSC-HVDC System. IEEE Trans. Power Electron. 2020, 35, 4483–4488. [Google Scholar] [CrossRef]
  11. Pannell, G.; Zahawi, B.; Atkinson, D.; Missailidis, P. Evaluation of the Performance of a DC-Link Brake Chopper as a DFIG Low-Voltage Fault-Ride-Through Device. IEEE Trans. Energy Convers. 2013, 28, 535–542. [Google Scholar] [CrossRef]
  12. Kim, J.S.; Lim, S.-H.; Kim, J.-C. Study on Application Method of Superconducting Fault Current Limiter for Protection Coordination of Protective Devices in a Power Distribution System. IEEE Trans. Appl. Supercond. 2011, 22, 5601504. [Google Scholar] [CrossRef]
  13. Lim, S.-T.; Lim, S.-H. Analysis on Operational Improvement of OCR Using Voltage Component in a Power Distribution System for Application of SFCL. J. Electr. Eng. Technol. 2019, 14, 1027–1033. [Google Scholar] [CrossRef]
  14. Blackburn, J.L.; Domin, T.J. Protective Relaying: Principles and Applications, 4th ed.; CRC Press: Boca Raton, FL, USA, 2015. [Google Scholar]
  15. Flourentzou, N.; Agelidis, V.G.; Demetriades, G.D. VSC-Based HVDC Power Transmission Systems: An Overview. IEEE Trans. Power Electron. 2009, 24, 592–602. [Google Scholar] [CrossRef]
  16. Gemmell, B.; Dorn, J.; Retzmann, D.; Soerangr, D. Prospects of multilevel VSC technologies for power transmission. In Proceedings of the 2008 IEEE/PES Transmission and Distribution Conference and Exposition, Bogota, Columbia, 13–15 August 2008; pp. 1–16. [Google Scholar]
  17. Meyer, C.; Hoing, M.; Peterson, A.; De Doncker, R.W. Control and Design of DC Grids for Offshore Wind Farms. IEEE Trans. Ind. Appl. 2007, 43, 1475–1482. [Google Scholar] [CrossRef]
  18. Yazdani, A.; Iravani, R. Votage-Sourced Converters in Power Systems: Modeling, Control, and Applications; John Wiley & Sons: Hoboken, NJ, USA, 2010. [Google Scholar]
  19. Jin, P.; Li, Y.; Li, G.; Chen, Z.; Zhai, X. Optimized hierarchical power oscillations control for distributed generation under unbalanced conditions. Appl. Energy 2017, 194, 343–352. [Google Scholar] [CrossRef] [Green Version]
  20. Hannan, M.A.; Hussin, I.; Ker, P.J.; Hoque, M.M.; Lipu, M.S.H.; Hussain, A.; Rahman, M.S.A.; Faizal, C.W.M.; Blaabjerg, F. Advanced Control Strategies of VSC Based HVDC Transmission System: Issues and Potential Recommendations. IEEE Access 2018, 6, 78352–78369. [Google Scholar] [CrossRef]
  21. Li, Y.; Li, Y.; Li, G.; Zhao, D.; Chen, C. Two-stage multi-objective OPF for AC/DC grids with VSC-HVDC: Incorporating decisions analysis into optimization process. Energy 2018, 147, 286–296. [Google Scholar] [CrossRef] [Green Version]
  22. Mohan, N.; Undeland, T.M.; Robbins, W.P. Power Electronics: Converters, Applications and Design; John Wiley & Sons: Hoboken, NJ, USA, 2003. [Google Scholar]
  23. Rauschenbach, H.S. Solar Cell Array Design Handbook; Springer: Berlin/Heidelberg, Germany, 1980. [Google Scholar]
  24. Gow, J.; Manning, C. Development of a photovoltaic array model for use in power-electronics simulation studies. IEE Proc. Electr. Power Appl. 1999, 146, 193. [Google Scholar] [CrossRef]
  25. Villalva, M.G.; Gazoli, J.R.; Filho, E.R. Modeling and circuit-based simulation of photovoltaic arrays. In Proceedings of the 2009 Brazilian Power Electronics Conference, Bonito, Brazil, 27 September–1 October 2009; pp. 1244–1254. [Google Scholar]
  26. Wasynezuk, O. Dynamic Behavior of a Class of Photovoltaic Power Systems. IEEE Trans. Power Appar. Syst. 1983, 102, 3031–3037. [Google Scholar] [CrossRef]
  27. Hussein, K.H.; Muta, I.; Hoshino, T.; Osakada, M. Maximum photovoltaic power tracking: An algorithm for rapidly changing atmospheric conditions, Generation, Transmission and Distribution. IEE Proc. Gener. Transm. Distrib. 1995, 142, 59. [Google Scholar] [CrossRef]
  28. Rastler, D. Electricity Energy Storage Technology Options a White Paper Primer on Applications, Costs and Benefits; Electric Power Research Institute: Washington, DC, USA, 2010. [Google Scholar]
  29. Krishnamachari, B.; Czarkowski, D. Bidirectional buck-boost converter with variable output voltage. In Proceedings of the ISCAS ’98. Proceedings of the 1998 IEEE International Symposium on Circuits and Systems (Cat. No.98CH36187), Monterey, CA, USA, 31 May–3 June 1998; pp. 446–449. [Google Scholar]
  30. Kazimierczuk, M.K. Pulse-Width Modulated DC-DC Power Converters, 2nd ed.; Wiley: Hoboken, NJ, USA, 2008. [Google Scholar]
Figure 1. Schematic of Power Distribution System connected with DC Power System.
Energies 13 05832 g001
Figure 2. Detailed Configuration of Power Distribution System connected with DC Power System.
Energies 13 05832 g002
Figure 3. Configuration of AC/DC Power Distribution system with PV (photovoltaic), BESS (battery energy storage system) and DC Load connected to DC Link.
Energies 13 05832 g003
Figure 4. Control Block Diagram of VSC (Voltage-Sourced Converter) for Active and Reactive Power Control.
Energies 13 05832 g004
Figure 5. Equivalent Circuit of PV Panel.
Energies 13 05832 g005
Figure 6. Algorithm Diagram of InCond (Incremental Conductance) Method for Maximum Power Point Tracking.
Energies 13 05832 g006
Figure 7. DC Link Voltage Control of Inverter Mode VSC (Voltage-Sourced Converter).
Energies 13 05832 g007
Figure 8. Equivalent Circuit of BESS (Battery Energy Storage System) Composed of Bidirectional Buck-Boost Converter and Battery.
Energies 13 05832 g008
Figure 9. Power Flow in Schematic Diagram of Modeled DC Power System.
Energies 13 05832 g009
Figure 10. Control Block Diagram of the Output Power on Battery for the DC Link Voltage Fluctuation Control.
Energies 13 05832 g010
Figure 11. Simulation Results in Case (1)-(3): (a) Reactive Power of VSC (Voltage-Sourced Converter); (b) AC Power System RMS (Root Mean Square) Voltage.
Energies 13 05832 g011
Figure 12. Power Waveform of PV (Photovoltaic), DC Load, Battery and VSC (Voltage Sourced Converter) in Case (1)-(3).
Energies 13 05832 g012
Figure 13. Simulation Results in Case (1)–(3): (a) Instantaneous Power of VSC (Voltage Sourced Converter); (b) DC Link Voltage.
Energies 13 05832 g013
Figure 14. Simulation Results in Case (4)–(6): (a) Reactive Power of VSC (Voltage-Sourced Converter); (b) AC Power System RMS (Root Mean Square) Voltage.
Energies 13 05832 g014
Figure 15. Power Waveform of PV (Photovoltaic), DC Load, Battery and VSC (Voltage Sourced Converter) in Case (4)–(6).
Energies 13 05832 g015
Figure 16. Simulation Results in Case (4)–(6): (a) Instantaneous Power of VSC (Voltage Sourced Converter); (b) DC Link Voltage.
Energies 13 05832 g016
Table 1. Load Capacity of each bus.
Bus No.ValueUnit
11(MW)
22(MW)
31(MW)
41(MW)
51(MW)
61(MW)
73(MW)
82(MW)
93(MW)
101(MW)
114(MW)
122(MW)
Table 2. Parameters for Designing over Current Relay.
IndexDescriptionValueUnit
TDTime Dial0.02-
AOCR Trip Index39.85-
BOCR Trip Index1.084-
pNon-linear Index for OCR trip1.95-
IpickupThreshold current 3.5(kA)
Table 3. Management Systems and Installation Advantages of BESS.
Type of Management SystemInstallation Advantages
Load Leveling
-
Energy Cost Reduction
-
Maximum Power Demand Reduction
-
Transmission and Distribution Loss Reduction
Ancillary Service
-
Relief of power transmission congestion
-
Spinning Reserve
-
Frequency Stabilization
-
Reactive Power Supply
Power Quality Compensation and Emergency Power Source
-
Improvement of customer power quality and reliability
Renewable Energy Output Power Control
-
Power Generation Time Shifting
-
Capacity Firm
-
Output Power Regulation Smoothing
Table 4. Parameters for Simulation in whole System.
ItemClassificationValueUnit
DC System Rated Voltage15(kV)
Cable TypeXLPE
(ABB, July 2017)
Cable Impedance0. 022(mΩ/km)
Switching Frequency1980(Hz)
VSC Control ( V D C / Q R e f )15/(0 or FRT)(kV)/(MVar)
AC Distribution SystemLoadFigure 2
Line TypeCNCV/W 325mm2
Line Impedance0.0939 + j0.1492(Ω/km)
Line LengthFigure 2
VSC PI ControllerCurrent ControllerProportional gain (kP): 3.33-
Integral Time Constant (τi): 0.0002(s)
DC link Voltage ControllerProportional gain (kPv): 13.25-
Integral Time Constant (τ): 0.00001(s)
Publisher’s Note: MDPI stays neutral with regard to jurisdictional claims in published maps and institutional affiliations.

