Abstract
The research of innovative solutions to improve the efficiency of electric drives is of considerable interest to challenges related to energy savings and sustainable development. In order to successfully validate the adoption of new and innovative software or hardware solutions in the field of electric drives, accurate measurement procedures for either efficiency or power losses are needed. Moreover, high accuracy and expensive measurement equipment are required to satisfy international standard prescriptions. In this scenario, this paper describes an accurate measurement procedure, which is independent of the accuracy of the adopted instrumentation, for the power losses variations involved in electrical drives, namely ΔΔP, useful to detect the efficiency enhancement (or power losses reduction) due to the real-time modification of the related control algorithm. The goal is to define a valuable measurement procedure capable of comparing the impact of different control algorithms on electric drive performance. This procedure is carried out by experimentally verifying the action of different control algorithms by the use of a Field Oriented Control (FOC) with different values of the direct-axis current component (i.e., Id = 0 A and Id = −1 A) applied for fixed working conditions in terms of speed and load torque. Two different measurement systems of power losses, each one characterized by different accuracy and cost, are taken into account for the validation of the proposed method. An investigation is, then, carried out, based on the comparison between the measurements acquired by both instrumentations, for different working conditions in terms of load and speed, highlighting that the uncertainty generated by systematic errors does not affect the ΔΔP measurements. The results reported in this work demonstrate how the ΔΔP parameter can be used as a valuable index for the characterization of the power drive system, which can also be evaluated even with low-accuracy instrumentation.
1. Introduction
In recent years, the challenges related to the reduction of environmental pollution, energy savings and sustainable development have aroused the interest not only of the scientific and industrial communities but also of society and policies of the countries. In this scenario, the field of electrical drives plays a fundamental role, since it represents the biggest consumer related to global energy consumption in industrial applications [1,2]. Therefore, the efforts of the scientific community have been recently dedicated to on the research and development of innovative solutions concerning the design and control of high-performance power converters and electric motors, in order to obtain a relevant improvement of the electrical drives both in terms of efficiency and adaptability for challenging operating conditions. In particular, a significant increase in the adoption of electrical drives equipped with Permanent Magnet Synchronous Motors (PMSMs) has been detected, due to their high power factor, high torque density and high efficiency, especially for e-mobility [3,4], aircraft [5,6] and marine propulsion applications [6,7,8].
A possible solution for the energy savings purpose is the design and development of control algorithms for PMSM electric drives, with the aim of minimizing the power losses, maximizing, thus, the related overall efficiency. For instance, the topic of the design and development of maximum torque per ampere control algorithms for PMSM is continuously discussed [9,10,11] in the recent literature, as well as for the so-called loss model algorithms (LMAs), which involve the real-time determination of the optimal value of the magnetization level (or any other loss variable) for the power losses minimization of the motor [12,13,14] in any working operation in terms of speed and applied load. In order to validate the effectiveness of these types of control algorithms, it is needed to perform an accurate measurement of the PMSM electric drive efficiency [15,16,17].
In the last decade, the IEC 60034-2 [18,19,20,21,22] treated standardized methods in order to determine the efficiency of electrical machines fed by the electrical grid and converter-fed motors with adequate accuracy, repeatability and reproducibility. These international standards provide accurate prescriptions for induction machines, dc machines, and wound-field synchronous machines; however, specific prescriptions regarding the PMSMs efficiency measurement are not provided. Moreover, these international standards do not cover the electric machines specifically adopted for traction applications. The latest international standards IEC 61800-9, issued in 2017 [21,22], which provide the methodologies needed for the determination of the efficiency of each part of the electric drive, such as the electric motor, Complete Drive Modules (CDMs) and Power Drive Systems (PDS), are a valid reference for the electric drive efficiency measurement. These standards introduce the definition of a conventional measurement methodology to energy efficiency standardization for any extended product by defining the guidance of the Extended Product Approach (EPA), which considers not only the efficiency of the motor, but also the efficiency of the whole electric drive, including of its load.
In this context, the scope of this work concerns the definition and validation of an innovative and general measurement procedure of power losses variations involved in electrical drives, which can be applied independently from the accuracy of adopted instrumentation. Indeed, it can be generally stated that the measurement of the efficiency controlled by different control algorithms requires the PDS efficiency measurement for each control algorithm with accurate and expensive measurement instruments. Nevertheless, the proposed and discussed methodology addresses the accurate estimation of the power losses variations, namely ΔΔP, which can be determined by real-time changes of the algorithms capable of controlling the electrical drive to maximize the related performance, even by the use of low-accuracy and cheap measurement equipment. Therefore, it will be demonstrated that, for real-time control, the ΔΔPPDS index represents an optimal parameter for the characterization of the control system.
For this purpose, two different measurement systems, each one characterized by different accuracy and cost, have been taken into account of the proposed methodology. More specifically, an extended experimental investigation has been carried out on a low-power PMSM electric drive by changing the working conditions in terms of load and speed and by varying the magnetization level of the motor under test by means of the applied control algorithm. This work demonstrates that the ΔΔP index is independent of the uncertainty given by systematic errors and, therefore, the ΔΔP measurements can be carried out even with low-accuracy instrumentation.
This work is structured as follows: Section 2 describes the methodologies suggested by the recent standards regarding the determination of the power losses in a power drive system, Section 3 reports the mathematical description of the proposed methodology, Section 4 provides a brief description of the test bench set-up for the experimental tests, Section 5 discusses the acquisition of experimental results and their analysis, Section 6 summarizes the validation of the proposed method and provides the uncertainty analysis that validates the proposed measurement approach.
2. Methodologies for the Power Losses Measurements in Electrical Drives
Figure 1 shows a schematical representation of the PDS and its three main sections (single-phase PDS input section, no. 1, three-phase input motor section, no. 2 and mechanical PDS output section, no. 3). From the reported scheme, it is possible to define the PDS efficiency that can be measured with the direct method, by using the following relationship:
where PPDS and PM are the active power flows through Section 1 and Section 3, respectively.
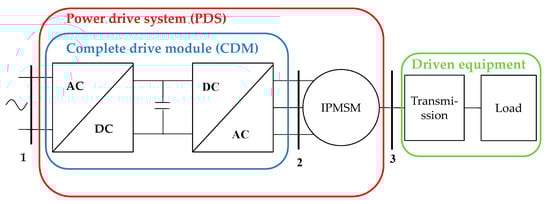
Figure 1.
Schematic representation of a PDS.
Otherwise, by referring to the Standard IEC 60034-2-1, the efficiency can also be indirectly determined from the computation of the power losses involved in the system, namely ΔP, by adopting the following equation:
where ΔPCDM and ΔPM are the total loss of the CDM and the total loss of the motor, respectively. They can be also defined as:
where PMot is the power flow through Section 2.
Therefore, it appears evident that the indirect method involves the computation of the power losses involved in the section of both converter and motor. The indirect measurement methodology requires a huge amount of tests for the determination of each power loss component of both the converter and the motor. Therefore, this methodology is a high time-consuming measurement approach. In this context, the standards provide to apply the indirect method only for high-power motors with a power greater than 1 kW [18].
An interesting study [23] addresses the uncertainty evaluation for both direct and indirect determinations of efficiency, demonstrating that the use of the direct method with the adoption of technologically advanced instrumentation for the measurement of torque and speed, also for high-power motor, provides simpler and straight efficiency determination with uncertainties even lower than those obtained by means of the indirect method. Nevertheless, no specific standard is dedicated towards PMSMs: the standard IEC 60034-2-3 is limited only to induction machines, dc machines and wound-field synchronous machines, while the IEC 61800-9 is directed towards the characterization of the whole drive, including CDM and motor [21,22]. The reference for this topology of motors is the IEEE Std 1812-2014 [24], which provides the guidelines for the determination of ΔP, composed by the iron losses ΔPfe, stator copper losses ΔPcu, friction and windage losses ΔPm and additional losses ΔPadd including the additional losses due to inverter voltage harmonics. The short-circuit and load tests are practically identical to those described in the standard IEC 60034-2-1 referred to traditional synchronous motors, while the no-load test presents some differences. Firstly, the rotor flux of a PMSM cannot be controlled and, therefore, the friction losses cannot be computed with the procedure suggested in the standard IEC 60034-2-1. In any case, the determination of ΔPfe and ΔPm (which cannot be easily separated like a traditional motor) leads to undoubted practical difficulties, since the rotor must be replaced with an identical rotor without PMs. Besides, the guide suggests other procedures like the direct measurement of the mechanical power transmitted by a tared machine method, or with retardation or coast-down test. Moreover, the magnetic field produced by the PMs is temperature-sensitive; therefore, during different working conditions, the PMSM temperature changes could cause variations of the rotor flux, affecting, consequentially, the produced power.
In recent literature, a small number of papers addressed the indirect determination of the PMSMs efficiency, obtained by computing the sum of the power losses. More specifically, Deusinger et al. described a new indirect measurement method of the PMSM efficiency that requires an open circuit test, a removed-rotor test and a pure reactive current test [25]. Lateb et al. [26] proposed a suitable indirect efficiency measurement method for high-speed surface-mounted PMSMs by adopting over-fluxing test at near-zero power factor, in order to estimate the motor core losses close to load conditions. However, these studies do not address the determination of measurement uncertainties, whose aspect, instead, represents a relevant aspect for the evaluation of the accuracy of the proposed efficiency measurement approaches [27,28].
In conclusion, it can be stated that the direct method is a simpler procedure than the indirect method, requiring only the measurement of input power and output power of the system taken into account (motor, CDM, or PDS). As for the PDS, the most critical aspect is related to the measurement of the output mechanical power, which requires accurate transducers or very expensive instrumentation [29]. On the contrary, the indirect method requires the measurement of each power loss component, which leads to a more complex and time-consuming procedure. However, it provides the advantage of performing efficiency measurement with only electrical equipment, which is very accurate and relatively cheap.
3. Proposed Methodology for the Power Losses Measurements in Electrical Drives
This section describes the procedure adopted for the determination of a new index, namely ΔΔP, which represents a useful tool for the measurement of the power losses variations involved in the PDS, demonstrating the fact that the measurement of the ΔΔP index can be provided even with low-cost instrumentation, without compromising the accuracy of the measurement.
This study was applied to a whole PDS, taking into consideration the measurements achieved with the two following measurement systems (deeply discussed in Section 4):
- A highly accurate measurement system, composed of a NI 9225 acquisition module and a high precision A40B Fluke shunt resistor for the PDS input power measurement and another NI 9215 acquisition module for the measurement of mechanical quantities;
- A low-accuracy measurement system, composed of a NI 9225 acquisition module and a low precision i400 Fluke current probe for the PDS input power measurement and the previous measurement equipment for the measurement of mechanical quantities.
By defining ΔPPDS,1 and ΔPPDS,2 as the PDS power losses for two different control algorithms, namely 1 and 2, the PDS power losses are evaluated as the difference between the PDS input active power PPDS and the PDS output mechanical power PM, therefore with the following equations:
Given that there is no correlation between the electric and mechanical measurements, the uncertainty related to the power losses ΔP in the PDS is given by:
where u(PPDS) is the uncertainty of the input power measurement, whereas u(PM) is the uncertainty in the mechanical measurement. Thus, the following two quantities are defined:
where ΔΔPPDS,shunt is evaluated with the shunt resistor and ΔΔPPDS,probe is evaluated with the Fluke current probe. These quantities define the reduction or enhancement of the power losses obtained by switching from Algorithm 1 to Algorithm 2.
Since a large part of PMSM control algorithms are designed to optimally elaborate the direct-axis current value in order to optimize the PMSM performance [30,31,32], a Field Oriented Control (FOC) strategy, shown schematically in Figure 2, has been adopted. The FOC block scheme presents a closed-loop control of the motor speed, where the corresponding speed error is processed by the use of a PI regulator that provides the reference value of q-axis current component Iq*. Moreover, the magnetization level of the motor can be controlled by selecting the reference value direct axis current Id*. These values are compared with the real values of Iq and Id, measured with LEM sensors of CDM; the correspondings errors are processed in order to obtain the reference values of the supply voltage Park components vd* and vq*. The dq voltage quantities are transformed in a three-phase reference frame and applied to the motor through a Pulse Width Modulation (PWM) technique. Therefore, the control strategy can be varied by selecting different Id* values.
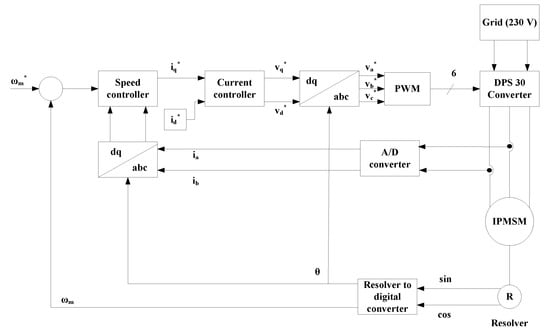
Figure 2.
Block diagram of the control system taken into account.
It can be demonstrated that the ΔΔPPDS measurement is not affected by uncertainty due to systematic errors. It is, indeed, well known that the uncertainty corresponding to a general quantity y = f(x1,x2,….xn), with , is given by:
where rij represents the coefficient of correlation between the i-th and the j-th quantities. For the ΔΔPPDS quantity, the following formula is obtained:
Therefore:
Since both the input electric power and mechanical power are measured with the same equipment and the measured values are similar when employing both the Algorithms 1 and 2, it is possible to assert that:
Let’s suppose that the components of the uncertainty due to random errors are neglected. Then, by referring to the correlation coefficient, let’s suppose to employ two different measurement equipment for independent acquisition of electrical quantities and mechanical quantities. Thus, it is possible to assert that rij = 1 if the uncertainty quantities involved in the double product are both electrical or both mechanical; otherwise, rij = 0. As a consequence, the uncertainty expression can be written as follows:
The obtained result emphasizes that ΔΔPPDS,shunt and ΔΔPPDS,probe are not affected by the uncertainties due to systematic errors. Therefore, their measurements should provide the same results, although with a slight deviation due to random errors.
4. Test Bench
For the validation of the proposed methodology, it is needed to quantify the contribution of the random errors evaluating the short-term repeatability of the related measurements. For this purpose, a test bench has been set-up and it is composed by (Figure 3):
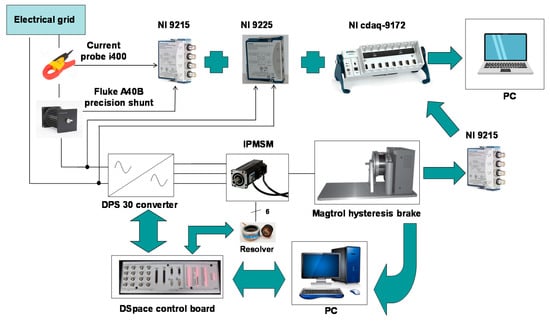
Figure 3.
Schematic representation of the test bench.
- A Complete Drive Module (CDM), consisting of a DPS 30-A power converter (Automotion Inc., Chantilly, VA, USA), which is composed of a diode bridge rectifier stage supplied by the electrical grid and an inversion stage. The IGBT bridge of the inverter is made by POWEREX, Model PM30CSJ060;
- A three-phase Interior Permanent Magnet Synchronous Motor (IPMSM) (Magnetic S.r.l., type BLQ-40, Italy) with SmCo permanent magnets (made by HITACHI Inc, type H-18B, maximum specific energy equal to 143 kJ/m3). The nameplate data are summarized in Table 1;
 Table 1. Rated values and parameters of IPMSM under test.
 - A Magtrol hysteresis brake (Model HD-715-8NA), connected to the shaft of the motor and used as a mechanical load for the IPMSM. The Magtrol can be controlled in real-time through a digital dynamometer (model DSP6001) or software interface. The torque and speed measurement signals are acquired by the use of an acquisition board (in this case, the NI DAQ 9215). The main features of the brake are described in Table 2;
Table 2. Main features of the Magtrol hysteresis brake.
- A programmable data acquisition board NI cdaq-9172, suitable for the Labview® environment. This setup provides several advantages, such as a high degree of flexibility and acquisition of a large number of signals;
- A NI DAQ 9225 acquisition module, whose specifications are shown in Table 3;
Table 3. Technical data for the NI 9225 acquisition module.
- Two NI DAQ 9215 acquisition module, whose specifications are shown in Table 4;
Table 4. Technical data for the NI 9215 acquisition module.
- A Fluke i400 current probe (Table 5);
Table 5. Technical data for the fluke i400current probe.
- A non-inductive Fluke A40B shunt resistor (Table 6).
Table 6. Technical data for the A40 B shunt fluke.
The input power of the PDS is measured by adopting the scheme reported in Figure 3. The single-phase voltage is measured through a direct connection to the NI DAQ 9225 acquisition module. The current is sensed simultaneously by the use of a Fluke i400 current probe and through a non-inductive Fluke A40B shunt resistor, whose output signals are sent to the NI DAQ 9215 acquisition module. More in detail, the shunt presents high accuracy and cost especially regarding the phase angle error that present very low value. This feature allows the accurate measurement of active power. Instead, the current probe presents lower accuracy and cost, with respect to the shunt, and its angle error is not known. Therefore, as mentioned in the previous section, the two adopted transducers allow defining two measurement systems that perform the input power measurement with different accuracy and uncertainty. In this way, it is possible to compare the measurement results between a first measurement system with greater accuracy and cost (shunt resistor) able to meet the standard prescriptions [21,22]. and a second measurement system less accurate and not satisfying the standard prescriptions [21,22], but cheaper (current probe).
From the reported Tables, it can be stated that the bandwidth of the adopted components is adequate for the measurement of the electrical quantities involved in the CDM input section. Moreover, the NI 9225 is suitable for the acquisition of grid sinusoidal voltage (240 Vrms), since it can reach 300 Vrms of the input voltage. As for the current, it reaches peak values in the order of Ampère units. The shunt resistor has an already adequate value of rated range and it is chosen to arrange 4 turns on the pass-through current probe for operation close to the full-scale. It is easy to calculate the output voltages from the probe and the shunt resistance and verify that these values do not exceed the NI 9215 acquisition module full-scale value equal to 10 V.
Finally, the uncertainties introduced by the acquisition modules are negligible if compared to those given by the transducers.
The mechanical load of the motor consists of a Magtrol HD-715-8NA hysteresis brake. The torque offered by the brake can be adjusted in real-time by means of a Magtrol digital dynamometer model DSP6001, whose interface already provides the torque, speed and power values measured at the shaft motor. Furthermore, the digital dynamometer provides the torque and speed measurement signals can be sent to other acquisition systems. In this work, an additional acquisition module NI DAQ 9215 is used to acquire the torque and speed measurement signals. The accuracy specifications of Magtrol HD-715-8NA hysteresis brake satisfy the prescription of the standards [18,19,20,21,22]. Therefore, the adoption of the Magtrol HD-715-8NA hysteresis brake with the NI 9215 module allows performing the accurate measurement of mechanical power satisfactory for accurate direct measurement of the efficiency according to the standard [21,22].
5. Measurement of the PDS Power Losses
5.1. Data Acquisition Procedure
Based on the statements reported in the previous Sections and since the rated power of the IPMSM under test is lower than 1 kW, the direct method has been adopted in order to evaluate the efficiency of the PDS described in Section 3. Figure 4 shows a photograph of the test bench during a set of measurements of the PDS power losses.
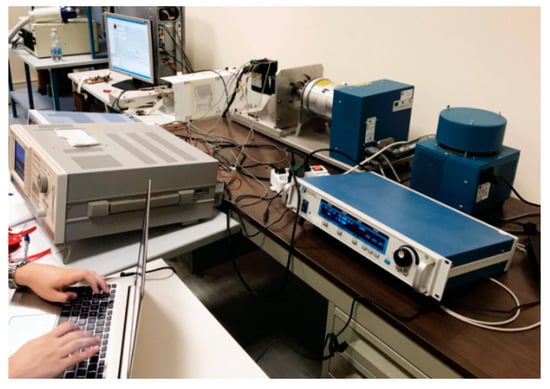
Figure 4.
A photograph of the test bench during the power losses measurements.
The speed and torque transducers employed in the electrical drive under test satisfy the measurement requirements of the standard IEC 60034-2 [20].
The acquisition of both the electrical and mechanical quantities is carried out through the transducers (see Section 4) in a Labview environment. This acquisition is carried out with the Express Virtual Instrument (VI) DAQ Assistants, characterized by:
- Sampling frequency, namely fs;
- Single acquisition time or measurement time, namely TM.
The number of samples in one acquisition is given by:
During a single acquisition time, the instantaneous values of electrical and mechanical quantities are acquired so that the instantaneous values of electrical power pPDS(t) and mechanical power pM(t) are computed by means of the following relationships:
where vPDS(t) is the instantaneous value of the PDS input voltage, iPDS(t) is the instantaneous value of the PDS input current, Tem(t) is the instantaneous value of the electromagnetic torque and ωm(t) is the instantaneous value of the mechanical speed. By means of the Labview VI library (e.g., VI BASIC DC RMS), the overall rms values of voltage and current quantities, as well as the mean value of instantaneous electric power and the mean value of mechanical quantities are computed with respect to time TM. More specifically, the computation of the mean value of the instantaneous electric power allows considering the contribution, in terms of active power, of each product between isofrequential harmonic components of both voltage and current.
Consequently, in a period equal to TM, it is possible to obtain one sample for each electrical and mechanical quantity, allowing the possibility of repeating this process and performing a very wide range of time window, without affecting the PC memory with a large number of samples.
Besides, the adoption of several measurement samples allows the evaluation of the average value and the measurement deviation for each quantity. The single measurement, which is characterized by TM and fs, is, then, implemented in a single iteration of a for loop. The number of iterations N corresponds to the number of desired measurement samples. The total observation time or the total acquisition time Tw is equal to:
At the output of each loop iteration, the measurement sample is stored in an external array. At the end of the cycle, an array is obtained for each quantity of interest, consisting of scalar elements. The measurement arrays obtained are summarized in Table 7.
Table 7.
Measurement arrays for the PDS Section.
The efficiency of the PDS is computed within the for loop by adopting the values of the active power evaluated in the input and mechanical sections and adopting the direct method. Therefore, the following efficiency arrays are defined and measured:
- PDS efficiency evaluated with the Fluke probe ηPDS-probe;
- PDS efficiency evaluated with the Fluke shunt resistor ηPDS-shunt;
In order to evaluate the average value, the VI standard Deviation and Variance are employed in the software. The sampling frequency values fs and the acquisition time TM adopted for the two DAQ Assistants are equal to 50 kHz and 60 s, respectively, satisfactory for the requirements of the PDS input section and the prescription of the standards [21,22].
In order to obtain a synchronous sampling between the measurement sections, the same measurement time was chosen.
Finally, the overall observation time Tw has been set equal to 40 min, which allows the repeatability of the measurements.
5.2. Results and Discussions
As suggested by the IEC 61800-9-2 standard, the IPMSM working points taken into consideration for the efficiency measurement, corresponding to different conditions of load and speed, are reported in Table 8.
Table 8.
IPMSM Working Points.
By defining Tn and ωn as the rated IPMSM torque and speed values and according to Table 8, an additional point (no.7), which is not suggested by the standard, is included within the sets of measurement.
Concerning the ωm = 0, the standard defines this speed as a sufficiently low-speed corresponding to a supply frequency of the motor lower than 12 Hz. In this investigation, the low speed is equal to 200 rpm.
Moreover, in order to simulate the behavior of two different control algorithms, for each working point, the measurements are taken at two different values of the direct axis current Id, equal to −1 A and 0 A, which have been set by means of the FOC strategy.
As already mentioned, 40 measurement samples were acquired for each of the quantities of interest previously defined. Each measurement sample presents a duration of 60 s and the overall observation window is equal to 40 min. In such a way, the related arrays of voltage and currents, in terms of rms and mean values of torque and speed, are created. For instance, the mean values for the first working point are reported in Table 9.
Table 9.
Average values at the first working point for different Id values.
Furthermore, with regard to the repeatability of the measurement and the evaluation of the uncertainty, it is needed to evaluate the standard deviation for each quantity of interest. For instance, the average values of the standard deviation for the first working point are reported in Table 10.
Table 10.
Standard deviations at the first working point for different Id values.
As reference examples, Figure 5 and Figure 6 show the average values of the PDS input active power and the output mechanical power as a function of mechanical speed nm [rpm] for Id = −1 A.
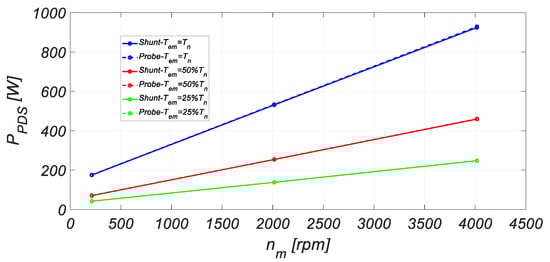
Figure 5.
PDS input active power measured with the shunt resistor and fluke current probe at Id = −1 A.
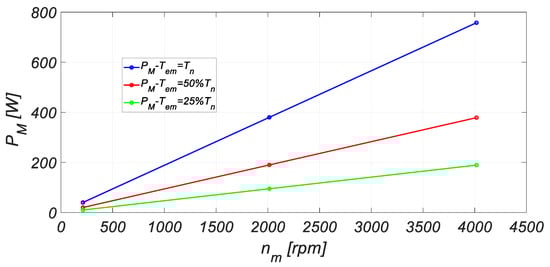
Figure 6.
Mechanical power measured at Id = −1 A.
From the acquired values of active power, it is possible to determine both the power losses and the efficiency of the entire PDS under test. For instance, Table 11 reports the efficiency detected for each working point at Id = −1A.
Table 11.
Efficiency detected for each working point at Id = −1 A.
It can be noticed that the highest efficiency values are detected for the load torque condition Tem = 50% Tn. Moreover, for the speed condition ωm = 0, the PDS efficiency obtained at Tem = 25% Tn is higher than the one obtained at Tem = 50% Tn. However, for speed conditions ωm ≥ 50% ωn, the PDS efficiency obtained at Tem = 25% Tn is lower than the one obtained at Tem = 50% Tn. In any case, for all the proposed working points, the PDS efficiency values measured with the shunt resistor (continuous lines) are higher than those measured with the Fluke current probe (dot lines). These results highlight a not negligible difference between the efficiencies measured with the two measurement system. Similar behavior has been detected for Id = 0 A.
The PDS efficiency uncertainty is affected by errors on power measurement both in the input single-phase section than in the output mechanical section. Regarding the PDS input single-phase section, the two current transducers adopted in this work present different accuracy. In particular, the uncertainty regarding the active power measurement in the single-phase sector with the shunt resistance has been already computed in [33], which is equal to 0.05%, corresponding to an extended uncertainty equal to 0.13% with a 99% of confidence level. With regards to the power measurement with the probe, the uncertainty is relatively high, due to an error equal to 2% ± 0.06 A and its angle error is not known. An appropriate angle error value is obtained by comparing the average specifications of the current probe transducer with those of the same precision class, reaching, therefore, the value of 0.03 rad. The expanded uncertainty on the measurement of PDS input single-phase power by Fluke current probe is equal to 9.3% (99% confidence interval).
The mechanical power measurement is mainly affected by the error introduced by the dynamometer, while the one introduced by the NI 9215 is negligible. From the data provided by the dynamometer datasheet, the expanded uncertainty on the measurement of mechanical power is equal to 0.17% with a confidence interval of 99%.
The mechanical power can also be measured by directly reading on the dynamometer interface. In this case, the related error is obtained from the datasheet of the used brake, equal to 0.01% for the speed and to 0.5% for the torque. The expanded uncertainty on the measurement of mechanical power with this second method is equal to 0.74% with a confidence interval of 99%.
Finally, the uncertainty concerning the efficiency measurement with the first system (shunt resistance and acquisition of torque and speed) is equal to 0.21% with a confidence interval of 99%, whereas the second system (Fluke current probe and acquisition of torque and speed) is characterized by an uncertainty equal to 9.4% with a confidence interval of 99%. The uncertainties considerations are valid for each case of study (Id = −1 A, Id = 0 A).
The PDS efficiency measurement performed with the first measurement system complies with the IEC61800-9 uncertainty prescriptions and, therefore, can be used for the PDS energy classification. On the contrary, the second measurement system is not suitable for the PDS energy classification. This fact underlines the need for high accuracy and high-cost instrumentation for the efficiency measurement of electric drives.
6. Experimental Validation of the Proposed Measurement Methodology
The purpose of this Section is the experimental validation of the methodology of measurement described in Section 3 by means of the experimental results carried out from the measurements discussed in Section 4. More specifically, a variation of the Id current is applied to the FOC system, determining a variation of the power losses ΔΔP involved in the PDS. This variation is measured by means of the two measurement systems reported in Section 3 (shunt resistor and current probe) and the related values are compared.
Thus, in order to evaluate the power losses variations due to a variation of the magnetizing current (Id = 0 A and Id = −1 A) in the FOC system, the ΔΔPPDS,shunt and ΔΔPPDS,probe indexes are computed for each IPMSM working condition. These values are obtained by processing the data from the PDS input power array acquired with the Fluke shunt resistor, PPDS,shunt, the PDS input power array acquired with the current probe, PPDS,probe, and the PDS output mechanical power array, namely PM. More in detail, the PDS power losses evaluated with the first measurement system ΔPPDS,shunt and with the second measurement system ΔPPDS,probe are calculated by adopting the following relationships, respectively:
Therefore, the measurement of power losses with Id = 0 A and with Id = −1 A has been carried out, and, consequently, the power losses variations have been determined with the first measurement system (ΔΔPPDS,shunt) and with the second measurement system (ΔΔPPDS,probe).
Figure 7 depicts the values of ΔΔPPDS measured with two measurement systems (dot and continuous lines) as a function of the reference speed nm [rpm] for each working condition. The mean values of both ΔΔPPDS,shunt and ΔΔPPDS,probe are evaluated among an observation time Tw equal to 40 min. It can be noticed that the highest ΔΔP, corresponding to the maximum power saving, is provided for Tem = Tn. Furthermore, for each working condition, the trends detected with the two methods are almost comparable between each other, demonstrating that the proposed methodology of measurement can provide the same results even with low-accuracy instrumentation.
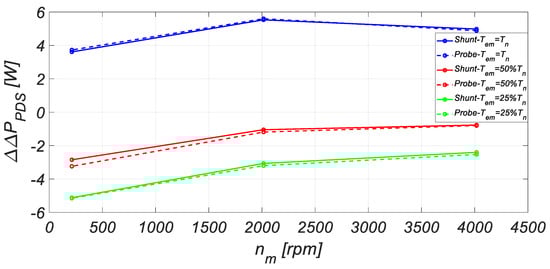
Figure 7.
ΔΔPPDS as a function of the reference speed for a variation of d-axis current from Id = 0 A to Id = −1 A and for each of the proposed working condition.
Further analysis has been focused on the computation of the percentage values ΔΔPPDS% of the quantities ΔΔPPDS,shunt and ΔΔPPDS,probe with respect to the IPMSM rated mechanical power PM,r:
Figure 8 shows the mean values of ΔΔPPDS,shunt% and ΔΔPPDS,probe% evaluated through the overall observation time Tw of 40 min.
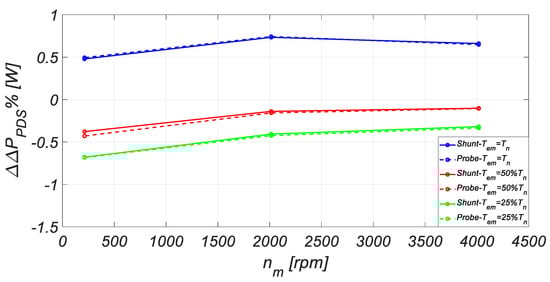
Figure 8.
ΔΔPPDS% as a function of the reference speed for a variation of the d-axis current from Id = 0 A to Id = −1 A and for each of the proposed working condition.
As well as for the previous case, it can be observed that ΔΔPPDS,shunt% and ΔΔPPDS,probe% have almost coincident values. Furthermore, the differences between the ΔΔPPDS,shunt and ΔΔPPDS,probe values and between the ΔΔPPDS,shunt% and ΔΔPPDS,probe% are determined by means of the following relationships:
Table 12 summarizes the numerical results of the previously reported differences. It can be observed that the highest percentage difference between the results provided by the two methods is limited to 0.04%, demonstrating that the ΔΔP index, which was introduced as a valuable parameter in order to compare the performances of the same electric drive under test controlled with different control algorithms, is not affected by uncertainties due to systematic errors. Therefore, the determination of this index can be carried out by adopting sensors, instrumentation and acquisition boards with low accuracy, avoiding the need for high-cost and high-accuracy tools.
Table 12.
Numerical results of the differences between the ΔΔPPDS and ΔΔPPDS%.
Further investigation has been carried out on the ΔΔPPDS measurement uncertainty. More in detail, the uncertainty includes only the uncertainty due to random errors, which is equal to the ΔΔPPDS standard deviation computed with respect to the overall observation time Tw equal to 40 min. This analysis is carried out by considering the expanded uncertainty with a confidence interval of 99%, which can be obtained by multiplying the standard deviation by 2.58. The expanded uncertainty of ΔΔPPDS with a confidence interval of 99%, evaluated with the shunt resistor ushunt(ΔΔPPDS) and evaluated with the Fluke current probe uprobe(ΔΔPPDS) for each motor working condition are reported in Table 13.
Table 13.
ΔΔPPDS uncertainty for each working condition and for case 1.
The detected value of expanded uncertainty of ΔΔPPDS leads to state that the difference between the possible ΔΔPPDS values evaluated with the two measurement systems is quite limited, demonstrating the validity of the proposed measurement procedure.
7. Conclusions
In this paper, an accurate measurement procedure for the control algorithm’s impact on the electrical drive’s efficiency has been addressed and discussed. For this purpose, an extended experimental investigation has been carried out on an IPMSM electric drive with the use of two different measurement equipment that presents different accuracy and, consequently, different costs. In order to validate the proposed measurement methodology, the behaviors of two different control algorithms have been simulated by changing the magnetization level of the IPMSM under test. This methodology allows estimating the power losses variations ΔΔP, which represents a valuable index for the comparison between different PDS control algorithms. A first analysis of the experimental results has shown that a highly accurate and expensive measurement system is needed for the PDS classification according to the standard IEC-61800. However, further analysis of the ΔΔP uncertainty has been carried out. This analysis has shown that the ΔΔPPDS values are coincident for both systems, demonstrating that the ΔΔP parameter results as a valuable index for the characterization of the control system since it can be measured even with low-precision and cheap measurement system.
Author Contributions
Conceptualization, C.N. and C.S.; methodology, C.S.; software, A.O.D.T. and C.N.; validation, G.L., C.N. and C.S.; formal analysis, C.N.; investigation, G.L. and C.N.; resources, R.M. and C.S.; data curation, C.N. and C.S.; writing—original draft preparation, M.C. and C.N.; writing—review and editing, M.C. and R.M.; visualization, M.C., C.N. and R.M.; supervision, A.O.D.T., R.A.M., R.M., C.S. and M.T.; project administration, R.A.M., R.M. and M.T. All authors have read and agreed to the published version of the manuscript.
Funding
This research received no external funding.
Acknowledgments
This work was financially supported by PON R&I 2015–2020 “Propulsione e Sistemi Ibridi per velivoli ad ala fissa e rotante—PROSIB”, CUP no:B66C18000290005, by H2020-ECSEL-2017-1-IA-two-stage “first and european sic eightinches pilot line-REACTION”, by Prin 2017—Settore/Ambito di intervento: PE7 linea C—Advanced power-trains and -systems for full electric aircrafts, by PON R&I 2014-2020—AIM (Attraction and International Mobility), project AIM1851228-1 and by ARS01_00459-PRJ-0052 ADAS+ “Sviluppo di tecnologie e sistemi avanzati per la sicurezza dell’auto mediante piattaforme ADAS”.
Conflicts of Interest
The authors declare no conflict of interest.
References
- Ferreira, F.J.T.E.; De Almeida, A.T. Overview on energy saving opportunities in electric motor driven systems—Part 1: System efficiency improvement. In Proceedings of the 2016 IEEE/IAS 52nd Industrial and Commercial Power Systems Technical Conference (I&CPS), Detroit, MI, USA, 1–5 May 2016; pp. 1–8. [Google Scholar]
- Ferreira, F.J.T.E.; De Almeida, A.T. Overview on energy saving opportunities in electric motor driven systems—Part 2: Regeneration and output power reduction. In Proceedings of the 2016 IEEE/IAS 52nd Industrial and Commercial Power Systems Technical Conference (I&CPS), Detroit, MI, USA, 1–5 May 2016; pp. 1–8. [Google Scholar]
- Torrent, M.; Perat, J.I.; Jiménez, J.A. Permanent Magnet Synchronous Motor with Different Rotor Structures for Traction Motor in High Speed Trains. Energies 2018, 11, 1549. [Google Scholar] [CrossRef]
- Łebkowski, A. Design, Analysis of the Location and Materials of Neodymium Magnets on the Torque and Power of In-Wheel External Rotor PMSM for Electric Vehicles. Energies 2018, 11, 2293. [Google Scholar] [CrossRef]
- Kutt, F.; Michna, M.; Kostro, G. Non-Salient Brushless Synchronous Generator Main Exciter Design for More Electric Aircraft. Energies 2020, 13, 2696. [Google Scholar] [CrossRef]
- Zhao, T.; Wu, S.; Cui, S. Multiphase PMSM with Asymmetric Windings for More Electric Aircraft. IEEE Trans. Transp. Electrif. 2020, 6, 1592–1602. [Google Scholar] [CrossRef]
- Hansen, J.F.; Wendt, F. History and State of the Art in Commercial Electric Ship Propulsion, Integrated Power Systems, and Future Trends. Proc. IEEE 2015, 103, 2229–2242. [Google Scholar] [CrossRef]
- Kasha, A.; Lin, R.; Sudhoff, S.; Chalfant, J.; Alsawalhi, J. A comparison of permanent magnet machine topologies for marine propulsion applications. In Proceedings of the 2017 IEEE Electric Ship Technologies Symposium (ESTS), Arlington, VA, USA, 14–17 August 2017; pp. 437–444. [Google Scholar] [CrossRef]
- Ye, M.; Shi, T.; Wang, H.; Li, X.; Xia, C. Sensorless-MTPA Control of Permanent Magnet Synchronous Motor Based on an Adaptive Sliding Mode Observer. Energies 2019, 12, 3773. [Google Scholar] [CrossRef]
- Sun, J.; Lin, C.; Xing, J.; Jiang, X. Online MTPA Trajectory Tracking of IPMSM Based on a Novel Torque Control Strategy. Energies 2019, 12, 3261. [Google Scholar] [CrossRef]
- Caruso, M.; Di Tommaso, A.O.; Miceli, R.; Nevoloso, C.; Spataro, C.; Trapanese, M. Maximum Torque Per Ampere Control Strategy for Low-Saliency Ratio IPMSMs. Int. J. Renew. Energy Res. 2019, 9, 374–383. [Google Scholar]
- Cavallaro, C.; Di Tommaso, A.; Miceli, R.; Raciti, A.; Galluzzo, G.R.; Trapanese, M. Analysis a DSP implementation and experimental validation of a loss minimization algorithm applied to permanent magnet synchronous motor drives. In Proceedings of the IECON’03. 29th Annual Conference of the IEEE Industrial Electronics Society (IEEE Cat. No.03CH37468), Roanoke, VA, USA, 2–6 November 2003; Volume 1, pp. 312–317. [Google Scholar]
- Caruso, M.; Di Tommaso, A.O.; Genduso, F.; Miceli, R. Experimental investigation on high efficiency real-time control algorithms for IPMSMs. In Proceedings of the 2014 International Conference on Renewable Energy Research and Application (ICRERA), Milwaukee, WI, USA, 19–22 October 2014; pp. 974–979. [Google Scholar]
- Caruso, M.; Di Tommaso, A.O.; Miceli, R.; Nevoloso, C.; Spataro, C.; Viola, F. Characterization of the parameters of interior permanent magnet synchronous motors for a loss model algorithm. Measurement 2017, 106, 196–202. [Google Scholar] [CrossRef]
- Antonello, R.; Tinazzi, F.; Zigliotto, M. Energy efficiency measurements in IM: The non-trivial application of the norm IEC 60034-2-3:2013. In Proceedings of the 2015 IEEE Workshop on Electrical Machines Design, Control and Diagnosis (WEMDCD), Torino, Italy, 26–27 March 2015; pp. 248–253. [Google Scholar]
- Agamloh, E.B. Power and efficiency measurement of motor-variable frequency drive systems. In Proceedings of the 2015 61st IEEE Pulp and Paper Industry Conference (PPIC), Milwaukee, WI, USA, 14–18 June 2015; pp. 1–8. [Google Scholar]
- Stockman, K.; Dereyne, S.; Vanhooydonck, D.; Symens, W.; Lemmens, J.; Deprez, W. Iso efficiency contour measurement results for variable speed drives. In Proceedings of the The XIX International Conference on Electrical Machines—ICEM 2010, Rome, Italy, 6–8 September 2010; pp. 1–6. [Google Scholar]
- Rotating Electrical Machines—Part 2-1: Standard Methods for Determining Losses and Efficiency from Test. IEC 60034-2-1. Available online: https://webstore.iec.ch/publication/121 (accessed on 1 September 2020).
- Rotating Electrical Machines—Part 2-2: Specific methods for Determining Separate Losses of Large Machines from Tests—Supplement to IEC 60034-2-1. IEC 60034-2-2. Available online: https://webstore.iec.ch/publication/122 (accessed on 1 September 2020).
- Rotating Electrical Machines—Part 2-3: Specific Test Methods for Determining Losses and Efficiency of Converter-Fed AC Motors. IEC 60034-2-3. Available online: https://webstore.iec.ch/publication/30919 (accessed on 1 September 2020).
- Adjustable Speed Electrical Power Drive Systems—Part 9-1: Ecodesign for Power Drive Systems, Motor Starters, Power Electronics and Their Driven Applications—General Requirements for Setting Energy Efficiency Standards for Power Driven Equipment Using the extended Product Approach (EPA) and Semi Analytic Model (SAM). IEC 61800-9-1. Available online: https://www.iec.ch/dyn/www/f?p=103:38:4308635742220::::FSP_ORG_ID,FSP_APEX_PAGE,FSP_PROJECT_ID:1416,21,22026 (accessed on 1 September 2020).
- Adjustable Speed Electrical Power Drive Systems—Part 9-2: Ecodesign for Power Drive Systems, Motor Starters, Power Electronics & Their Driven Applications—Energy Efficiency Indicators for Power Drive Systems and Motor Starters. IEC 61800-9-2. Available online: https://webstore.iec.ch/publication/31527 (accessed on 1 September 2020).
- Bucci, G.; Ciancetta, F.; Fiorucci, E.; Ometto, A. Uncertainty Issues in Direct and Indirect Efficiency Determination for Three-Phase Induction Motors: Remarks about the IEC 60034-2-1 Standard. IEEE Trans. Instrum. Meas. 2016, 65, 2701–2716. [Google Scholar] [CrossRef]
- IEEE Trial-Use Guide for Testing Permanent Magnet Machines. IEEE Std 1812-2014, 2015; pp. 1–56. Available online: https://ieeexplore.ieee.org/document/7047988 (accessed on 1 September 2020).
- Deusinger, B.; Lehr, M.; Binder, A. Determination of efficiency of permanent magnet synchronous machines from summation of losses. In Proceedings of the 2014 International Symposium on Power Electronics, Electrical Drives, Automation and Motion, Ischia, Italy, 18–20 June 2014; pp. 619–624. [Google Scholar]
- Lateb, R.; Da Silva, J. Indirect testing to determine losses of high speed synchronous permanent magnets motors. In Proceedings of the 2014 17th International Conference on Electrical Machines and Systems (ICEMS), Hangzhou, China, 22–25 October 2014; pp. 1520–1526. [Google Scholar]
- Aarniovuori, L.; Kolehmainen, J.; Kosonen, A.; Niemela, M.; Pyrhonen, J. Uncertainty in motor efficiency measurements. In Proceedings of the 2014 International Conference on Electrical Machines (ICEM), Berlin, Germany, 2–5 September 2014; pp. 323–329. [Google Scholar]
- Yogal, N.; Lehrmann, C.; Henke, M. Determination of the Measurement Uncertainty of Direct and Indirect Efficiency Measurement Methods in Permanent Magnet Synchronous Machines. In Proceedings of the 2018 XIII International Conference on Electrical Machines (ICEM), Alexandroupoli, Greece, 3–6 September 2018; pp. 1149–1156. [Google Scholar]
- Dambrauskas, K.; Vanagas, J.; Zimnickas, T.; Kalvaitis, A.; Ažubalis, M. A Method for Efficiency Determination of Permanent Magnet Synchronous Motor. Energies 2020, 13, 1004. [Google Scholar] [CrossRef]
- Mademlis, C.; Margaris, N. Loss minimization in vector-controlled interior permanent-magnet synchronous motor drives. IEEE Trans. Ind. Electron. 2002, 49, 1344–1347. [Google Scholar] [CrossRef]
- Uddin, M.N.; Zou, H.; Azevedo, F. Online Loss-Minimization-Based Adaptive Flux Observer for Direct Torque and Flux Control of PMSM Drive. IEEE Trans. Ind. Appl. 2015, 52, 425–431. [Google Scholar] [CrossRef]
- Hoang, K.D.; Aorith, H.K.A. Online Control of IPMSM Drives for Traction Applications Considering Machine Parameter and Inverter Nonlinearities. IEEE Trans. Transp. Electrif. 2015, 1, 312–325. [Google Scholar] [CrossRef]
- Cataliotti, A.; Cosentino, V.; Di Cara, D.; Lipari, A.; Nuccio, S.; Spataro, C. A PC-Based Wattmeter for Accurate Measurements in Sinusoidal and Distorted Conditions: Setup and Experimental Characterization. IEEE Trans. Instrum. Meas. 2011, 61, 1426–1434. [Google Scholar] [CrossRef]


Publisher’s Note: MDPI stays neutral with regard to jurisdictional claims in published maps and institutional affiliations. |
© 2020 by the authors. Licensee MDPI, Basel, Switzerland. This article is an open access article distributed under the terms and conditions of the Creative Commons Attribution (CC BY) license (http://creativecommons.org/licenses/by/4.0/).