Article

Cation-Exchange Capacity Distribution within Hydrothermal Systems and Its Relation to the Alteration Mineralogy and Electrical Resistivity

by
Tobias Björn Weisenberger
*,
Heimir Ingimarsson
,
Gylfi Páll Hersir
and
Ólafur G. Flóvenz
ÍSOR, Iceland GeoSurvey, Grensásvegur 9, 108 Reykjavík, Iceland
*
Author to whom correspondence should be addressed.
Energies 2020, 13(21), 5730; https://doi.org/10.3390/en13215730
Submission received: 13 October 2020 / Revised: 22 October 2020 / Accepted: 29 October 2020 / Published: 2 November 2020
(This article belongs to the Special Issue Geothermal Energy Utilization and Renewable-Energy Storage)

Abstract

:
Cation-exchange capacity (CEC) measurements are widely used to quantify the smectite content in altered rocks. Within this study, we measure the CEC of drill cuttings in four wells from three different high-temperature geothermal areas in Iceland. The CEC measurements in all four wells show similar depth/temperature related pattern, and when comparing the CEC with electrical resistivity logs, we could show that the low resistivity zone coincides with CEC values >5 meq/100 g. The measurements show, in general, an exponential decrease of the CEC with increasing depth. At the facies boundary between the mixed-layer clay and epidote-chlorite zone, the CEC reaches a steady state at about 5 meq/100 g and below that it only decreases slightly within a linear trend with increasing depth. The facies boundary overlaps with the transition where the electrical resistivity logs show an increase in resistivity. It is shown that the measured CEC can be related to the clay mineral alteration within the geothermal system and the CEC reflects the smectite component within the interstratified chlorite/smectite minerals for similar alteration degree. Furthermore, CEC was measured in seven core samples from different alteration zones that had previously been studied in detail with respect to petrophysical and conductivity properties. The results show a clear correlation between CEC and the iso-electrical point, which describes the value of the pore fluid conductivity where transition from surface conductivity to pore fluid conductivity occurs. The presented study shows that the CEC within hydrothermal altered basaltic systems mimics the expandable clay mineral alteration zones and coincides with electrical logs. The presented method can, therefore, be an easy tool to quantify alteration facies within geothermal exploration and drilling projects.

Graphical Abstract

1. Introduction

Resistivity models based on TEM (transient electromagnetic) and MT (magnetotelluric) data are widely used in geothermal exploration for conceptual modeling and to select sites for exploration drilling. Árnason et al. [1,2] showed that the resistivity model within the Nesjavellir high-temperature geothermal field in southwest Iceland mimics the dominant alteration mineralogy in the subsurface. Thereby, the observed boundary between the low-resistivity cap and the underlying high-resistivity core in high-temperature systems in basaltic environment can be related to changes in the secondary mineral inventory having different cation-exchange capacity (CEC), i.e., from smectite-dominated cap rock to the chlorite-dominated core [1,2,3,4].
Phyllosilicates like celadonite, chlorite, smectite and interstratified chlorite/smectite layers are commonly reported as alteration products from sub-greenschist facies of mafic rocks e.g., [5,6,7]. Their mineralogy and chemical composition can also be used as an indicator of the thermobarometric evolution of oceanic crust [6]. Observations from active geothermal systems [8], modern oceanic crust [9] and fossil geothermal systems in ophiolites [10] show that the smectite-chlorite transition is strongly temperature-dependent.
Alteration minerals with a high CEC, in particular smectitic clay minerals, favor the conduction of an electrical current between the pore fluid and the pore walls in the rock c.f. [4,11]. The interface or surface conduction is caused by the highly mobile ions that form a conductive layer on the surface of the pore walls [12,13,14]. The mobility of ions is thereby related to the CEC of the mineral phase c.f. [4]. The higher the CEC of the clay mineral, the higher is the interface conduction. Nevertheless, electrical conductivity can also be affected by other parameters: (i) degree of fluid saturation, (ii) conductivity of the rock matrix, (iii) salinity of the pore fluid, (iv) water–rock interaction and alteration mineral assemblage, (v) temperature, (vi) porosity and pore structure of the rock and (vii) type of pore fluid like the content of water, steam and gas [4].
The aim of this study is the validation of the influence of cation-exchange capacity on resistivity logs within hydrothermal systems. Four wells from three geothermal fields in Iceland (Figure 1) were selected to compare the resistivity logs with measured CEC values. To study further the effect of surface conduction by cation-exchange capacity, seven core samples from different alteration facies within different geothermal systems in Iceland were measured to quantify the CEC. The selected samples have been studied previously with respect to their petrophysical parameters, the effect of the electrical interface conduction and the relation to the fluid conduction/salinity [15,16].

2. Regional Setting

2.1. Krafla Geothermal System

The Krafla geothermal field is associated with the Krafla central volcano that is located within the neo-volcanic North Volcanic Zone (Figure 1). The volcano is approximately 20 km in diameter. The Krafla geothermal field is located in an eroded, collapsed and partly filled caldera 8 × 10 km in diameter. An NNE–SSW oriented and 90 km long fissure swarm that marks the North Iceland Rift Zone bisects the caldera. Within the caldera, a prominent NW–SE elongated geothermal area is present, covering approximately 10 km2 [18,19]. The Krafla volcano is an active volcano with recurring volcanic episodes, which in the Holocene predominantly have been in the form of fissure eruptions. The volcanic activity has been centered in the eastern part of the fissure swarm during the past 3000 years, occurring with a frequency of 300–1000 years [18]. The caldera is largely filled by basaltic lavas and hyaloclastites. Rhyolites have erupted periodically in minor volumes, forming subglacial rhyolitic ridges that are found mainly at or outside the margins of the caldera. Intermediate composition lavas are not abundant [18,20].
Volcanic activity and events affect the geothermal system renewing the heat supply, whereas the non-saline fluids are meteoric in origin [21]. However, volcanic events can also cause temporary deterioration of the fluid source with excessive volcanic gas influx, as was experienced in part of the Krafla geothermal field during the Krafla Fires 1975–1984 [22,23].
In this study, well KJ-18 was selected from the Krafla high-temperature geothermal field in NE-Iceland. The vertical well was drilled in 1981 to a total depth of 2215 m and is part of the Sudurhlídar subfield within the Krafla geothermal field [24]. The lithostratigraphy and alteration profile was refined in Weisenberger et al. [24] based on an unpublished drilling report [25]. Blischke et al. [26] reviewed wireline and televiewer log data from well KJ-18, generating an electronic facies log. Several resistivity logs were carried out in well KJ-18 in 2014, including resistivity time series during the heating-up of the well after being cooled down to allow VSP (vertical seismic profiling) experiment in the well [27]. The raw data of the resistivity logs for the 2014 logging campaign have been corrected in depth, well width and the conductivity of the well fluid [27]. A comprehensive compilation of well KJ-18, including cutting analysis and downhole logging results, are presented in Millet et al. [28].

2.2. Hellisheidi Geothermal System

The Hellisheidi geothermal field (Figure 1), a part of the Hengill central volcano, is located on a triple junction between the volcanic zones of Reykjanes Peninsula, Western Volcanic Zone and South Iceland Seismic Zone. The Hellisheidi geothermal field is dominated by basaltic lava flows and glassy hyaloclastites, fissure swarms, grabens and geothermal systems e.g., [29,30,31,32,33]. The rocks within the Hengill central volcano range in age from >400,000 to 0 AD [34,35]. High-temperature geothermal systems are located both north (Nesjavellir geothermal system) and south (e.g., Hellisheidi geothermal field) of the Hengill central volcano and are driven by meteoric fluids that are derived from local precipitates [23].
Cuttings from two wells, HE-42 and HE-46, within the Hellisheidi geothermal system in the Hengill volcanic area were selected for this study. Well HE-46 was chosen as it exhibits a well-defined low resistivity cap [36] and a detailed petrographic and mineralogical study was carried out to refine the lithostratigraphy and alteration mineralogy [37]. HE-46 was directionally drilled in 2008 to a measured depth of 2744 m. Well HE-42 was completed in 2008 to a measured depth of 3322 m. It was selected as in contrast to well HE-46, the resistivity log within the low resistivity cap shows a large degree of variation. The stratigraphy and alteration of the well was refined [38]. Qualitative XRD clay mineral analysis of samples form HE-42 and HE-46 are presented in Table S1. The presented resistivity log data for HE-42 and HE-46 are corrected on the width of the well and the conductivity of the well fluid [36].

2.3. Reykjanes Geothermal System

The Reykjanes geothermal field is located at the tip of the Reykjanes Peninsula and within the Reykjanes fissure swarm, which is the sub-aerial extension of the Reykjanes Ridge (Figure 1). The Reykjanes geothermal field and its surroundings are mostly covered by sub-aerial basaltic lavas and to a lesser degree by hyaloclastites [39]. The hyaloclastites appear as ridges, rising from the surrounding rugged but relatively flat-lying lavas. These hyaloclastite hills date from the last glaciation. The basaltic lavas are postglacial whereas the youngest lavas are from the 13th century [39]. A study of the stratigraphy [40] shows a dominance of pillow basalt formations in the lower part (below about 1200 m below sea level) but changes gradually to a succession of tuffaceous volcanic formations of Surtseyan type above about 1000 m depth with intervening shallow water fossiliferous tuffaceous sediments, which are usually quite thin (<10 m thickness). These predominate to about 100 m depth where sub-aerial lavas top the sequence. Intrusions are commonly found in the succession below about 800 m depth. These are mostly fine- to medium-grained basaltic dikes [40]. An abundance assessment suggests they may reach up to 60% of the succession at deeper levels. They act both partly as heat source and permeability structures [41]. On the Reykjanes Peninsula, the basaltic lavas range in composition from picrite to tholeiite, although less than two percent are picrite [31]. Hydrothermal alteration shows a progressive intensity with depth from fresh rocks through zones characterized by smectite-zeolite, mixed-layer clay minerals, chlorite-epidote, epidote-amphibole to amphibole zone at the deepest level [41,42,43]. Temperature in the geothermal system follows mostly the boiling point curve down to about 1200 m depth below, where it becomes more water dominated. Highest temperatures found are around 340 °C at about 3 km depth.
At Reykjanes, the geothermal fluid originates from seawater and is chemically modified due to boiling and fluid/rock interaction [42,44,45,46,47].
Well RN-15 [48] was selected from the Reykjanes geothermal field. Well RN-15 was vertically drilled in 2004 to a depth of 2507 m. The well was deepened (RN-15/IDDP-2) in 2016 and 2017 as part of the Iceland Deep Drilling Project (IDDP) to a total measured depth of 4659 m and reached supercritical fluid conditions [49,50,51]. Resistivity data for RN-15 has been depth corrected [52].

3. Methods

Cation-exchange capacity is a characteristic physicochemical property of zeolites and clay minerals. In clay minerals, CEC is related to substitutions in the tetrahedral and/or octahedral sheet, which creates a charge deficit known as the layer charges and to adsorption at crystal edges [53]. A distinction is made between permanent and non-permanent charges. In detail, the charge that results from structural substitutions is known as permanent charge and the charge from interrupted bonds between the structural cations and the oxygen of the OH groups of the tetrahedral and the octahedral sheet is known as the non-permanent or pH-depended charge [53]. The layer charge is balanced by hydrated cations, like Na, Ca, K and Mg, which are exchangeable [53].
Clay minerals show a strong preference for organic cations such as methylene blue and organo-metal complexes that are used as index cations to determine the CEC. Due to the large size of the molecules, methods based on the adsorption of organo-metal complexes and methylene blue are not influenced by the presence of zeolites, as the large molecules cannot enter the cages and channels within the zeolite structural framework [53]. However, large molecules can exchange with cations at the crystal surface of zeolites. Although adsorption of methylene blue cations is routinely used for clay minerals, determination of CEC is problematic [54]. Bergaya and Vayer [55] developed the CEC determination of clay minerals by using [Cu(en)2]2+ (en = ethylenediamine). Meier and Kahr [56] proposed the use of [Cu(trien)3]2+ complexes (trien = triethylenetetramine) for determination of CEC. According to Bergaya et al. [57], the use of [Cu(en)2]2+ or [Cu(trien)3]2+ complexes is presently the most versatile method for determination of CEC of clay minerals. However, cobalt(III)hexamine may also be used [58,59].
For the CEC measurements, a representative aliquot of cuttings (4–5 g) from a particular depth was selected. The cuttings were washed to remove potential contamination of drilling mud and milled afterwards by using a ball mill to a fine-grained powder. The CEC measurements were conducted according to the method described by Meier and Kahr [56] by using 0.01 (0.0091–0.0101) M copper triethylenetetramine (Cu-trien). Powdered rock samples (200 mg) were weighed into 100 mL beakers that contained 50 mL of deionized water and 10 mL of 0.01 (0.0091–0.0101) M Cu-trien solution. After 3 min of reaction time, the suspension was centrifuged with a micro-centrifuge for 20 min at 2000 rounds per minute. The supernatant solution was carefully removed from the solid fraction and the remaining Cu-trien concentration of the supernatant was measured by using a spectrophotometer at a wavelength of 578 nm. The used wavelength of 578 nm is different from the 620 nm wavelength [56]. As shown in other studies e.g., [54,60,61,62], the adsorption maximum of the copper triethylenetetramine complex lies at 578 nm. Calibration of the photometer was carried out according to the calibration method described by Kaufhold [63], using four different Cu-trien solutions. The water content of the samples was determined by the weight loss obtained after heating the samples for 2–3 days at 105 °C. The CEC (meq/100 g) refers to the dry weight of the sample.
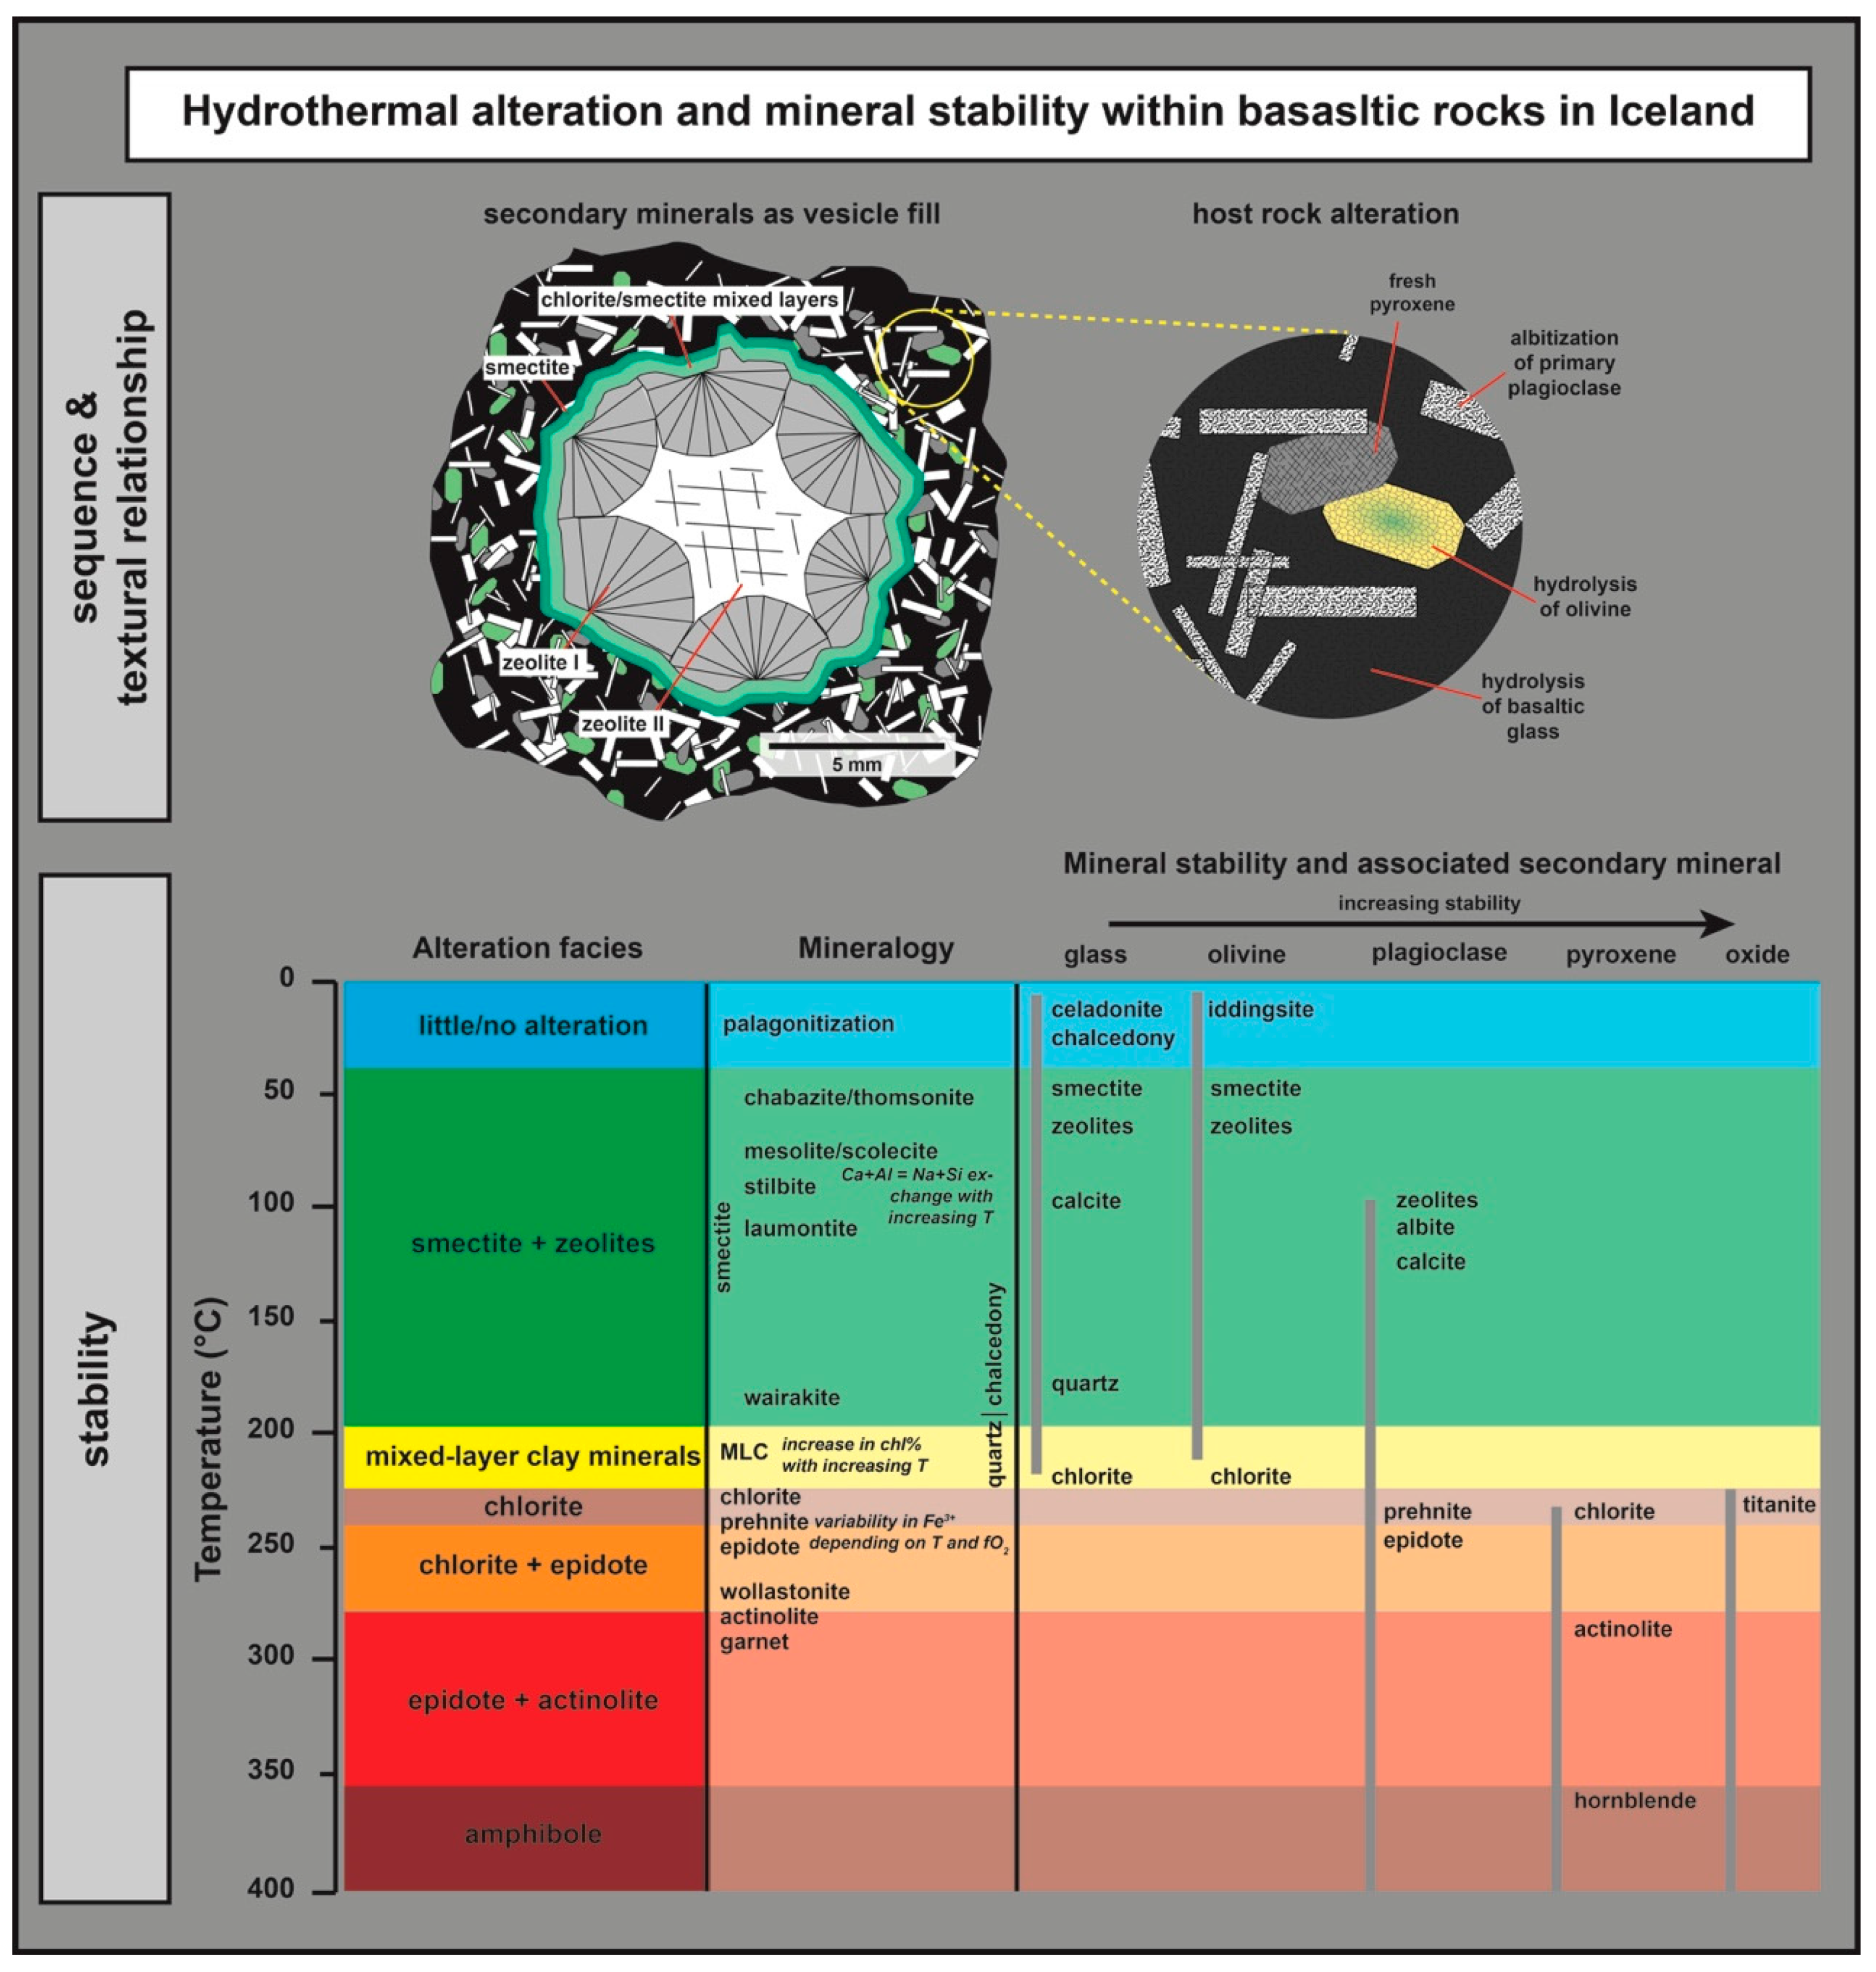
All four selected wells are located within a high-temperature geothermal system (Figure 1). The alteration mineralogy, in general, follows temperature-depended sequence within increasing depth and is schematically illustrated in Figure 2.
Samples in all wells were selected based on the resistivity logs and lithostratigraphic succession. In well KJ-18, a total of 88 samples covering the entire depth of the well were analyzed. In well HE-42 and HE-46, 12 and 27 samples were selected, respectively. The samples were primarily selected within the smectite, chlorite/smectite and chlorite dominated alteration zones. In well RN-15, 18 samples were selected primarily within the clay-cap dominated alteration zones as well as chlorite containing zone [48].
Additionally, CEC was measured in seven core samples that had been used previously for electrical conduction measurements [15]. A description of the core samples based on information from Flóvenz et al. [15] is given as supplementary material (Tables S2 and S3).

4. Results

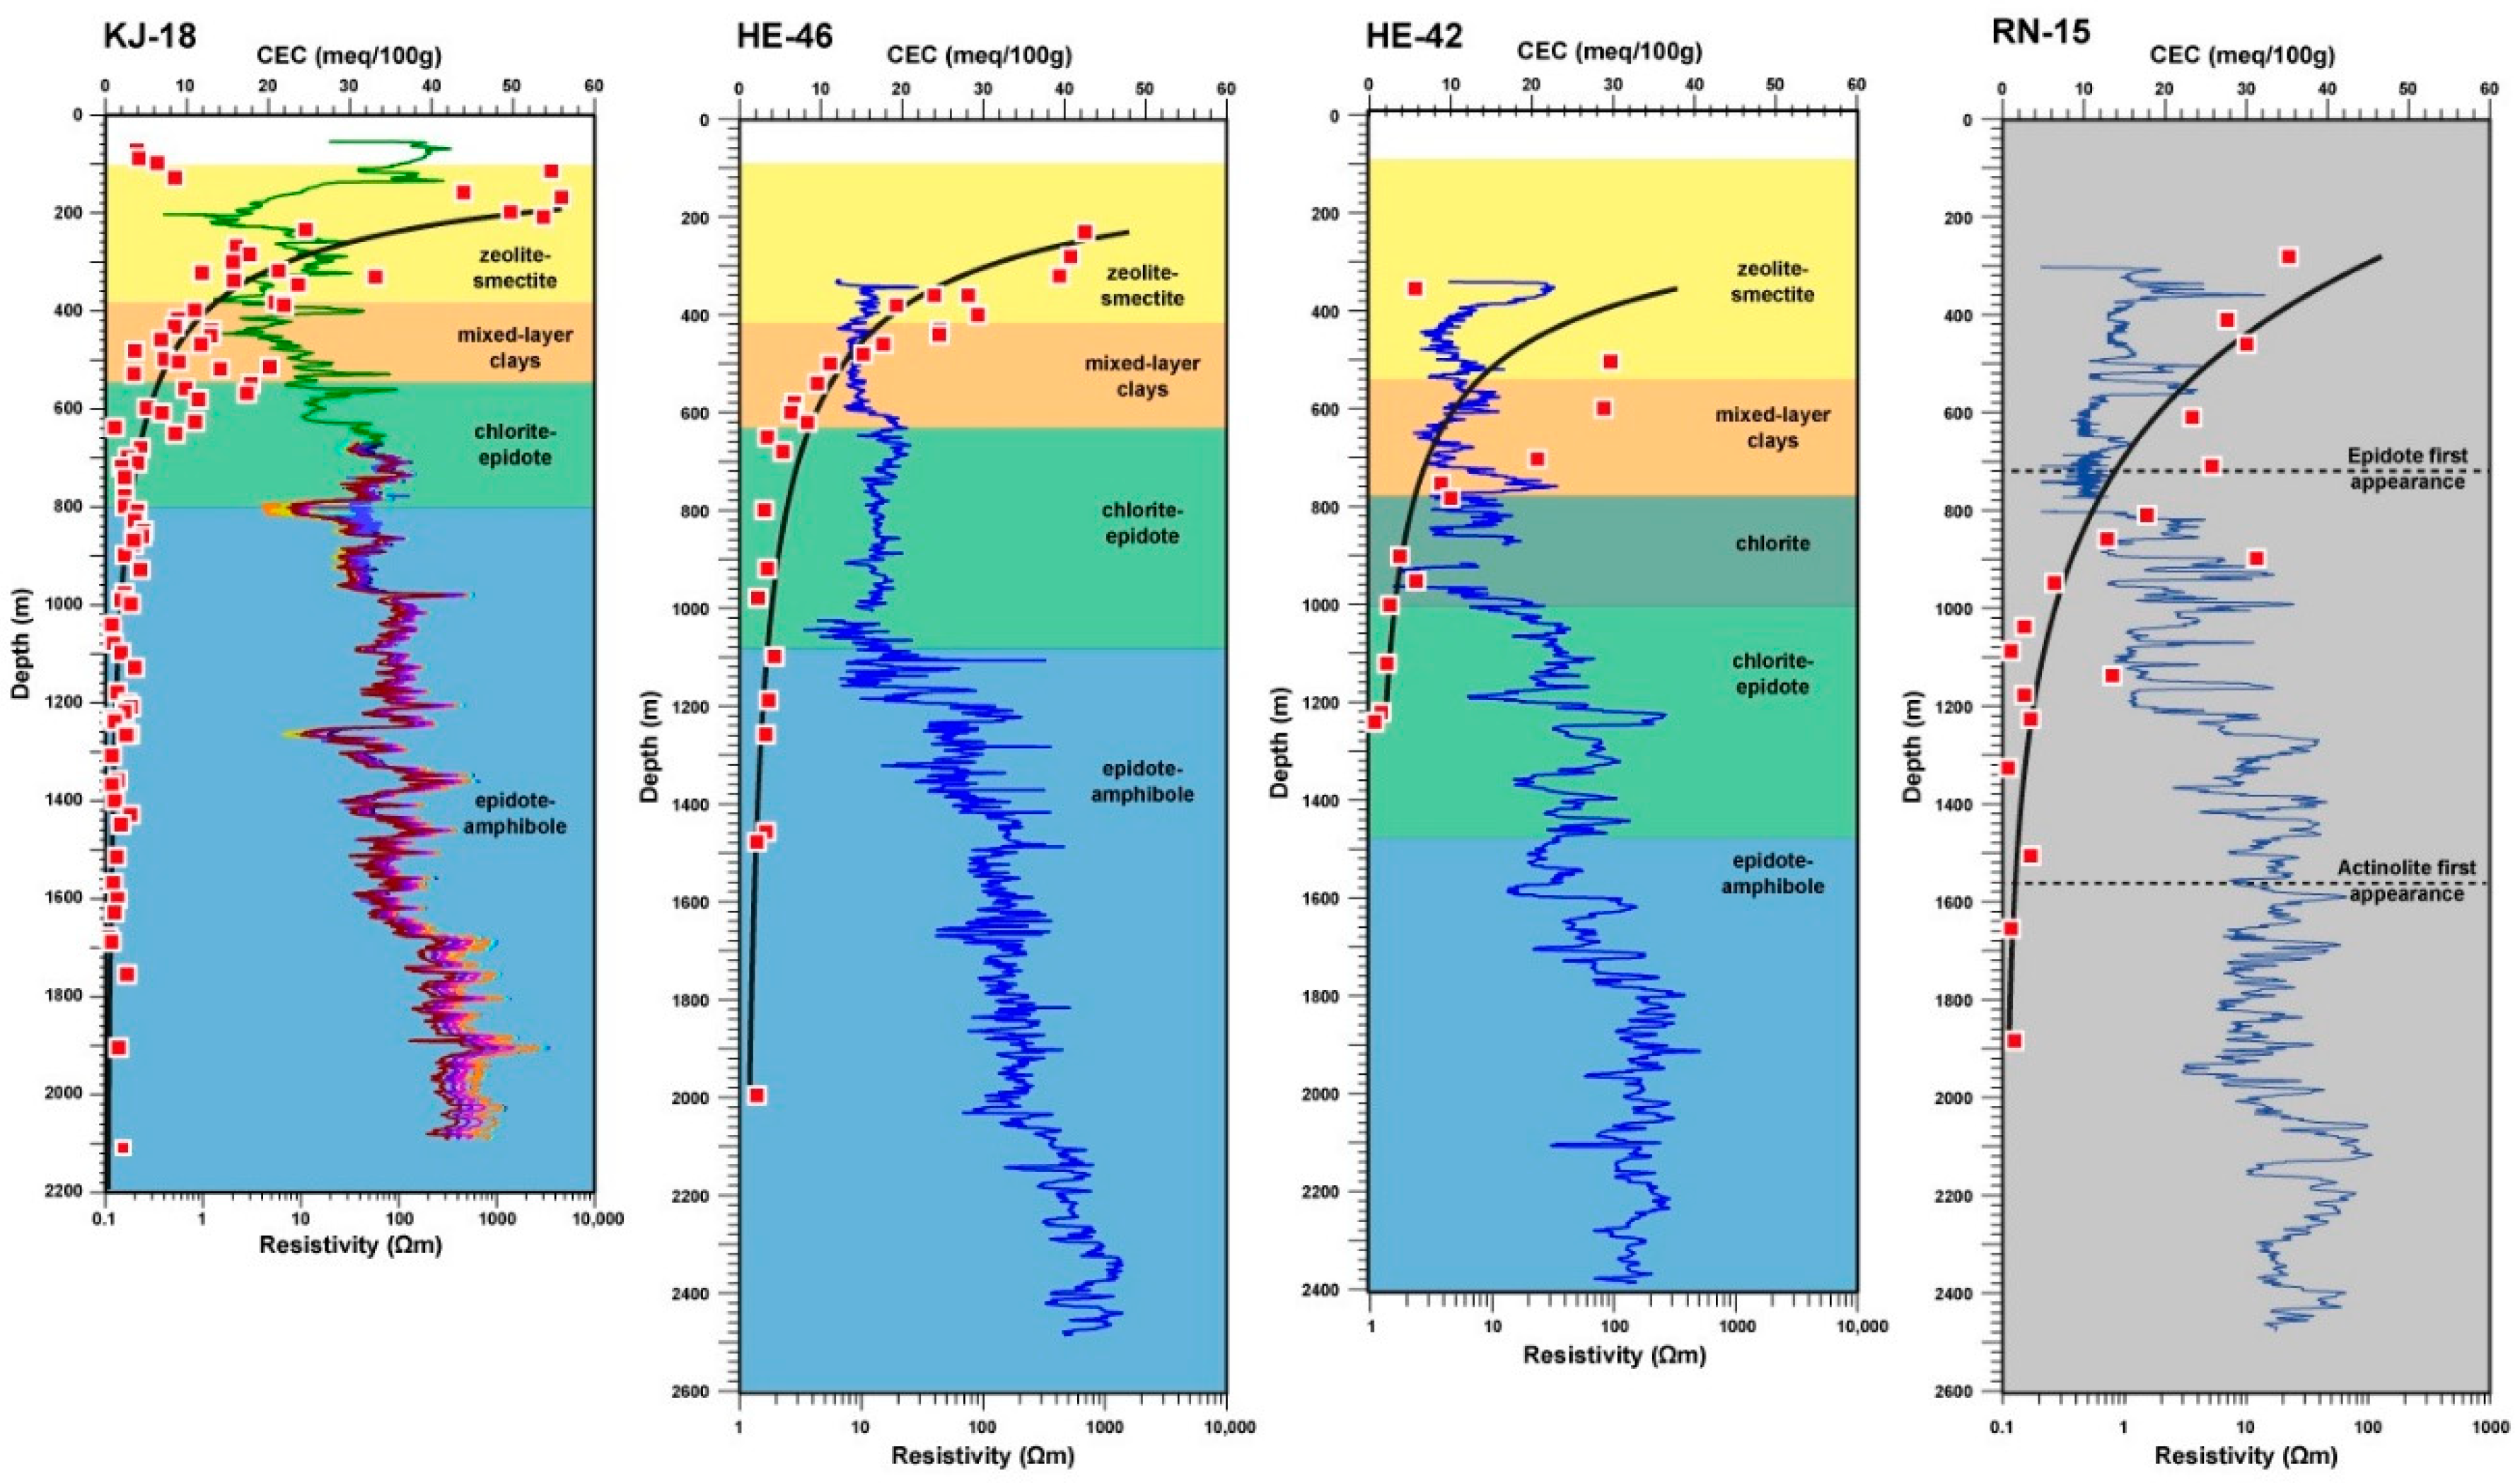
Results of the CEC measurements of wells, KJ-18, HE-42, HE-46 and RN-15 are presented as supplementary electronic material (Tables S4–S7). Graphic results of the CEC measurements are presented together with the electrical resistivity logs in Figure 3.
The electric resistivity logs are, in general, acquired during drilling while the well is cooled, and the temperature variation within the well during logging is, in general, within a small temperature interval.

4.1. KJ-18

The CEC measured in cutting samples from KJ-18 shows a general decreasing trend with increasing depth (Table S4, Figure 3) except within the uppermost section. The measured CEC values mimic the general trend of the electrical resistivity logs, which were carried out after drilling [25,28] and in a logging campaign performed in 2014 during the heating-up of the well after being cooled down to allow VSP experiment [27]. The high resistivity at shallow depth (<140 m) coincides, in general, with low CEC values (<10 meq/100 g), except one sample at a depth of 116 m (55 meq/100 g). The highest CEC values (>40 meq/100 g) concur with the low resistivity at a depth of about 140 to 210 m. Below a depth of 210 m, the CEC values decrease exponentially and reach a steady state level at about 1000 m depth, whereas minor variations occur. Such variations are also observed in the electrical resistivity logs and it can be stated that samples that have high CEC values are found where the resistivity is low relative to the adjacent units and vice versa: samples with a low CEC have a relative high resistivity. For example, the high CEC values at a depth of 200 m correlate with a basaltic tuff unit, whereas the low values further down in the well profile are associated with a crystalline basaltic unit. In general, when considering adjacent lithological units, glass-rich units are characterized by high CEC values, whereas crystalline lithologies are characterized by low CEC (Table S4). The different CEC values are related to the alteration intensity of the units.
A large scattering in CEC is observed at the depth interval from 300 to 600 m. The large scattering can most likely be explained by cross contamination of the collected cutting samples. The caliper log that was carried while drilling [25,28] shows a large caving structure at about 200 m and possibly continuous caving caused cross contamination during further drilling towards the end of drilling phase 1. Samples below about 680 m do not show similar scattering behavior. The depth interval from 200 to 660 m was cased before drilling of phase 2 [25].
Below 1000 m, only very limited variations of the CEC values are observed and the CEC values decrease slowly. However, the values at that depth are close to the background values in such rocks (2.8 meq/100 g) [65].
The CEC values >5 meq/100 g are in good agreement with the depth interval of the alteration zones that are characterized by expandable clay mineral alteration [24]. Nevertheless, the depth interval (>650 m), for which resistivity time series during heating-up were carried out [27], coincides with low CEC values with very limited variations of the CEC. The small variations in CEC cannot be synchronized with the variations of the resistivity curves.

4.2. HE-42 and HE-46

The results of the CEC measurements from well HE-42 and HE-46 on Hellisheidi are presented along the depth profile together with the electrical resistivity logs [36] and the alteration facies [37,38] in Figure 3. The CEC values decrease exponentially with increasing depth. In well HE-46, samples from the zeolite-smectite alteration zone are characterized by high CEC values. At the transition to the chlorite-epidote alteration zone, presented by Gunnarsdóttir [38] for well HE-42 and Snaebjörnsdóttir [37] for well HE-46, the CEC values level out and show only a very limited decrease with increasing depth and increasing hydrothermal alteration (Figure 3).
The transition from the mixed-layer clay to the chlorite-epidote alteration zone in well HE-46 coincides with a general increase of the measured electrical resistivity. At about 600 m depth, the resistivity log shows a change, where the electrical resistivity increases from about 8–10 Ωm to about 18–20 Ωm. With increasing depth from about 600 m the resistivity shows a slightly decreasing trend down to about 1000 m where the resistivity reaches around 10 Ωm (Figure 3). Within the shallow part of the well (<600 m), the CEC values decrease exponentially from ~40 meq/100 g to ~6 meq/100 g. At the depth range from 600 to 1000 m, the CEC values only decrease very slightly to a minimum value ~2 meq/100 g.

4.3. RN-15

The results of the CEC measurements for well RN-15 on Reykjanes are presented in Figure 3 together with the electrical resistivity log [48] and the first appearance of the alteration minerals epidote and actinolite [48]. No clay mineral analysis has been conducted for well RN-15 and, therefore, no detailed alteration facies model has been elaborated.
The results of the CEC measurements show, in general, a decreasing trend with increasing depth in the well (Figure 3, Table S7). Samples at a depth of 890 and 1130 m exhibit significant higher CEC values and higher H2O contents than the adjacent samples. Both depths are characterized by altered tuffs [48]. Results from the CEC measurements show a pronounced decreasing trend down to 1000 m. Below that depth, the CEC values level out, except the sample at 1130 m that exhibits a significantly higher CEC than the adjacent samples. For RN-15, only a weak relation is observed when CEC results are compared with the electrical resistivity log. The sharp change in the resistivity log at 800 m is most likely related to the well design rather than to a major change in the mineralogy. The shoe of the production casing is located at 804 m [48] and the resistivity log above and below is composed of two individual wire-line loggings. Between 550 and 800 m, the resistivity log shows only a minor oscillation with values reaching a maximum value of 1 Ωm. In contrast, the electrical resistivity log between 800 and 1250 m shows a significant oscillation between about 1 and 15 Ωm. Within the depth interval of 1250 to 2000 m, the resistivity log shows a sharp increase whereas the oscillation of the electrical resistivity log ranges between 5 and about 60 Ωm.
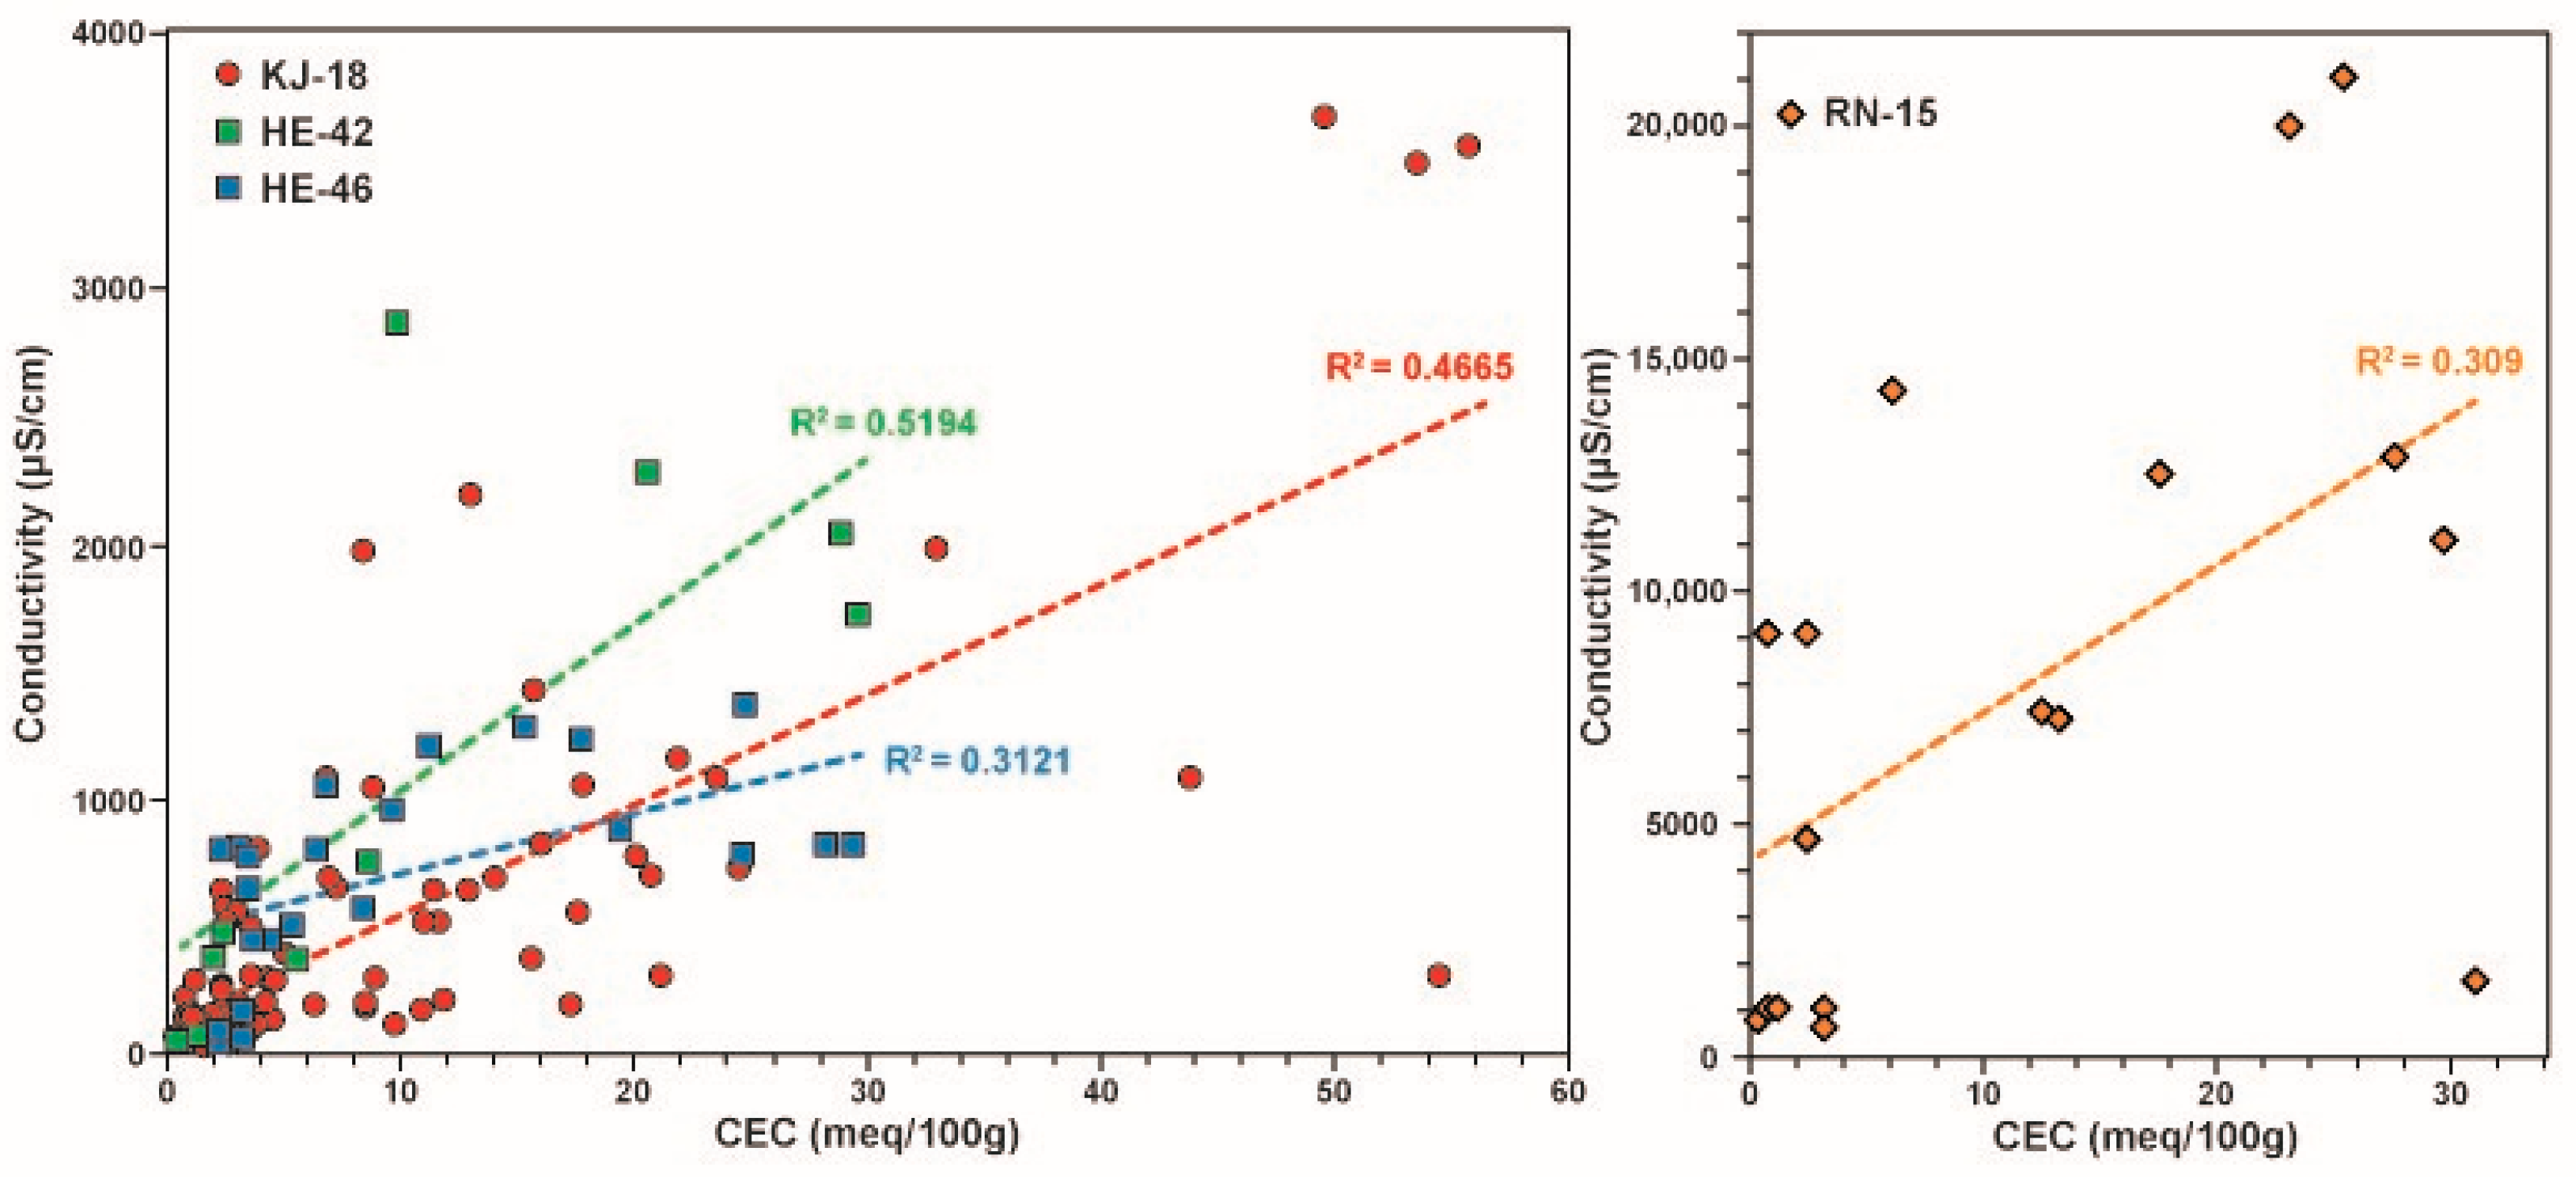
Comparing directly the CEC to the measured electrical resistivity log shows similar trend as in the other studied wells, whereas rocks with a high CEC are associated with low resistivity and rocks with a low CEC show a relative high resistivity. However, in contrast to wells studied within meteoric driven hydrothermal systems (KJ-18, HE-42, HE-46), samples in RN-15 that are situated within the saline hydrothermal systems at Reykjanes show, in general, lower measured electrical resistivity or higher electrical conductivity relative to the measured CEC (Figure 4).

4.4. Core Samples

The results of the CEC measurements for seven core samples are presented in Table 1. The measured CEC values are in an agreement with the alteration zones as reported in Flóvenz et al. [15]. Samples from the smectite alteration zone show the highest CEC values, whereas samples that are equilibrated within the chlorite alteration zone show significantly lower CEC values. For unaltered samples, the CEC measurements do not show any ability for cation-exchange.
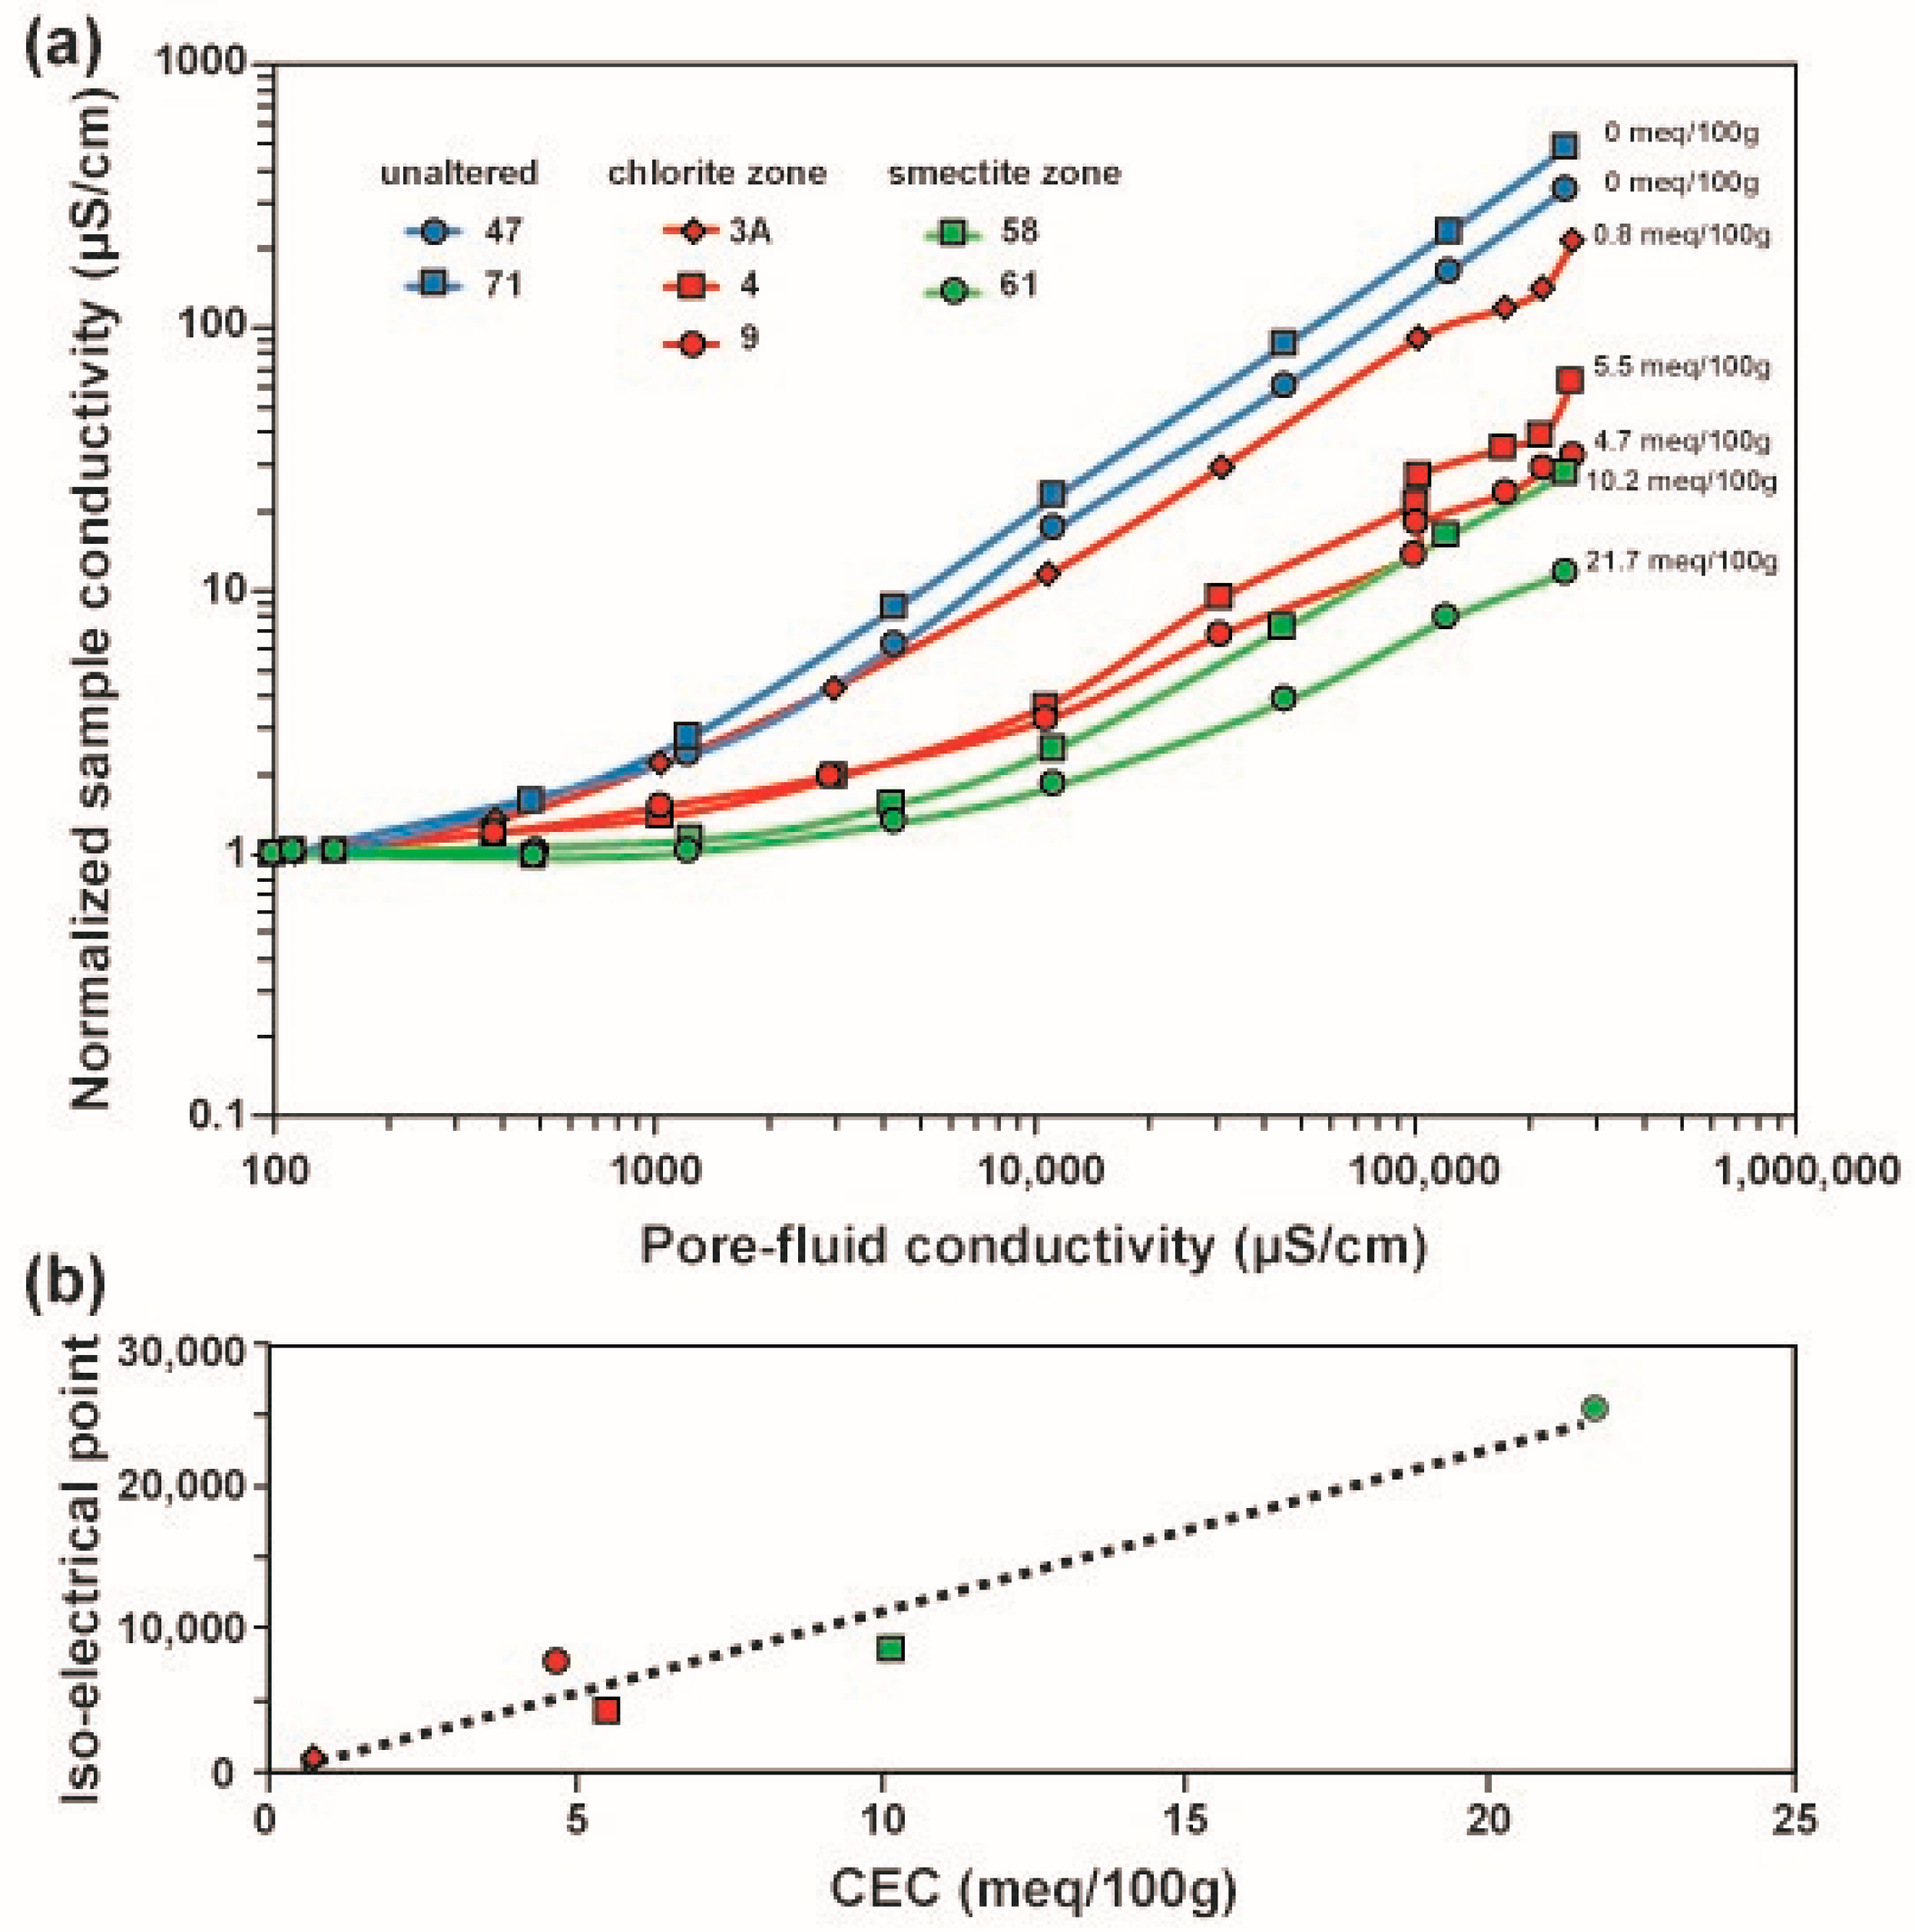
When comparing the sample conductivity and the CEC, Flóvenz et al. [15] noted that, on the average, the interface conductivity is higher in the smectite zone than in the chlorite zone and almost absent in the unaltered samples. Further, there is a relation visible when the sample conductivity and the pore fluid conductivity are normalized to the conductivity value of the lowest pore fluid conductivity (Figure 5a). The correlation evidences that the higher the CEC, the higher the critical threshold [15] at which the fluid conductivity influences the sample conductivity. The critical threshold reflects the pore fluid conductivity at which the normalized sample conductivity deviates from the horizontal trend. The critical threshold can be described by the iso-electrical point, which is the value of pore fluid conductivity where the contribution from the surface (interface) conduction and pore fluid conduction are equal (Figure 5b).

5. Discussion

5.1. CEC and Relation to Alteration Mineralogy

The CEC of all sampled wells that are studied here show a general trend of decreasing values with increasing depth of the sample origin. The sample depth thereby can be related to a particular temperature, at which the sample is equilibrated driven by fluid-rock interaction within a hydrothermal system. This equilibration results in a change in mineralogy, which is often accompanied with a gain or loss in elements during the fluid-rock interaction e.g., [5,7,66,67,68,69]. The temperature increases with increasing depth that results in the formation of distinct alteration zone or metamorphic facies at higher temperature conditions [7,67]. The CEC follows a general decreasing trend with increasing depth. The decreasing trend in CEC with depth can be correlated directly to the mineralogical composition of the alteration zones (Figure 3). Considering the alteration zones in a hydrothermal basaltic system [5,7,66,67], the index minerals of individual alteration zones reflect a decrease in CEC. For example, the smectite zone is distinguished by high CEC values of their index mineral smectite (60–120 meq/100 g) [70]. The mixed-layers clay zone is marked by the transition between the smectite and chlorite zone. Clay minerals consist of so-called mixed-layer clay minerals that are interstratified mixed layers of smectite and chlorite (5–15 meq/100 g) [71]. With increasing temperature and depth, respectively, the mineralogical composition, in general, increases in the chlorite component of the interstratified chlorite/smectite clay minerals e.g., [5,7]. It should be noted that, apart from the clay mineral type, the absolute amounts of the individual clay minerals also have an effect on absolute CEC values. Small amounts of smectite may influence CEC values in the same way as large amounts of chlorite.
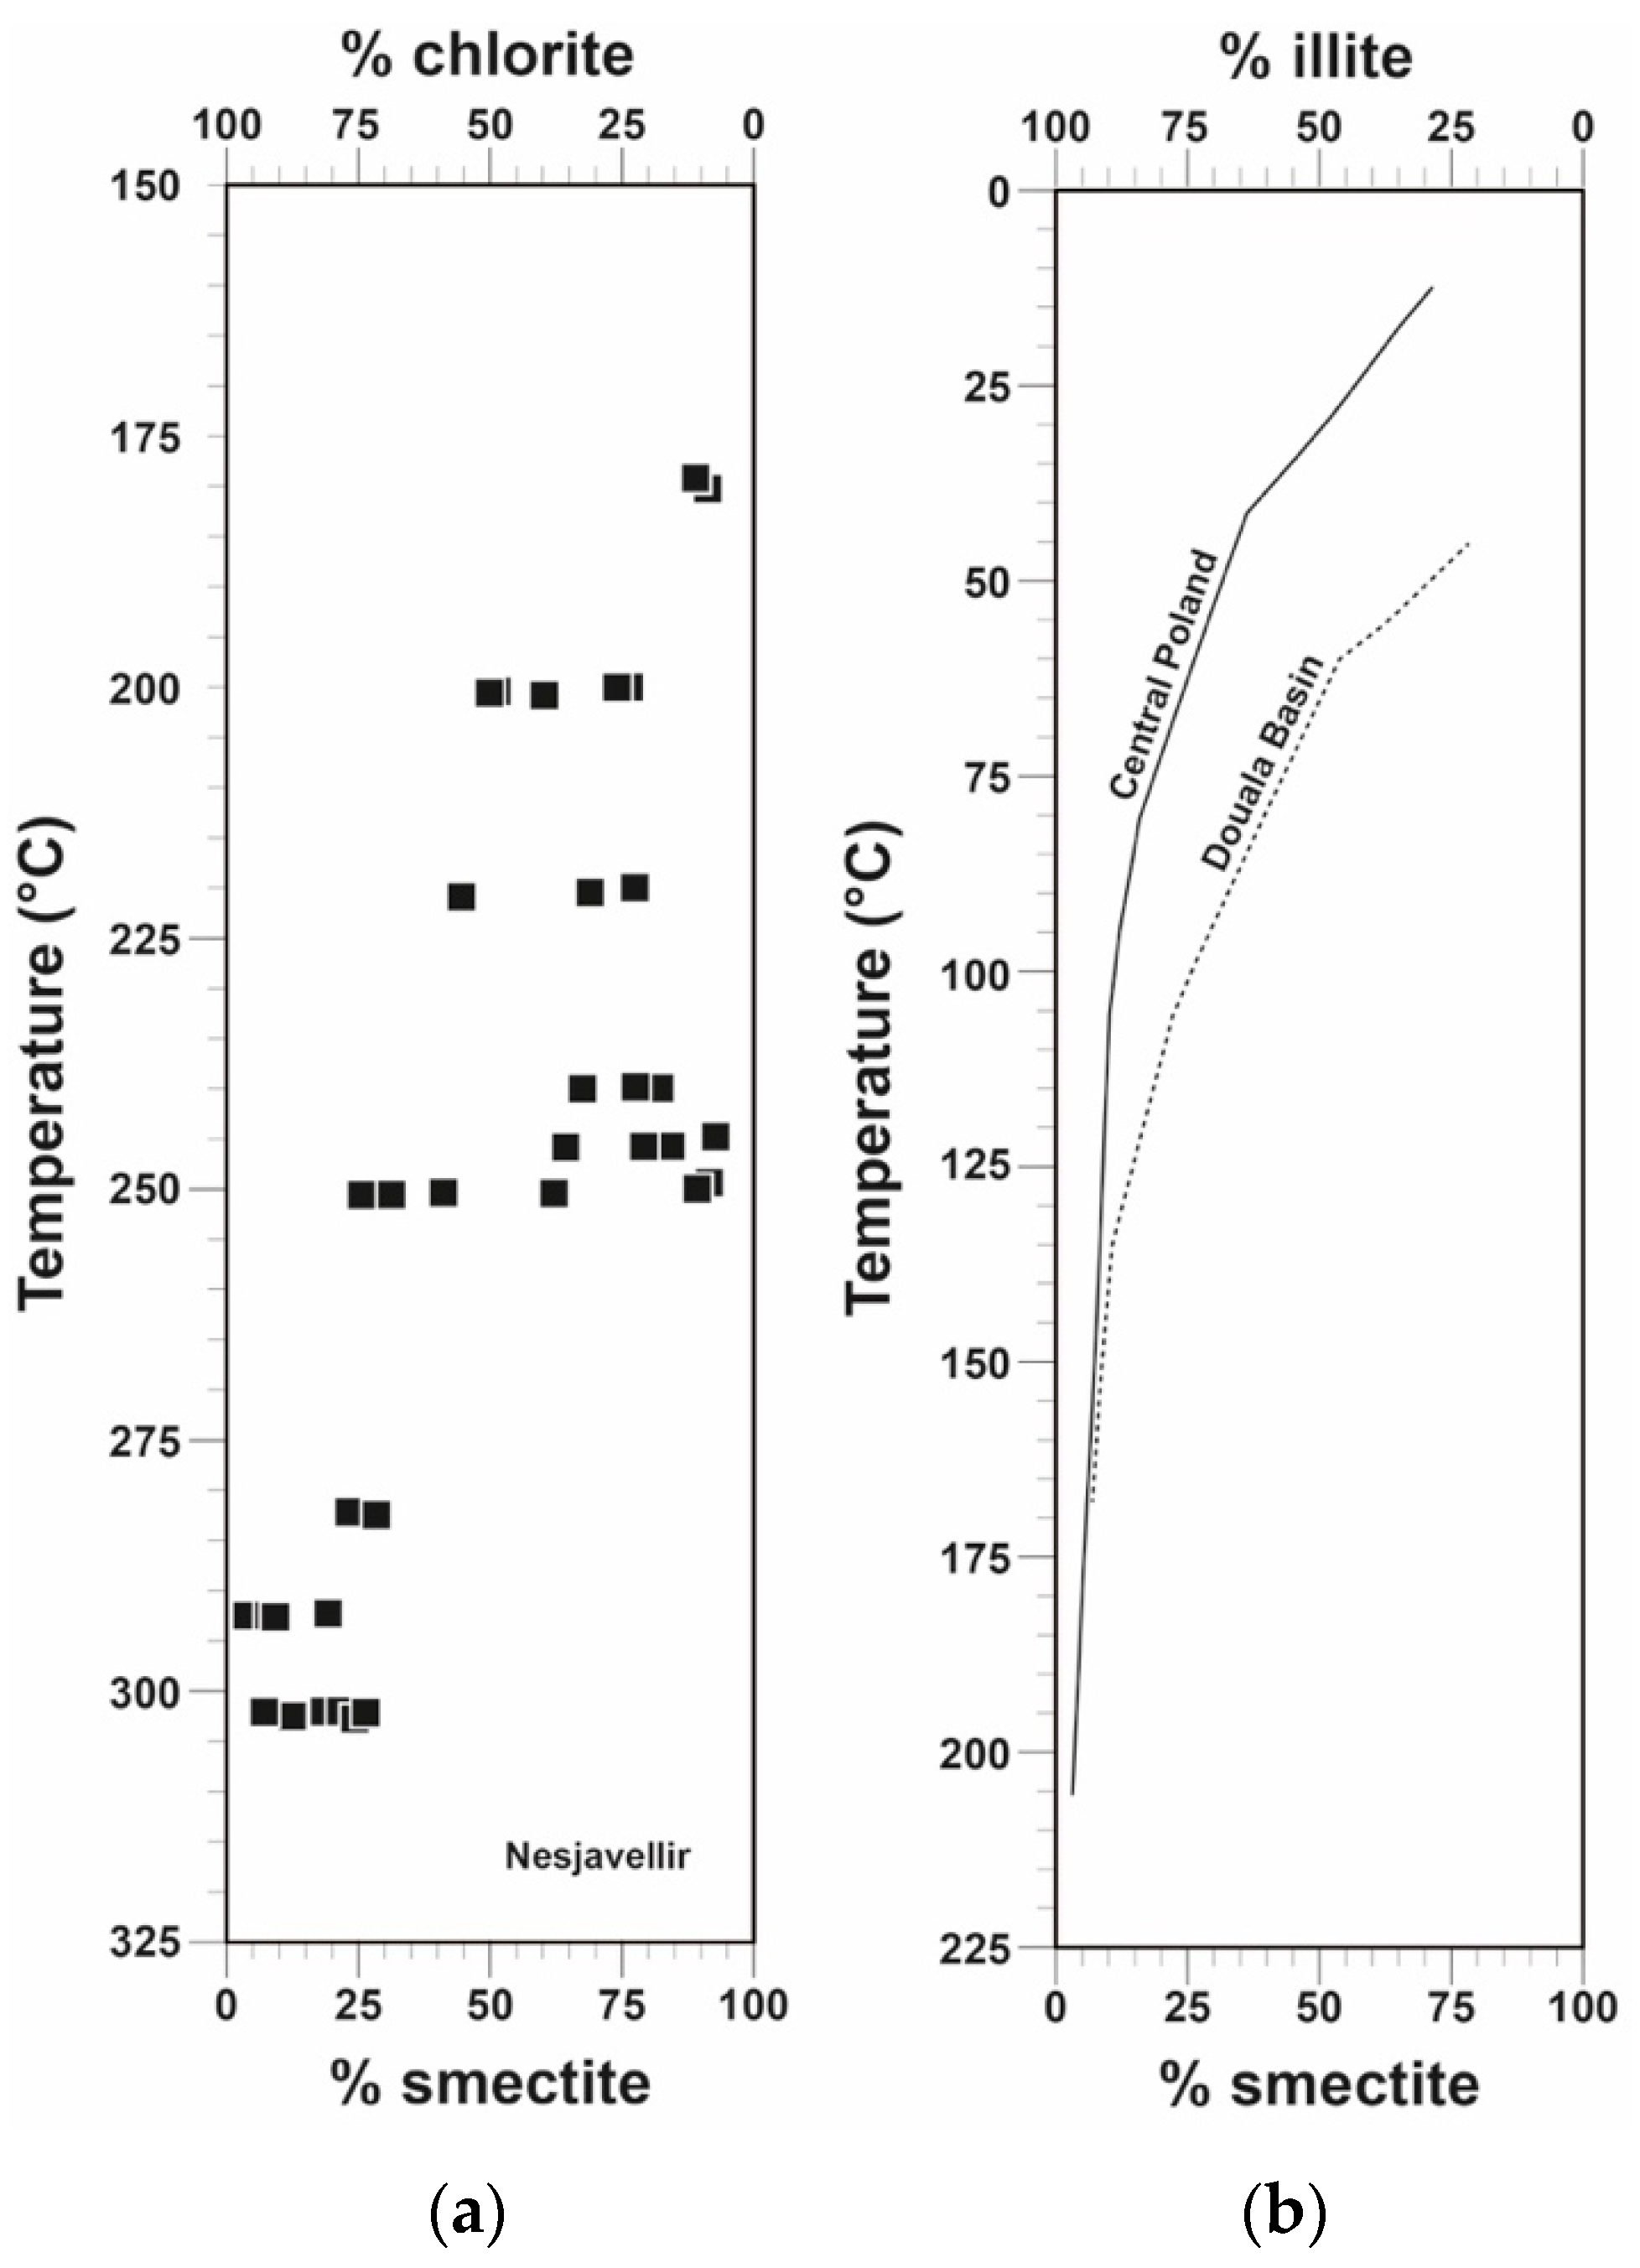
Figure 6a shows the clay mineral composition based on Schiffman and Fridleifsson [5] in well NJ-15 of the Nesjavellir geothermal system, which is located in the northern part of the Hengill central volcano in southwest Iceland. In their study, Schiffman and Fridleifsson [5] investigated the clay mineralogy based on X-ray diffraction and electron probe micro-analyzer. They showed that the transition from smectite to interstratified chlorite/smectite to chlorite at sub-greenschist conditions of mafic rocks is temperature-depended. Moreover, they showed that the chlorite and smectite content, respectively, within the interstratified chlorite/smectite minerals is a function of temperature. The higher the formation temperature the higher is the chlorite percentage within the interstratified chlorite/smectite layers. The gradual decrease of the CEC with depth (Figure 3), as well as the observation that the CEC reaches a steady state at the upper chlorite facies boundary shows clear relation of the CEC to the alteration mineralogy, in particular the compositional changes within the interstratified chlorite/smectite clay minerals. It could be shown for all wells that were studied within this project that steady state of the CEC was reached after smectite was absent within the interstratified chlorite/smectite minerals and the change of the CEC curve from an exponential trend to a linear trend (Figure 3) where CEC in most cases is below 5 meq/100 g. When entering the chlorite or chlorite-epidote zone, the CEC values are <5 meq/100 g and the trend line follows a very smooth decreasing linear trend. This indicates that the mineralogical composition of the host rock is not controlled by smectitic clay minerals. The observed very low CEC values in the deepest and hottest alteration zones are close to background values of basaltic rocks (2.8 meq/100 g) [65].
It has been shown by Hower and Mowatt [74] that a very good linear relation of the smectite content in interstratified mixed-layer clays (illite/smectite) and the measured CEC exists, and, based on our observation, we concluded that similar relation between the smectite content and interstratified chlorite/smectite minerals exists.
Similar pattern of decreasing CEC with increasing depth has been shown for diagenetic systems in petroleum exploration (Figure 6b). For example, it has been shown for many petroleum systems (e.g., Central Poland, North Sea, Douala Basin, Gulf Coast) that the smectite component (expandability) in interstratified clays (illite/smectite) decreases with temperature and depth, respectively [72,73,74,75,76,77]. This implies that measurements of the CEC within diagenetic petroleum systems will result in similar CEC versus depth/temperature pattern, as was demonstrated in this study.
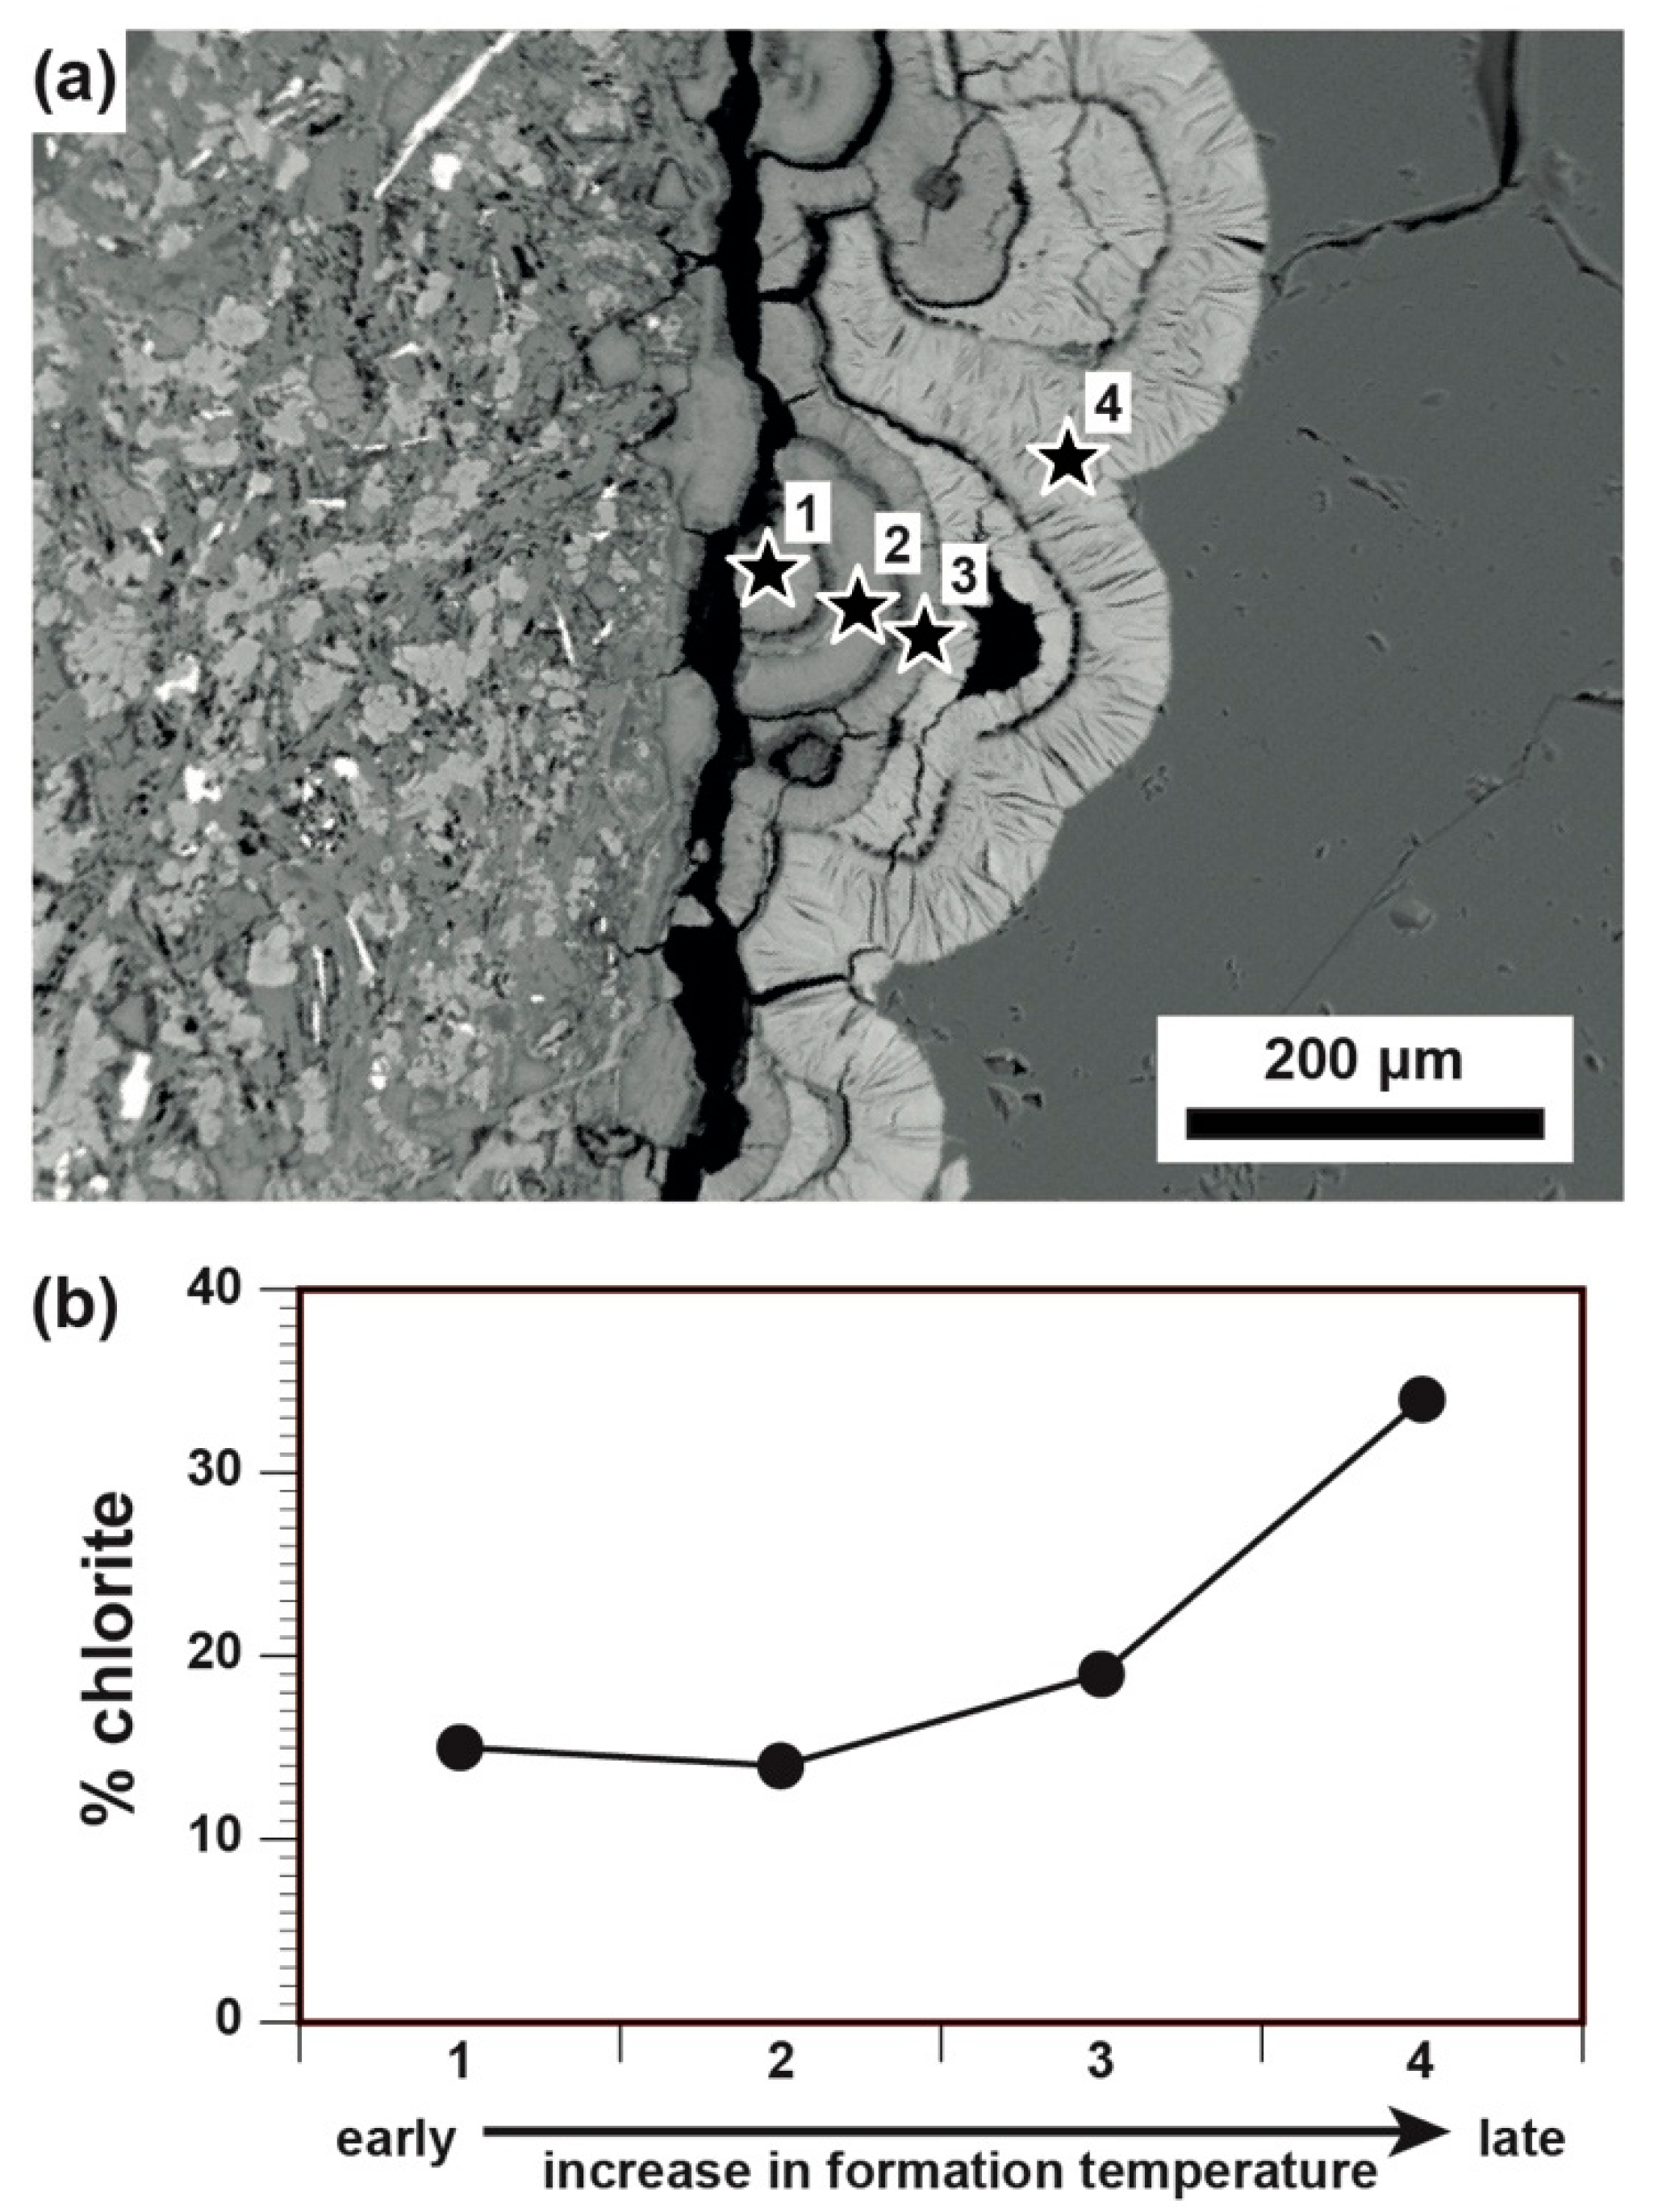
Although there is a general trend of decreasing CEC with depth observed in all four studied wells, it should be kept in mind that any prograde or retrograde secondary minerals assemblage may distort the CEC profile and, at the same time, the electrical resistivity. Figure 7 shows a prograde mineral evolution from the Hvalfjördur area in southwest Iceland. Clay mineral coatings within vesicles of basaltic lavas show a progressive change in mineralogy with time. The increase of chlorite content in the interstratified chlorite/smectite minerals is related to the burial of the lava sequence and subsequently overprinted by a hydrothermal event and formation of high temperature zeolites [7]. Results of CEC measurements for such a bulk rock sample within a geothermal study would, therefore, follow a trend and underestimate the maximum temperature state. In their study, Schiffman and Fridleifsson [5] concluded that the persistence of interstratified chlorite/smectite minerals with high smectite component and even discrete smectite in higher temperature regime can be associated to the prograde phenomenon related to the metastability.
Although the relation of CEC, electrical resistivity and alteration mineralogy shown in this study applies to the basaltic systems in the Reykjanes geothermal field, Hengill geothermal field as well as to the bimodal Krafla geothermal field, further studies are necessary to elaborate the influence of compositional change of the host rock within the lithostratigraphy on the CEC and the electrical resistivity.

5.2. CEC vs. Electrical Resistivity

Direct sample/depth correlation of the measured CEC values and the electrical resistivity follows a general trend. Depth intervals with high electrical resistivity coincide with low CEC values, and low electrical resistivity values correspond to high CEC values, respectively. Although there is a relationship between CEC and electrical resistivity, the direct one-to-one correlation is weak when comparing adjacent samples within the oscillating resistivity logs. This is most likely a result of the cutting cross contamination while traveling within the wellbore and possible mixing due to cavings. For example, within KJ-18, the depth interval between 100 and 250 m, at which a thick individual lithological unit appears, shows a good one-to-one correspondence between the measured CEC and electrical resistivity. However, below a depth of about 250 m, only a very weak correlation can be observed (e.g., at the depth interval between 350 and 450 m, and 550 and 620 m). This weak correlation is most likely caused by mixing of the cuttings caused by thin alternating lithological units (<10 m) and a caving structure at about 200 m depth.
In addition, there is an uncertainty regarding the depth of the cutting samples, due to the lag time, which is the time cuttings need to travel from the drill bit to the surface. It should be pointed out that within hydrothermal systems, superimposition of alteration minerals can occur often and cannot be excluded for the studied cutting samples.
Considering those uncertainties, depth uncertainties may easily account for several meters. In contrast to the resistivity log data, which have a resolution of 0.5 m. Therefore, any cutting sample should be carefully selected. In particular, within stratigraphic sequence of thin lithological units and the resulting resistivity patterns with small oscillations, the correlation between CEC and electrical resistivity has to be taken with precaution due to variation of the alteration degree.
As described above, other factors than CEC can influence the electrical resistivity. We assume that the temperature effect on the electrical logs are very limited due to the fact the logging takes place during cooling of the wells in a very limited temperature range. Information of the porosity in the well is usually acquired by neutron-neutron logs. Although there is often a similar oscillation within the neutron-neutron and electrical resistivity logs [38,39,48], the distinct change from low to high resistivity and associated trends are not shown in the neutron-neutron logs.
Differences exist when comparing geothermal systems that are associated with meteoric low-saline fluids (Krafla: KJ-18, and Hellisheidi: HE-42 and HE-46) and seawater, high-saline dominated geothermal systems (Reykjanes: RN-15). The results of this study indicate that the measured conductivity in the wellbore is significantly higher for a given CEC within the saline Reykjanes geothermal system in contrast to meteoric water-dominated geothermal systems (Figure 4). This is in agreement with the statement by Flóvenz and Karlsdóttir [78] and Flóvenz et al. [15], who concluded that samples from similar alteration zone can have significantly different interface conductivity. Thereby, the interface conductivity is a decisive parameter for the bulk resistivity for the sample at reservoir salinities [15].

5.3. Resistivity Structure of High-Temperature Fields and Relation to the CEC

High-temperature geothermal fields in volcanic areas of the world have, in general, a similar electrical resistivity structure [1,4]. A pilot study by Árnason et al. [1,2] showed that, within the Nesjavellir geothermal system in SW Iceland, there is a low-resistivity cap over-coating an up-doming resistivity core. Comparing the depth interval of the low-resistivity cap and the alteration zoning derived from cuttings analysis during drilling showed that the low resistivity cap coincides with the smectite alteration zone, whereas the high-resistivity core coincides with the chlorite alteration zone.
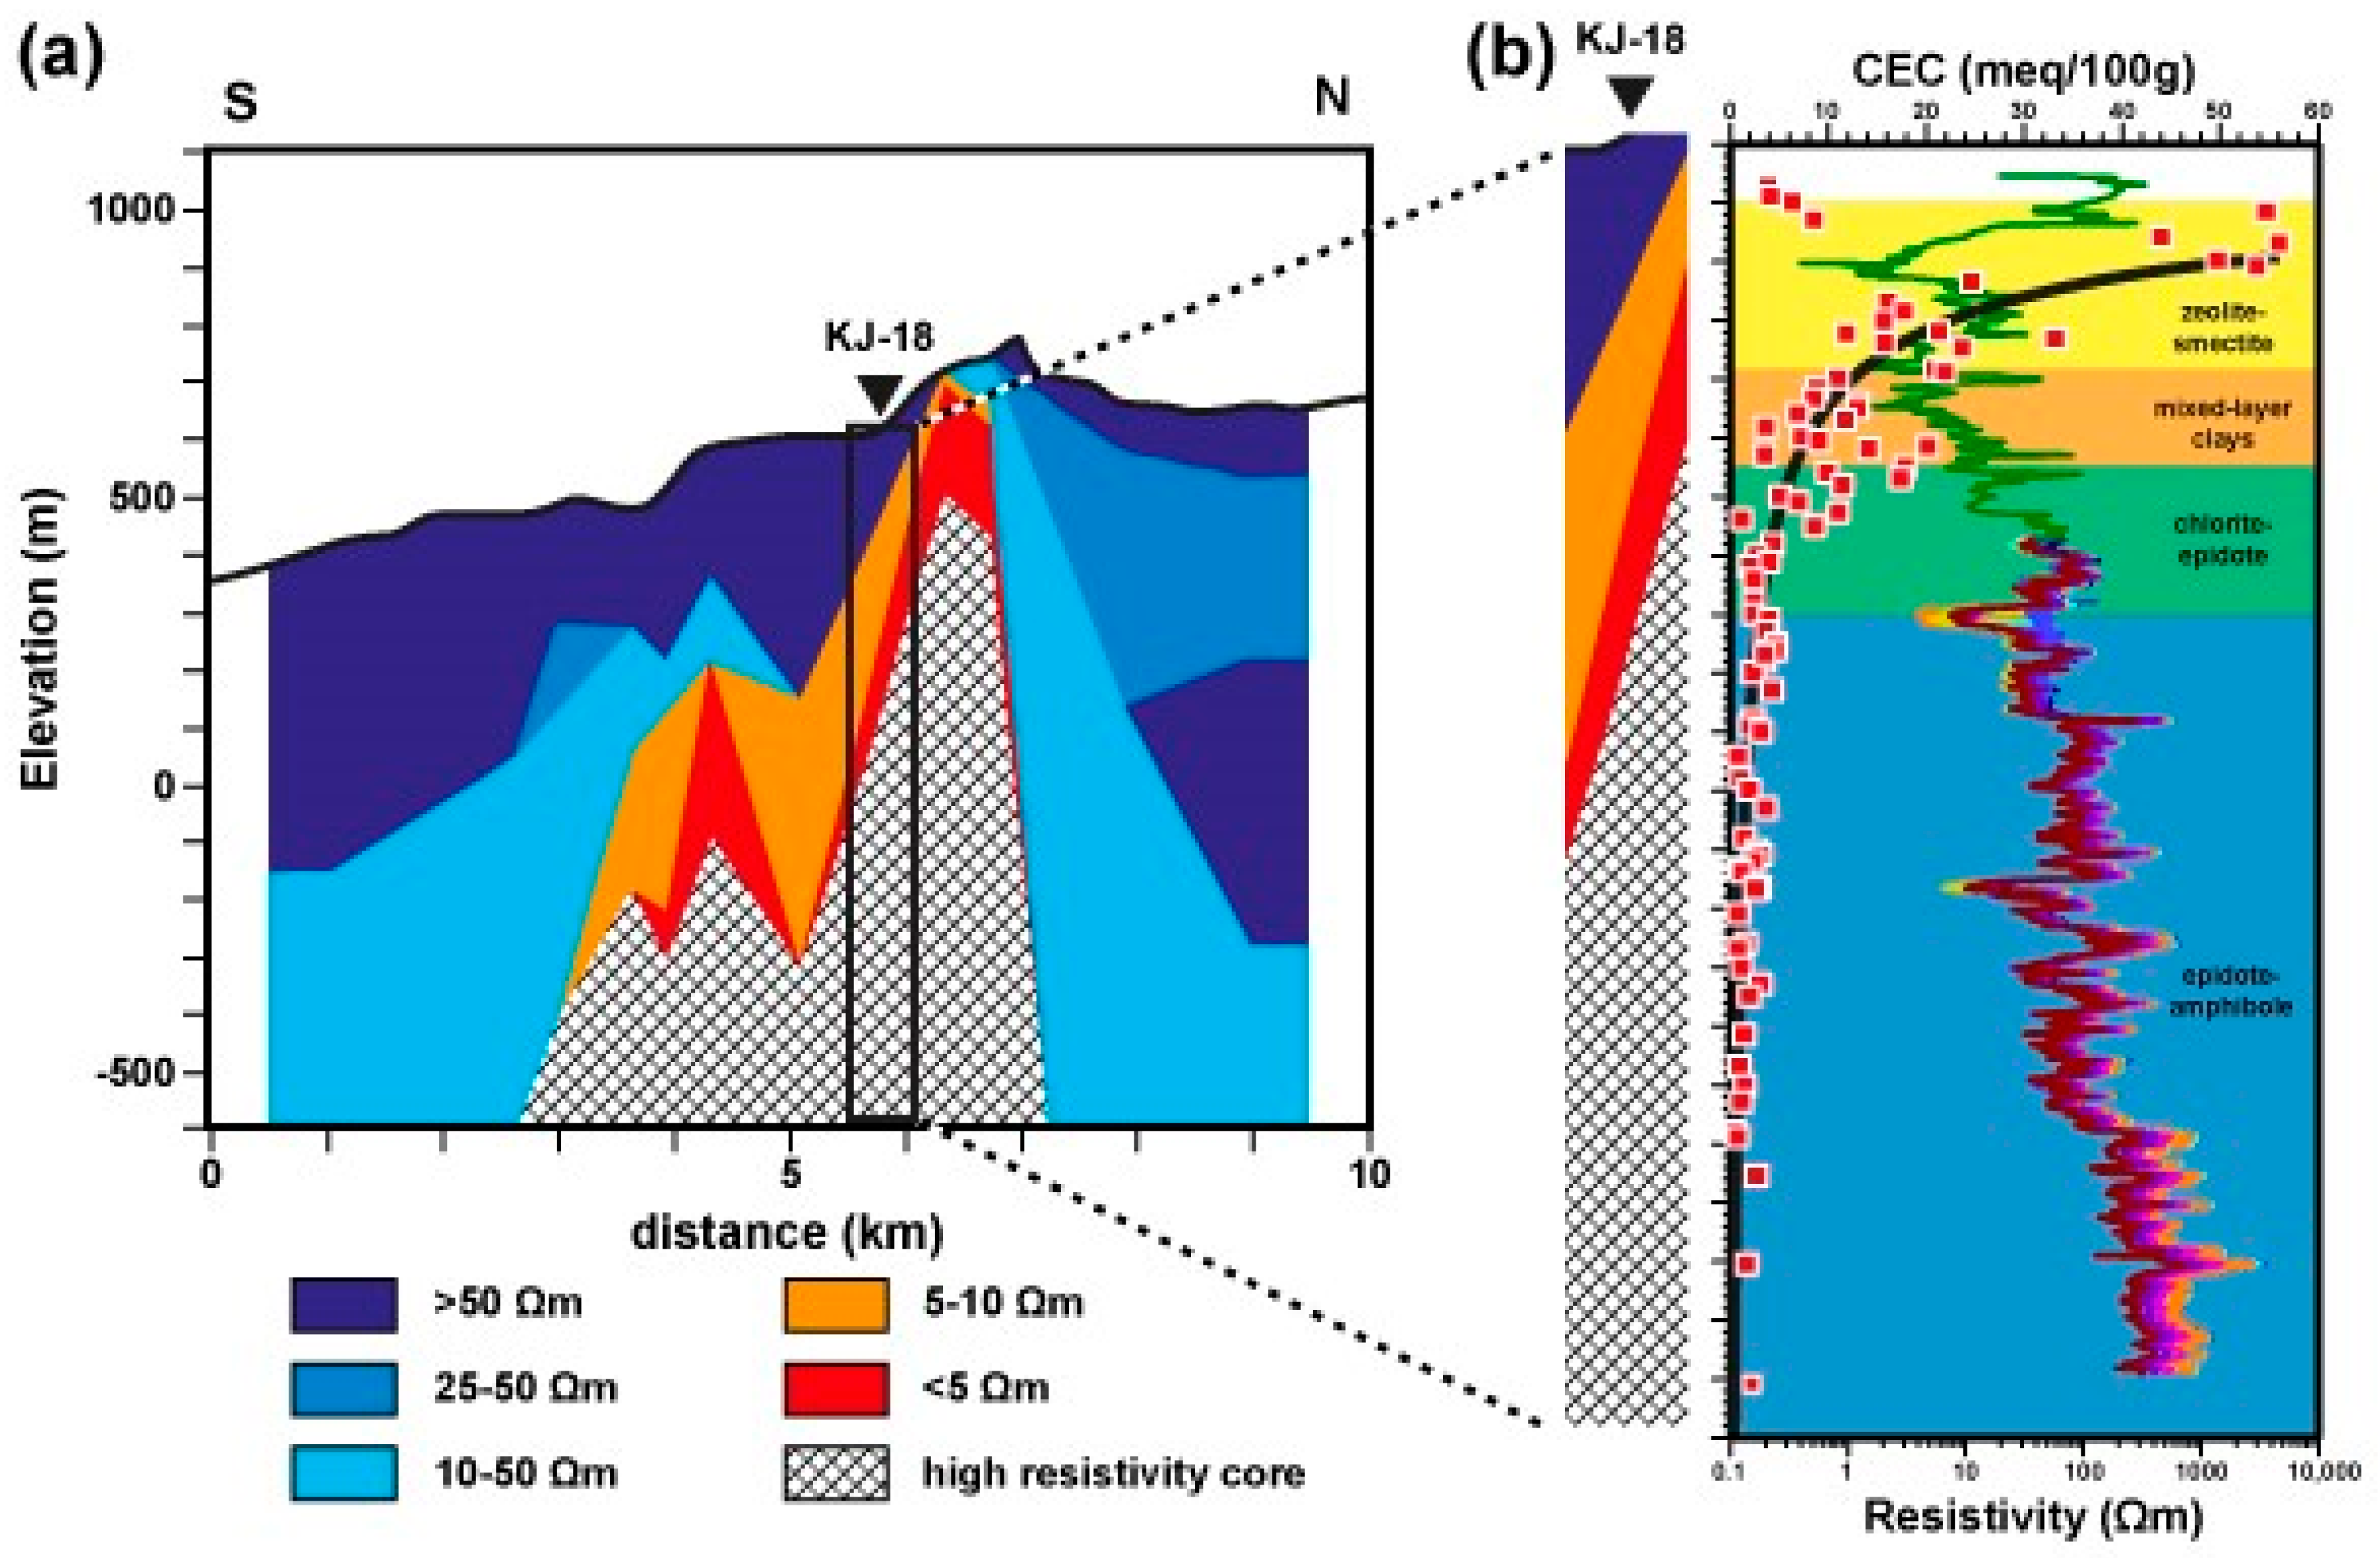
Studies of the CEC from all four selected wells show that the low resistivity at shallow depth is associated with a CEC above a critical value of about 5 meq/100 g (Figure 3). In particular, in well HE-46, the prompt increase in electrical resistivity at the facies boundary between mixed-layer clays and chlorite-epidote alteration zone coincides with the critical threshold of 5 meq/100 g.
Figure 8 shows a south-north lying resistivity cross-section through the Krafla high-temperature geothermal system in north Iceland, based on 1-D modeling of TEM data [79]. The location of well KJ-18 is shown on the profile (Figure 8b). The measured electrical resistivity log and results of the CEC are illustrated in Figure 8. The comparison of different methods shows a very good correlation of the modeled surface resistivity, electrical resistivity log, the mapped mineral alteration and measured CEC. The measured high CEC within the shallow part are at similar depth interval as the low-resistivity core (red and orange colors). Values for the CEC in high resistivity core are general below about 5 meq/100 g. The high resistivity at the top also coincides with low CEC values at similar depth. Flóvenz et al. [4] related this resistivity contrast at the top of the smectite zone to the onset of interface conduction in the rock. The high resistivity zone is thereby marked by the lack of conductive clay minerals.
The clear correlation between resistivity and CEC in particular the formation of clay minerals within a specific depth interval that corresponds to a specific temperature interval confirms the model by Árnason et al. [1,2] that was predicted for the Nesjavellir geothermal system. It can be postulated that a similar model, which correlates the electrical resistivity with CEC, is applicable to other geothermal fields in basaltic environments worldwide.

5.4. Relationship between Sample Conductivity, Fluid Conductivity and CEC

Cation-exchange capacity measurements for the seven core samples that have been used previously for conductivity measurement by Flóvenz et al. [15] and petrophysical measurements by Kulenkampff et al. [16] do not show simple relationship between the CEC values and the measured sample conductivity. This suggests that there is no simple relationship between the measured CEC values and the surface or interface conduction. However, a clear relationship between the CEC and the onset of the pore fluid conductivity on the sample conductivity is observed as the iso-electrical point is gradually moved towards higher values of the pore fluid conductivity with increasing CEC (Figure 5). Strictly speaking, the measured sample conductivity is more sensitive to the surface conductivity for rocks with low CEC values. For rocks with high CEC values only fluid with very high salinity and pore fluid conductivity will increase the actual sample conductivity.

6. Summary

The study of the cation-exchange capacity of drill cuttings provides a unique opportunity to elaborate the clay mineral alteration within a hydrothermal system and validate resistivity models. It further is a method to estimate the thickness of the clay cap within hydrothermal systems and thereby, assisting in constraining the modeling of surface resistivity data.
In this study, we could show for four wells in three high-temperature geothermal systems in Iceland that the CEC values show a similar pattern with increasing depth and mimic the previous elaborated alteration facies. In detail, the highest CEC values are associated with the smectite-zeolite alteration zone. The CEC values decrease exponentially with increasing depth down to the facies boundary between the mixed-layer clay (interstratified chlorite/smectite minerals) and the chlorite-epidote or chlorite alteration zones. At this depth, the CEC values are, in general, less than 5 meq/100 g and reach a steady state. Below the facies boundary, the CEC values decrease slightly linearly with increasing depth. The depth interval having CEC values >5 meq/100 g coincides with the low resistivity in the resistivity logs and confirms the hypothesis by Flóvenz et al. [4]. The increase in resistivity from the smectite alteration zone to the chlorite zone is likely due to the higher CEC of smectite, as compared with chlorite. Although the absolute measured CEC value for a single cutting sample cannot be used to quantify the alteration conditions within a hydrothermal system, this study shows that, with a set of about 15 to 20 samples, unambiguous information can be deducted to quantify the location of mineral alteration zones.
Comparing the electrical resistivity logs and the results of the CEC analysis reveals that samples that are characterized with high CEC values coincide with low resistivity at the same measured depth. Samples with low CEC values are characterized by high electrical resistivity at similar sample depths. However, no one-to-one correspondence is possible for all samples, which is most likely due to the uncertainty in cutting origin and possible cross contamination.
Comparing the 1-D subsurface resistivity model of the Krafla geothermal system, electrical resistivity logs and CEC measurements in well KJ-18, a very good correlation is found that confirms the model by Árnason et al. [1,2]. The low-resistivity cap coincides with the smectite-zeolite alteration zone and CEC measurements yield CEC >5 meq/100 g. The transition of the high-resistivity core is located at the alteration facies boundary between the mixed-layer clay and the chlorite-epidote alteration zone, and the mineral assemblages within the high-resistivity core are characterized by very limited cation-exchange properties.
The CEC study of seven core samples from various alteration zones previously studied by Flóvenz et al. [15] and Kulenkampff et al. [16] show a correlation between CEC of the samples and the iso-electrical point of the sample. This indicates that the CEC of the rock controls the range of pore fluid salinity values where surface (interface) conduction dominates the pore fluid conduction.
We could show within this study that the measurement of the CEC within hydrothermal systems can provide reliable information about the smectitic clay dominated alteration facies. In conventional geothermal drilling methods, X-ray diffraction analysis are required to identify this alteration zone. Alternatively, the method described in this study can be an easy tool to quantify the alteration facies. In particular, where no X-ray diffraction lab is accessible, the method described above can be conducted in conventional chemical labs.
Even though this study has shown and proven that the alteration mineralogy and, therefore, the cation-exchange capacity of the rock control the electrical resistivity within hydrothermal systems, a clear quantification of the relationship has not yet been established. On one hand, this is related to the fact that there is a large bias in the depth origin of the cutting samples. The high uncertainty in cutting origin calls for studies on core material. The study of core samples has the advantage that mixing of sample material can be excluded and the sample depth is more precise and can, therefore, be better constrained to the electrical resistivity log. Core also preserve cross cutting relation and any prograde and retrograde alteration sequence can be included into the quantification.

Supplementary Materials

The following are available online at https://www.mdpi.com/1996-1073/13/21/5730/s1, Table S1: Qualitative XRD analysis of clay samples from wells HE-42 and HE-46, Hellisheidi geothermal system; Table S2: Description of seven core samples; Table S3: Compilation showing porosity, density, intrinsic formation factor, the interface conductivity and iso-electrical point for the seven core samples; Table S4: Results of CEC measurements from well KJ-18 in Krafla; Table S5: Results of CEC analysis from well HE-42, Hellisheidi geothermal system; Table S6: Results of CEC analysis from well HE-46, Hellisheidi geothermal system; Table S7: Results of CEC analysis for well RN-15, Reykjanes geothermal system.

Author Contributions

Conceptualization, Ó.G.F., G.P.H. and T.B.W.; methodology, Ó.G.F., G.P.H. and T.B.W.; formal analysis, H.I. and T.B.W.; writing—original draft preparation, T.B.W. and G.P.H.; writing—review and editing, T.B.W., G.P.H., H.I. and Ó.G.F. project administration, G.P.H.; funding acquisition, Ó.G.F. and G.P.H. All authors have read and agreed to the published version of the manuscript.

Funding

The research leading to these results has received funding from the European Community’s Seventh Framework Programme under grant agreement No. 608553 (Project IMAGE).

Acknowledgments

We would like to thank Landsvirkjun, Orkuveita Reykjavíkur (Reykjavik Energy, OR) and HS Orka for permission to conduct the presented study for the selected wells. A special thanks to our colleagues at ÍSOR, Svanbjörg Helga Haraldsdóttir and Arnar Már Vilhjálmsson for their help with resistivity logs, and Ester Inga Eyjólfsdóttir and Léa Lévy for assistance in the lab. Two anonymous reviewers are thanked for their thoughtful and valuable reviews.

Conflicts of Interest

The authors declare no conflict of interest.

References

  1. Árnason, K.; Haraldsson, G.I.; Johnsen, G.V.; Þorbergsson, G.; Hersir, G.P.; Sæmundsson, K.; Georgsson, L.S.; Snorrason, S.P. Nesjavellir. Jarðfræði- og Jarðeðlisfræðileg Könnun 1985; Report OS-86014/JHD-02; Orkustofnun: Reykjavík, Iceland, 1986. [Google Scholar]
  2. Árnason, K.; Flóvenz, Ó.G.; Georgsson, L.S.; Hersir, G.P. Resistivity structure of high temperature geothermal systems in Iceland. In Proceedings of the International Union of Geodesy and Geophysics (IUGG) XIX General Assembly, Vancouver, BC, Canada, 9–22 August 1987. Abstract V. [Google Scholar]
  3. Árnason, K.; Flóvenz, Ó.G. Evaluation of physical methods in geothermal exploration of rifted volcanic crust. GRC Trans. 1992, 16, 207–214. [Google Scholar]
  4. Flóvenz, Ó.G.; Hersir, G.P.; Saemundsson, K.; Ármannsson, H.; Friðriksson, Þ. 7.03-Geothermal Energy Exploration Techniques. In Comprehensive Renewable Energy; Sayigh, A., Ed.; Elsevier: Oxford, UK, 2012; Volume 7, pp. 51–95. [Google Scholar] [CrossRef]
  5. Schiffman, P.; Fridleifsson, G.Ó. The smectite-chlorite transition in drillhole NJ-15, Nesjavellir geothermal field, Iceland: XRD, BSE and electron microprobe investigations. J. Metamorph. Geol. 1991, 9, 679–696. [Google Scholar] [CrossRef]
  6. Neuhoff, P.S.; Fridriksson, T.; Arnorsson, S.; Bird, D.K. Porosity evolution and mineral paragenesis during low-grade metamorphism of basaltic lavas at Teigarhorn, eastern Iceland. Am. J. Sci. 1999, 299, 467–501. [Google Scholar] [CrossRef] [Green Version]
  7. Weisenberger, T.; Selbekk, R.S. Multi-stage zeolite facies mineralization in the Hvalfjördur area, Iceland. Int. J. Earth Sci. 2009, 98, 985–999. [Google Scholar] [CrossRef]
  8. Kristmannsdóttir, H. Types of Clay Minerals in Hydrothermally Altered Basaltic Rocks, Reykjanes, Iceland. Jökull 1979, 26, 30–39. [Google Scholar]
  9. Alt, J.C.; Honnorez, J.; Laverne, C.; Emmermann, R. Hydrothermal Alteration of a 1 km Section Through the Upper Oceanic Crust, Deep Sea Drilling Project Hole 504B: Mineralogy, Chemistry and Evolution of Seawater-Basalt Interactions. J. Geophys. Res. Solid Earth 1986, 91, 10309–10335. [Google Scholar] [CrossRef]
  10. Evarts, R.C.; Schiffman, P. Submarine hydrothermal metamorphism of the Del Puerto ophiolite, California. Am. J. Sci. 1983, 283, 289–340. [Google Scholar] [CrossRef]
  11. Kaufhold, S.; Grissemann, C.; Dohrmann, R.; Klinkenberg, M.; Decher, A. Comparison of three small-scale devices for the investigation of the electrical conductivity/resistivity of swelling and other clays. Clays Clay Miner. 2014, 62, 1–12. [Google Scholar] [CrossRef]
  12. Flóvenz, Ó.G.; Georgsson, L.S.; Árnason, K. Resistivity structure of the upper crust in Iceland. J. Geophys. Res. Solid Earth 1985, 90, 10136–10150. [Google Scholar] [CrossRef]
  13. Revil, A.; Glover, P.W.J. Nature of surface electrical conductivity in natural sands, sandstones, and clays. Geophys. Res. Lett. 1998, 25, 691–694. [Google Scholar] [CrossRef]
  14. Pezard, P. Electrical properties of mid-ocean ridge basalt and implications for the structure of the upper oceanic crust in hole 504B. J. Geophys. Res. 1990, 95, 9237–9264. [Google Scholar] [CrossRef] [Green Version]
  15. Flóvenz, Ó.G.; Spangenberg, E.; Kulenkampff, J.; Árnason, K.; Karlsdóttir, R.; Huenges, E. The role of electrical interface conduction in geothermal exploration. In Proceedings of the World Geothermal Congress, Antalya, Turkey, 24–29 April 2005. [Google Scholar]
  16. Kulenkampff, J.; Spangenberg, E.; Flóvenz, Ó.G.; Raab, S.; Huenges, E. Petrophysical parameters of rocks saturated with liquid water at high temperature geothermal reservoir conditions. In Proceedings of the World Geothermal Congress, Antalya, Turkey, 24–29 April 2005. [Google Scholar]
  17. Hjartarson, Á.; Saemundsson, K. Geological Map of Iceland: Bedrock, 1:600000; GeoSurvey: Reykjavík, Iceland, 2014. [Google Scholar]
  18. Saemundsson, K. Geology of Krafla volcanic system. In Náttúra Mývatns; Garðarsson, A., Einarsson, Á., Eds.; Hið Íslenska Náttúrufræðifélag: Reykjavík, Iceland, 1991; pp. 25–95. [Google Scholar]
  19. Saemundsson, K. Krafla, Geological Map, 1:25000; Landsvirkjun and ÍSOR: Reykjavík, Iceland, 2008. [Google Scholar]
  20. Jónasson, K. Rhyolite volcanism in the Krafla central volcano, north-east Iceland. Bull. Volcanol. 1994, 56, 516–528. [Google Scholar] [CrossRef]
  21. Pope, E.C.; Bird, D.K.; Arnórsson, S.; Giroud, N. Hydrogeology of the Krafla geothermal system, northeast Iceland. Geofluids 2016, 16, 175–197. [Google Scholar] [CrossRef]
  22. Gudmundsson, Á. An expansion of the Krafla Power Plant from 30 to 60 MWe. Geothermal Considerations. GRC Trans. 2001, 25, 741–746. [Google Scholar]
  23. Ármannsson, H. The fluid geochemistry of Icelandic high temperature geothermal areas. Appl. Geochem. 2016, 66, 14–64. [Google Scholar] [CrossRef]
  24. Weisenberger, T.B.; Axelsson, G.; Arnaldsson, A.; Blischke, A.; Óskarsson, F.; Ármannsson, H.; Blanck, H.; Helgadóttir, H.M.; Berthet, J.-C.C.; Árnason, K.; et al. Revision of the Conceptual Model of the Krafla Geothermal System; ÍSOR-2015/012; LV-2015-040; Iceland GeoSurvey: Reykjavík, Iceland, 2015. [Google Scholar]
  25. Stefánsson, V.; Guðmundsson, Á.; Steingrímsson, B.; Guðmundsson, G.; Friðleifsson, G.Ó.; Axelsson, G.; Ármannsson, H.; Sigvaldason, H.; Benjamínsson, J.; Sigurðsson, Ó. Krafla, holur KJ-16, 17 og 18–Rannsóknir samhliða borun og vinnslueiginleikar. Orkustofnun 1983. Unpublished Manuscript. [Google Scholar]
  26. Blischke, A.; Árnadóttir, S.; Helgadóttir, H.M.; Millett, J. Well K-18 in the Krafla High-Temperature Field, NE-Iceland. Review of Wireline and Televiewer Log Data, and Electronic Facies Log (EFL). Preliminaries; ÍSOR-2016/021; Iceland GeoSurvey: Reykjavík, Iceland, 2016. [Google Scholar]
  27. Vilhjálmsson, A.M.; Hersir, G.P.; Flóvenz, Ó.G. IMAGE Task 3.3–Physical Properties of Rock at Reservoir Conditions. Resistivity vs. Temperature during Heating up of Well KJ-18 in Krafla, NE-Iceland; ÍSOR-2016/045; Iceland GeoSurvey: Reykjavík, Iceland, 2016. [Google Scholar]
  28. Millett, J.M.; Planke, S.; Kästner, F.; Blischke, A.; Hersir, G.P.; Halldórsdóttir, S.; Flóvenz, Ó.G.; Árnadóttir, S.; Helgadóttir, H.M.; Vakulenko, S.; et al. Sub-surface geology and velocity structure of the Krafla high temperature geothermal field, Iceland: Integrated ditch cuttings, wireline and zero offset vertical seismic profile analysis. J. Volcanol. Geotherm. Res. 2020, 391, 106342. [Google Scholar] [CrossRef] [Green Version]
  29. Saemundsson, K. Vulkanismus und Tektonik des Hengill-Gebietes in Südwest Island. Acta Nat. Isl. 1967, 2, 1–105. [Google Scholar]
  30. Saemundsson, K. Hellisheidi power plant: Geological conditions within the utilization area. In Iceland GeoSurvey Short Report; Orkustofnun: Reykjavík, Iceland, 2003; KS 03/02. [Google Scholar]
  31. Jakobsson, S.P.; Jónsson, J.; Shido, F. Petrology of the Western Reykjanes Peninsula, Iceland. J. Petrol. 1978, 19, 669–705. [Google Scholar] [CrossRef]
  32. Hardarson, B.S.; Einarsson, G.M.; Kristjánsson, B.R.; Gunnarsson, G.; Helgadóttir, H.M.; Franzson, H.; Árnason, K.; Ágústsson, K.; Gunnlaugsson, E. Geothermal Reinjection at the Hengill Triple Junction, SW Iceland. In Proceedings of the World Geothermal Congress, Bali, Indonesia, 25–29 April 2010. [Google Scholar]
  33. Árnason, K.; Eysteinsson, H.; Hersir, G.P. Joint 1D inversion of TEM and MT data and 3D inversion of MT data in the Hengill area, SW Iceland. Geothermics 2010, 39, 13–34. [Google Scholar] [CrossRef]
  34. Saemundsson, K. Hengill, Geological Map (Bedrock) 1:50.000; National Energy Authority and Iceland Geodetic Survey: Reykjavík, Iceland, 1995. [Google Scholar]
  35. Franzson, H.; Kristjánsson, B.R.; Gunnarsson, G.; Björnsson, G.; Hjartarson, A.; Steingrímsson, B.; Gunnlaugsson, E.; Gíslason, G. The Hengill–Hellisheiði geothermal field. Development of a conceptual geothermal model. In Proceedings of the World Geothermal Congress, Antalya, Turkey, 24–29 April 2005. [Google Scholar]
  36. Haraldsdóttir, S.H.; Franzson, H. Viðnám á Suðurhluta Hengilssvæðis. Samanburður Borholumælinga, Niðurstaðna úr TEM-MT og Ummyndunar; ÍSOR-2011/075; Iceland GeoSurvey: Reykjavík, Iceland, 2011. [Google Scholar]
  37. Snaebjörnsdóttir, S.Ó. Jarðfræði og Jarðhitaummyndun við Vesturjaðar Sigdældar Hengils. Master’s Thesis, University of Iceland, Reykjavík, Iceland, 2011. [Google Scholar]
  38. Gunnarsdóttir, S.H. Jarðfræði og Ummyndun í Nágrenni Reykjafells á Hellisheiði. Master’s Thesis, University of Iceland, Reykjavík, Iceland, 2012. [Google Scholar]
  39. Saemundsson, K.; Sigurgeirsson, M.Á.; Hjartarson, Á.; Kaldal, I.; Kristinsson, S.G.; Víkingsson, S. Geological Map of Southwest Iceland, 1:100000, 2nd ed.; Iceland GeoSurvey: Reykjavík, Iceland, 2016. [Google Scholar]
  40. Weisenberger, T.B.; Einarsson, G.M.; Hardaarson, B.S.; Níelsson, S. Lithostratigraphic Model of the Reykjanes Geothermal Field. In Iceland GeoSurvey Short Report; ÍSOR-16076; Orkustofnun: Reykjavík, Iceland, 2016. [Google Scholar]
  41. Franzson, H.; Thordarson, S.; Bjornsson, G.; Gudlaugsson, S.T.; Richter, B.; Fridleifsson, G.O.; Thorhallsson, S. Reykjanes high-temperature field, SW-Iceland. Geology and hydrothermal alteration of well RN-10. In Proceedings of the 27th Workshop on Geothermal Reservoir Engineering, Stanford University, Stanford, CA, USA, 28–30 January 2002. SGP-TR-171. [Google Scholar]
  42. Tómasson, J.; Kristmannsdóttir, H. High temperature alteration minerals and thermal brine, Reykjanes, Iceland. Contrib. Miner. Petrol. 1972, 36, 123–134. [Google Scholar] [CrossRef]
  43. Marks, N.; Schiffman, P.; Zierenberg, R.A. High-grade contact metamorphism in the Reykjanes geothermal system: Implications for fluid-rock interactions at mid-oceanic ridge spreading centers. Geochem. Geophy. Geosy. 2011, 12, Q08007. [Google Scholar] [CrossRef]
  44. Arnórsson, S. Major element chemistry of the geothermal sea-water at Reykjanes and Svartsengi, Iceland. Miner. Mag. 1978, 42, 209–220. [Google Scholar] [CrossRef] [Green Version]
  45. Arnórsson, S. Geothermal systems in Iceland: Structure and conceptual models–I. High temperature areas. Geothermics 1995, 24, 561–602. [Google Scholar] [CrossRef]
  46. Ólafsson, J.; Riley, J.P. Geochemical studies on the thermal brine from Reykjanes. Chem. Geol. 1978, 21, 219–237. [Google Scholar] [CrossRef]
  47. Óskarsson, F.; Friðriksson, Þ.; Þorbjörnsson, D. Geochemical monitoring of the Reykjanes geothermal reservoir 2003 to 2013. In Proceedings of the World Geothermal Congress, Melbourne, Australia, 16–24 April 2015. [Google Scholar]
  48. Jónsson, S.S.; Sigurgeirsson, M.Á.; Sigurðsson, Ó.; Ingólfsson, H. Reykjanes–Hola RN-15, 3. áfangi: Borun Vinnsluhluta frá 804 m í 2507 m Dýpi; ÍSOR-2010/050; Iceland GeoSurvey: Reykjavík, Iceland, 2010. [Google Scholar]
  49. Fridleifsson, G.Ó.; Elders, W.A.; Zierenberg, R.A.; Stefánsson, A.; Fowler, A.P.G.; Weisenberger, T.B.; Harðarson, B.S.; Mesfin, K.G. The Iceland Deep Drilling Project 4.5km deep well, IDDP-2, in the seawater-recharged Reykjanes geothermal field in SW Iceland has successfully reached its supercritical target. Sci. Drill. 2017, 23, 1–12. [Google Scholar] [CrossRef] [Green Version]
  50. Fridleifsson, G.Ó.; Elders, W.A.; Zierenberg, R.A.; Fowler, A.P.G.; Weisenberger, T.B.; Mesfin, K.G.; Sigurðsson, Ó.; Níelsson, S.; Einarsson, G.; Óskarsson, F.; et al. The Iceland Deep Drilling Project at Reykjanes: Drilling into the root zone of a black smoker analog. J. Volcanol. Geotherm. Res. 2020, 391, 106435. [Google Scholar] [CrossRef]
  51. Weisenberger, T.B.; Harðarson, B.S.; Kästner, F.; Gunnarsdóttir, S.H.; Tulinius, H.; Guðmundsdóttir, H.; Einarsson, G.M.; Pétursson, F.; Vilhjálmsson, S.; Stefánsson, H.Ö.; et al. Well Report–RN-15/IDDP-2, Drilling in Reykjanes–Phase 4 and 5; ÍSOR-2017/016; Iceland GeoSurvey: Reykjavík, Iceland, 2017. [Google Scholar]
  52. Haraldsdótt ir, S.H. Processing Lithological Well Logs from Svartensgi and Reykjanes; ÍSOR-2016/005; Iceland GeoSurvey: Reykjavík, Iceland, 2016. [Google Scholar]
  53. Christidis, G.E. Industrial clays. EMU Notes Miner. 2011, 9, 341–414. [Google Scholar] [CrossRef]
  54. Ammann, L.; Bergaya, F.; Lagalym, G. Determination of the cation exchange capacity of clays with copper complexes revisited. Clay Miner. 2005, 40, 441–453. [Google Scholar] [CrossRef]
  55. Bergaya, F.; Vayer, M. CEC of clays: Measurement by adsorption of a copper ethylenediamine complex. Appl. Clay Sci. 1997, 12, 275–280. [Google Scholar] [CrossRef]
  56. Meier, L.P.; Kahr, G. Determination of the Cation Exchange Capacity (CEC) of Clay Minerals Using the Complexes of Copper(II) Ion with Triethylenetetramine and Tetraethylenepentamine. Clays Clay Miner. 1999, 47, 386–388. [Google Scholar] [CrossRef]
  57. Bergaya, F.; Lagaly, G.; Vayer, M. Chapter 12.10 Cation and Anion Exchange. In Developments in Clay Science; Bergaya, F., Theng, B.K.G., Lagaly, G., Eds.; Elsevier: Amsterdam, The Netherlands, 2006; Volume 1, pp. 979–1001. [Google Scholar] [CrossRef]
  58. Ciesielski, H.; Sterckeman, T. Determination of cation exchange capacity and exchangeable cations in soils by means of cobalt hexamine trichloride. Effects of experimental conditions. Agronomie 1997, 17, 1–7. [Google Scholar] [CrossRef] [Green Version]
  59. Dohrmann, R.; Kaufhold, S. Three new, quick CEC methods for determining the amounts of exchangeable calcium cations in calcareous clays. Clays Clay Miner. 2009, 57, 338–352. [Google Scholar] [CrossRef]
  60. Kaufhold, S.; Dohrmann, R. Beyond the Methylene Blue Method: Determination of the Smectite Content using the Cutriene Method. Z. Angew. Geol. 2003, 49, 13–17. [Google Scholar]
  61. Steudel, A.; Weidler, P.; Schuhmann, R.; Emmerich, K. Cation exchange reactions of vermiculite with Cu-triethylenetetramine as affected by mechanical and chemical pretreatment. Clays Clay Miner. 2009, 57, 405–412. [Google Scholar] [CrossRef]
  62. Dohrmann, R.; Genske, D.; Karnland, O.; Kaufhold, S.; Kiviranta, L.; Olsson, S.; Plötze, M.; Sandén, T.; Sellin, P.; Svensson, D.; et al. Interlaboratory CEC and exchangeable cation study of betonite buffer materials: I. Cu (II)-triethylenetetramine method. Clays Clay Miner. 2012, 60, 162–175. [Google Scholar] [CrossRef]
  63. Kaufhold, S. Untersuchungen zur Eignung von Natürlich Alterierten Sowie mit Oxalsäure Aktivierten Bentoniten als Bleicherde für Pflanzenöle. Ph.D. Thesis, RWTH, Aachen, Germany, 2001. [Google Scholar]
  64. Kousehlar, M.; Weisenberger, T.B.; Tutti, F.; Mirnejad, H. Fluid control on low-temperature mineral formation in volcanic rocks of Kahrizak, Iran. Geofluids 2012, 12, 295–311. [Google Scholar] [CrossRef]
  65. Carroll, D. Ion exchange in clays and other minerals. Geol. Soc. Am. Bull. 1959, 70, 749–779. [Google Scholar] [CrossRef]
  66. Kristmannsdóttir, H.; Tómasson, J. Zeolites zones in geothermal areas in Iceland. In Natural Zeolites; Occurrence, Properties, Use; Sand, L.B., Mumpton, F.A., Eds.; Pergamon Press: New York, NY, USA, 1978; pp. 277–284. [Google Scholar]
  67. Neuhoff, P.S.; Fridriksson, T.; Bird, D.K. Zeolite parageneses in the North Atlantic Igneous Provinces: Implications for geotectonics and groundwater quality of basaltic crust. Int. Geol. Rev. 2000, 42, 15–44. [Google Scholar] [CrossRef]
  68. Weisenberger, T.; Bucher, K. Mass transfer and porosity evolution during low temperature water-rock interaction in gneisses of the Simano nappe: Arvigo, Val Calanca, Swiss Alps. Contrib. Miner. Petrol. 2011, 162, 61–81. [Google Scholar] [CrossRef]
  69. Weisenberger, T.; Spürgin, S. Zeolites in alkaline rocks of the Kaiserstuhl volcanic complex, SW Germany-new micropobe investigation and their relationship to the host rock. Geol. Belg. 2009, 12, 75–91. [Google Scholar]
  70. Schiffman, P.; Southard, R.J. Cation exchange capacity of layer silicates and palagonitized glass in mafic volcanic rocks; a comparative study of bulk extraction and in situ techniques. Clays Clay Miner. 1996, 44, 624–634. [Google Scholar] [CrossRef]
  71. Meunier, A. Clays; Springer: Berlin, Germany, 2005; p. 472. [Google Scholar]
  72. Dunoyer de Segonzac, G. Les mineraux argileux dans la diagenese. Passage au metamorphisme. Mém. Serv Carte Géol. Als. Lorr. 1969, 29, 1–320. [Google Scholar]
  73. Srodon, J. X-ray powder diffraction of randomly interstratified illite/smectite in mixtures with discrete illite. Clays Clay Miner. 1984, 16, 297–304. [Google Scholar] [CrossRef]
  74. Hower, J.; Mowatt, T.C. The mineralogy of illites and mixed-layer illite/montmorillonites. Am. Min. 1966, 51, 825–854. [Google Scholar]
  75. Hower, J.; Eslinger, E.V.; Hower, M.E.; Perry, E.A. Mechanism of burial metamorphism of argillaceous sediments: 1. Mineralogical and chemical evidence. Geol. Soc. Am. Bull. 1976, 87, 725–737. [Google Scholar] [CrossRef]
  76. Boles, J.R.; Franks, S.G. Clay diagenesis in Wilcox sandstones of Southwest Texas; implications of smectite diagenesis on sandstone cementation. J. Sediment. Res. 1979, 49, 55–70. [Google Scholar] [CrossRef]
  77. Srodon, J.; Eberl, D.D. Illite. Rev. Miner. Geochem. 1984, 13, 495–544. [Google Scholar]
  78. Flóvenz, Ó.G.; Karlsdóttir, R. TEM-resistivity image of a geothermal field in N-Iceland and the relation of the resistivity with lithology and temperature. In Proceedings of the World Geothermal Congress, Kyushu-Tohoku, Japan, 28 May–10 June 2000. [Google Scholar]
  79. Árnason, K.; Magnússon, I.Þ. Niðurstöður Viðnámsmælinga í Kröflu; Report OS-2001/062; Orkustofnun: Reykjavík, Iceland, 2001. [Google Scholar]
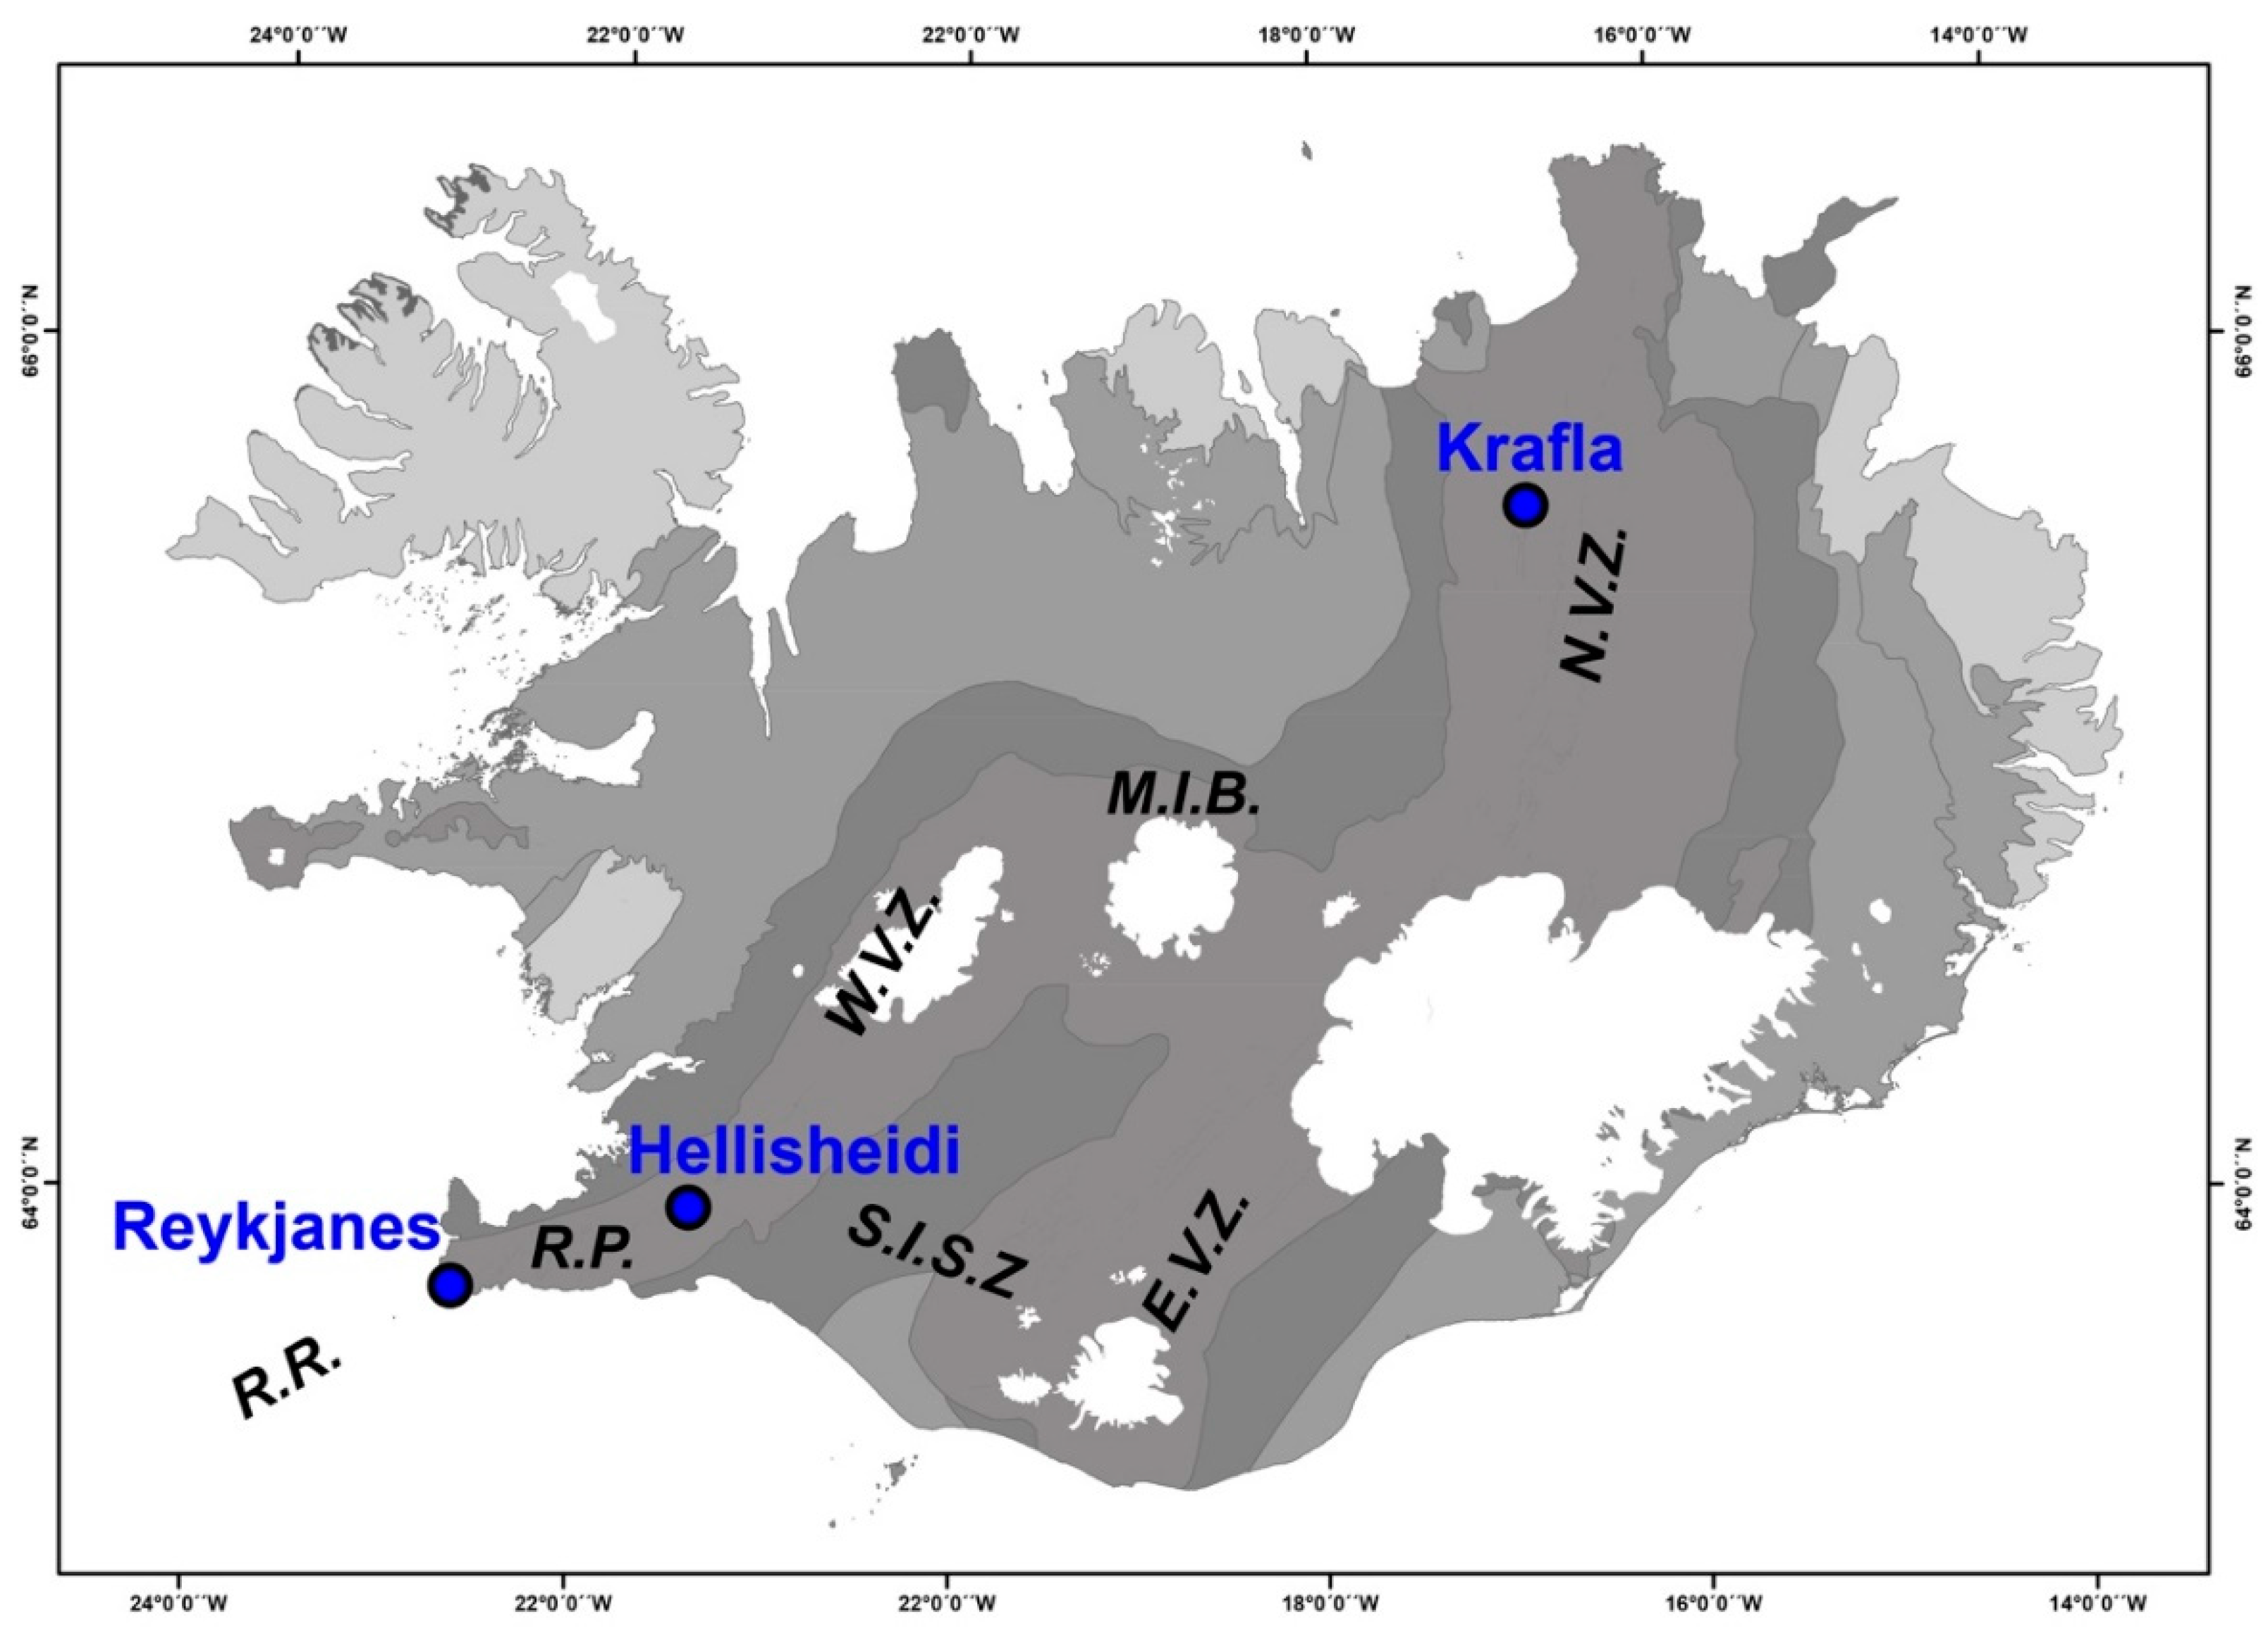
Figure 1. Simplified geological map of Iceland [17]. The darker the color, the younger the stratigraphic unit. The location of the Krafla, Hellisheidi and Reykjanes geothermal fields are marked by circles. The main volcanic provinces and structural zones are marked as: N.V.Z: North Volcanic Zone, M.I.B.: Mid Iceland Belt, W.V.Z.: West Volcanic Zone, E.V.Z.: East Volcanic Zone, R.P.: Reykjanes Peninsula, R.R.: Reykjanes Ridge, S.I.S.Z.: South Iceland Seismic Zone.
Energies 13 05730 g001
Figure 2. Stability fields of secondary minerals, including chemical vectors, primary minerals and their alteration product for basaltic rocks in Iceland. The sketch in the upper part shows a prograde mineral sequence as observed in Iceland geothermal system at low-temperature conditions (modified after Kousehlar et al. [64]).
Energies 13 05730 g002
Figure 3. Depth profiles of the studied wells: KJ-18 (Krafla), HE-46 and HE-42 (Hellisheidi) and RN-15 (Reykjanes), showing the elaborated alteration zones, measured cation-exchange capacity (CEC) values (red squares) and associated trend line (black line), and measured electrical resistivity logs (blue for HE-46, HE-42, RN-15 and multiple colors for KJ-18, whereas warmer colors represents warmer well conditions during the heating up). Alteration zones adapted from [24,37,38]. Resistivity logs adapted from [27,37,38].
Energies 13 05730 g003
Figure 4. Correlation of the measured CEC and conductivity at similar given depth and corresponding trend lines. The left graph shows data from wells that are located within meteoric systems. The right graph shows the data from a well within the Reykjanes seawater-dominated geothermal system.
Energies 13 05730 g004
Figure 5. (a) Normalized core sample conductivity measurements at 1 Hz versus pore-fluid conductivity, adapted from [48] and the corresponding CEC results for the seven core samples (Table 1). (b) Iso-electrical points as a function of CEC (similar symbols used as in (a)). The dash line shows the trend-line for all measurements.
Energies 13 05730 g005
Figure 6. (a) Downhole temperature versus chlorite and smectite content, respectively, within interstratified chlorite/smectite minerals from well NJ-15 within the Nesjavellir geothermal system [5]. (b) Downhole temperature versus illite and smectite content, respectively, within interstratified illite/smectite minerals from sedimentary basin [72,73].
Energies 13 05730 g006
Figure 7. (a) Back-scattered electron image showing prograde formation of mafic clay minerals within a vesicle of a basaltic lava flow in the Hvalfjördur area, SW Iceland. (b) Chlorite content of the interstratified chlorite/smectite minerals coating the vesicle wall. Numbers correspond to the stars in (a). Data based on Weisenberger and Selbekk [7].
Energies 13 05730 g007
Figure 8. (a) South-north lying resistivity cross-section through the Krafla high-temperature geothermal system, north Iceland. The location of the studied well KJ-18 is given. The resistivity structure is based on 1-D inversion of TEM sounding data adapted from Árnason and Magnússon [79]. The more detailed log profile of well KJ-18 is given to the right (b) including the resistivity log trend-line of the CEC results.
Energies 13 05730 g008
Table 1. Results of CEC analysis of the seven core samples.
Sample NoMass (g)Water Content (%)CCu-trien (mol)Absorbance (Blank)Absorbance (Supernatant Solution)CEC (meq/100 g)Alteration Zone
3a0.20042.050.00910.2340.2320.8chlorite
40.20060.830.00910.2340.2205.5chlorite
90.20000.630.00910.2340.2224.7chlorite
470.20070.450.00910.2340.2350unaltered
580.20061.250.00910.2340.20810.2smectite
610.20053.260.00910.2340.18021.7smectite
710.20070.060.00910.2340.2370unaltered
Publisher’s Note: MDPI stays neutral with regard to jurisdictional claims in published maps and institutional affiliations.