Method for Building Information Modeling Supported Project Control of Nearly Zero-Energy Building Delivery


Abstract
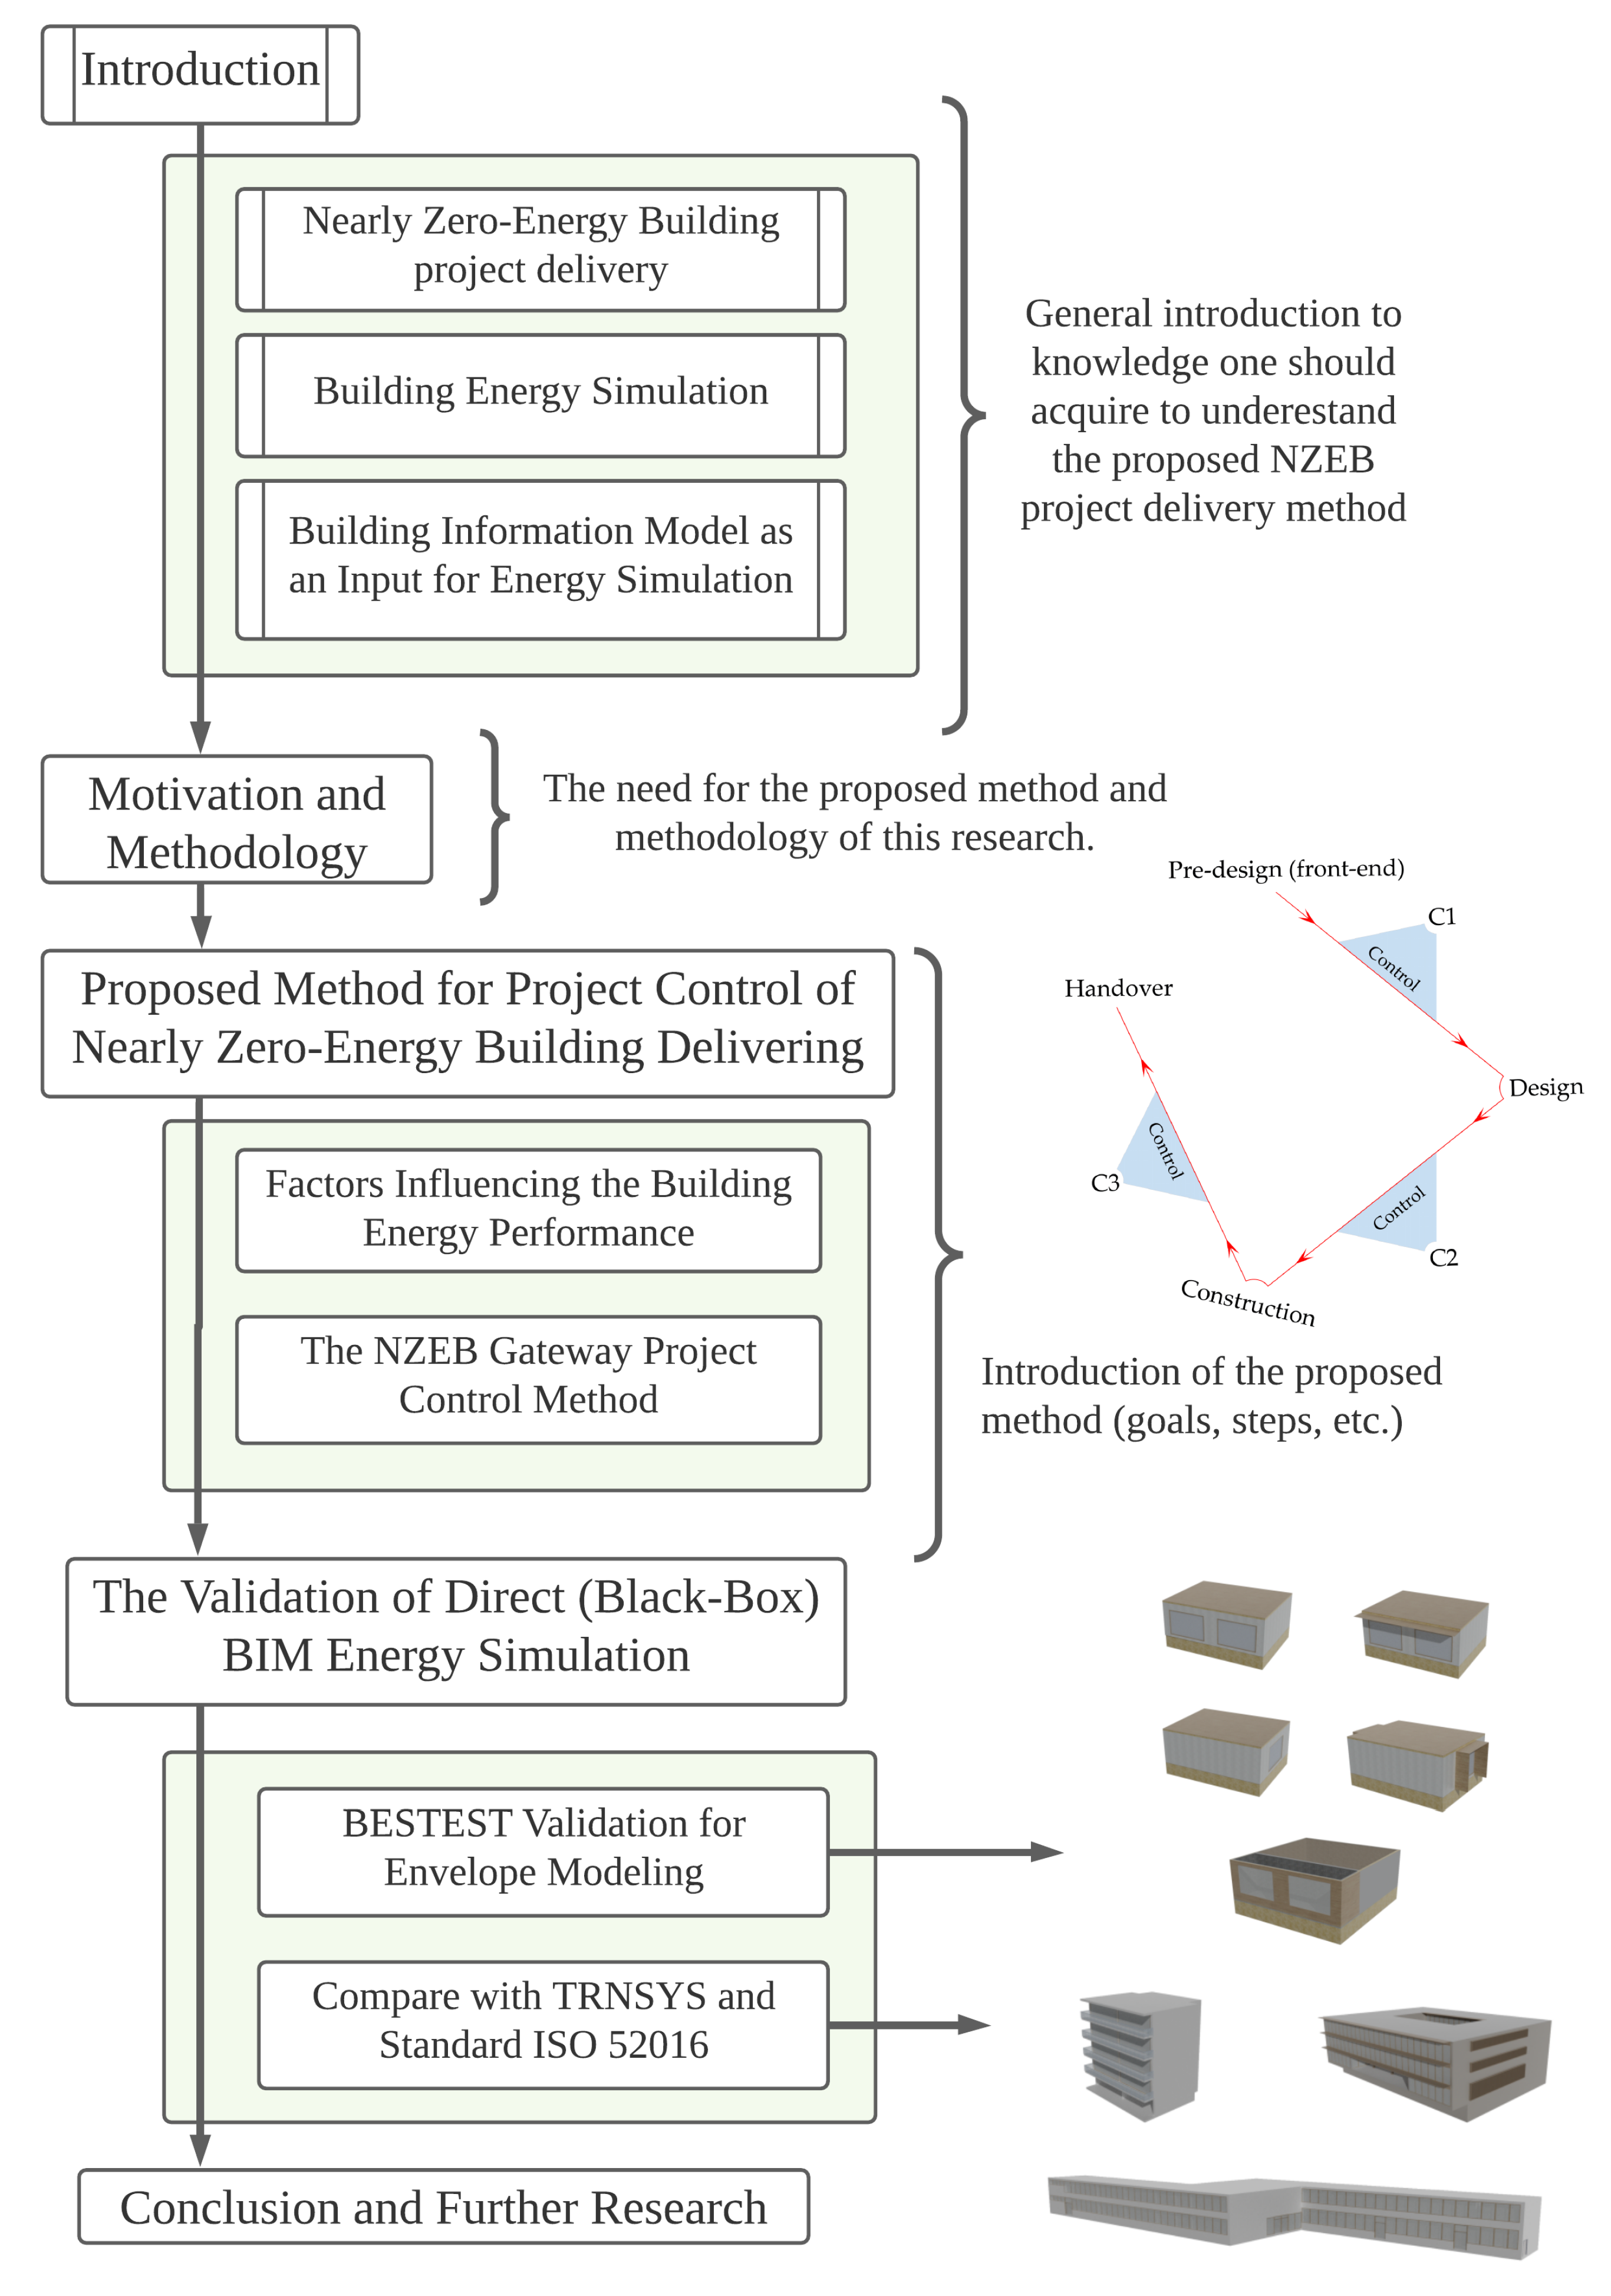
1. Introduction
1.1. Nearly Zero-Energy Building Project Delivery
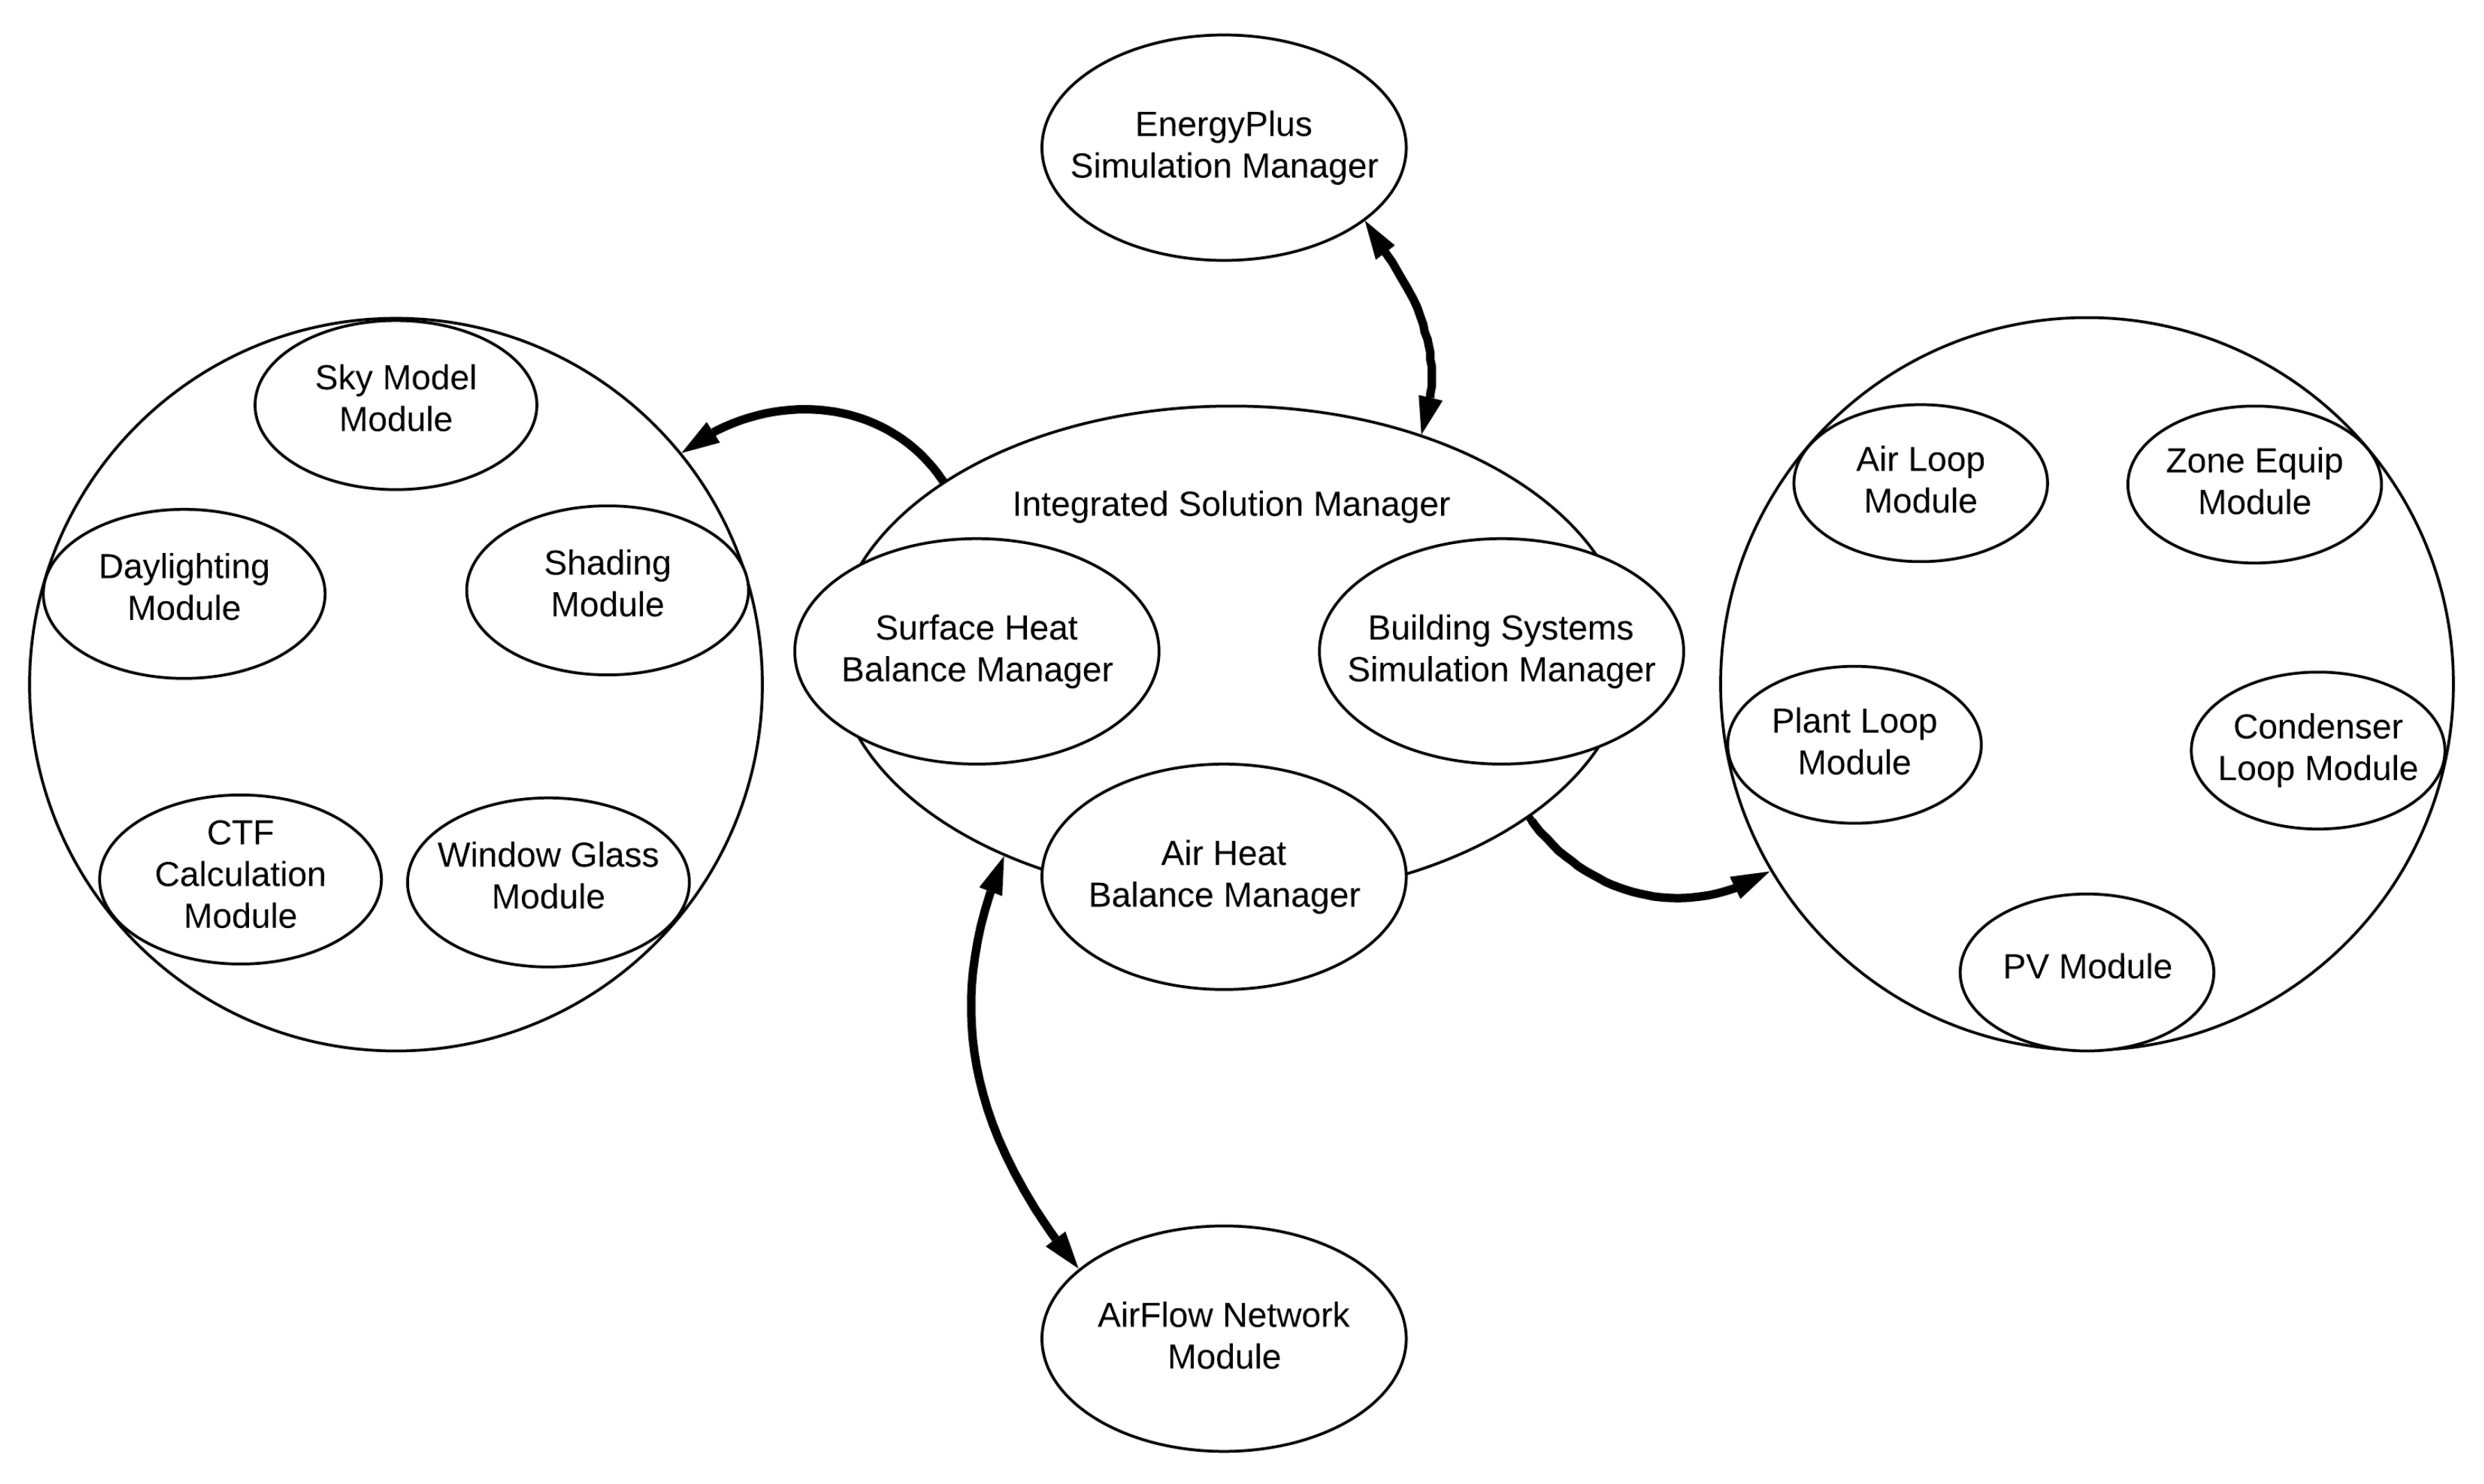
1.2. Building Energy Simulation
1.3. Building Information Model as an Input for Energy Simulation
2. Motivation and Methodology
3. Proposed Method for Project Control of Nearly Zero-Energy Building Delivery
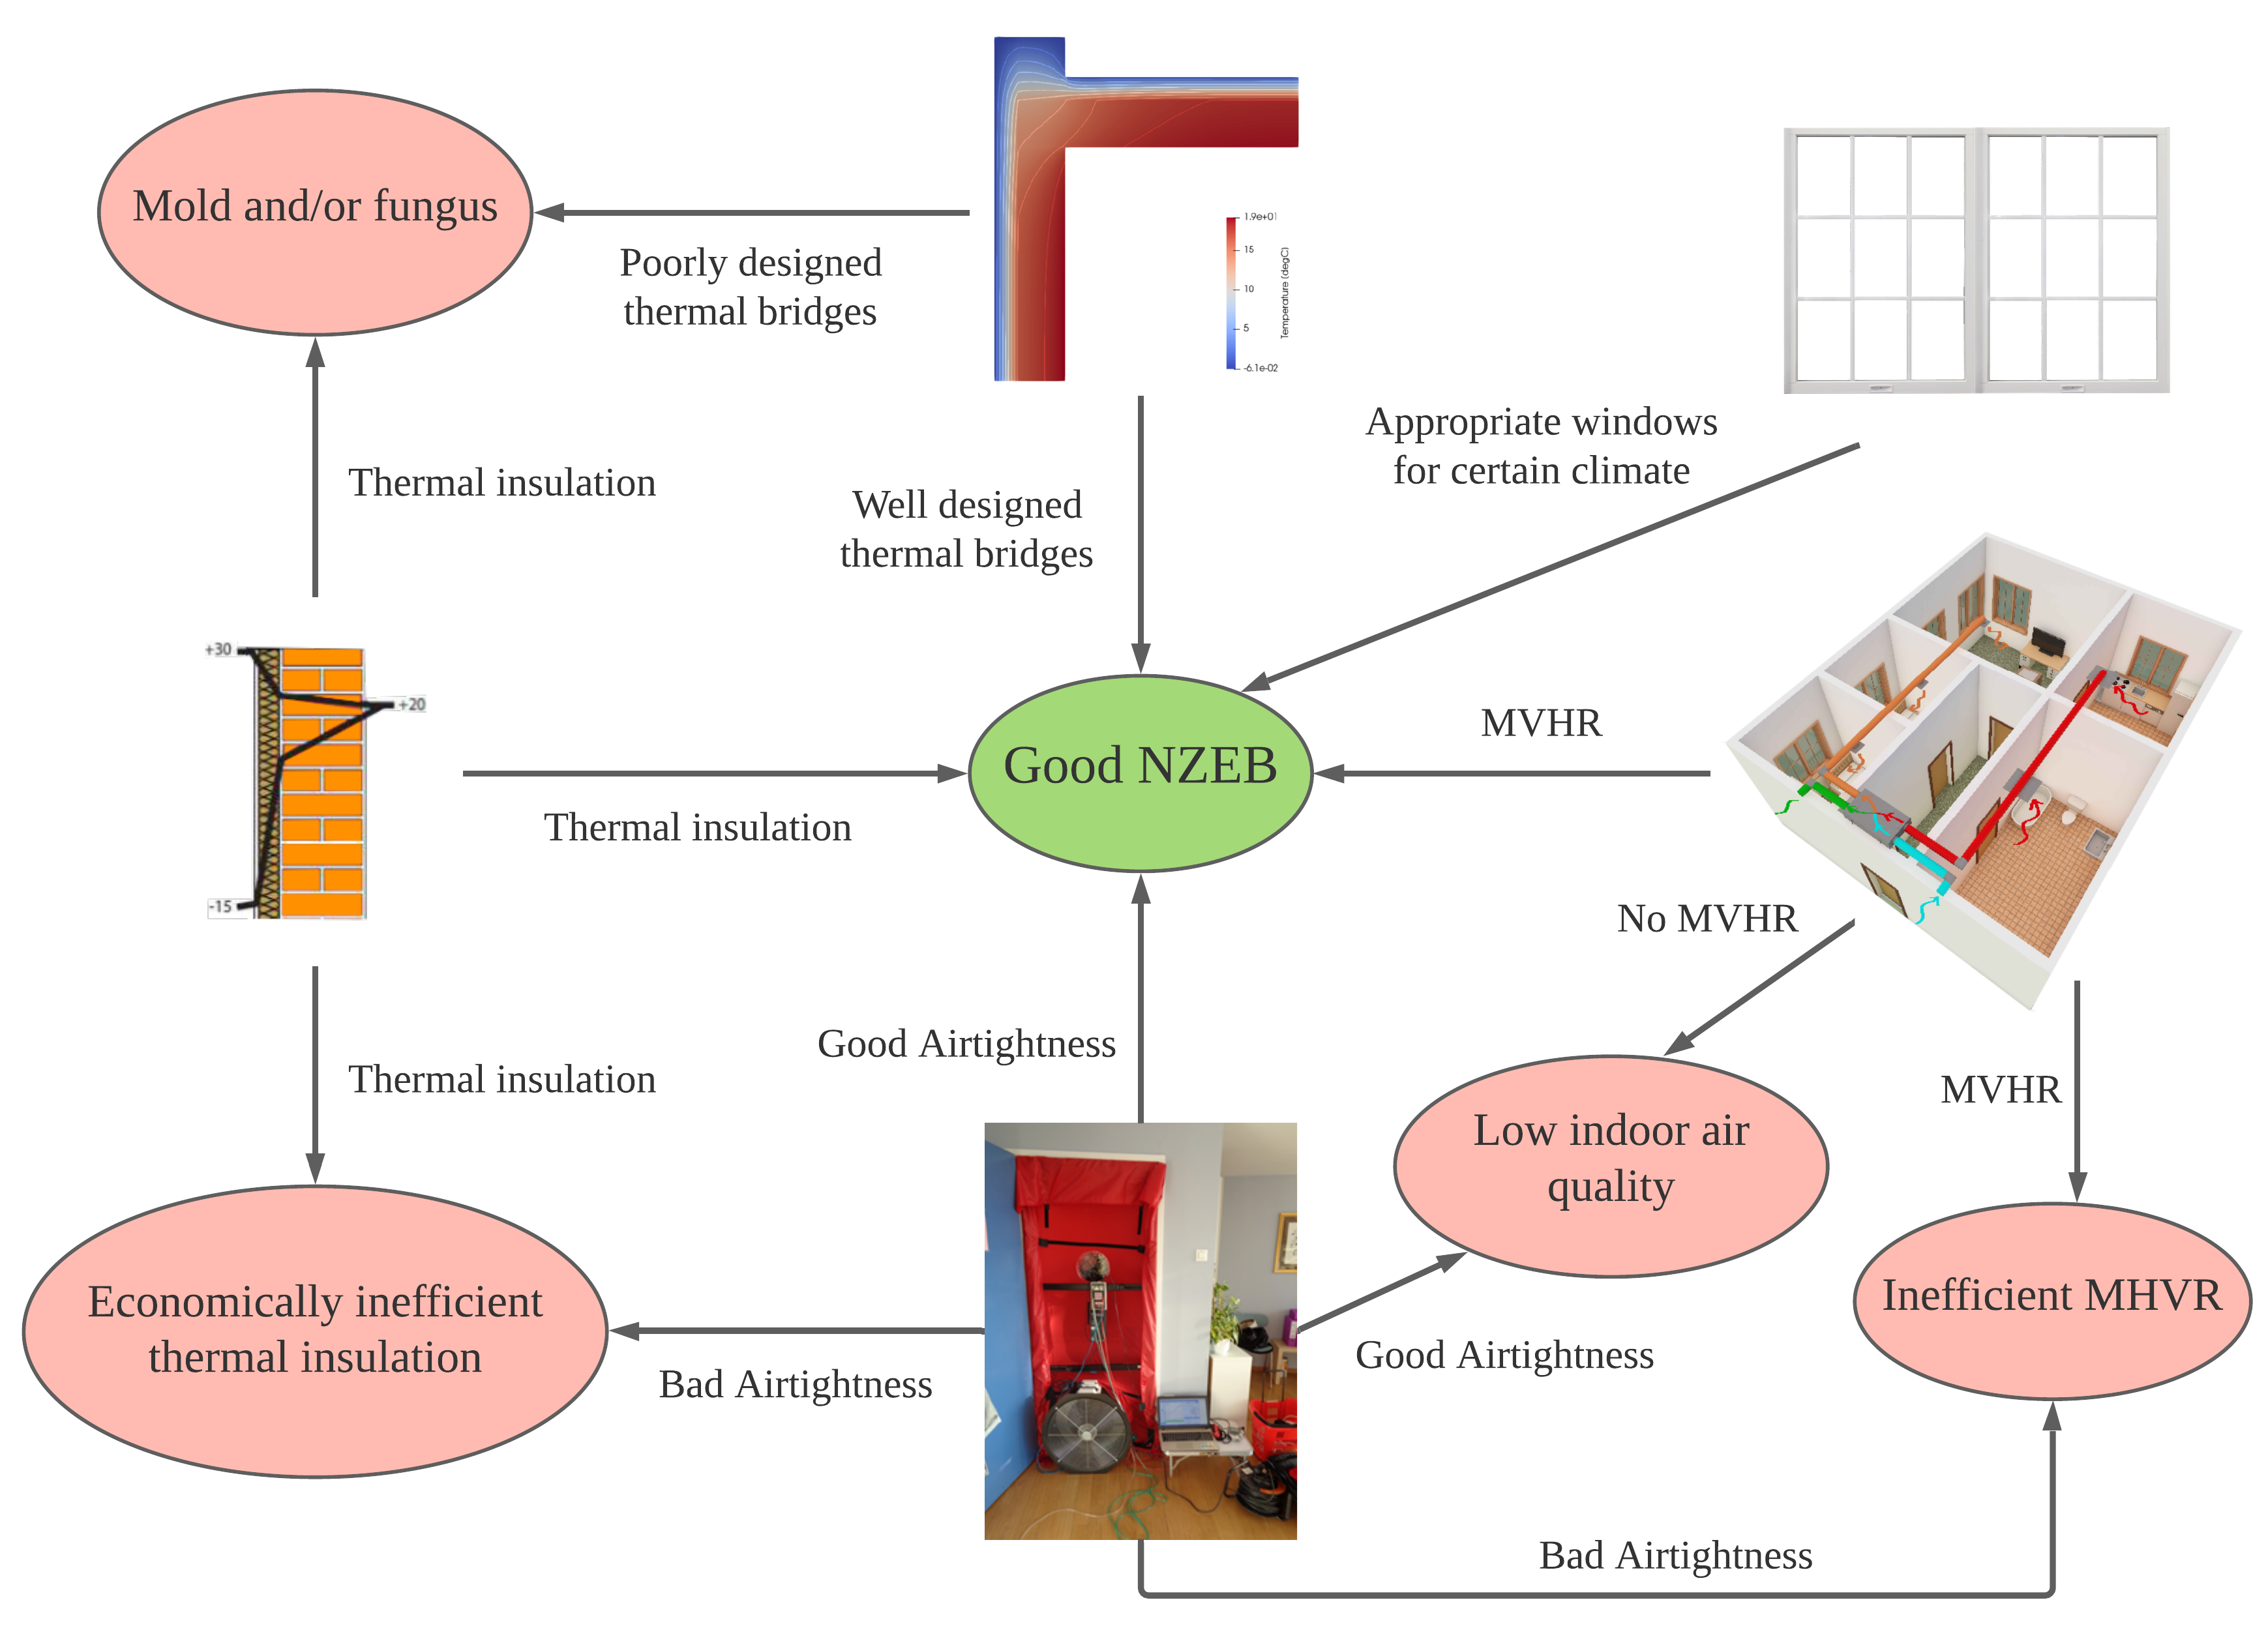
3.1. Factors Influencing the Building Energy Performance
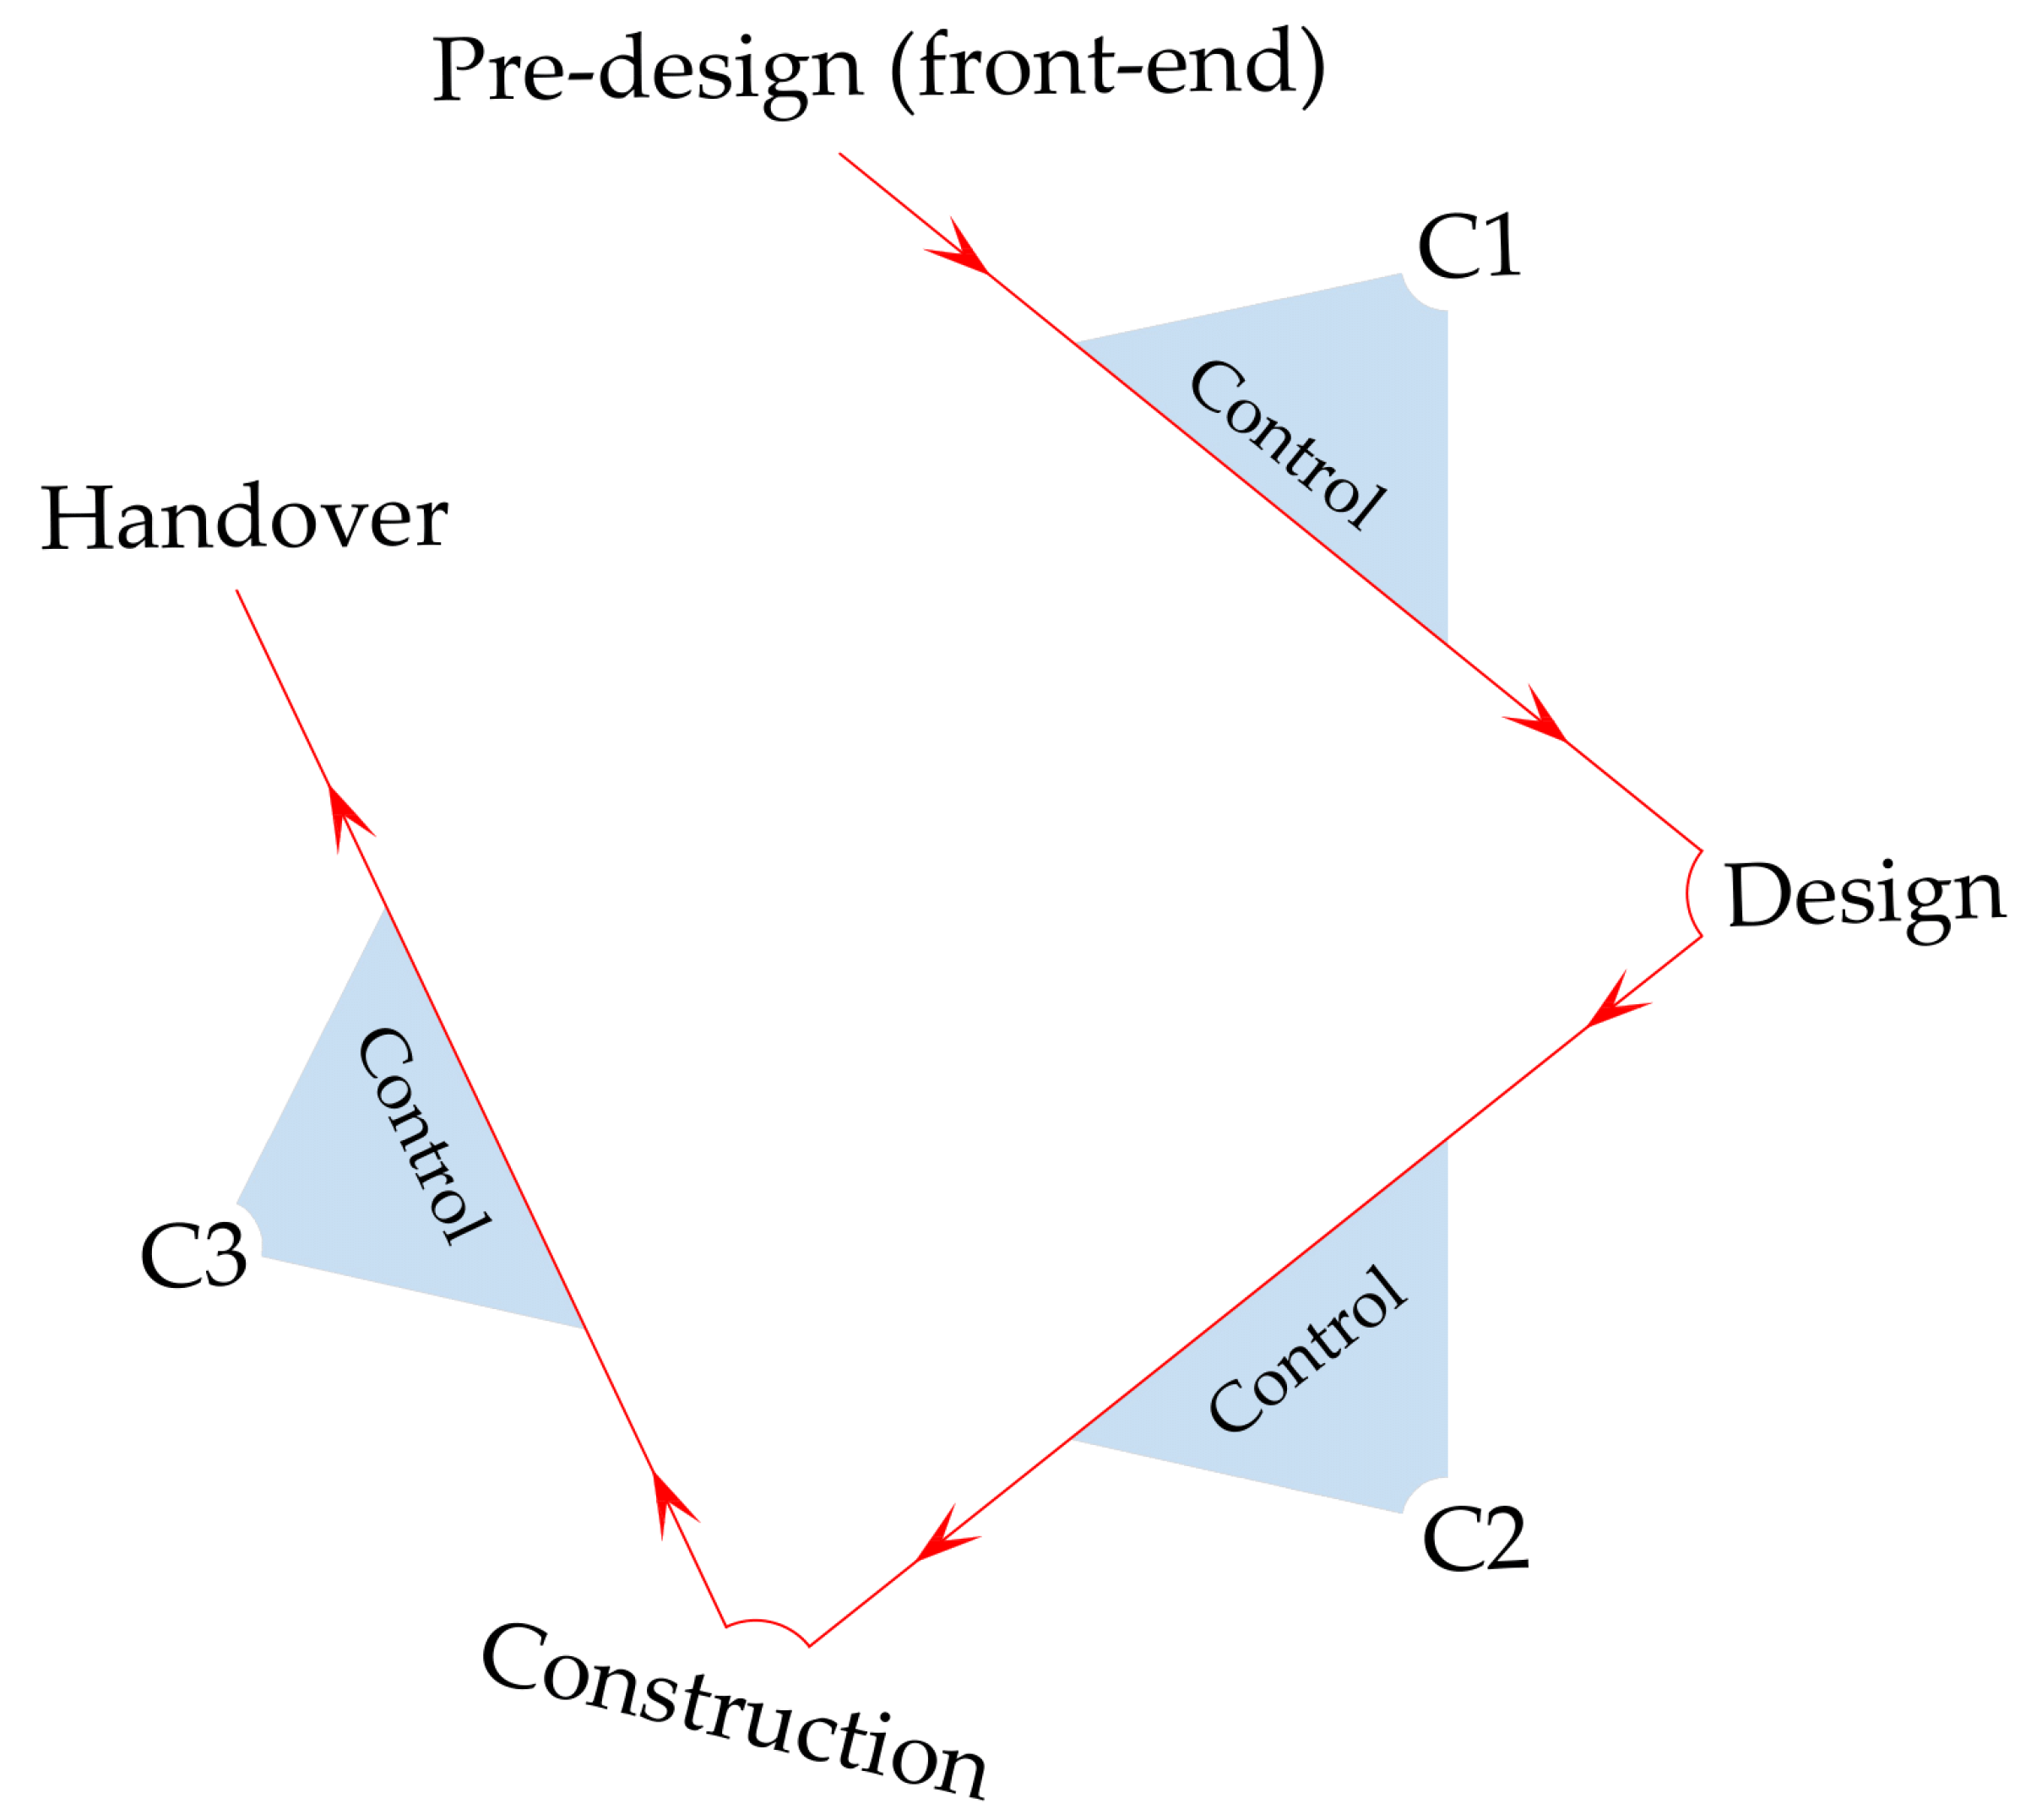
3.2. The Nearly Zero-Energy Building Gateway Project Control Method
4. The Validation of Direct (Black-Box) Building Information Modeling Energy Simulation
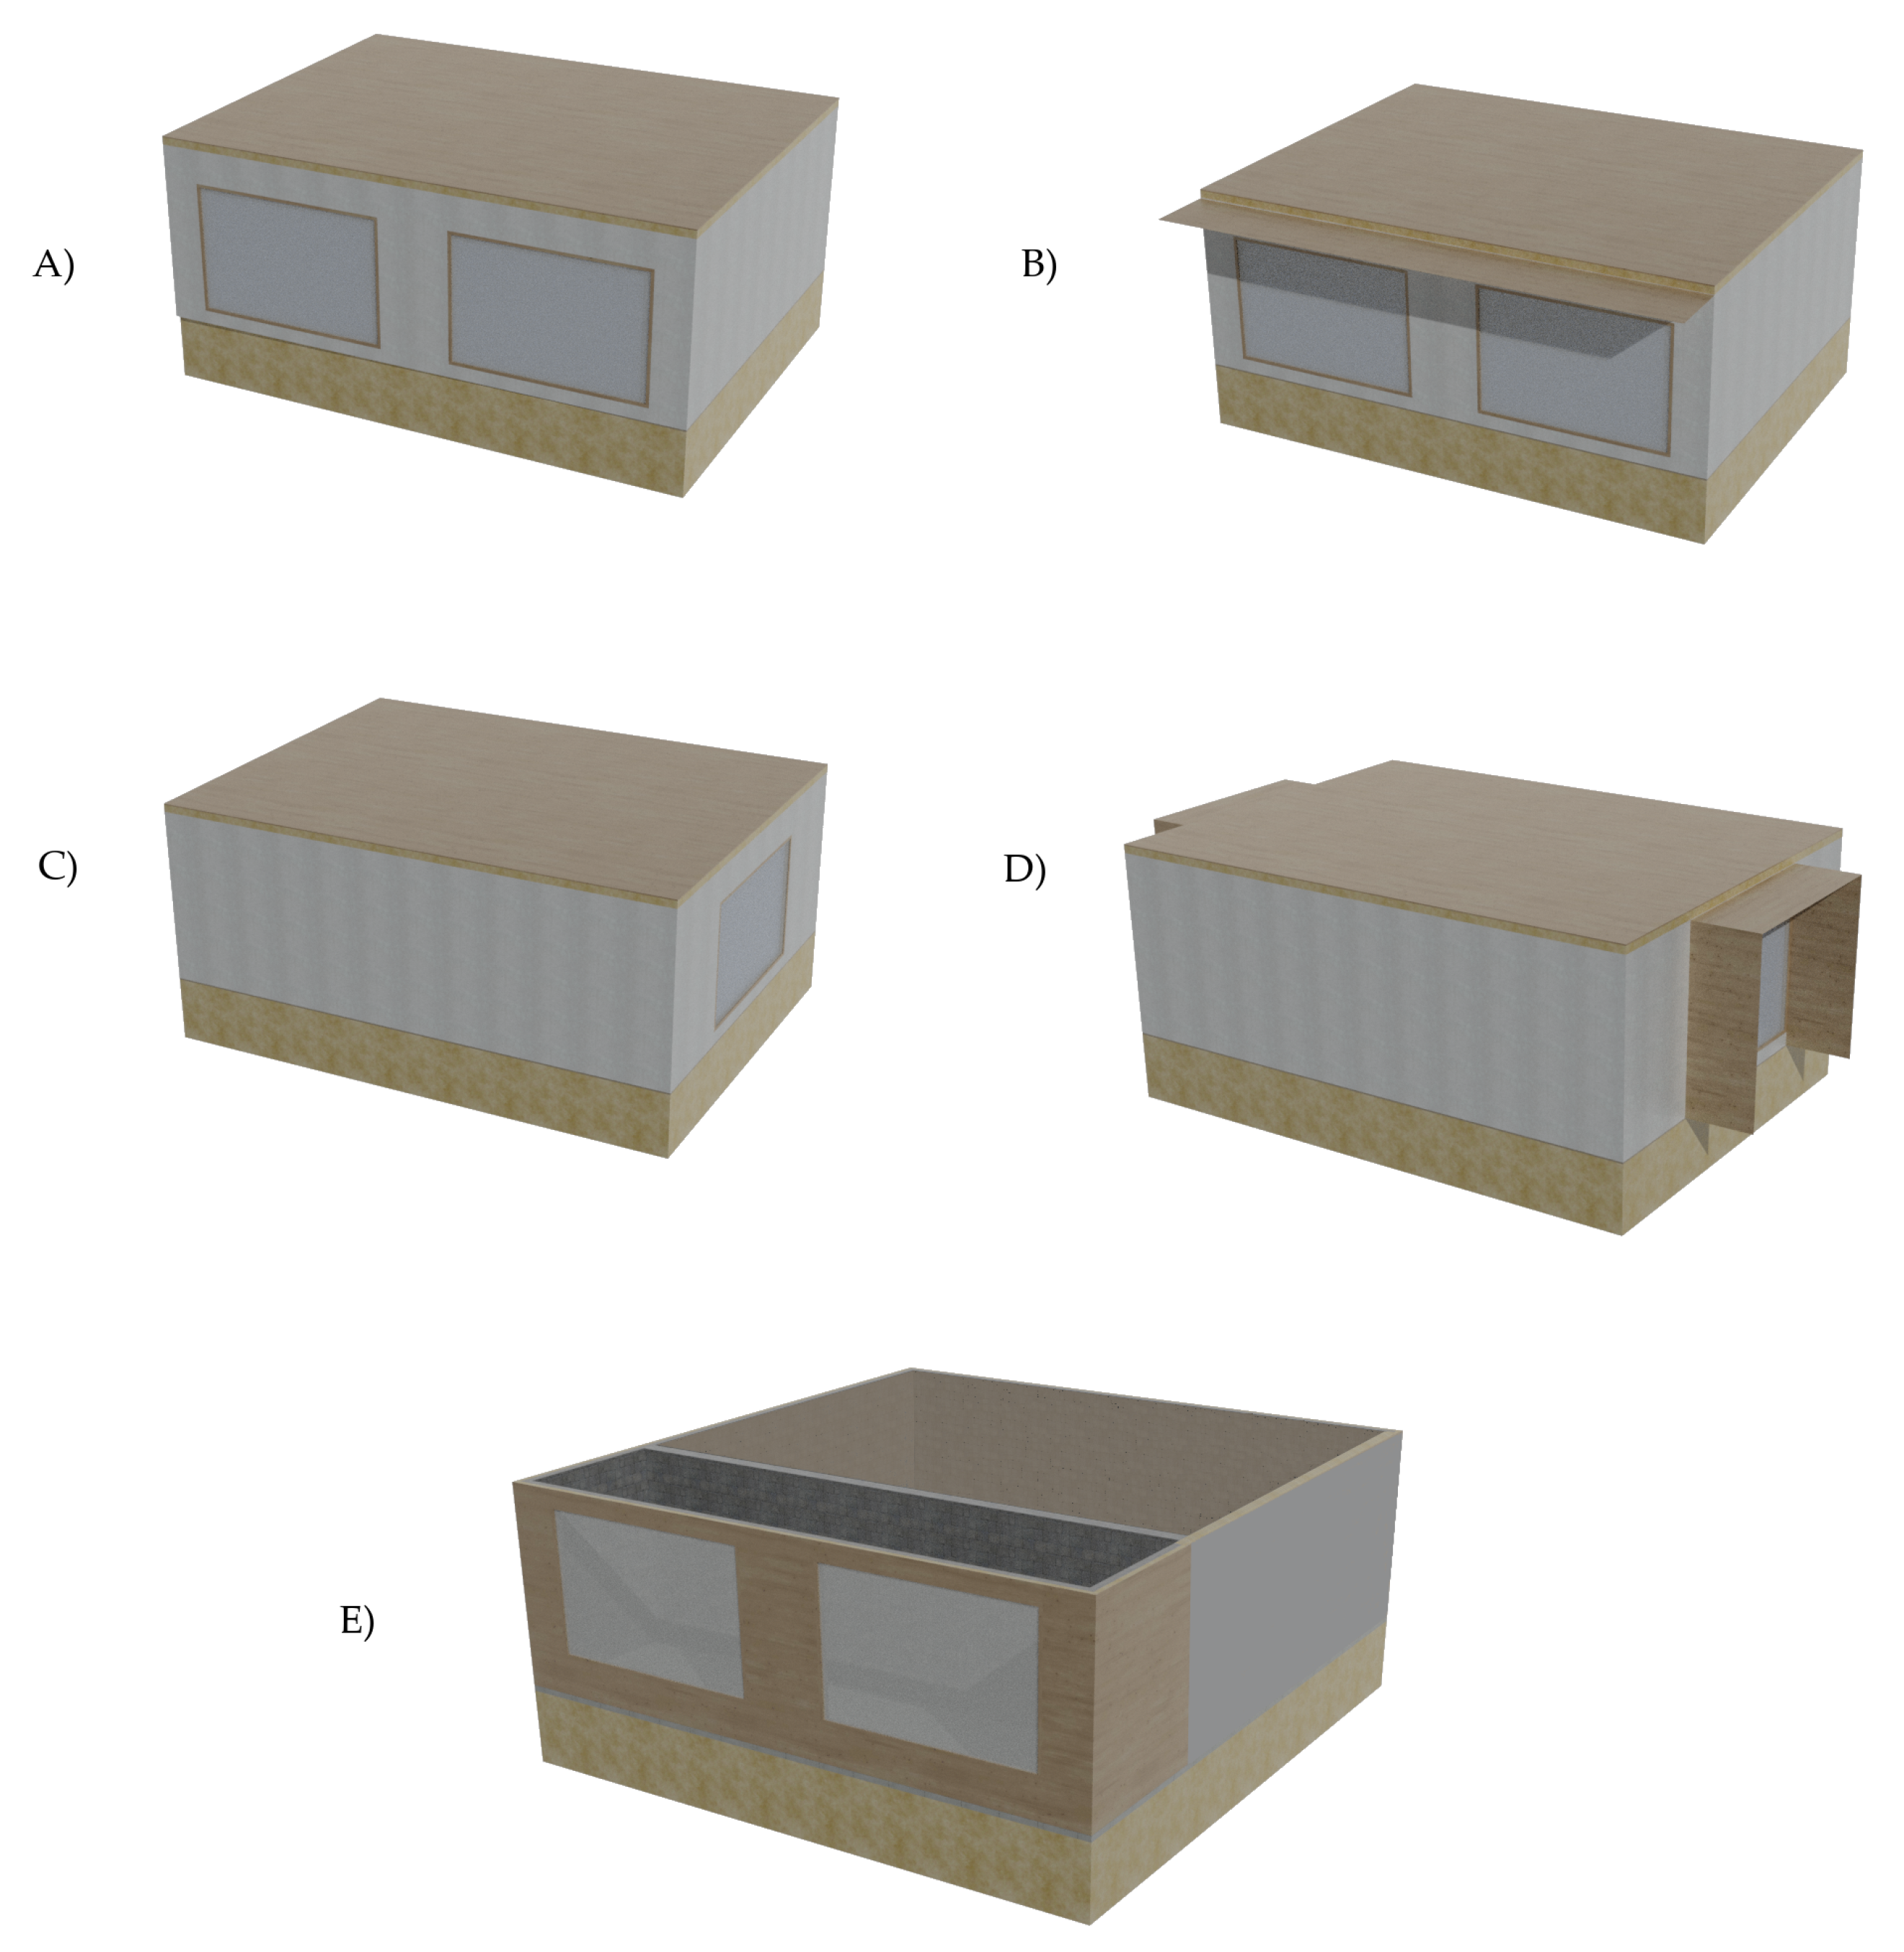
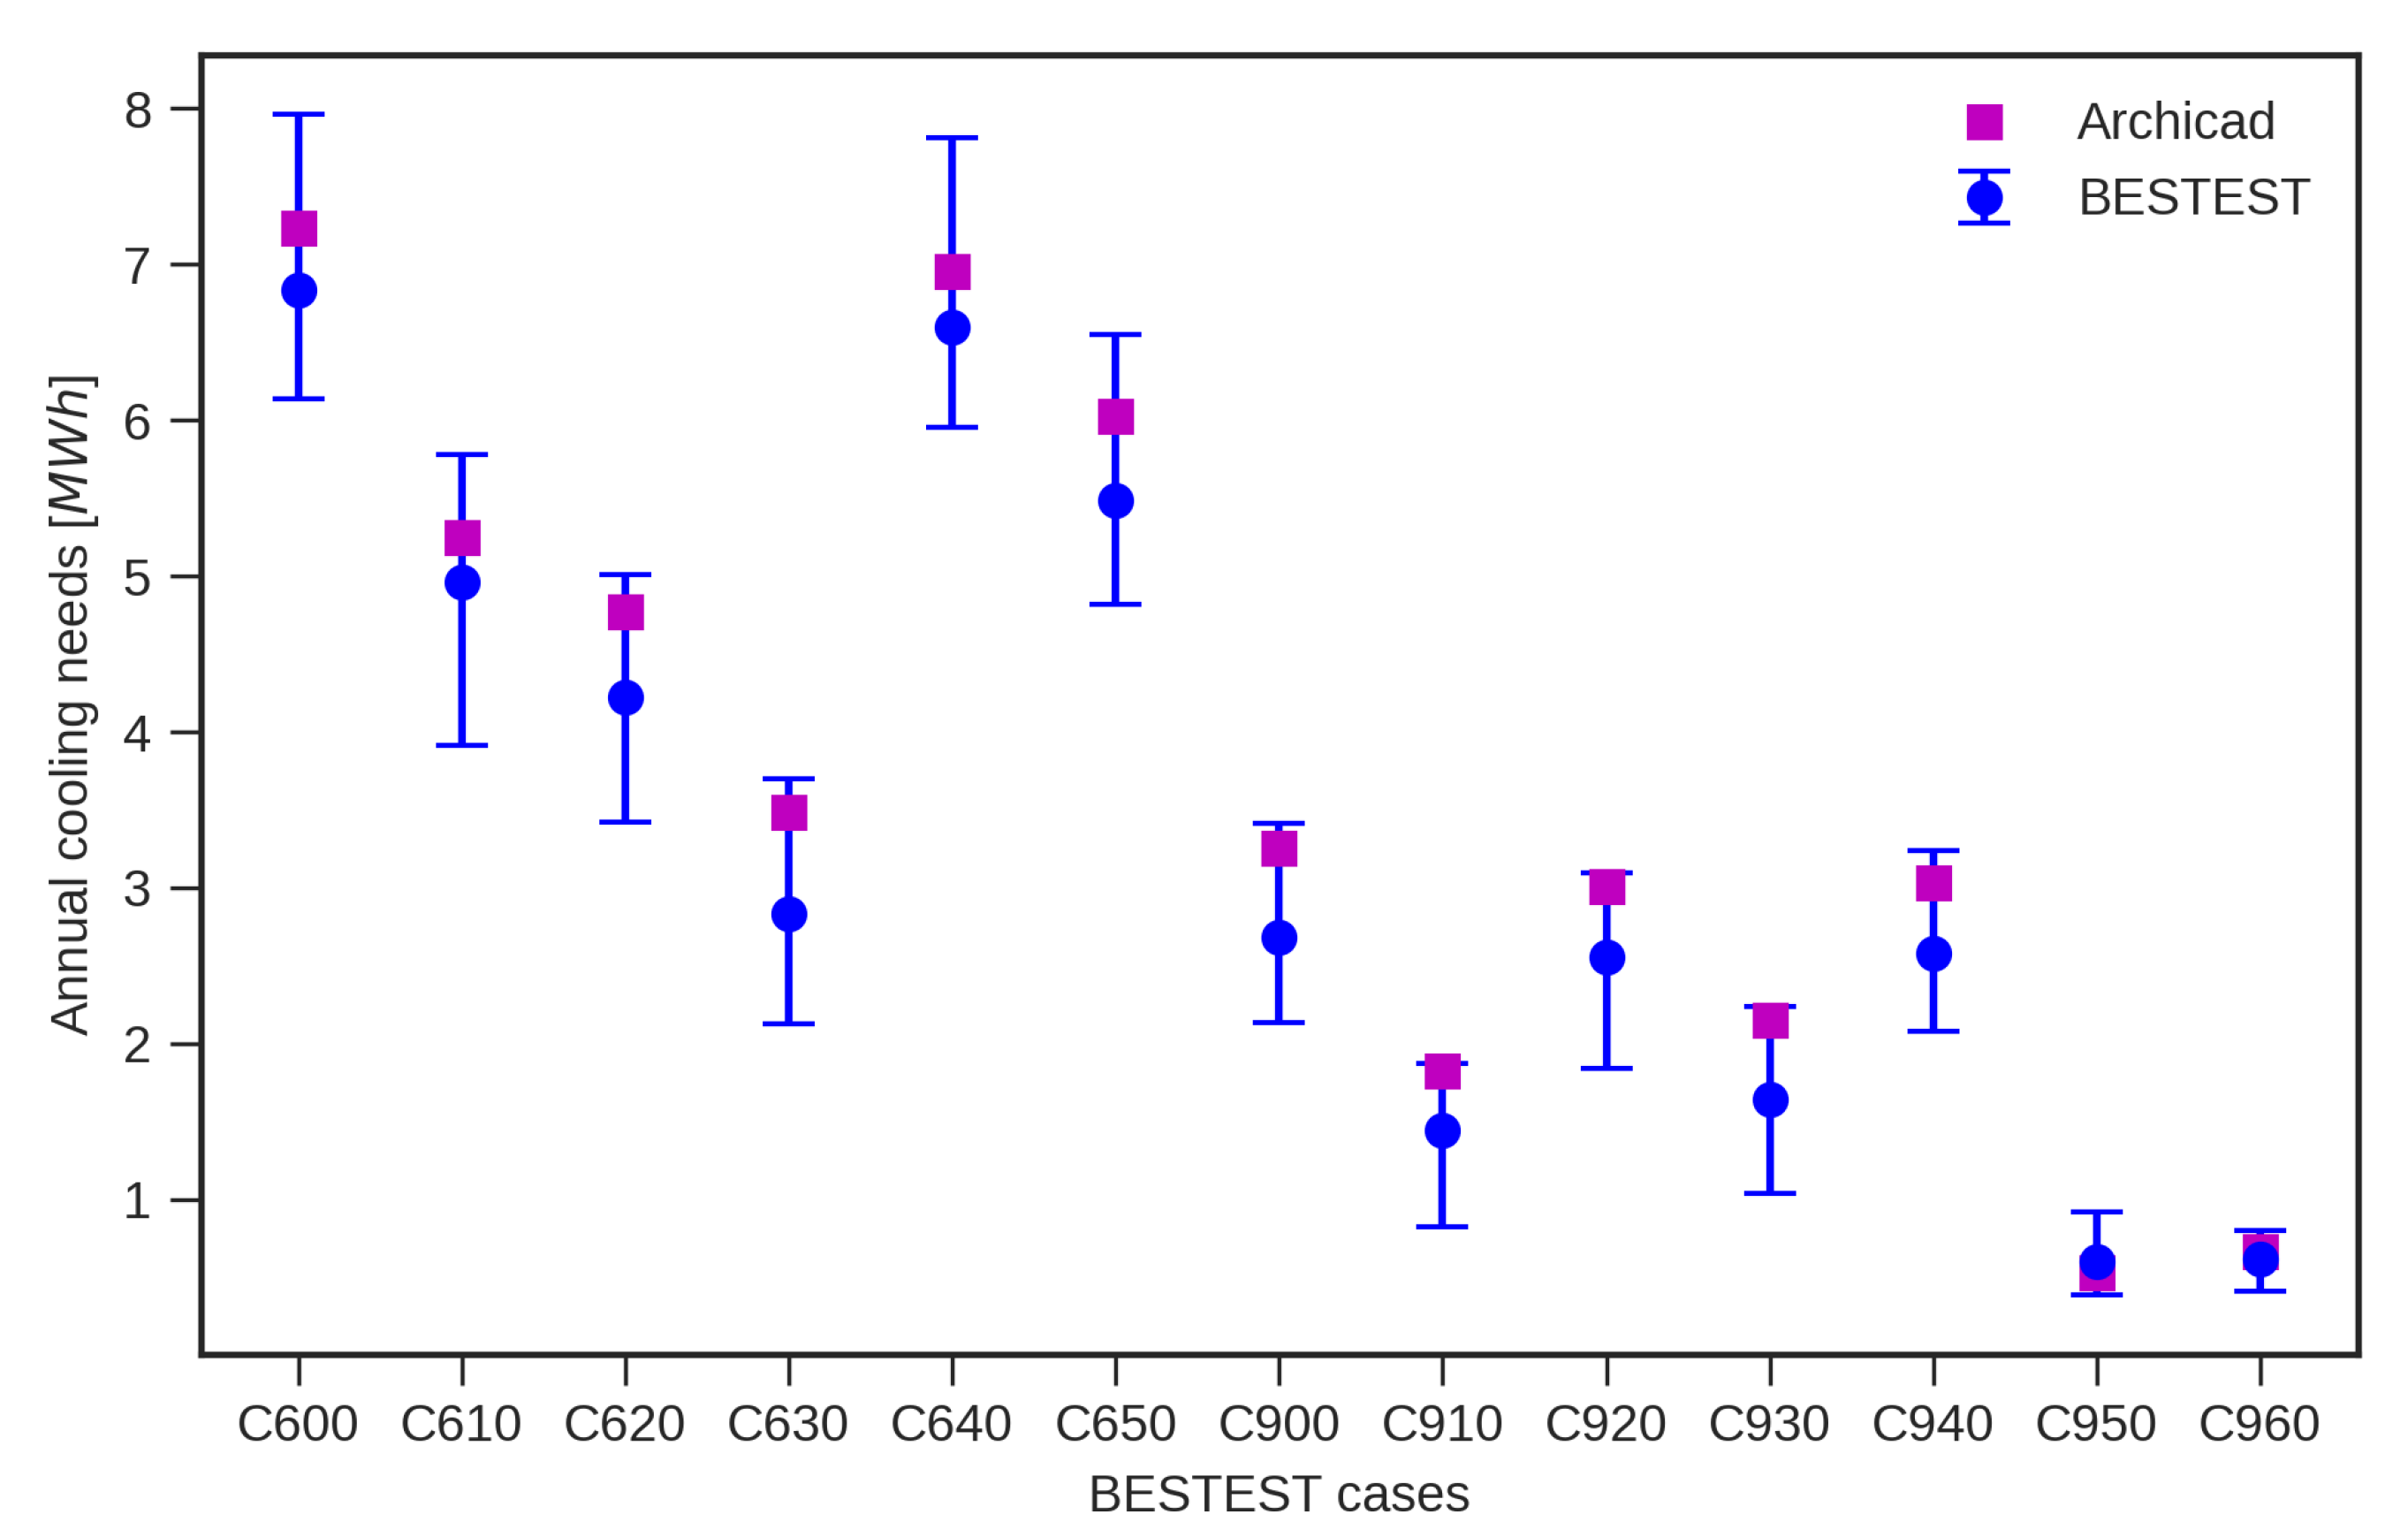
4.1. Bestest Validation for Envelope Modeling
4.2. Compare with Trnsys and Standard ISO 52016
- External walls: reinforced concrete (20 cm) + thermal insulation on the external side (20 cm).
- Roof: flat roof made of reinforced concrete (20 cm) + thermal insulation on external side (24 cm).
- Ground floor: concrete floor slab (10 cm) + thermal insulation (10 cm).
- Floor to an open garage—B1 and B3: reinforced concrete floor (20 cm) + thermal insulation on external side (20 cm).
- Walls to staircase (unconditioned)–B1: reinforced concrete (20 cm) + thermal insulation on the side adjacent to staircase (20 cm).
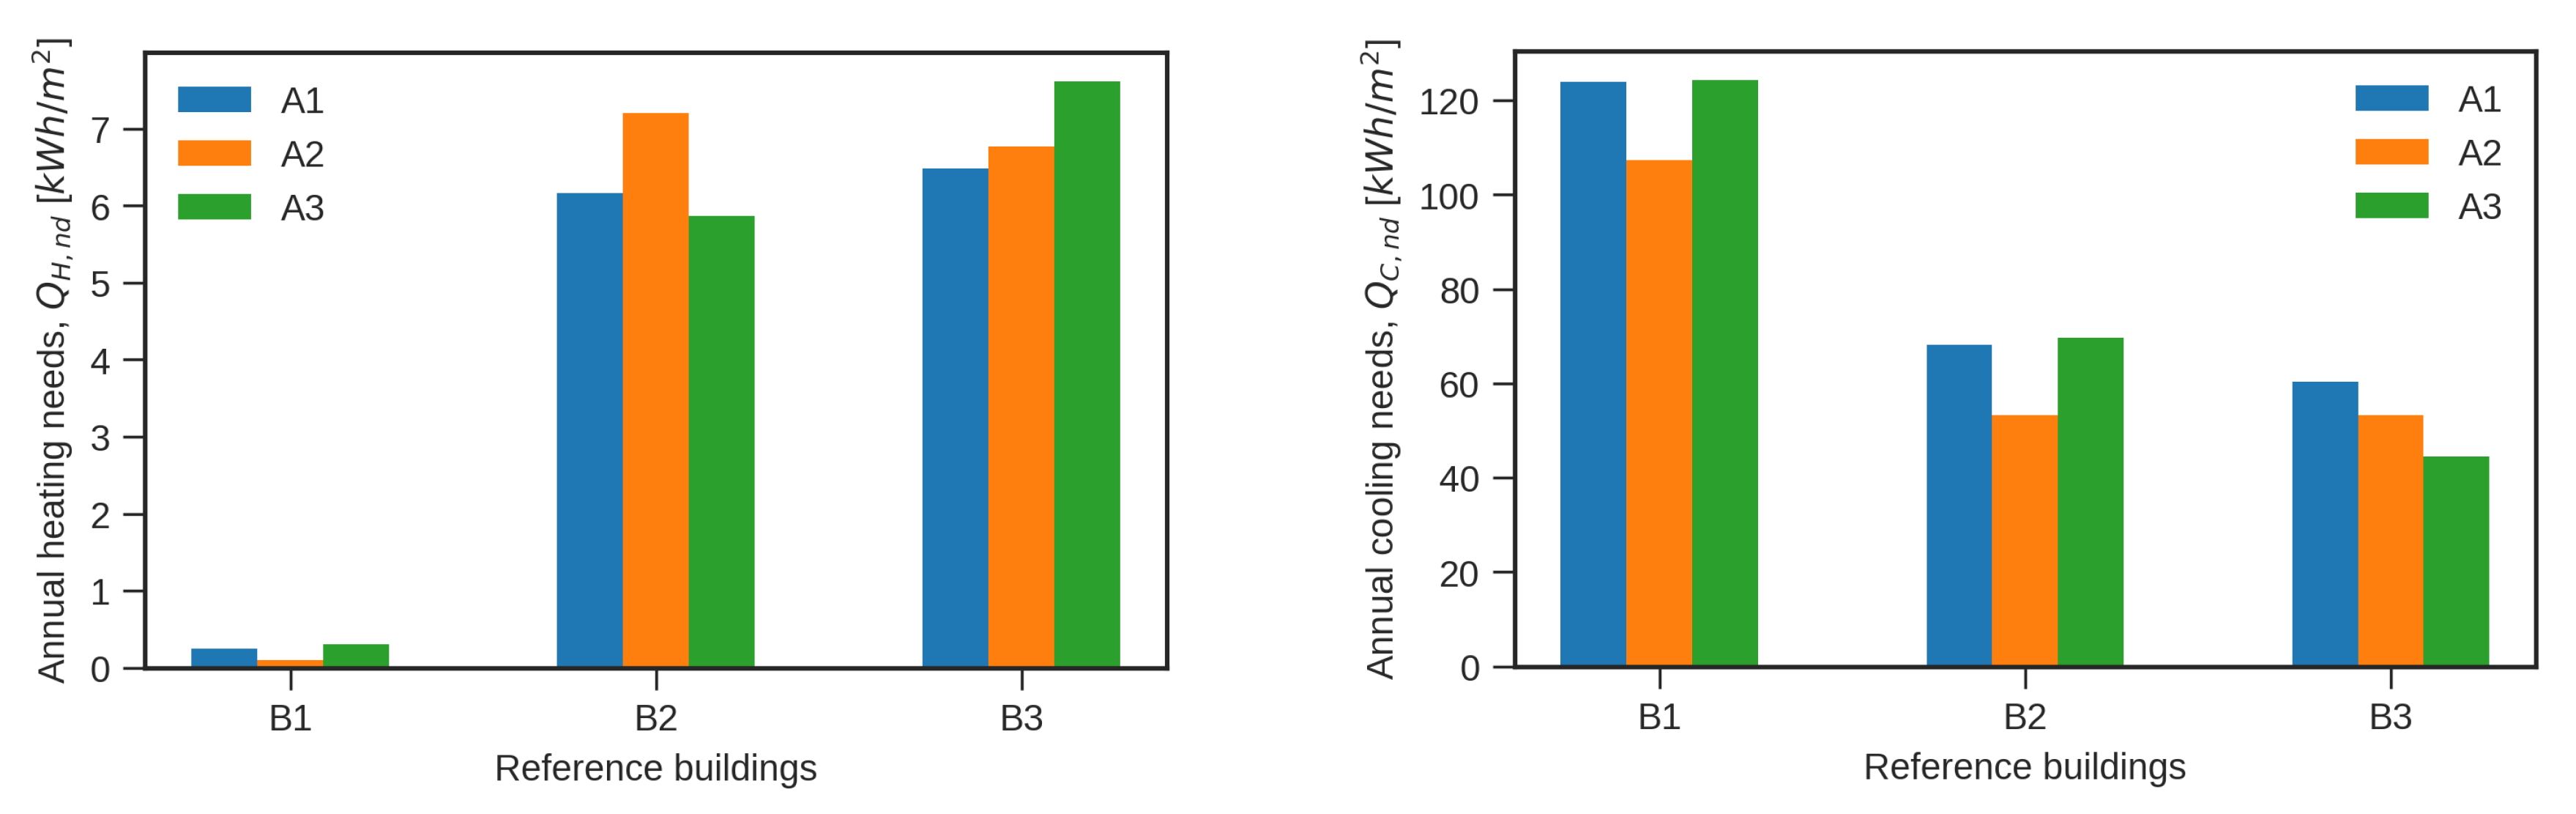
4.2.1. Results and Comparison between Trnsys, ISO 52016, and Energy Evaluation Tool
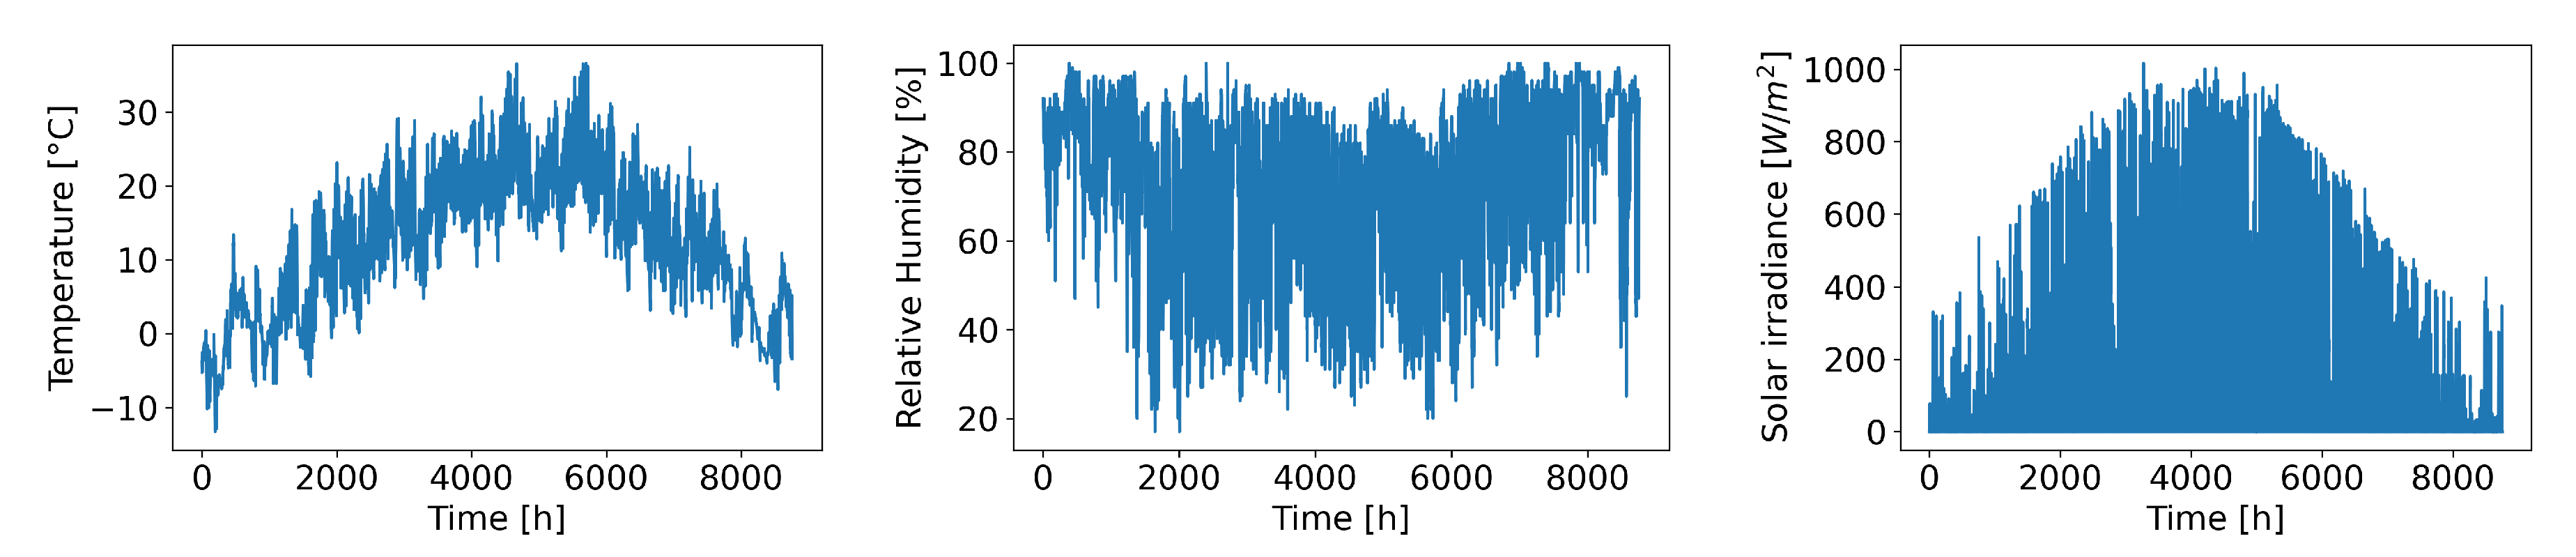
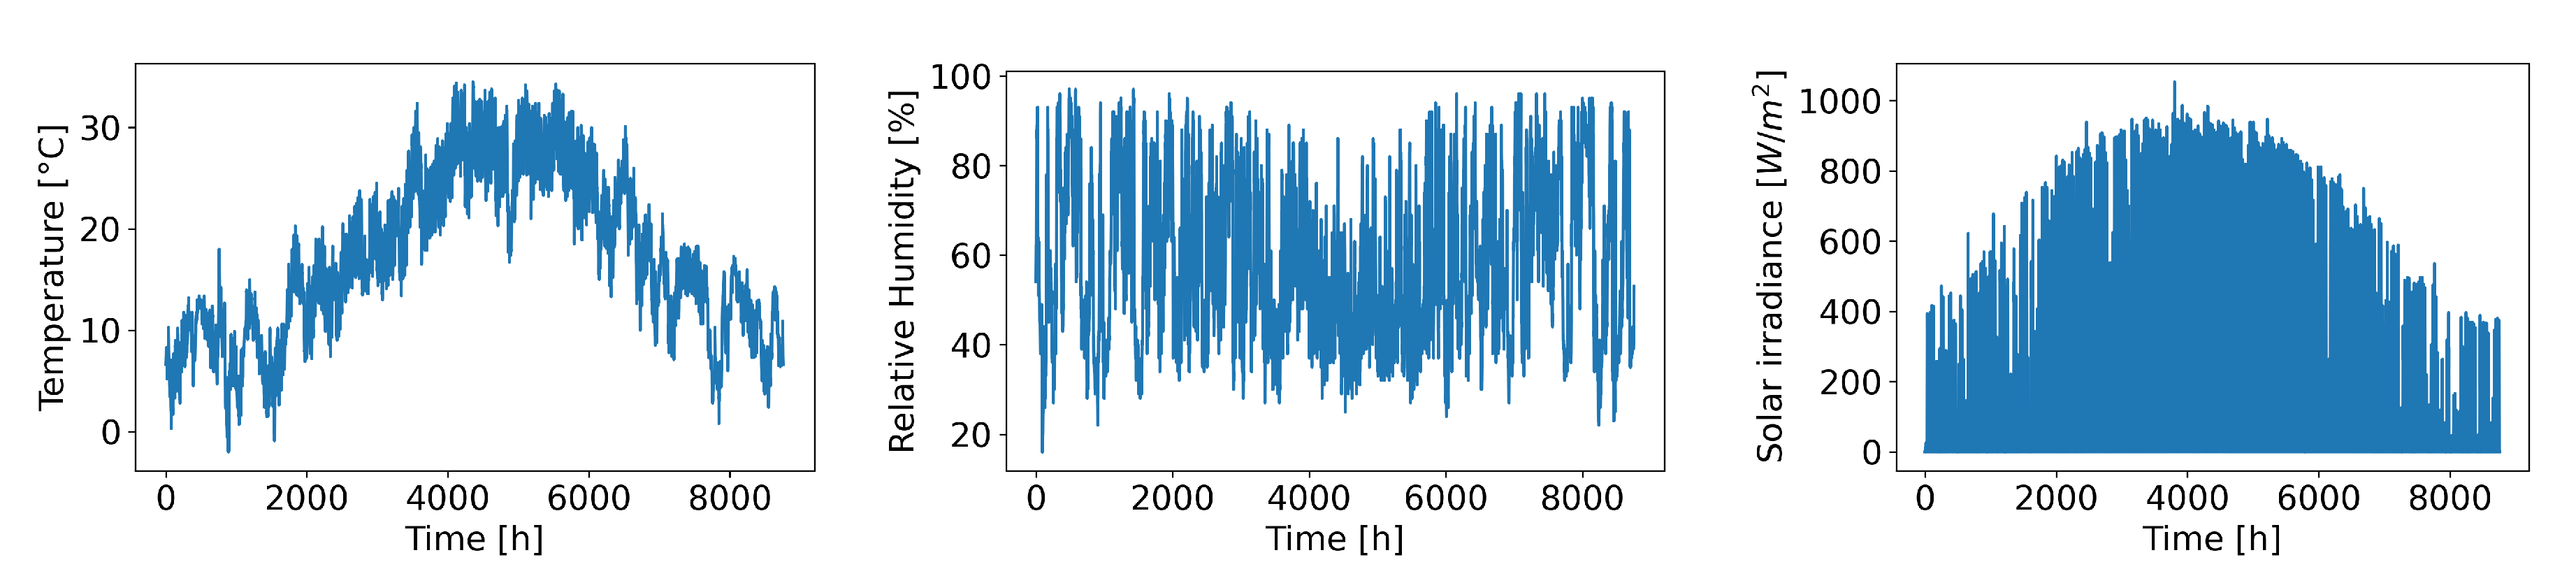
4.2.2. The Impact of Assumptions Concerning Climate and Lower LOD Modeling on Energy Results
5. Conclusions and Further Research
Author Contributions
Funding
Acknowledgments
Conflicts of Interest
References
- European Parliament and of the Council. Directive 2010/31/EU of the European Parliament and of the Council of 19 May 2010 on the Energy Performance of Buildings; The European Parliament and of the Council: Brussels, Belgium, 2010. [Google Scholar]
- European Parliament and of the Council. Directive (EU) 2018/844 of the European Parliament and of the Council of 30 May 2018 Amending Directive 2010/31/EU on the Energy Performance of Buildings and Directive 2012/27/EU on Energy Efficiency; The European Parliament and of the Council: Brussels, Belgium, 2018. [Google Scholar]
- Hosseini, S.M.; Carli, R.; Dotoli, M. Robust Day-Ahead Energy Scheduling of a Smart Residential User Under Uncertainty. In Proceedings of the 2019 18th European Control Conference (ECC), Naples, Italy, 25–28 June 2019. [Google Scholar]
- Park, S.; Salkuti, S.R. Optimal Energy Management of Railroad Electrical Systems with Renewable Energy and Energy Storage Systems. Sustainability 2019, 11, 6293. [Google Scholar] [CrossRef]
- European Commission. A Clean Planet for All–A European Strategic Long-Term Vision for a Prosperous, Modern, Competitive Andclimate Neutral Economy; Technical Report COM(2018) 773 Final; European Commission: Brussels, Belgium, 2018. [Google Scholar]
- Building Performance Institute Europe. State of the Building Stock; Technical Report; Building Performance Institute Europe (BPIE): Brussles, Belgium, 2017. [Google Scholar]
- Asdrubali, F.; Baggio, P.; Prada, A.; Grazieschi, G.; Guattari, C. Dynamic life cycle assessment modelling of a NZEB building. Energy 2020, 191, 116489. [Google Scholar] [CrossRef]
- Harkouss, F.; Fardoun, F.; Biwole, P.H. Optimal design of renewable energy solution sets for net zero energy buildings. Energy 2019, 179, 1155–1175. [Google Scholar] [CrossRef]
- Teitelbaum, E.; Jayathissa, P.; Miller, C.; Meggers, F. Design with Comfort: Expanding the psychrometric chart with radiation and convection dimensions. Energy Build. 2020, 209, 109591. [Google Scholar] [CrossRef]
- Johansson, P.; Ekstrand-Tobin, A.; Bok, G. An innovative test method for evaluating the critical moisture level for mould growth on building materials. Build. Environ. 2014, 81, 404–409. [Google Scholar] [CrossRef]
- Johansson, P.; Bok, G.; Ekstrand-Tobin, A. The effect of cyclic moisture and temperature on mould growth on wood compared to steady state conditions. Build. Environ. 2013, 65, 178–184. [Google Scholar] [CrossRef]
- Deng, S.; Wang, R.; Dai, Y. How to evaluate performance of net zero energy building—A literature research. Energy 2014, 71, 1–16. [Google Scholar] [CrossRef]
- Zakula, T.; Bagaric, M.; Ferdelji, N.; Milovanovic, B.; Mudrinic, S.; Ritosa, K. Comparison of dynamic simulations and the ISO 52016 standard for the assessment of building energy performance. Appl. Energy 2019, 254, 113553. [Google Scholar] [CrossRef]
- Ika, L.A. Project Success as a Topic in Project Management Journals. Proj. Manag. J. 2009, 40, 6–19. [Google Scholar] [CrossRef]
- Ahmad, T.; Aibinu, A.A.; Stephan, A.; Chan, A.P.C. Investigating associations among performance criteria in Green Building projects. J. Clean. Prod. 2019, 232, 1348–1370. [Google Scholar] [CrossRef]
- Mela, K.; Tiainen, T.; Heinisuo, M. Comparative study of multiple criteria decision making methods for building design. Adv. Eng. Inform. 2012, 26, 716–726. [Google Scholar] [CrossRef]
- Carli, R.; Dotoli, M.; Pellegrino, R.; Ranieri, L. Using multi-objective optimization for the integrated energy efficiency improvement of a smart city public buildings’ portfolio. In Proceedings of the 2015 IEEE International Conference on Automation Science and Engineering (CASE), Gothenburg, Sweden, 24–28 August 2015. [Google Scholar]
- Kantola, M.; Saari, A. Project delivery systems for nZEB projects. Facilities 2016, 34, 85–100. [Google Scholar] [CrossRef]
- International Organization for Standardization. 52016: Energy Performance of Buildings-Energy Needs for Heating and Cooling, Internal Temperatures and Sensible and Latent Heat Loads—Part 1: Calculation Procedures; International Organization for Standardization, ISO: Geneva, Switzerland, 2017. [Google Scholar]
- International Organization for Standardization. 13790: Energy Performance of Buildings–Calculation of Energy Use for Space Heating and Cooling (ISO 13790:2008); International Organization for Standardization, ISO: Geneva, Switzerland, 2008. [Google Scholar]
- The American Society of Heating, Refrigerating and Air-Conditioning Engineers. ANSI/ASHRAE Standard 140-2017: Standard Method of Test for the Evaluation of Building Energy Analysis Computer Programs; American Society of Heating Refrigerating and Air-Conditioning Engineers: Atlanta, GA, USA, 2014. [Google Scholar]
- Bellos, E.; Tzivanidis, C.; Kouvari, A.; Antonopoulos, K.A. Comparison of Heating and Cooling Loads of a Typical Building with TRNSYS and eQUEST. In Energy, Transportation and Global Warming; Springer International Publishing: Cham, Switzerland, 2016; pp. 327–338. [Google Scholar]
- Hamburg, A.; Kuusk, K.; Mikola, A.; Kalamees, T. Realisation of energy performance targets of an old apartment building renovated to nZEB. Energy 2020, 194, 116874. [Google Scholar] [CrossRef]
- Ke, M.T.; Yeh, C.H.; Jian, J.T. Analysis of building energy consumption parameters and energy savings measurement and verification by applying eQUEST software. Energy Build. 2013, 61, 100–107. [Google Scholar] [CrossRef]
- Gao, H.; Koch, C.; Wu, Y. Building information modelling based building energy modelling: A review. Appl. Energy 2019, 238, 320–343. [Google Scholar] [CrossRef]
- Sanhudo, L.; Ramos, N.M.M.; Martins, J.P.; Almeida, R.M.S.F.; Barreira, E.; Simões, M.L.; Cardoso, V. Building information modeling for energy retrofitting—A review. Renew. Sustain. Energy Rev. 2018, 89, 249–260. [Google Scholar] [CrossRef]
- Kamel, E.; Memari, A.M. Review of BIM’s application in energy simulation: Tools, issues, and solutions. Autom. Constr. 2019, 97, 164–180. [Google Scholar] [CrossRef]
- Choi, J.W.; Jun, Y.J.; Yoon, J.h.; Song, Y.h.; Park, K.S. A Study of Energy Simulation Integrated Process by Automated Extraction Module of the BIM Geometry Module. Energies 2019, 12, 2461. [Google Scholar] [CrossRef]
- Liu, Z.; Wang, Q.; Gan, V.J.L.; Peh, L. Envelope Thermal Performance Analysis Based on Building Information Model (BIM) Cloud Platform—Proposed Green Mark Collaboration Environment. Energies 2020, 13, 586. [Google Scholar] [CrossRef]
- Cheng, M.Y.; Cao, M.T. Accurately predicting building energy performance using evolutionary multivariate adaptive regression splines. Appl. Soft Comput. 2014, 22, 178–188. [Google Scholar] [CrossRef]
- Sadeghi, A.; Sinaki, R.Y.; Young, W.A.; Weckman, G.R. An Intelligent Model to Predict Energy Performances of Residential Buildings Based on Deep Neural Networks. Energies 2020, 13, 571. [Google Scholar] [CrossRef]
- Lee, K.I. Improvement of Indoor Thermal Environments through Green Refurbishment. Sustainability 2020, 12, 4933. [Google Scholar] [CrossRef]
- Moayedi, H.; Bui, D.T.; Dounis, A.; Lyu, Z.; Foong, L.K. Predicting Heating Load in Energy-Efficient Buildings Through Machine Learning Techniques. Appl. Sci. 2019, 9, 4338. [Google Scholar] [CrossRef]
- Bui, D.T.; Moayedi, H.; Anastasios, D.; Foong, L.K. Predicting Heating and Cooling Loads in Energy-Efficient Buildings Using Two Hybrid Intelligent Models. Appl. Sci. 2019, 9, 3543. [Google Scholar] [CrossRef]
- The American Society of Heating, Refrigerating and Air-Conditioning Engineers. ASHRAE Guideline 14-2014: Measurment of Energy, Demand, and Water Savings; American Society of Heating Refrigerating and Air-Conditioning Engineers: Atlanta, GA, USA, 2014. [Google Scholar]
- Aparicio-Fernández, C.; Vivancos, J.L.; Cosar-Jorda, P.; Buswell, R.A. Energy Modelling and Calibration of Building Simulations: A Case Study of a Domestic Building with Natural Ventilation. Energies 2019, 12, 3360. [Google Scholar] [CrossRef]
- Ruiz, G.; Bandera, C. Validation of Calibrated Energy Models: Common Errors. Energies 2017, 10, 1587. [Google Scholar] [CrossRef]
- U.S. Departmant of Energy. EnergyPlus Version 9.3.0 Documentation: Engineering Reference; U.S. Departmant of Energy: Washington, DC, USA, 2020.
- Pučko, Z.; Maučec, D.; Šuman, N. Energy and Cost Analysis of Building Envelope Components Using BIM: A Systematic Approach. Energies 2020, 13, 2643. [Google Scholar] [CrossRef]
- Bakker, H.L.M.; Kleijn, J.P. (Eds.) Management of Engineering Projects: People are Key; NAP-The Process Industry Competence Network: Nijkerk, The Netherlands, 2014; p. 308. [Google Scholar]
- Jóhannesson, G. Active Heat Capacity: Models and Parameters for the Thermal Performance of Buildings (Report TVBH-1003); Technical Report; Lund Instutute of Technology: Lund, Sweden, 1981. [Google Scholar]
- VIP Energy Manual. Available online: https://www.vipenergy.net/English_Home.htm (accessed on 22 July 2020).


| Control C1 | Control C2 | Control C3 |
|---|---|---|
| construction (light, medium or heavy) | U-values–opaque elements | U-values–opaque elements |
| relative compactness | U-values–windows | U-values–windows |
| window-to-wall ratio | glazing U-values | glazing U-values |
| shadings | g-values | g-values |
| preliminary heating load | heating load | airtightness –blowerdoor |
| preliminary cooling load | cooling load | heating load check |
| primary energy | cooling load check | |
| designed airtightness | primary energy check |
| ID | Type of Use | Heating/Cooling Hours | Thermal Mass | ||
|---|---|---|---|---|---|
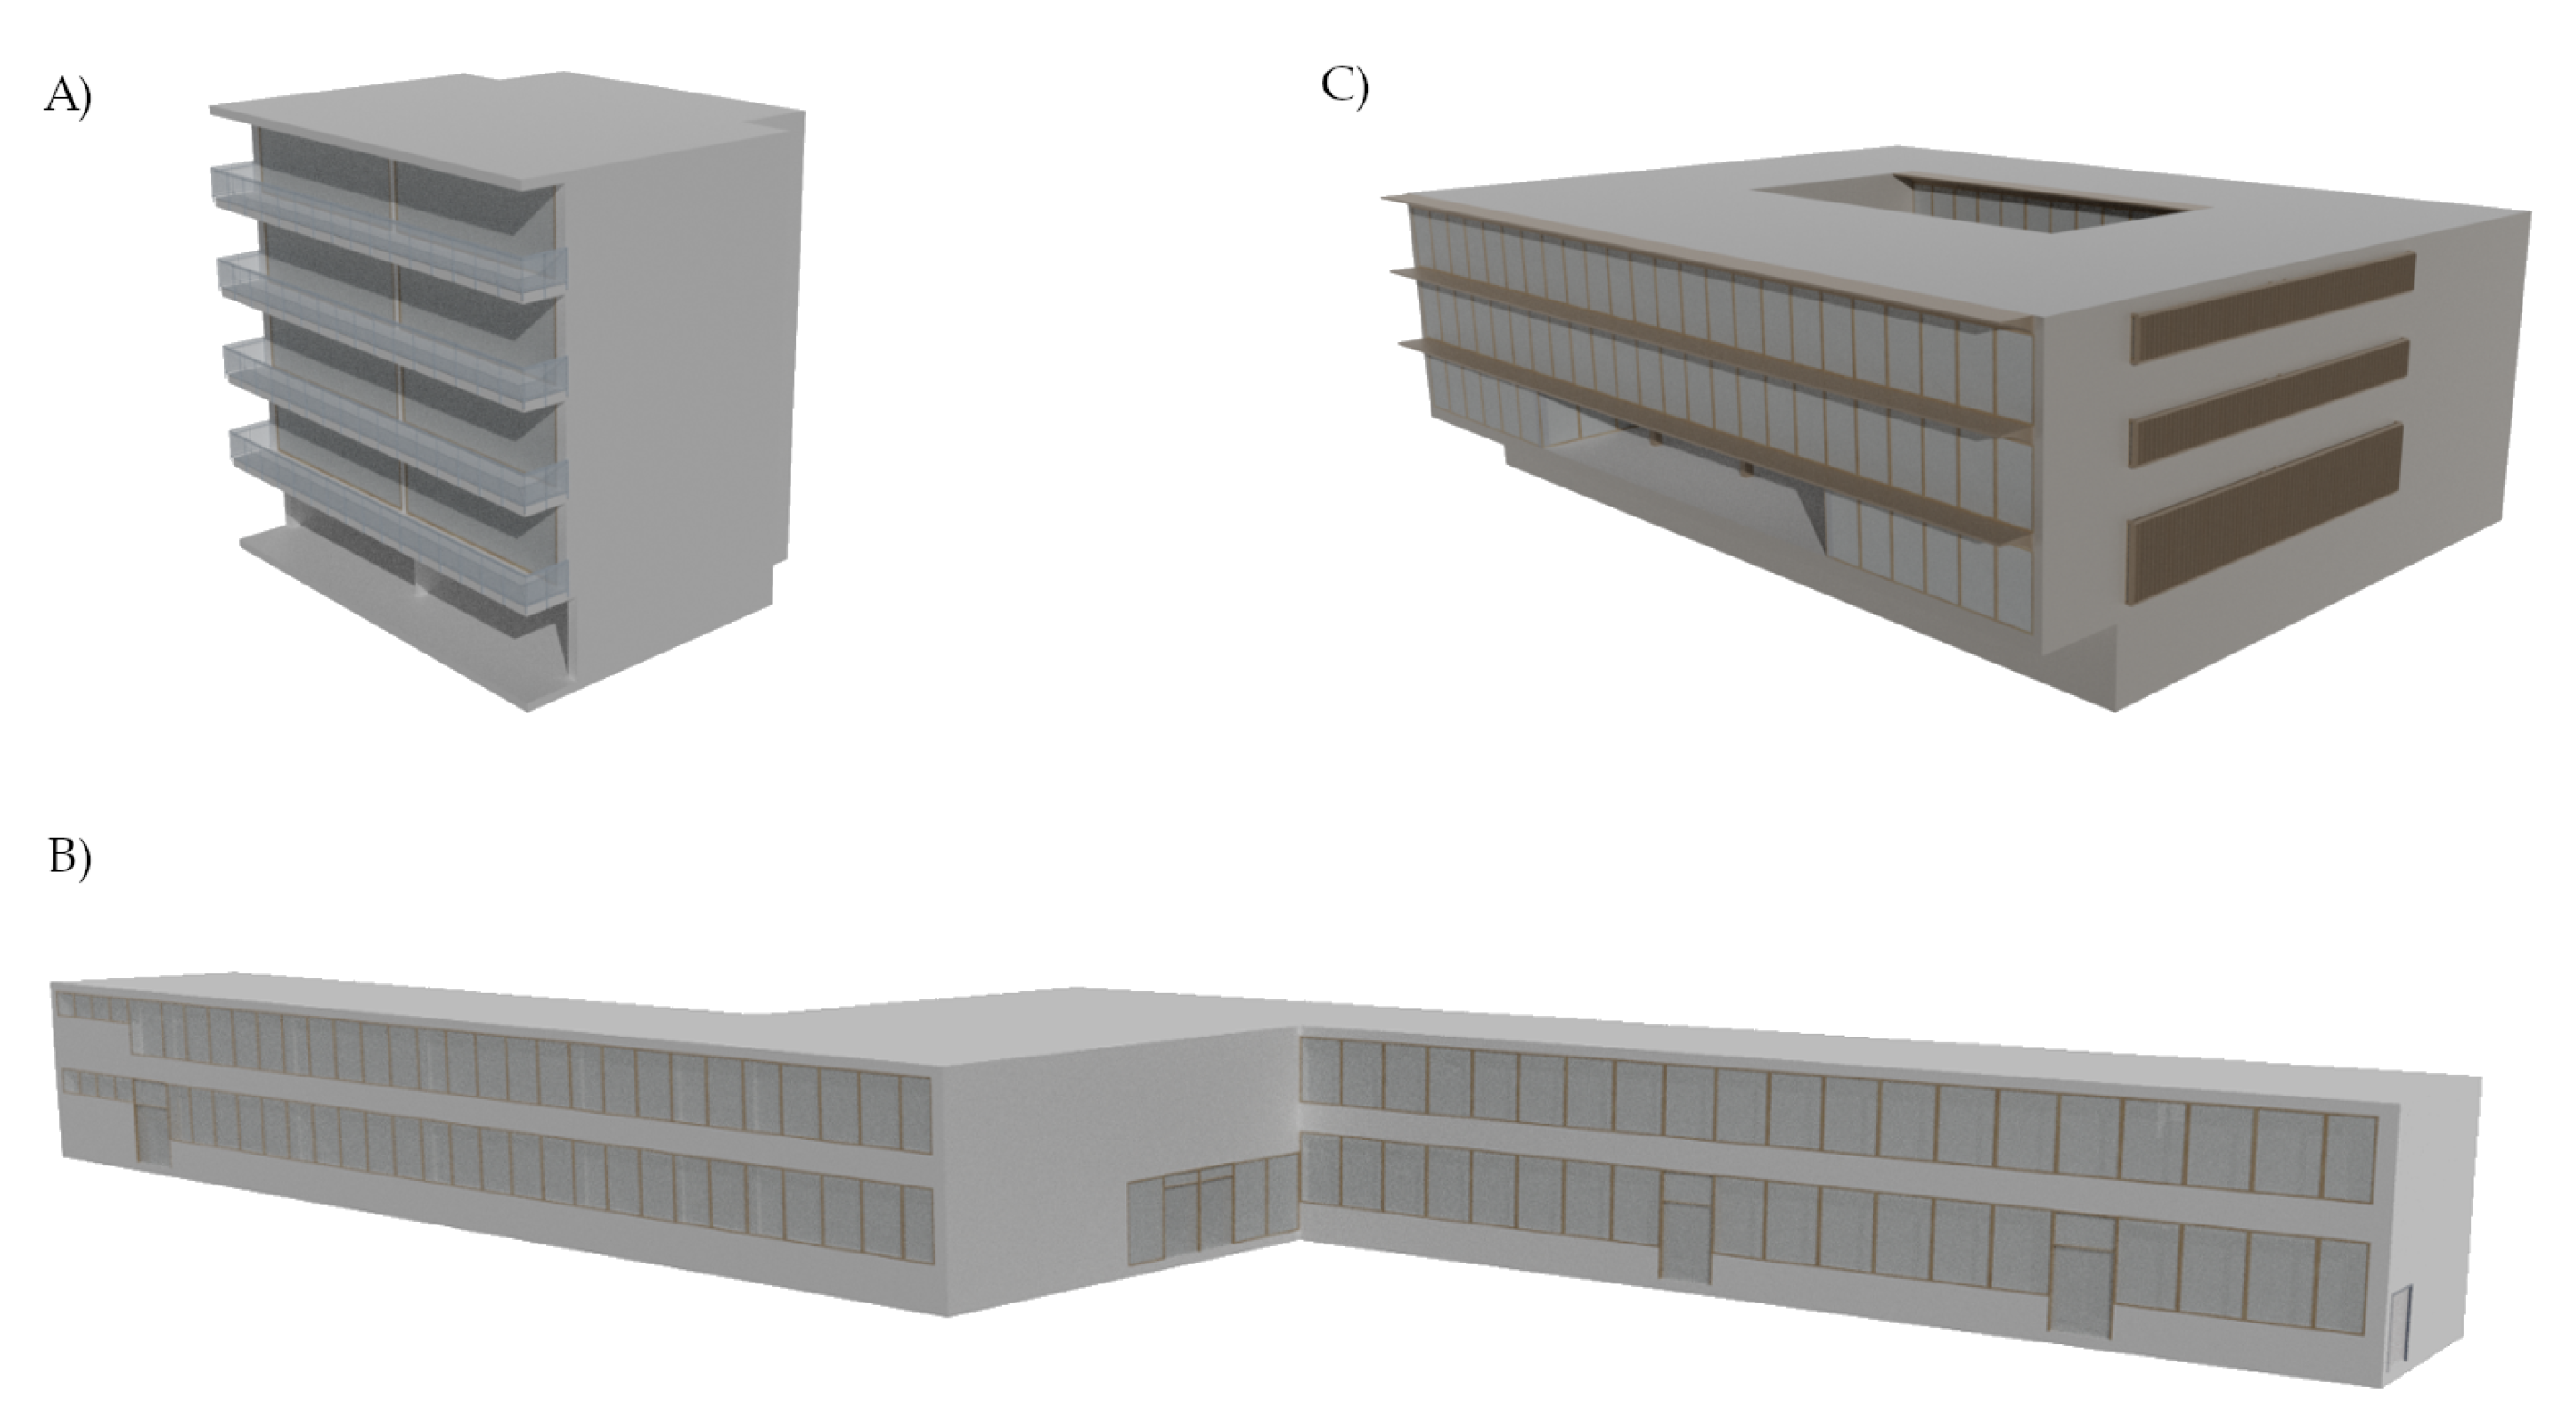
| B1 | NZEB residential building | 6 am–11 pm (7 days a week) | 607 | 1638 | Very heavy |
| B2 | NZEB school | 6 am–8 pm (5 days a week) | 2068 | 8278 | Very heavy |
| B3 | NZEB office building | 5 am–6 pm (5 days a week) | 2745 | 8231 | Very heavy |
| ID | Infiltration | Internal Heat | Heating/Cooling | |||
|---|---|---|---|---|---|---|
| Rates | Gains | Setpoint | ||||
| B1 | 0.17 | 0.86 | 0.6 | 0.5 | 5 | 20/22 |
| B2 | 0.17 | 0.86/0.68 | 0.60/0.40 | 0.7 | 6 | 20/22 |
| B3 | 0.17 | 0.68 | 0.40 | 0.7 | 6 | 20/22 |
Publisher’s Note: MDPI stays neutral with regard to jurisdictional claims in published maps and institutional affiliations. |
© 2020 by the authors. Licensee MDPI, Basel, Switzerland. This article is an open access article distributed under the terms and conditions of the Creative Commons Attribution (CC BY) license (http://creativecommons.org/licenses/by/4.0/).
Share and Cite
Gumbarević, S.; Burcar Dunović, I.; Milovanović, B.; Gaši, M. Method for Building Information Modeling Supported Project Control of Nearly Zero-Energy Building Delivery. Energies 2020, 13, 5519. https://doi.org/10.3390/en13205519
Gumbarević S, Burcar Dunović I, Milovanović B, Gaši M. Method for Building Information Modeling Supported Project Control of Nearly Zero-Energy Building Delivery. Energies. 2020; 13(20):5519. https://doi.org/10.3390/en13205519
Chicago/Turabian StyleGumbarević, Sanjin, Ivana Burcar Dunović, Bojan Milovanović, and Mergim Gaši. 2020. "Method for Building Information Modeling Supported Project Control of Nearly Zero-Energy Building Delivery" Energies 13, no. 20: 5519. https://doi.org/10.3390/en13205519
APA StyleGumbarević, S., Burcar Dunović, I., Milovanović, B., & Gaši, M. (2020). Method for Building Information Modeling Supported Project Control of Nearly Zero-Energy Building Delivery. Energies, 13(20), 5519. https://doi.org/10.3390/en13205519