Scenario Analysis for GHG Emission Reduction Potential of the Building Sector for New City in South Korea
Abstract
1. Introduction
2. Methodology
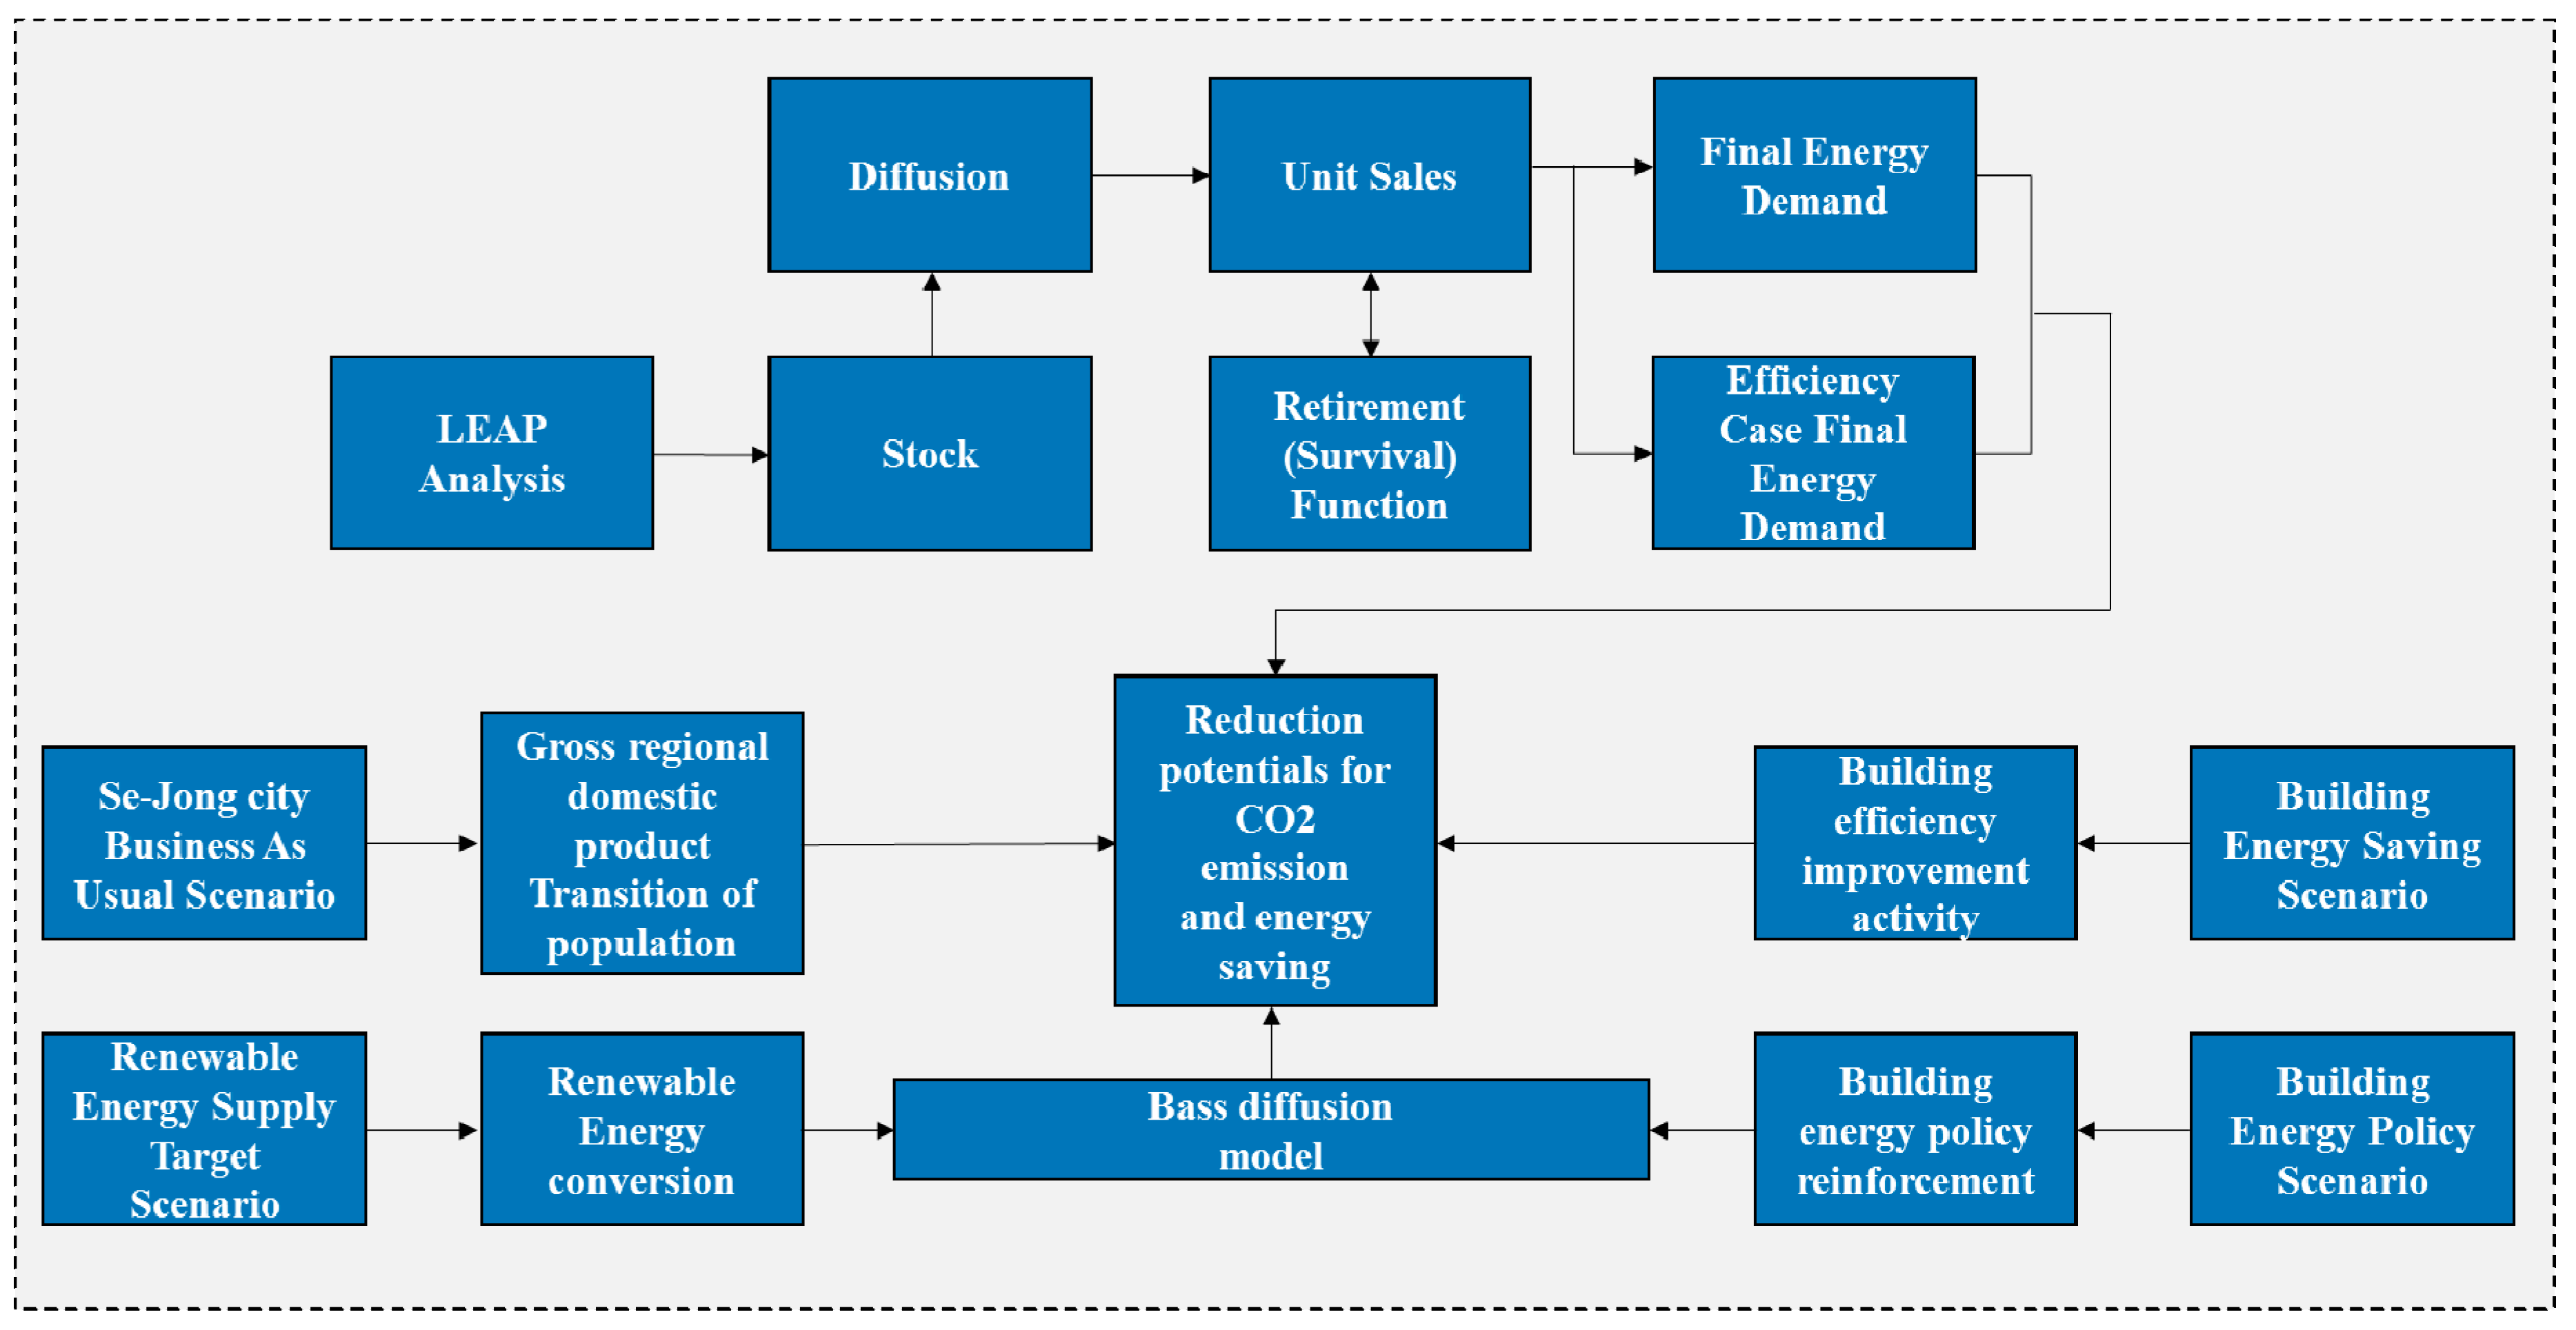
2.1. The LEAP Model
2.2. The Bass Diffusion Model
3. Case Study
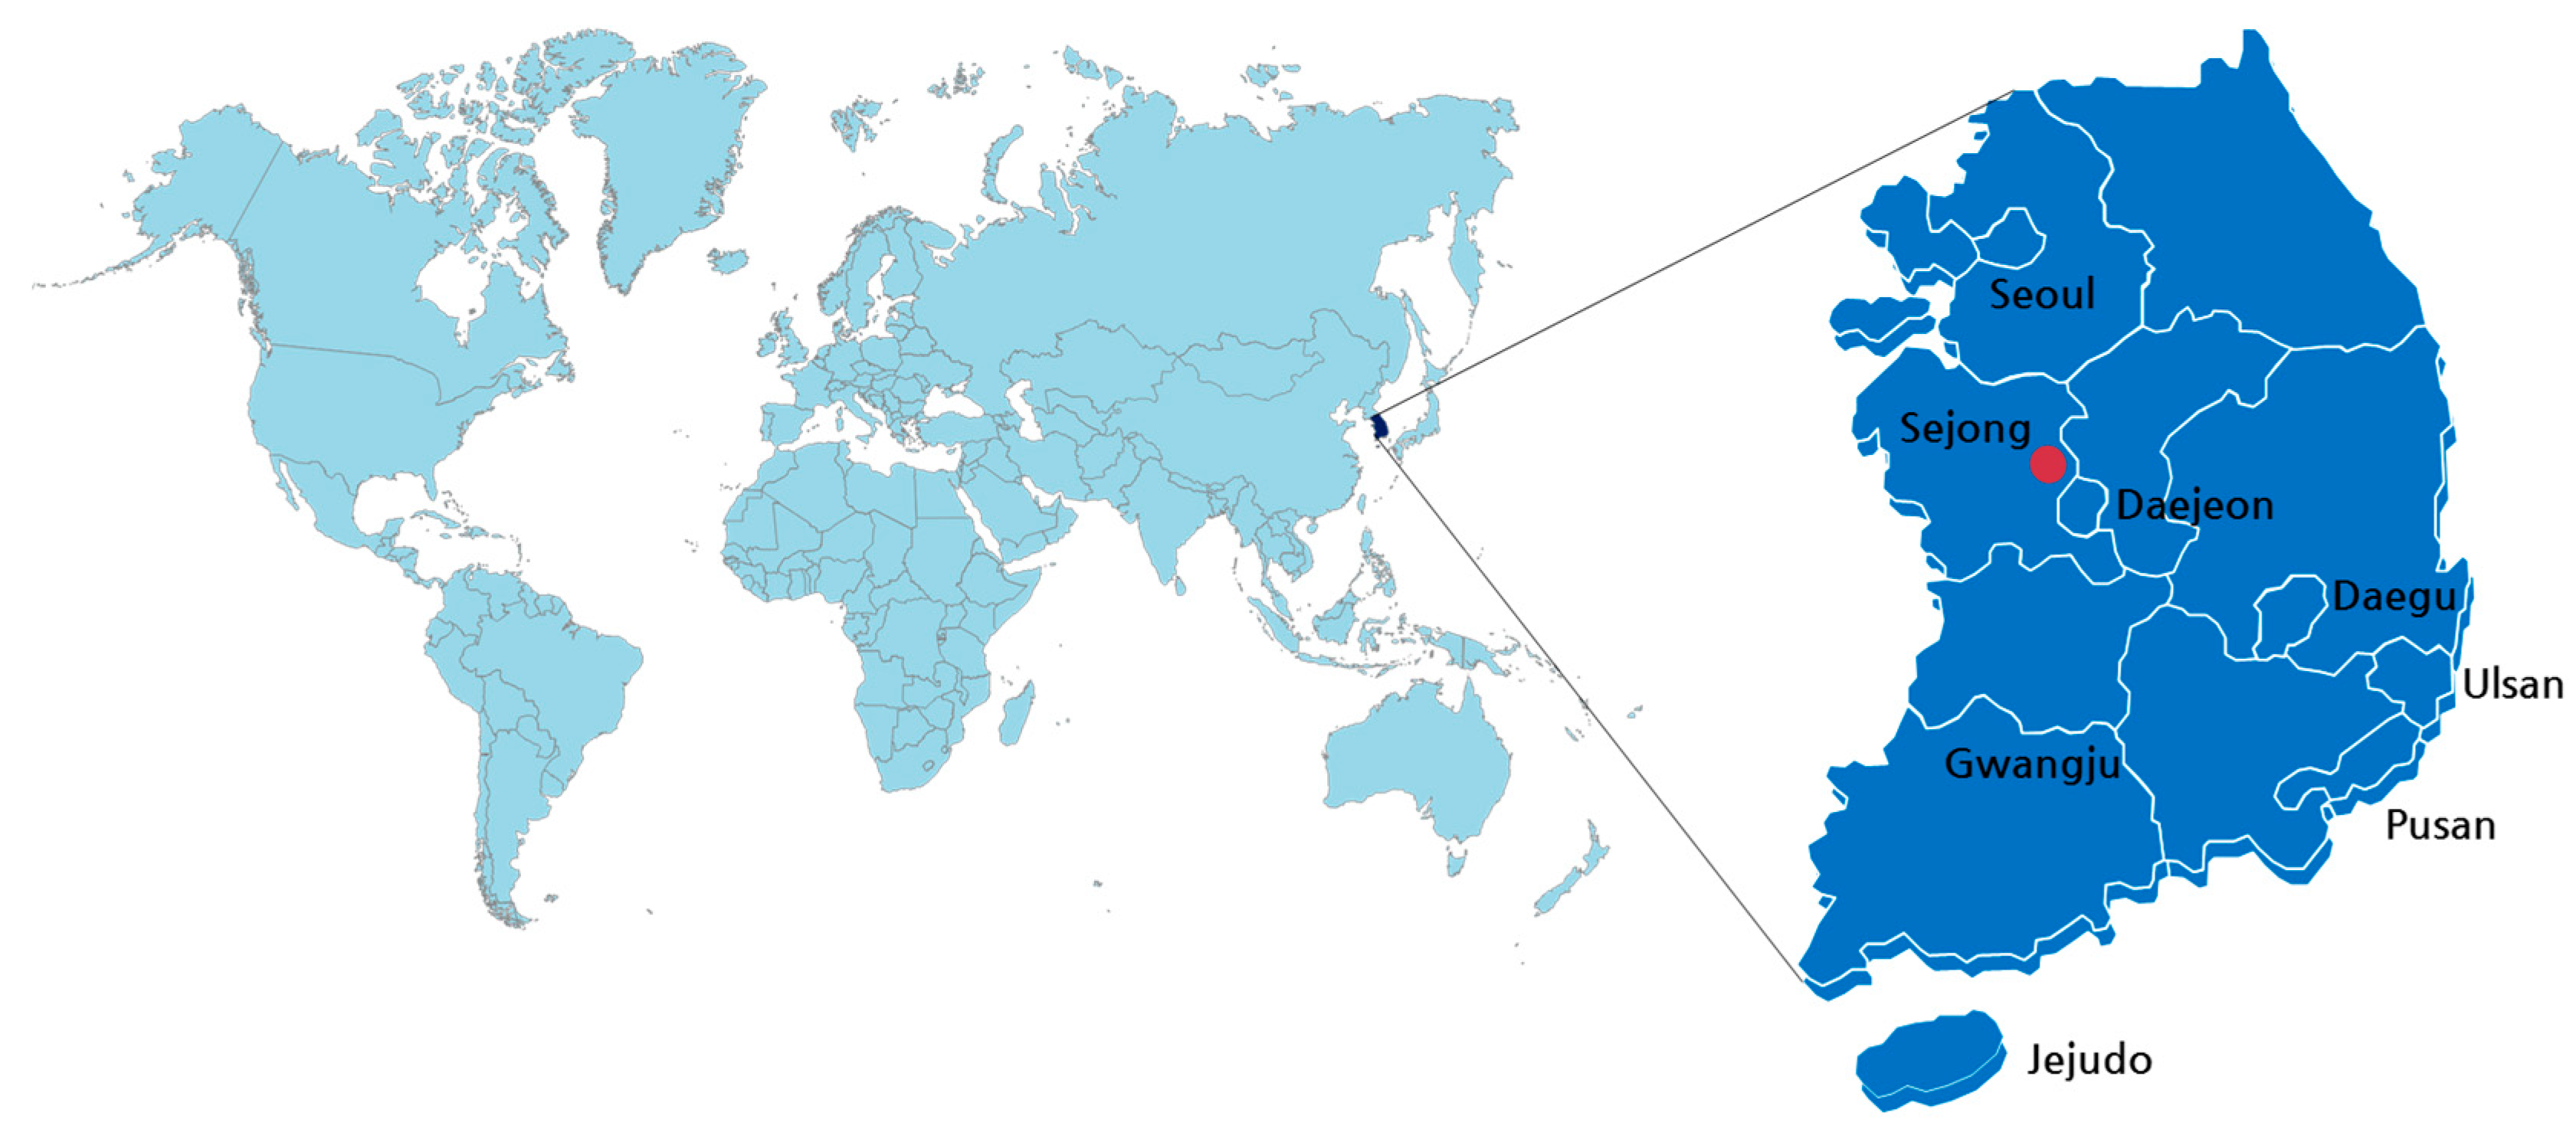
3.1. Study Area and Data Use
- eliminate urban sprawl in the capital region,
- strengthen national competitiveness, and
- balance national development.
3.2. Scenario Design
4. Results and Discussion
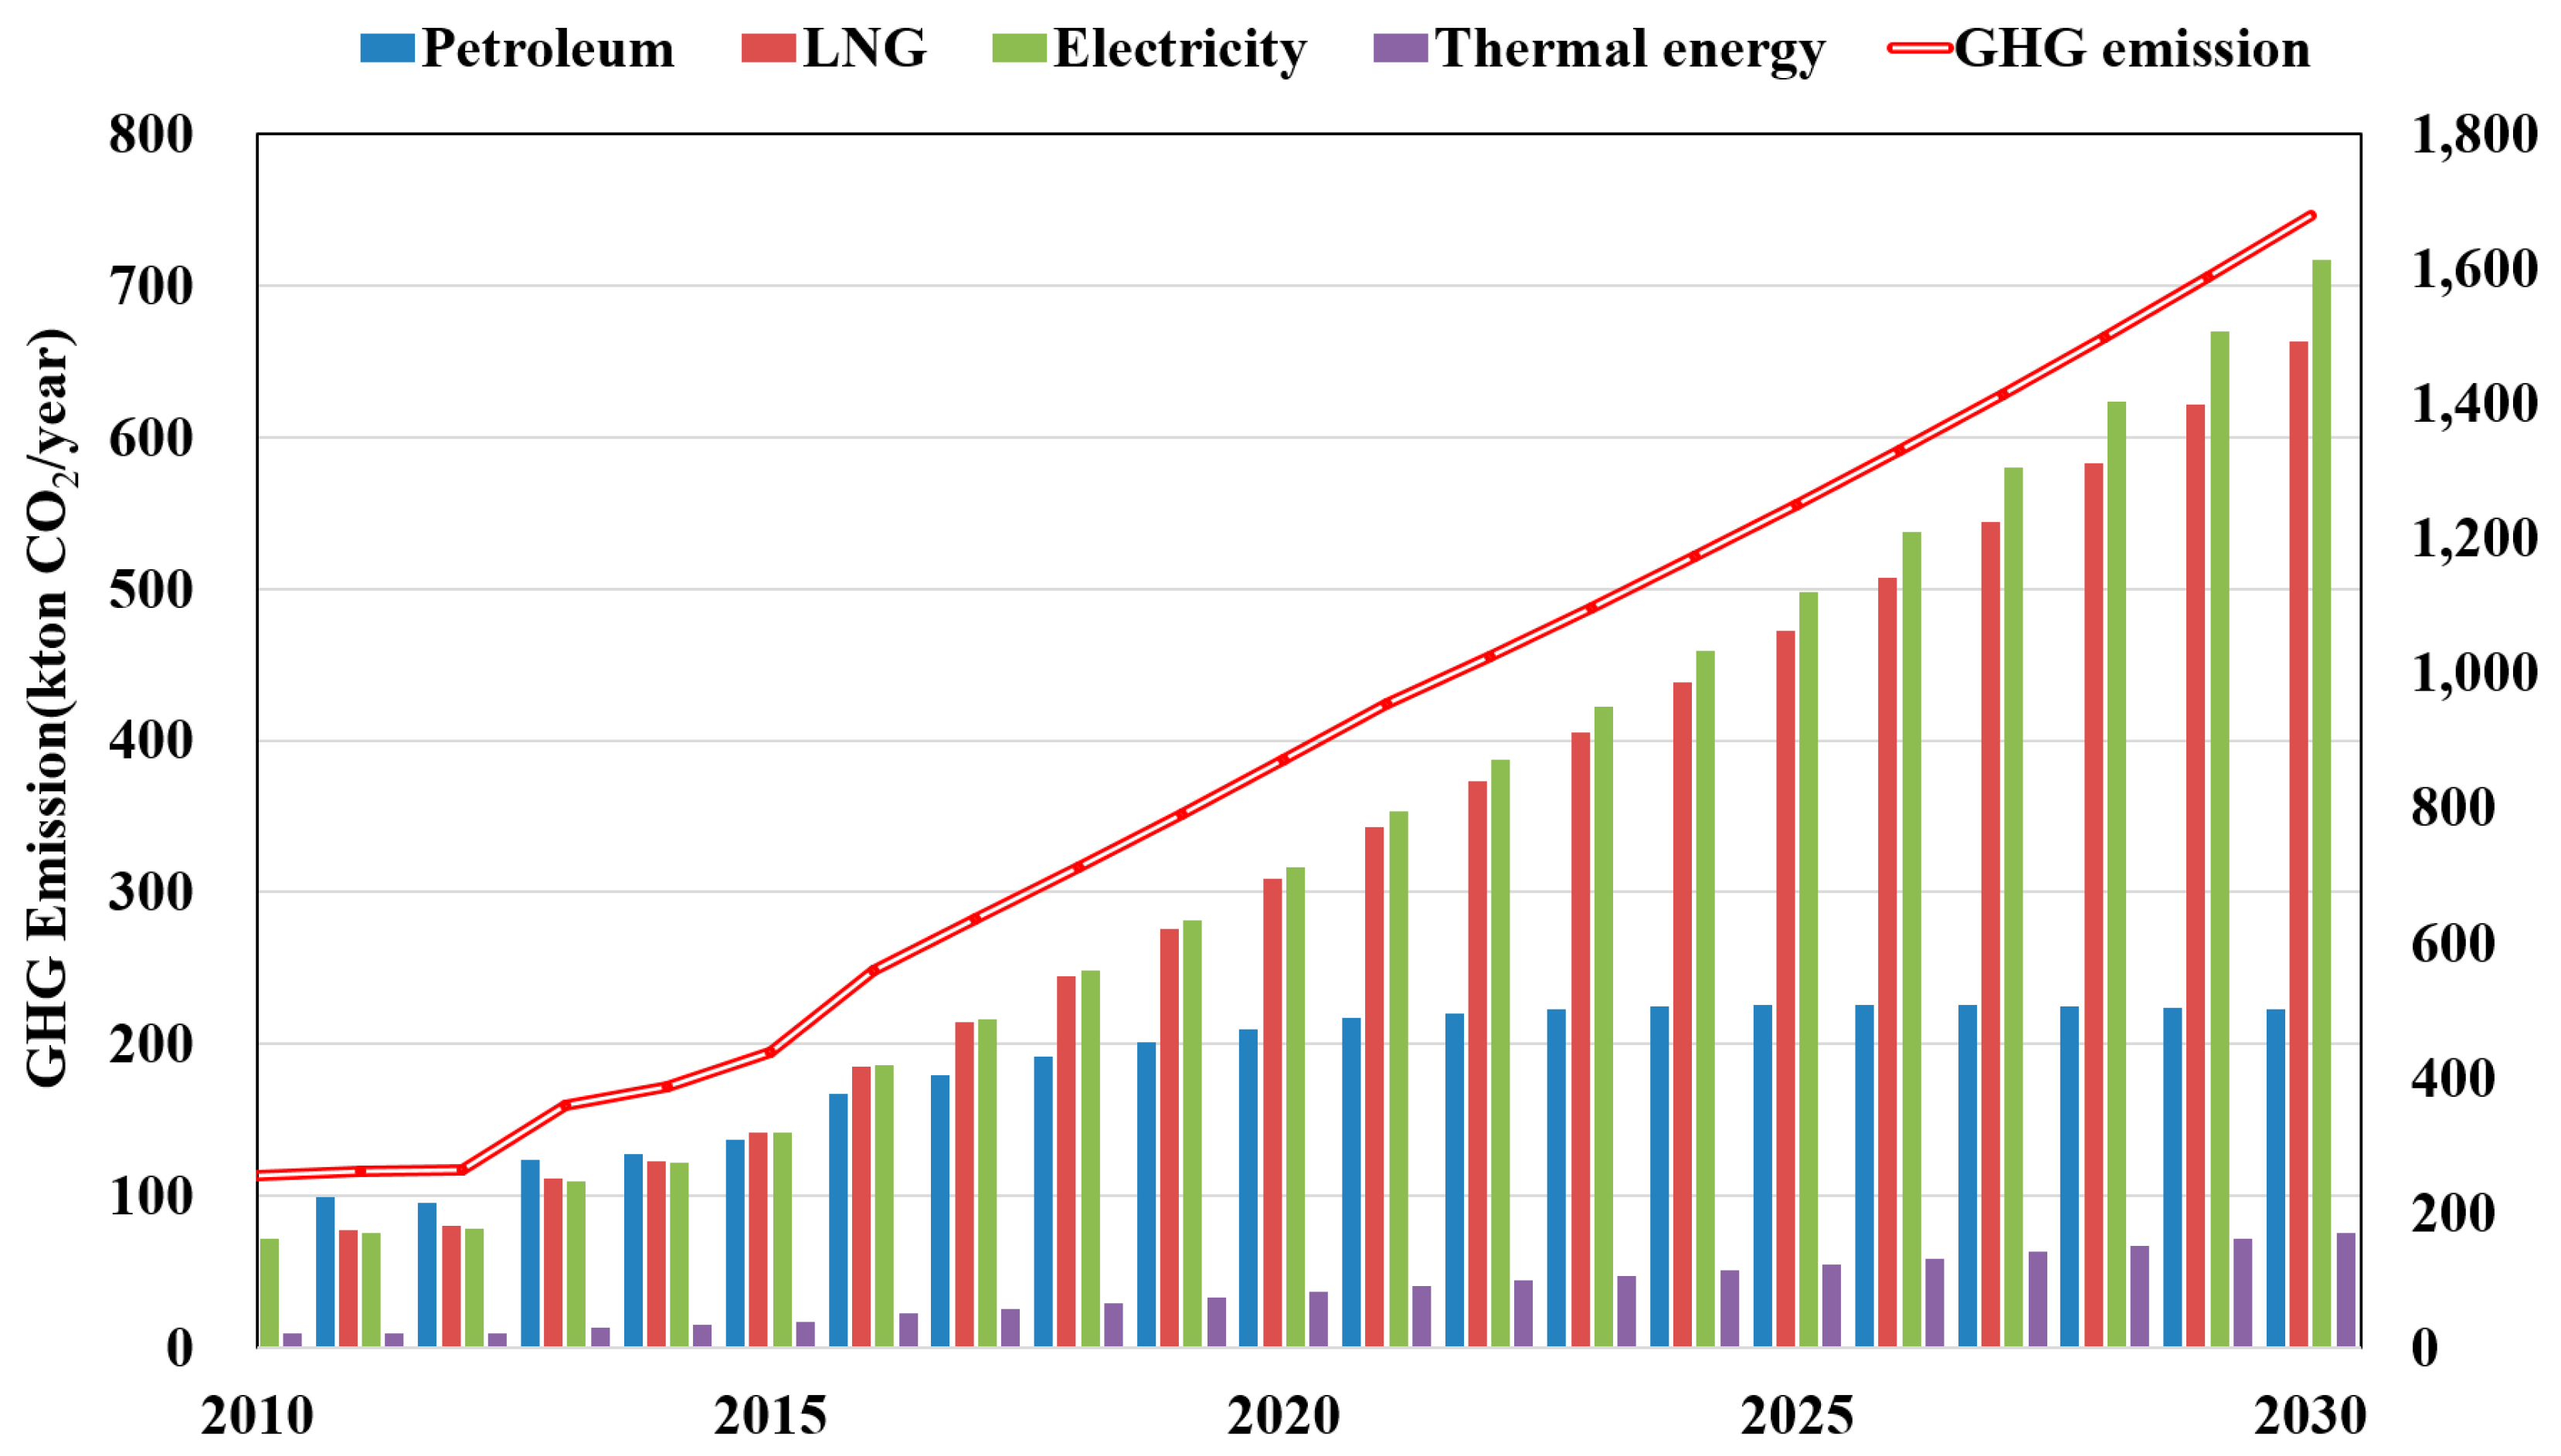
4.1. Business as Usual (BAU) Scenario
4.2. Renewable Energy Supply Target Scenario (REST-S)
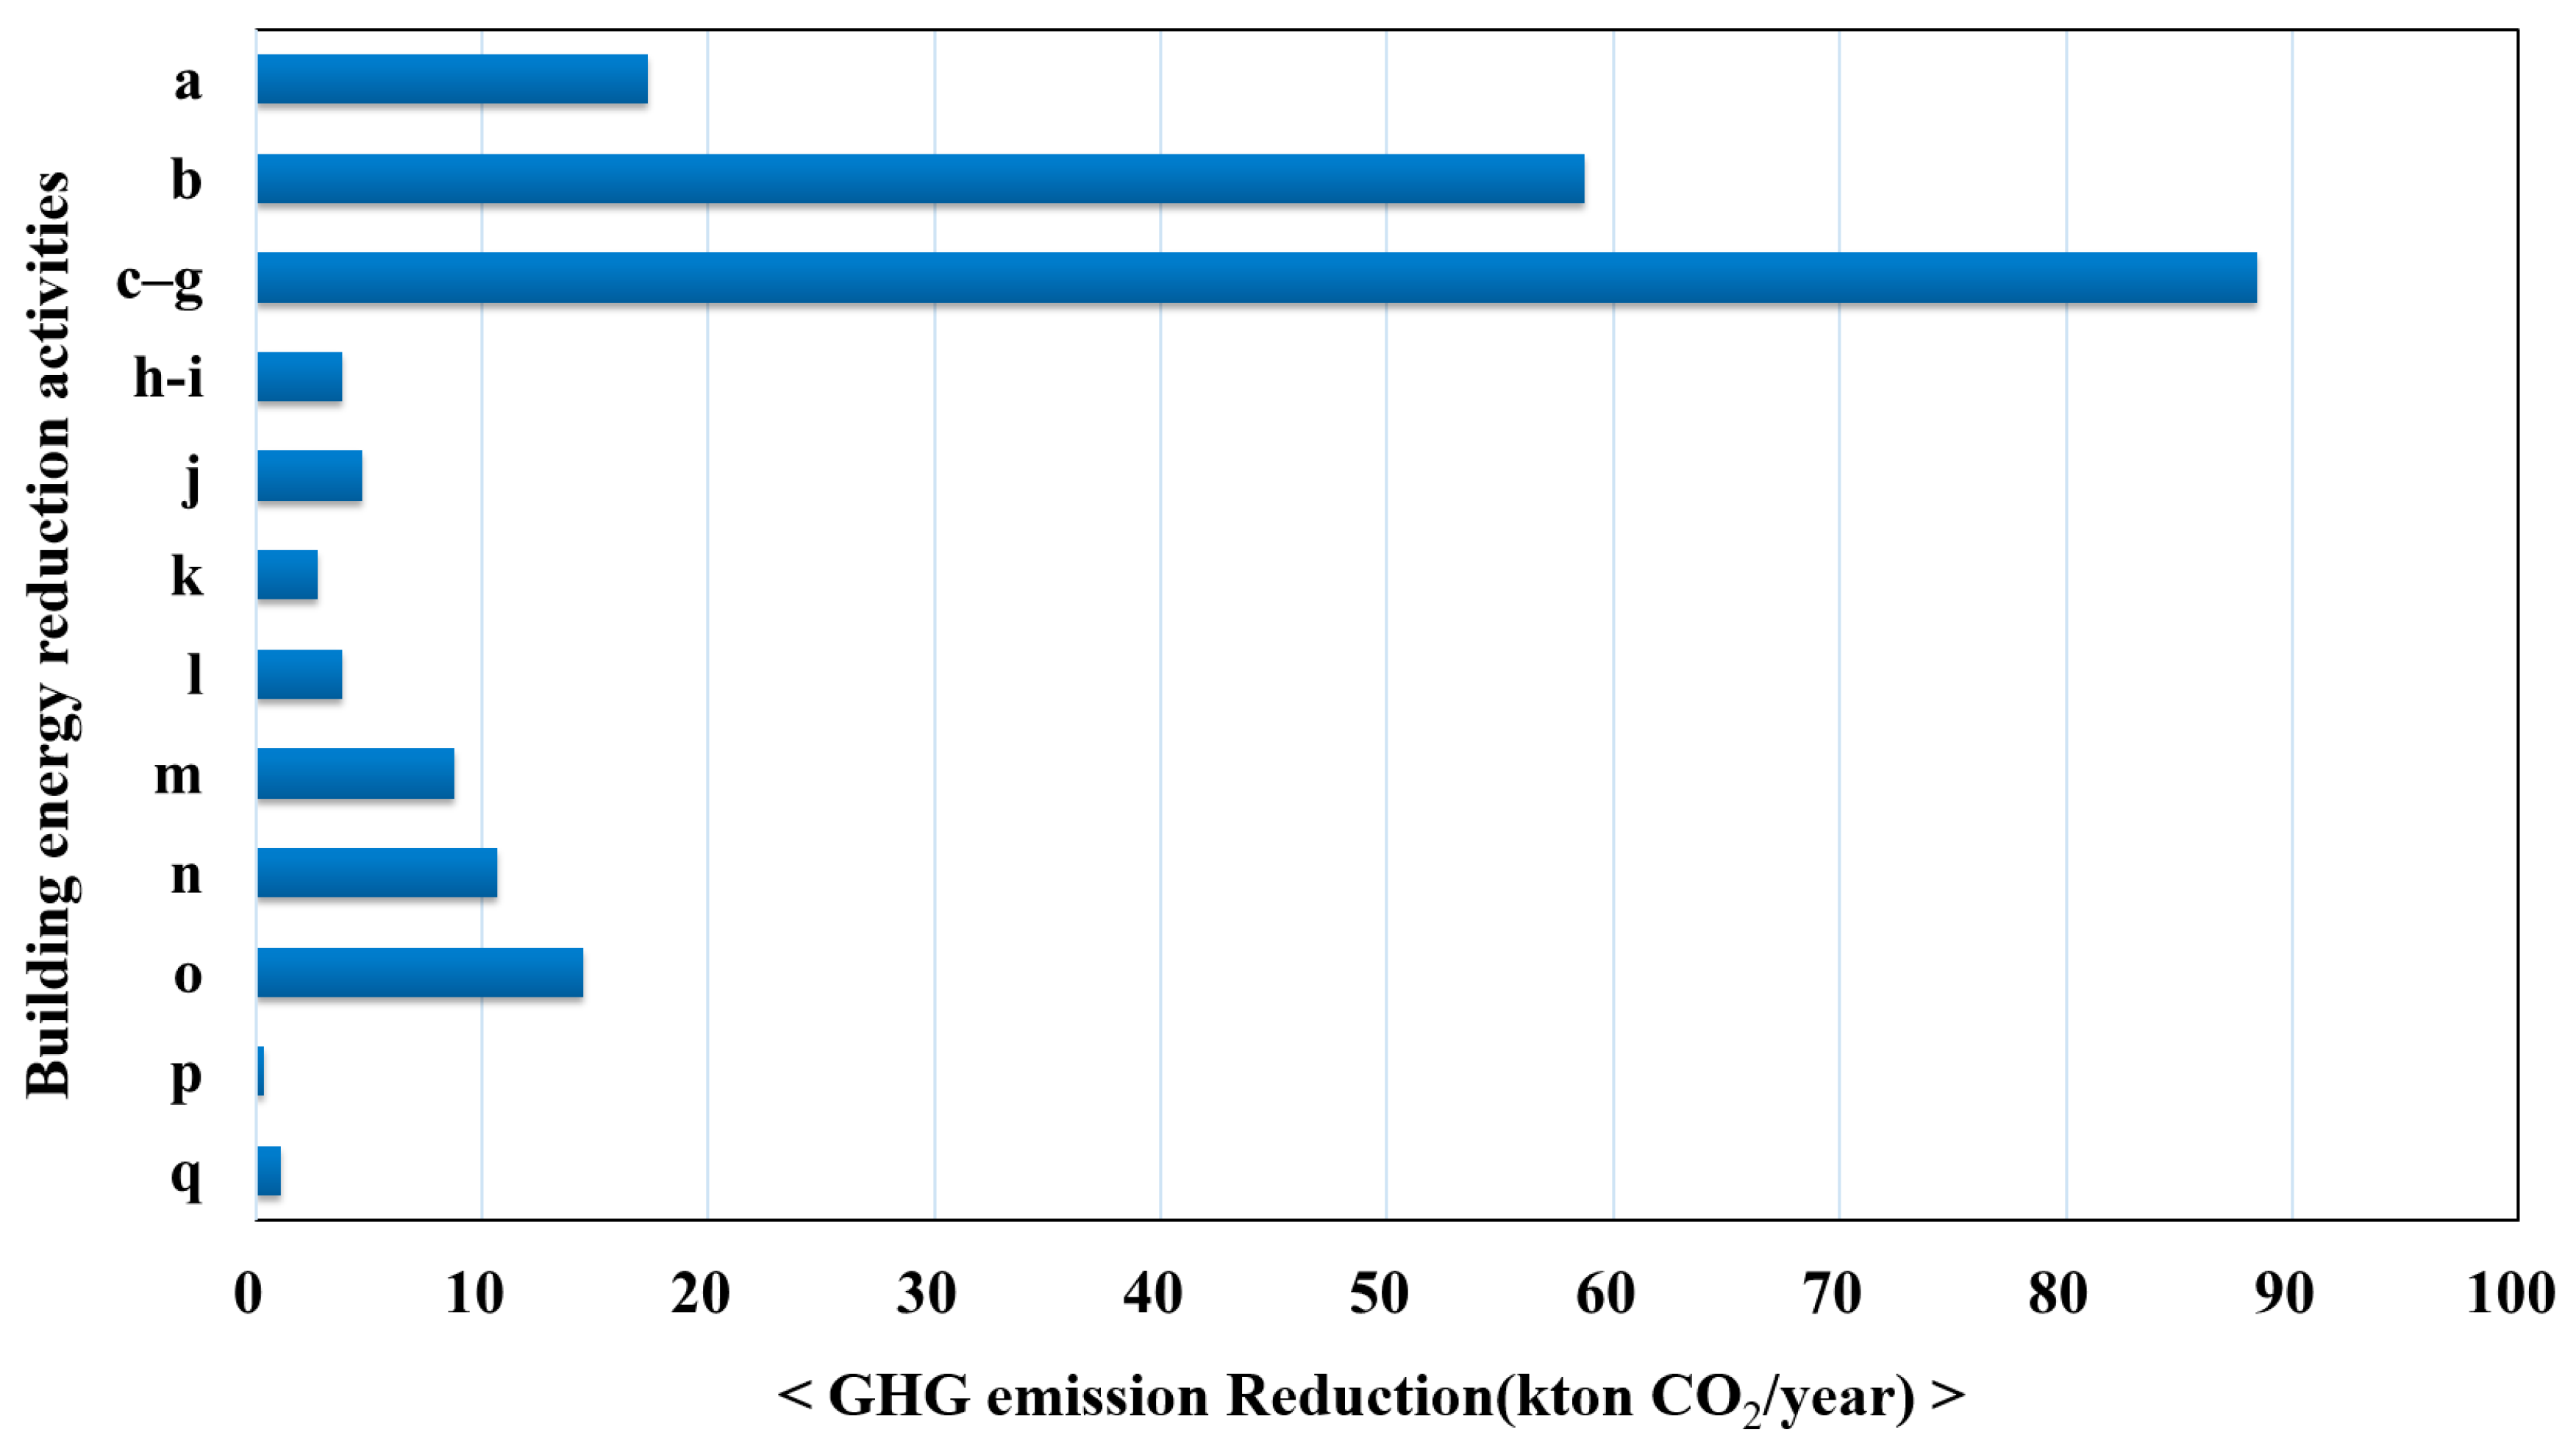
4.3. Building Energy Saving (BESS) Scenario
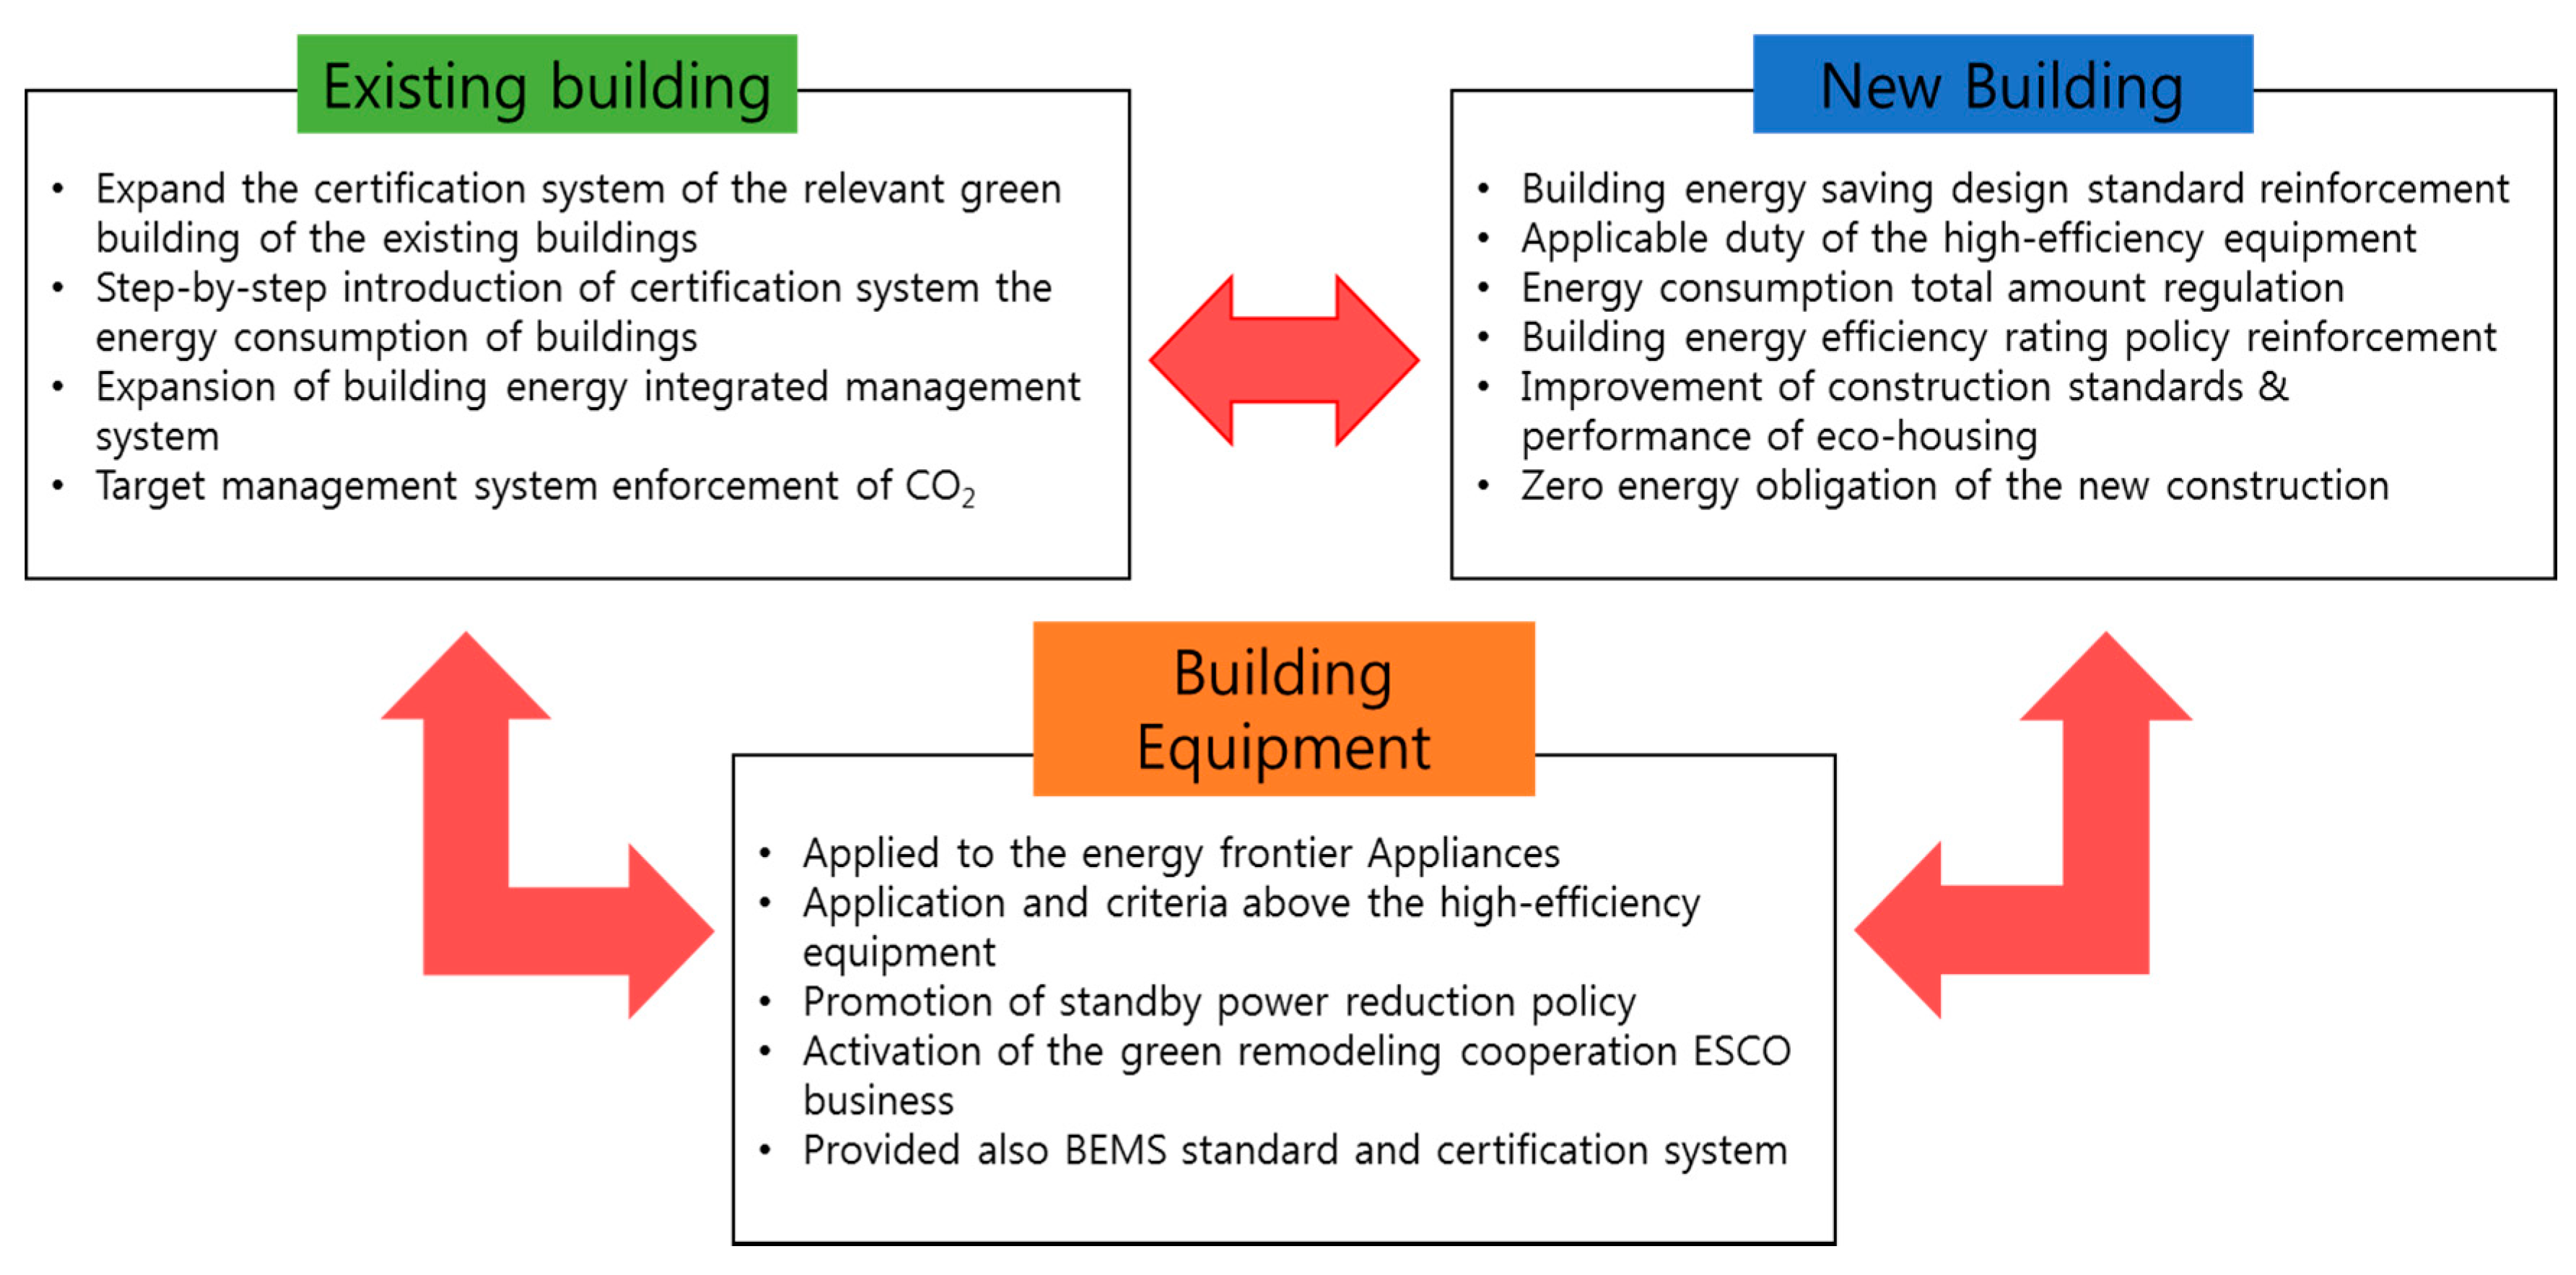
4.4. Building Energy Policy (BEP) Scenario
5. Conclusions
Author Contributions
Funding
Acknowledgments
Conflicts of Interest
References
- United Nations Framework Convention on Climate Change (UNFCCC). Kyoto Protocol to the United Nations Framework Convention on Climate Change; UNFCCC: Rio de Janeiro, Brazil, 1998. [Google Scholar]
- Korea Energy Agency (KEA). Green Home 1 million Supply Project; Korea Energy Agency: Seoul, Korea, 2015. [Google Scholar]
- Ministry of Land, Infrastructure and Transport (MOLIT). Green Remodeling Activities Method for Building Energy Demand Reduction; Ministry of Land, Infrastructure and Transport: Sejong Special Governing City, Korea, 2013.
- GIR. GHG Projection and Mitigation Research; Greenhouse Gas Inventory and Research Center of Korea, 2014.
- Jo, M.H.; Park, N.B.; Jeon, E.C. Application of LEAP Model to Reduce GHG Emissions from Residential Sector. J. Clim. Chang. Res. 2013, 4, 221–233. [Google Scholar]
- Koo, J.W.; Hong, T.H.; Kim, J.M.; Kim, H.J. An integrated multi-objective optimization model for establishing the low-carbon scenario 2020 to achieve the national carbon emissions reduction target for residential buildings. Renew. Sustain. Energy Rev. 2015, 49, 410–425. [Google Scholar] [CrossRef]
- Makido, Y.; Dhakal, S.; Yamagata, Y. Relationship between urban form and CO2 emissions: Evidence from fifty Japanese cities. Urban Clim. 2012, 2, 55–67. [Google Scholar] [CrossRef]
- Tan, X.C.; Dong, L.L.; Chen, D.X.; Gu, B.H.; Zeng, Y. China’s regional CO2 emissions reduction potential: A study of Chongqing city. Appl. Energy 2016, 162, 1345–1354. [Google Scholar] [CrossRef]
- Wang, H.S.; Wang, Y.X.; Wang, H.K.; Liu, M.M.; Zhang, Y.X.; Zhang, R.R.; Yang, J.; Bi, J. Mitigating greenhouse gas emissions from China’s cities: Case study of Suzhou. Energy Policy 2015, 68, 482–489. [Google Scholar] [CrossRef]
- Chaturvedi, V.; Eom, J.Y.; Clarke, L.E.; Shukla, P.R. Long term building energy demand for India: Disaggregating end use energy services in an integrated assessment modeling framework. Energy Policy 2014, 64, 226–242. [Google Scholar] [CrossRef]
- Lin, B.Q.; Liu, H.X. CO2 emissions of China’s commercial and residential buildings: Evidence and reduction policy. Build. Environ. 2015, 92, 418–431. [Google Scholar] [CrossRef]
- Pukšec, T.; Mathiesen, B.V.; Duic, N. Potentials for energy savings and long term energy demand of Croatian households sector. Appl. Energy 2013, 101, 15–25. [Google Scholar] [CrossRef][Green Version]
- Promjiraprawat, K.; Winyuchakrit, P.; Limmeechokchai, B.; Masui, T.; Hanaoka, T.; Matsuoka, Y. CO2 mitigation potential and marginal abatement costs in Thai residential and building sectors. Energy Build. 2014, 80, 631–639. [Google Scholar] [CrossRef]
- Lin, J.Y.; Cao, B.; Cui, S.G.; Wang, W.; Bai, X.M. Evaluating the effectiveness of urban energy conservation and GHG mitigation measures: The case of Xiamen city, China. Energy Policy 2010, 38, 5123–5132. [Google Scholar] [CrossRef]
- Ministry of Land, Infrastructure and Transport (MOLIT). Low-Carbon New Cities Foundation Plans; Ministry of Land, Infrastructure and Transport: Sejong Special Governing City, Korea, 2010.
- Multifunctional Administrative City Construction Agency (MACCA). Green City Construct Comprehensive Planning; Multifunctional Administrative City Construction Agency: Seoul, Korea, 2015.
- Wilfredo, C.F.; Benjamin, B.; Hugo, N.P.; Ameena, A.; Sergio, R. A National Strategy Proposal for Improved Cooking Stove Adoption in Honduras: Energy Consumption and Cost-Benefit Analysis. Energies 2020, 13, 921. [Google Scholar] [CrossRef]
- Lixiao, Z.; Yueyi, F.; Bin, C. Alternative Scenarios for the Development of a Low-Carbon City: A Case Study of Beijing, China. Energies 2011, 4, 2295–2310. [Google Scholar] [CrossRef]
- Davis, M.; Ahiduzzaman, M.; Kumar, A. How will Canada’s greenhouse gas emissions change by 2050? A disaggregated analysis of past and future greenhouse gas emissions using bottom-up energy modelling and Sankey diagrams. App. Energy 2018, 220, 754–786. [Google Scholar] [CrossRef]
- Dai, H.; Masui, T.; Matsuoka, Y.; Fujimori, S. Assessment of China’s climate commitment and non-fossil energy plan towards 2020 using hybrid AIM/CGE model. Energy Policy 2011, 39, 2875–2887. [Google Scholar] [CrossRef]
- Heaps, C. Integrated Energy-Environment Modelling and LEAP; SEIBoston and Tellus Institute: Boston, MA, USA, 2002. [Google Scholar]
- Heaps, C.G. Long-Range Energy Alternatives Planning (LEAP) System; Software Version: 2018.1.27; Stockholm Environment Institute: Somerville, MA, USA, 2016. [Google Scholar]
- Huang, B.J.; Mauerhofer, V.; Geng, Y. Analysis of existing building energy saving policies in Japan and China. J. Clean. Prod. 2016, 112, 1510–1518. [Google Scholar] [CrossRef]
- Korea’s Portal on Official Statistics (KOSIS). Statistical Database of Population/Households; Korean Statistical Information Service: Daejeon, Korea, 2015.
- EPSIS. Statistics of the Feed Rate of Home and Office Appliances. Electric Power Statistics Information System. South Korea. 2018. Available online: http://epsis.kpx.or.kr/epsis/ (accessed on 25 August 2020).
- Lee, S.T.; Chong, W.O. Causal relationships of energy consumption, price, and CO2 emissions in the U.S. building sector. Resour. Conserv. Recycl. 2016, 107, 220–226. [Google Scholar] [CrossRef]
- Bass, F.M. A Dynamic Model of Market Share and Sales Behavior. In Proceedings of the Winter Conference American Marketing Association, Chicago, IL, USA, 27–28 December 1963; p. 269. [Google Scholar]
- Bass, F.M. A new product growth model for consumer durables. Manag. Sci. 1969, 15, 215–217. [Google Scholar] [CrossRef]
- Lenk, P.J.; Rao, A. New Models from Old: Forecasting Product Adoption by Hierarchical Bayes Procedure. Market. Sci. 1990, 9, 42–53. [Google Scholar] [CrossRef]
- Srinivasan, V.; Mason, C.H. Nonlinear Least Squares Estimation of New Product Diffusion Models. Market. Sci. 1986, 5, 169–178. [Google Scholar] [CrossRef]
- Multifunctional Administrative City Construction Agency (MACCA). Multifunctional Administrative City—Total Project Management of Technology Supply in MAC; Multifunctional Administrative City Construction Agency: Seoul, Korea, 2010.
- Multifunctional Administrative City Construction Agency (MACCA). GHG Emission Reduction Plan Establishment of Multifunctional Administrative City; Multifunctional Administrative City Construction Agency: Seoul, Korea, 2013.
- Heinz, B.; Graeber, M.; Praktiknjo, A.J. The diffusion process of stationary fuel cells in a two-sided market economy. Energy Policy 2013, 61, 1556–1567. [Google Scholar] [CrossRef]
- Islam, T. Household level innovation diffusion model of photo-voltaic (PV) solar cells from stated preference data. Energy Policy 2014, 65, 340–350. [Google Scholar] [CrossRef]
- Palmer, J.; Sorda, G.; Madlener, R. Modeling the diffusion of residential photovoltaic systems in Italy: An agent-based simulation. Technol. Forecast. Soc. 2015, 99, 106–131. [Google Scholar] [CrossRef]
- Kumar, R.; Agarwala, A. Renewable energy technology diffusion model for techno-economics feasibility. Renew. Sustain. Energy Rev. 2016, 54, 1515–1524. [Google Scholar] [CrossRef]
- Trading Economics. South Korea Indicators. 2018. Available online: http://www.tradingeconomics.com/ (accessed on 25 June 2020).
- Korea Energy Economics Institute (KEEI). Regional Energy Statistics; Korea Energy Economics Institute: Seoul, Korea, 2014. [Google Scholar]
- Ministry of Trade, Industry and Energy (MOTIE). Development and Use Spread Basic Plan of Renewable Energy Technologies Ⅲ; Ministry of Trade, Industry and Energy: Sejong-si, Korea, 2008.
- Ministry of Trade, Industry and Energy (MOTIE). Development and Use Spread Basic Plan of Renewable Energy Technologies Ⅲ; Ministry of Trade, Industry and Energy: Sejong-si, Korea, 2009.
- Mavromatidis, G.; Orehounig, K.; Richner, P.; Carmeliet, J. A strategy for reducing CO2 emissions from buildings with the Kaya identity—A Swiss energy system analysis and a case study. Energy Policy 2016, 88, 343–354. [Google Scholar] [CrossRef]
- Droutsa, K.G.; Kontoyiannidis, S.; Dascalaki, E.G.; Balaras, C.A. Mapping the energy performance of hellenic residential buildings from EPC (energy performance certificate) data. Energy 2016, 98, 284–295. [Google Scholar] [CrossRef]


| Indicators a | Assumptions | 2020 | 2030 |
|---|---|---|---|
| Population | Surveyed data (2015–2020) Annual average 4.5% p.a. increase (2020–2030) | 341,895 | 698,213 |
| Residential area () | Surveyed data (2015–2020) Annual average 9.2% p.a. increase (2020–2030) | 6,326,689 | 16,372,027 |
| Commercial area () | Surveyed data (2015–2020) Annual average 11.5% p.a. increase (2020–2030) | 3,721,529 | 8,912,270 |
| Gross domestic product (GDP) (billion USD) | Surveyed data (2015–2020) Annual average 3.45% p.a. increase (2020–2030) | 1919.39 | 2,245.65 |
| Year | Petroleum (%) | LNG (%) | Electricity (%) | Thermal Energy (%) |
|---|---|---|---|---|
| 15–20 | −4.445 | 1.093 | 1.715 | 1.004 |
| 20–25 | −4.074 | 0.549 | 1.548 | 0.611 |
| 25–30 | −3.385 | 0.223 | 1.105 | 0.333 |
| Fuel | Petroleum | LNG | Electricity | Thermal Energy | |
|---|---|---|---|---|---|
| Unit | tCO2/person | ||||
| Year | 2015–2030 | 1.383 | 0.813 | 0.778 | 0.102 |
| Population | 501,600 | 222,652 | 662,924 | 717,309 | 75,702 |
| Total | 1,678,587 tCO2/yr | ||||
| Renewable Energy Source Type | Coefficient of Innovation (p) | Coefficient of Imitation (q) | Conversion Factor | Coefficient of Utilization a (%) | Market Potential a (M) | Heat Production (kWh) | CO2 Emission Reduction (tCO2/yr) |
|---|---|---|---|---|---|---|---|
| 1. Solar thermal (2015–2030) 1.1 Single-family house supply (Green home project) 1.2 Residential building (Multi-family house) supply 1.3 Commercial building supply | 1.003 × 10⁻⁴ | 0.535 | 1.60 × 10⁻⁴ | 75 | 284,846 (Collecting area, m2) | 224,876,784 | 34,257 |
| 2. Fuel Cell (2015–2030) | 1.10 × 10⁻³ | 0.413 | 4.71 × 10⁻⁴ | 50 | 72 (Supply rate, ea) | 518,400 | 89,566 |
| 3. Energy Storage System (2015–2030) | 0.843 × 10⁻⁴ | 0.627 | - | 50 | 6,180,000 (Energy storage, kWh) | 6,180,000 | 142,152 |
| 4. Photovoltaic (2015–2030) 4.1 Single-family house supply 4.2 Residential building (Multi-family house) supply 4.3 Public facility supply | 1.37 × 10⁻⁴ | 0.323 | 4.71 × 10⁻⁴ | 75 | 314,788 (Collecting area, m2) | 226,858,158 | 106,737 |
| 5. Geothermal system (2015–2030) 5.1 Single-family house supply 5.2 Residential building (Multi-family house) supply 5.2 Commercial building supply | 0.48 × 10⁻⁴ | 0.268 | 4.71 × 10⁻⁴ 1.60 × 10⁻⁴ (District heating) | 50 | 304,524 (Installed capacity, kWh) | 404,407,827 | 38,487 |
| Building Energy Reduction Activities a | Index | Calculation Formula | CO2 Emission Reduction (tCO2/Year) |
|---|---|---|---|
| a. HEMS (Home energy management system) supply a | HEMS diffusion rate (%) | - | 17,350 |
| b. BEMS (Building energy management system) supply a | BEMS diffusion rate (%) | - | 58,745 |
| c. Use of standby power reduction product d. The use of high-efficiency equipment e. The use of high-efficiency LED lighting f. The use of commercial high-efficiency air handling unit g. The use of latent heat recovery type hot water boiler | Utilization of standby power 1W equipment (%) Building total area (m2) LED utilization (%) Utilization of high-efficiency air conditioner (%) Apply the number of latent heat recovery type boilers Utilization of standby power reduction products | Reduction per unit (kg/m2/year) × building total area (m2) × diffusion rate (%) | 88,465 |
| h. Development of low-carbon Green village model b i. Build a roadmap of low-carbon Green village b | Current status of the construction of Green village | - | 3820 |
| j. Practice exercise deployment of Green village b | Practice exercise diffusion | - | 4734 |
| k. Consultant training and management of climate change b | Consultant (climate coordination) training person | - | 2708 |
| l. Demonstration home the town designated as the expansion of eco family b | Eco-family village test The number of eco-family town | - | 3844 |
| m. Social marketing support for the company and exercise deployment of green work b | Participation rate of green workplace exercise | - | 8754 |
| n. Reasonable limitation proposal of indoor air-conditioning temperature | Enforcement rate (%) Building total area (m2) Control temperature (℃) | Reduction per unit (kg/m2) × building total area (m2) × temperature control (°C) × enforcement rate (%) | 10,648 |
| o. Strengthening of green life practice network and campaign deployment | Green living practice rate of citizen | - | 14,462 |
| p. Expansion and off practice after work | Building total area (m2) Off enforcement rate after business (%) | Reduction per unit (kg/m2/year) × building total area (m2) × enforcement rate (%) | 345 |
| q. Company employee lunch break room off practice building total area (m2) | Building total area (m2) Lunch break off enforcement rate (%) | 1130 |
| Energy Policy Category a | Target | Application Rate | Implementation Method | Year CO2 Emission Reduction (tCO2/yr) | ||||
|---|---|---|---|---|---|---|---|---|
| 2015 | 2020 | 2025 | 2030 | Total | ||||
| a. Expansion and improvement of green home system | New building | 70% | 2015 year standards, strengthening of 5% added in the five-year unit, up to 20% enhanced | 10,413 | 11,480 | 12,054 | 12,657 | 46,604 |
| b. Carbon grading system is also effective | Existing/New building | 40% | 2015 year standards, 10% additional applied in the five-year unit, up to 40% of the application | 12,384 | 14,984 | 18,131 | 21939 | 67,438 |
| c. Strengthening of energy design criteria of the building | New building | 70% | 2015 year standards, strengthening of 5% added in the five-year unit, up to 20% enhanced | 14,670 | 17,750 | 21,478 | 25,988 | 79,886 |
| d. Implementation of GHG and energy target management system of the building | Existing/New building | 60% | Since 2015 year, sustained enforcement | 8740 | 11,536 | 15,228 | 20,101 | 55,605 |
| e. Strengthen the building energy efficiency rating system | Existing/New building | 80% | 2015 year standards, strengthening of 5% added in the five-year unit, up to 20% enhanced | 7873 | 11,258 | 16,099 | 23,022 | 58,252 |
| f. Implementation of energy consumption total system | Existing/New building | 80% | Since 2015 year, sustained enforcement | 3348 | 4787 | 6846 | 9790 | 24,771 |
Publisher’s Note: MDPI stays neutral with regard to jurisdictional claims in published maps and institutional affiliations. |
© 2020 by the authors. Licensee MDPI, Basel, Switzerland. This article is an open access article distributed under the terms and conditions of the Creative Commons Attribution (CC BY) license (http://creativecommons.org/licenses/by/4.0/).
Share and Cite
Kim, S.-H.; Lee, S.; Han, S.-Y.; Kim, J.-H. Scenario Analysis for GHG Emission Reduction Potential of the Building Sector for New City in South Korea. Energies 2020, 13, 5514. https://doi.org/10.3390/en13205514
Kim S-H, Lee S, Han S-Y, Kim J-H. Scenario Analysis for GHG Emission Reduction Potential of the Building Sector for New City in South Korea. Energies. 2020; 13(20):5514. https://doi.org/10.3390/en13205514
Chicago/Turabian StyleKim, Seo-Hoon, SungJin Lee, Seol-Yee Han, and Jong-Hun Kim. 2020. "Scenario Analysis for GHG Emission Reduction Potential of the Building Sector for New City in South Korea" Energies 13, no. 20: 5514. https://doi.org/10.3390/en13205514
APA StyleKim, S.-H., Lee, S., Han, S.-Y., & Kim, J.-H. (2020). Scenario Analysis for GHG Emission Reduction Potential of the Building Sector for New City in South Korea. Energies, 13(20), 5514. https://doi.org/10.3390/en13205514


