Article

Experimental Study on Displacement of Water by Sub-Zero N-Hexanol in a Straight Channel

1
Key Laboratory of Ocean Energy Utilization and Energy Conservation of Ministry of Education, Dalian University of Technology, Dalian 116024, China
2
School of Energy and Power Engineering, Dalian University of Technology, Dalian 116024, China
3
School of Naval Architecture, Dalian University of Technology, Dalian 116024, China
*
Author to whom correspondence should be addressed.
Energies 2020, 13(20), 5409; https://doi.org/10.3390/en13205409
Submission received: 20 July 2020 / Revised: 12 October 2020 / Accepted: 14 October 2020 / Published: 16 October 2020
(This article belongs to the Section K: State-of-the-Art Energy Related Technologies)

Abstract

:
Series of displacement tests of water by cold n-hexanol (below 0 °C) in a straight tube were conducted to investigate the freezing-accompanied displacement process, which occurs during the cryogenic fracturing process. The interrelationship between water freezing and displacement flow was studied. It was found that the displacement flow could significantly affect the water distribution in the flow channel. Along with the displacement proceeding, the n-hexanol overtook the water in the flow direction gradually, and the water in the center of the channel was driven to the edge area. Moreover, the initially integrated water phase split into several parts during the displacement process. Once the water freezing occurred, two typical ice blockage patterns, i.e., complete ice blockage and incomplete ice blockage, were observed. In incomplete ice blockage pattern, the channel cross-section was partly occupied by the ice phase, which mainly affected the rate of subsequent fluid flow. In complete ice blockage pattern, the channel cross-section was fully occupied by the ice phase, which cut off the fluid flow in the original direction. Based on the test results, the influences of the initial water temperature, initial water column length and flow rate of n-hexanol on the formation of different ice blockage patterns are discussed. The decrease of the initial water temperature and the increase of the initial water column length are preferred to induce the occurrence of complete ice blockage. However, changing n-hexanol flow rate could lead to the occurrence of both incomplete ice blockage and complete ice blockage, which depends on the actual situations.

Graphical Abstract

1. Introduction

Cryogenic fracturing [1,2,3,4] is a newly developed method using cryogenic fluid (LN2, LCO2) as the fracturing fluid, which is normally employed for waterless reservoir stimulation. Cryogenic fracturing utilizes the cold status of the fracturing fluid to introduce thermal shocks into the reservoir, which is acknowledged to be a more efficient way to fracture low-permeability reservoirs in comparison to conventional hydraulic fracturing techniques. Since no water is used in cryogenic fracturing, the hard issues induced by hydraulic fracturing, such as the heavy consumption of water, formation damage, and chemical agent pollution, can be avoided. In recent years, cryogenic fracturing has received increasing attention from scholars and engineers due to its outstanding characteristics. Cryogenic fracturing is expected to be a potential substitute for the hydraulic fracturing technique.
The concept of cryogenic fracturing was proposed in the 1980s. The feasibility of cryogenic fracturing in reservoir stimulation was proved by a well-known field test using LN2 as the fracturing fluid in 1998 [5]. Thereafter, various studies were carried out to investigate the cryogenic fracturing [6,7,8,9,10,11,12,13,14,15,16,17,18,19,20]. Most of these investigations are based on experimental results, which mainly focused on the mechanical changes of the reservoir stratum (evolution of permeability, initiation and propagation of cracks, alteration of mechanical properties, etc.) during cryogenic fracturing. In these studies, X-ray CT, magnetic resonance imaging (MRI) and acoustic signatures are commonly used to collect data from the reservoir rock samples during the cryogenic stimulation. However, studies on heat and mass transfer during cryogenic fracturing are still lacking. Heat and mass transfer could significantly affect the temperature evolution in the reservoir during the cryogenic fracturing process, further influencing the result of fracturing. Moreover, heat and mass transfer during cryogenic fracturing is a complex process which involves the synergy of the multiphase flow, porous flow, heat exchange and phase change [2,21]. Accordingly, the investigation of the heat and mass transfer during cryogenic fracturing could facilitate understanding the dynamic change of the reservoir status during fracturing. Thereafter, significant guidance could be provided to improve the fracturing efficiency in practical engineering.
The process of cryogenic fracturing is schematically shown in Figure 1. The rock fracturing results from the heat and mass transfer process that takes place in the countless pore channel/cracks within the reservoir. Investigating the physical process in a single channel (Figure 1b) is better for understanding the local fracturing process. The displacement flow of the residual water induced by the cryogenic fracturing would become an important factor for the fracturing process. The cooling down of the water by the cryogenic fracturing fluid and the flowing of the water would occur simultaneously. This would lead to the water freezing into ice during the displacement process, which is different from the general freezing patterns at static conditions. Solidification phase change under dynamic flow conditions is widely studied in the practical engineering. In the transportation of gas hydrate [22], hydrate nucleation and growth phenomena could occur in the pipeline under high pressure and low temperature state. The formation of hydrate crystals through the nucleation process would either flow in the aqueous phases or deposit onto the pipe surface. As a certain amount of crystals aggregate together, hydrate-plug forms and the pipes could be occluded. The displacement process during cryogenic fracturing is similar to the gas hydrate transportation process in the nucleation process which commonly occurs under a dynamic multiphase flow situation. Nevertheless, the flow conditions in the two processes are not exactly the same since the displacement flow is not involved in the gas hydrate transportation process. As a result, the displacement process of residual water within the reservoir during cryogenic fracturing, in which displacement flow and water freezing are coupled together, is still unclear. In this work, a series of displacement tests using cold n-hexanol in a straight tube were conducted to preliminarily investigate the freezing pattern of water during the displacement process. The main influencing factors for the different freezing pattern are studied. Interrelationship between the freezing process and the displacement flow is discussed based on the experimental results. The current study aimed to provide a basic understanding of the freezing process of water being displaced, which would potentially lay a foundation for further in-depth investigations of the practical cryogenic fracturing process for future studies.

2. Materials and Methods

2.1. The Preparation of the Displacement Medium

The n-hexanol and tap water were used as the displacing fluid and the displaced fluid, respectively. The physical properties of n-hexanol are listed in Table 1. It is seen that n-hexanol would stay in a stable liquid form below the freezing point of water at atmospheric pressure. Meanwhile, the solubility of n-hexanol is relatively low in water. Obvious stratification would occur when n-hexanol and water are mixed together. Therefore, a clear interface between the two fluid phases could be well visualized. These features make n-hexanol a suitable choice of the displacing fluid in the current study. Since n-hexanol and water are both colorless and transparent at their original state, a small amount of direct violet 51 (a kind of violet color agent) was added into the water to enhance the visual contrast.

2.2. Test Setup

The schematic diagram of the whole test setup is shown in Figure 2a. A DHX-4050 thermostat bath was used to control the initial temperature of the displacing fluid. A peristaltic pump (regulation range from 4 to 100 mL/min) was adopted to regulate the initial flow rate of the displacing fluid. A sighting tube made of borosilicate glass was used to observe the displacement process. The length and the inner diameter of the tube were 600 and 5 mm, respectively. The tube was fixed by two tube bearings, as shown in Figure 2b. The ruler was used to locate the displacement fluid. A notch was set on the side of the tube, which allowed the pre-adding of displaced liquid and the air exhausting. The width of the notch was 1 mm, and it remained facing upward during the whole test duration. The initiation and propagation of the displacement processes were recorded by a Sony HDR-CX550E digital video camera. The camera was attached to a sliding rail parallel to the sighting tube. Therefore, the camera could move along the flow direction to track the whole displacement process. The local temperature variations during the displacement process were probed by five GG-K-36 thermocouples located at 1, 3, 10, 20 and 30 cm from the initial section of the tube, respectively. All the probes of the thermocouples were arranged at the outside wall of the sighting tube to avoid affecting the inner flow status. The whole test setup was arranged in a refrigeration storage, the temperature of which could be adjusted from −20 to 10 °C with an error of ±0.2 °C.

2.3. Test Procedure

The test procedure is schematically plotted in Figure 3. Figure 3a shows that the displaced fluid was previously introduced into the tube through the notch. The displaced fluid presented as a liquid column due to the surface tension, which made it possible to determine the original location and the original length of the displaced fluid. Then, the displacing fluid was adjusted to the required temperature in the thermostat bath. After the temperature of the displacing fluid reached the setting value, the peristaltic pump was turned on and the displacing fluid was injected into the tube from the left inlet, as shown in Figure 3b. The whole displacement process was recorded by the digital camera and the local temperature variations were continually recorded by the thermocouples. After the fluids moved to the right end of the tube, the peristaltic pump was turned off, which suggested the end of the test.

2.4. The Setting of the Test Conditions

Two groups (Groups A and B) of tests were conducted in this work. The interrelationship between the freezing process and displacement process was studied in the two groups of tests. In Group A, displacement tests were conducted with the temperature condition of water and n-hexanol setting as the same (isothermal displacement flow). The main focus of Group A was the flow pattern of the displaced fluid (water) during the displacement process. In Group B, water was displaced by n-hexanol of a sub-zero temperature, which could cause water freezing during the displacement process (freezing-accompanied displacement flow). The main focus of Group B was the freezing pattern during the displacement process as well as its influence on the flow status.
In Group A, two parameters, namely the initial length of water column and the n-hexanol flow rate, were considered. The initial lengths of the water columns were set as 2, 4 and 7 cm for different cases. The flow rates of the n-hexanol were set as 24.9, 39.7 and 54.1 mL/min, which indicated different displacement speeds. The initial temperatures of both water and n-hexanol were set as 5 °C (the environmental temperature in the refrigeration storage) for all the cases in Group A, which could avoid the heat transfer between the fluids and water freezing during the displacement process. Consequently, nine cases were carried out in Group A, and the setting parameters of the nine cases are listed in Table 2. The influences of the flow rate of the displacing fluid and the length of the displaced fluid on the displacement process were studied.
In Group B, three parameters, namely the initial length of water, the n-hexanol flow rate and the initial water temperature, were considered. The initial length of the water column and the n-hexanol flow rate were set the same as those in Group A. Neither a too low nor a too high initial water temperature was desirable in the current study. A relatively low initial water temperature would lead to the freezing process being in advance of the displacement process. However, if the initial water temperature setting were too high, no freezing would occur while the fluids were flowing in the sighting tube. As a result, the initial water temperatures were set as −5, −6 and −7 °C, respectively. The current values were specified based on the pre-experimental results to ensure the occurrence of the freezing process during the displacement flow. The initial temperatures of the n-hexanol were set as −30 °C for all cases in the thermostat. Since the n-hexanol fluid was immediately injected into the tube after pumping out from the thermostat bath, the temperature of the n-hexanol could be deemed as −30 °C before the contact of the water column. Consequently, 27 cases were carried out in Group B, whose details are shown in Table 3. The influences of the initial length of water, the n-hexanol flow rate and the initial water temperature on the freezing-accompanied displacement process were studied.

3. Results

3.1. Isothermal Displacement Flow (Group A)

The test performances of the nine cases (Cases A1–A9) are similar. Accordingly, Case A1 is selected to clarify the main phenomena during the isothermal displacement process. The earlier stage (0–27 s) and the later stage (28–29 s) of the displacement process in Case A1 are plotted in Figure 4 and Figure 5, respectively. It is seen that the n-hexanol contacts the water at 19 s, indicating the start of the displacement flow. The expression of 19 s-(1) and 19 s-(2) represent the different moments during 19–20 s. Since the precise moment information is hard to be captured by the digital camera, numbers with bracket are used to indicate the different moments in a second. Similar expressions are used in the later section. Along with the initiation of the displacement process, the water in the upper portion of the tube flows more quickly than that in the lower portion. Due to the difference between the upper and lower flow velocities, the water in the upper portion of the tube is driven to the lower portion and the upper portion of the tube is gradually occupied by the n-hexanol (21–25 s), which makes the length of water column (indicated by L in Figure 4) decrease. When the water in the upper portion is totally driven away (L becomes 0, 24–25 s), the n-hexanol overtakes the water, suggesting the displacement process steps into the later stage. As shown in Figure 5, the movement of the displaced water slows down. The displaced water is separated into two parts in 29 s-(3) and 29 s-(4). The water part on the right side presents as a round-shaped drop and it moves more quickly than the water part remaining in the left part. As a result, the distance between the two water parts increases during the displacement flow. The distribution of the water phase at the end of the test is presented in Figure 6. The water phases are dispersed in the n-hexanol. Most of the water phases are concentrated in the region of 15–20 cm and in the region of 40–42 cm of the tube.

3.2. Freezing-Accompanied Displacement Flow (Group B)

The freezing process during the displacement flow in Group B resulted in two typical ice blockage patterns, i.e., incomplete ice blockage (Cases B1–B5, B7–B8, B10–B14, B16–B17 and Case) and complete ice blockage (Cases B6, B9, B15, B18, B19–B24 and B26–B27). Cases B2 and B23 are selected to represent the two typical ice blockage patterns. Moreover, Case B1 is also presented in order to clarify the influence of water distribution on the development of freezing process.

3.2.1. Case B1

The displacement process of water by n-hexanol in Case B1 is plotted in Figure 7. It is seen that the displacement process initiates at 18 s. The primal ice is visualized at 55 s within the sighting tube (5–6 cm). The appearance of the primal ice indicates the initiation of freezing. The freezing front (indicated by the green arrow) gradually moves from left to right without interruption (55–56 s). The freezing front stops moving at 56 s and no new ice phase forms in the tube in the following period. The peristaltic pump was turned off at 77 s. It is seen that the distributions of ice and water in the tube (0–10 cm) at 77 s is almost the same as that at 56 s-(2).
The distributions of the water and ice phases in the sighting tube (0–30 cm) at the end of Case B1 are shown in Figure 8. It is seen that the ice phase is distributed in the region of 0–10 cm in the sighting tube. A scattered distribution of water phase is observed in the region of 10–30 cm, which is similar to that shown in Figure 6.
The variations of the local temperatures at the tube wall in Case B1 are plotted in Figure 9. It is seen that the local temperatures of all five measurement points begin to decrease at 10 s. Most intense temperature decrease is found at Point 1, and the temperature decreases gradually become slight along with the measurement points away from the left end of the tube. As the pump was turned off at 77 s, the temperature of Point 1 shows a slight increase, while no significant temperature changes are observed at Points 2–5 at 77 s.

3.2.2. Case B2

The displacement process of water by cold n-hexanol in Case B2 is plotted in Figure 10. In Case B2, the displacement process starts at 16 s. The continuous freezing process begins at 50 s along with the appearance of primal ice phase in the sighting tube (5–6 cm). In company with the moving of the freezing front (50–77 s), the displaced water gradually freezes into ice and the frozen part stops flowing forward. As the freezing front reaches the forefront of the displaced water at 77 s, the entire water region in the sighting tube is frozen and the freezing process comes to the end. It is found from the results in Figure 10 that the sighting tube is not completely blocked by the ice (the main feature of incomplete ice blockage pattern), and the fluid (mainly n-hexanol) continues to flow in the tube after the freezing process is over, which lasts until the peristaltic pump was turned off at 112 s.
The variations of the local temperatures at the tube wall in Case B2 are plotted in Figure 11. The temperatures at Points 1 and 2 continually decrease during the displacement process. However, unlike the temperature changing shown in Figure 9, the temperatures of Points 3–5 show obvious increases around 40–60 s. After the short period of temperatures increasing at Points 3–5, the temperatures of the three points decrease again until the end of the test. After the pump is turned off at 112 s, the temperatures of Points 1 and 2 begin to rise, while the temperatures of Points 3–5 are relatively stable after the pump off for 18 s.

3.2.3. Case B23

The displacement process of water by cold n-hexanol in Case B23 is plotted in Figure 12. In Case B23, the displacement process began at 16 s and the freezing process begins at 17 s. The main difference between Case B23 and Cases B1 and B2 is that, in Case B23, the sighting tube is totally blocked up (the main feature of complete ice blockage pattern) by the ice phase after the freezing process. Thereafter, the fluid flow in the sighting tube is cut off and a remarkable amount of n-hexanol spills out of the tube. A portion of the n-hexanol is observed to bypass the blocked area of ice from the above notch (18–22 s), which nearly has no influence on the flow condition. Due to the complete blockage of the tube at 18 s, the peristaltic pump was turned off at 33 s.
The variations of the local temperatures at the tube wall in Case B23 are plotted in Figure 13. It is seen that the temperature of Point 1 shows obvious decrease during the whole test duration. The temperature of Point 2 shows an increase at the beginning of the test and soon starts to decrease in the following period. The temperature of Point 3 increases and then keeps at a steady value. No temperature variations occur at Points 4 and 5 during the test. As the pump was turned off at 33 s, the temperature of Point 1 shows an obvious increase after the pump off. However, the temperatures of Points 2–5 are relatively stable after the pump was turned off.

4. Discussion

4.1. The Propagation of the Isothermal Displacement Flow

The overtaking of the displaced water by n-hexanol, the separation of the water phase and the scattered water distribution are the three important characteristics of the isothermal displacement process in Group A. The analysis and discussion on the progress of isothermal displacement are carried out around the three characteristics.

4.1.1. The Overtaking of the Displaced Water by N-Hexanol

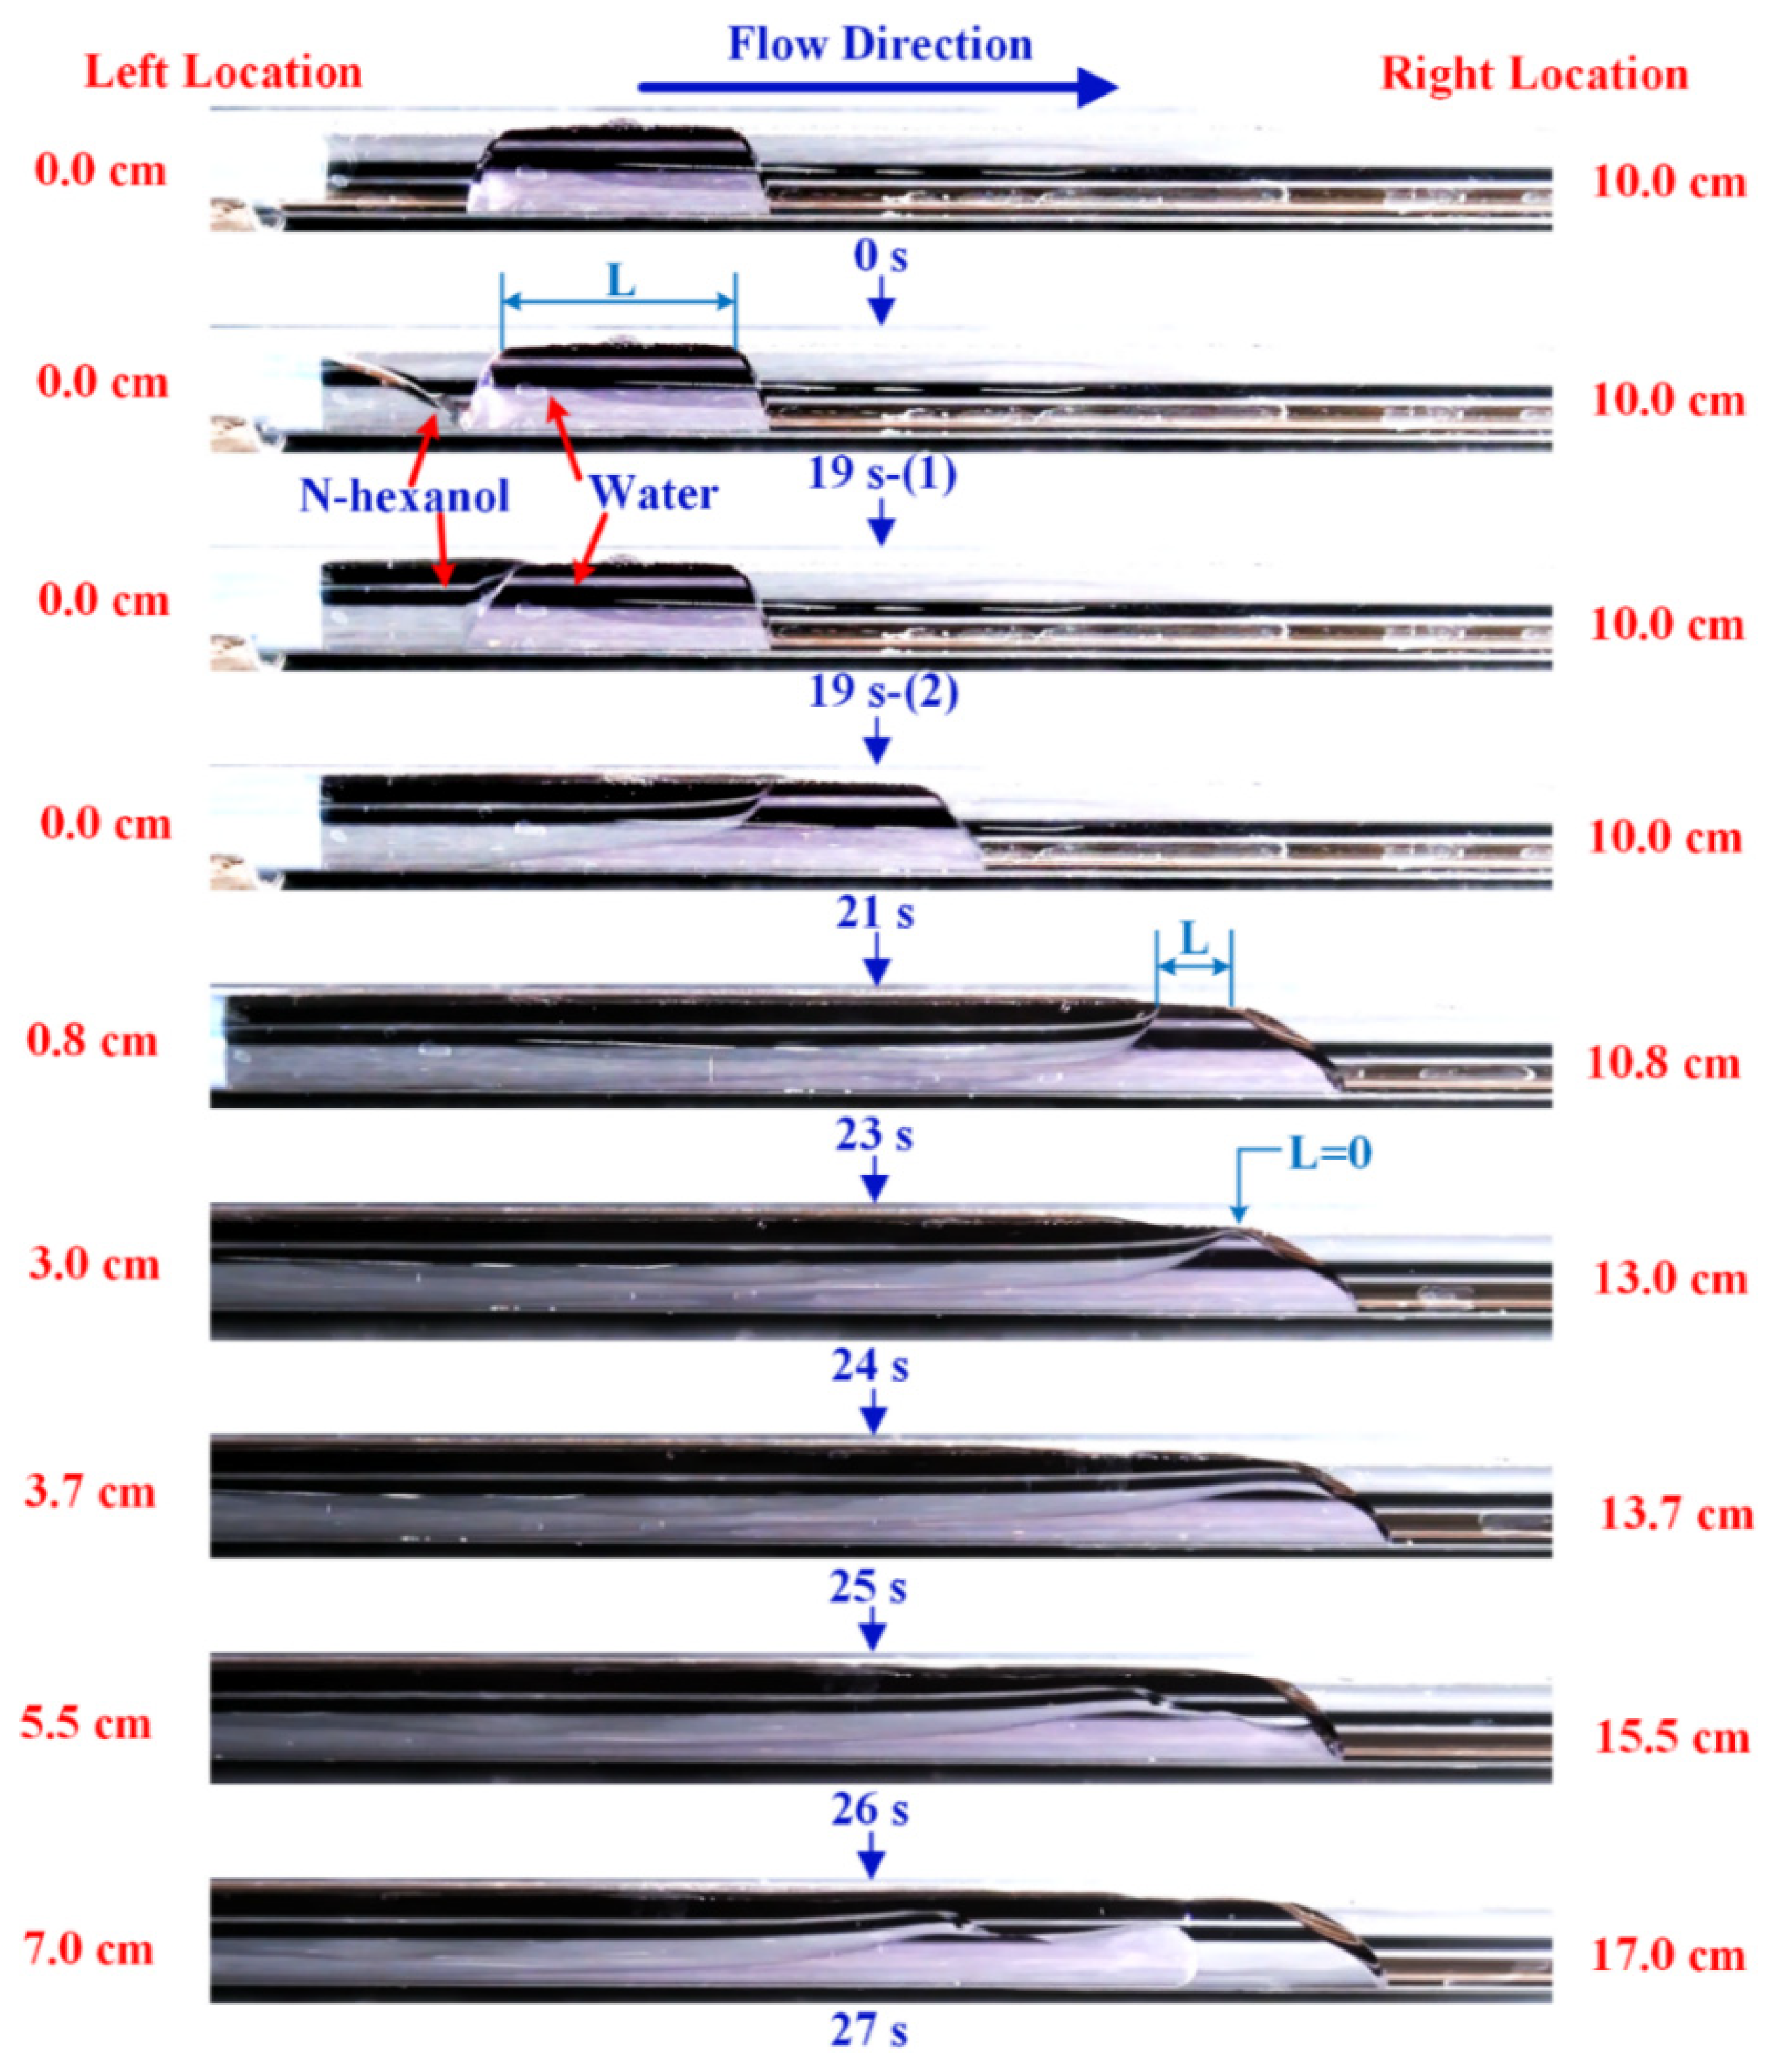
The overtaking starts right at the beginning of the displacement process. As the n-hexanol begins to push the displaced water, the pushing force is generally applied on the contact surface of the two fluids, which is supposed to generate a uniform acceleration effect on the displaced water. On the other hand, water flow in the near-wall region of the sighting tube is hindered by the wall friction. It leads to an approximate parabolic axial velocity profile with the maximum velocity in the centerline of the sighting tube of the displaced water, which is similar to that in Poiseuille flow. As a result, part of the displaced water is left behind and the n-hexanol would gradually overtake the water. It should be noted that, in the current tests, the notch on the sighting tube led to a non-uniform distribution of wall friction force on the displaced water. Water flow near the notch is not affected by the wall friction due to the absence of the tube wall. As the notch is on the top of the tube, the water in the upper portion would flow faster than the water in the lower portion during the displacement process, as depicted in Figure 4.
The “overtaking rate” is used to quantitatively evaluate the rapidity of the overtaking process. It is defined as the change rate of the water column length (L) over time, which represents the relative velocity between the n-hexanol and the displaced water. The measured overtaking rates in the tests of Group A are listed in Table 4. Table 4 shows that, under the same n-hexanol flow rate, the overtaking rate would decrease along with the increase of the initial length of water column. When the initial length of water column in the flow channel is a constant, the overtaking rate would increase along with the flow rate of n-hexanol increasing.
The test results of Group A indicate that the pore water might be overtaken by the fracturing fluid during the actual cryogenic fracturing process. The initial blockage of the pore channel by water would be enhanced as the displacement process goes on. The consideration of the effect of fracturing fluid vaporization, wettability of water/fracturing fluid on the reservoir rock surface, micro pore in the reservoir, etc. are necessary in the future studies, which could further verify the occurrence of overtaking during cryogenic fracturing.

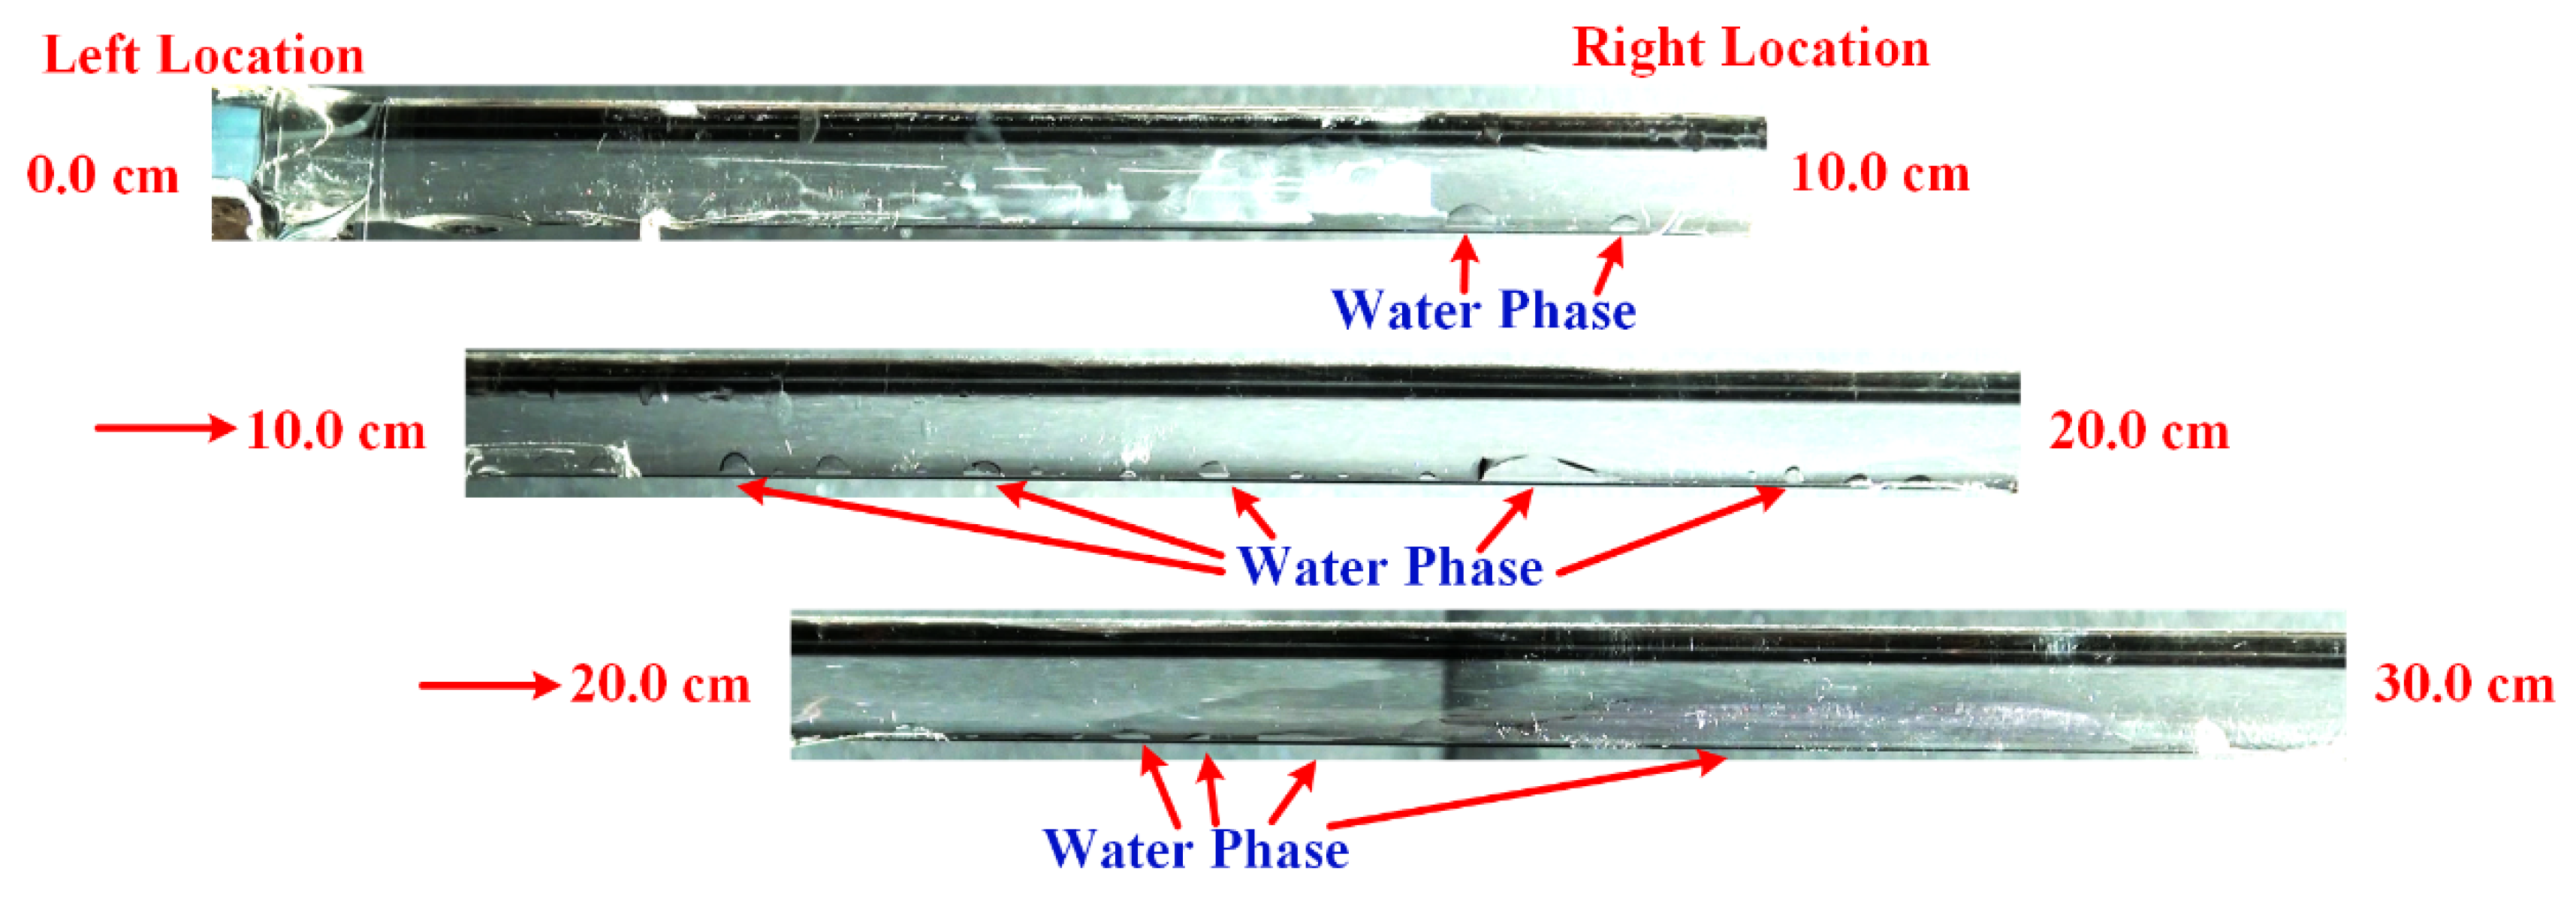
4.1.2. The Separation of the Displaced Water and the Scattered Distribution of Water Phase

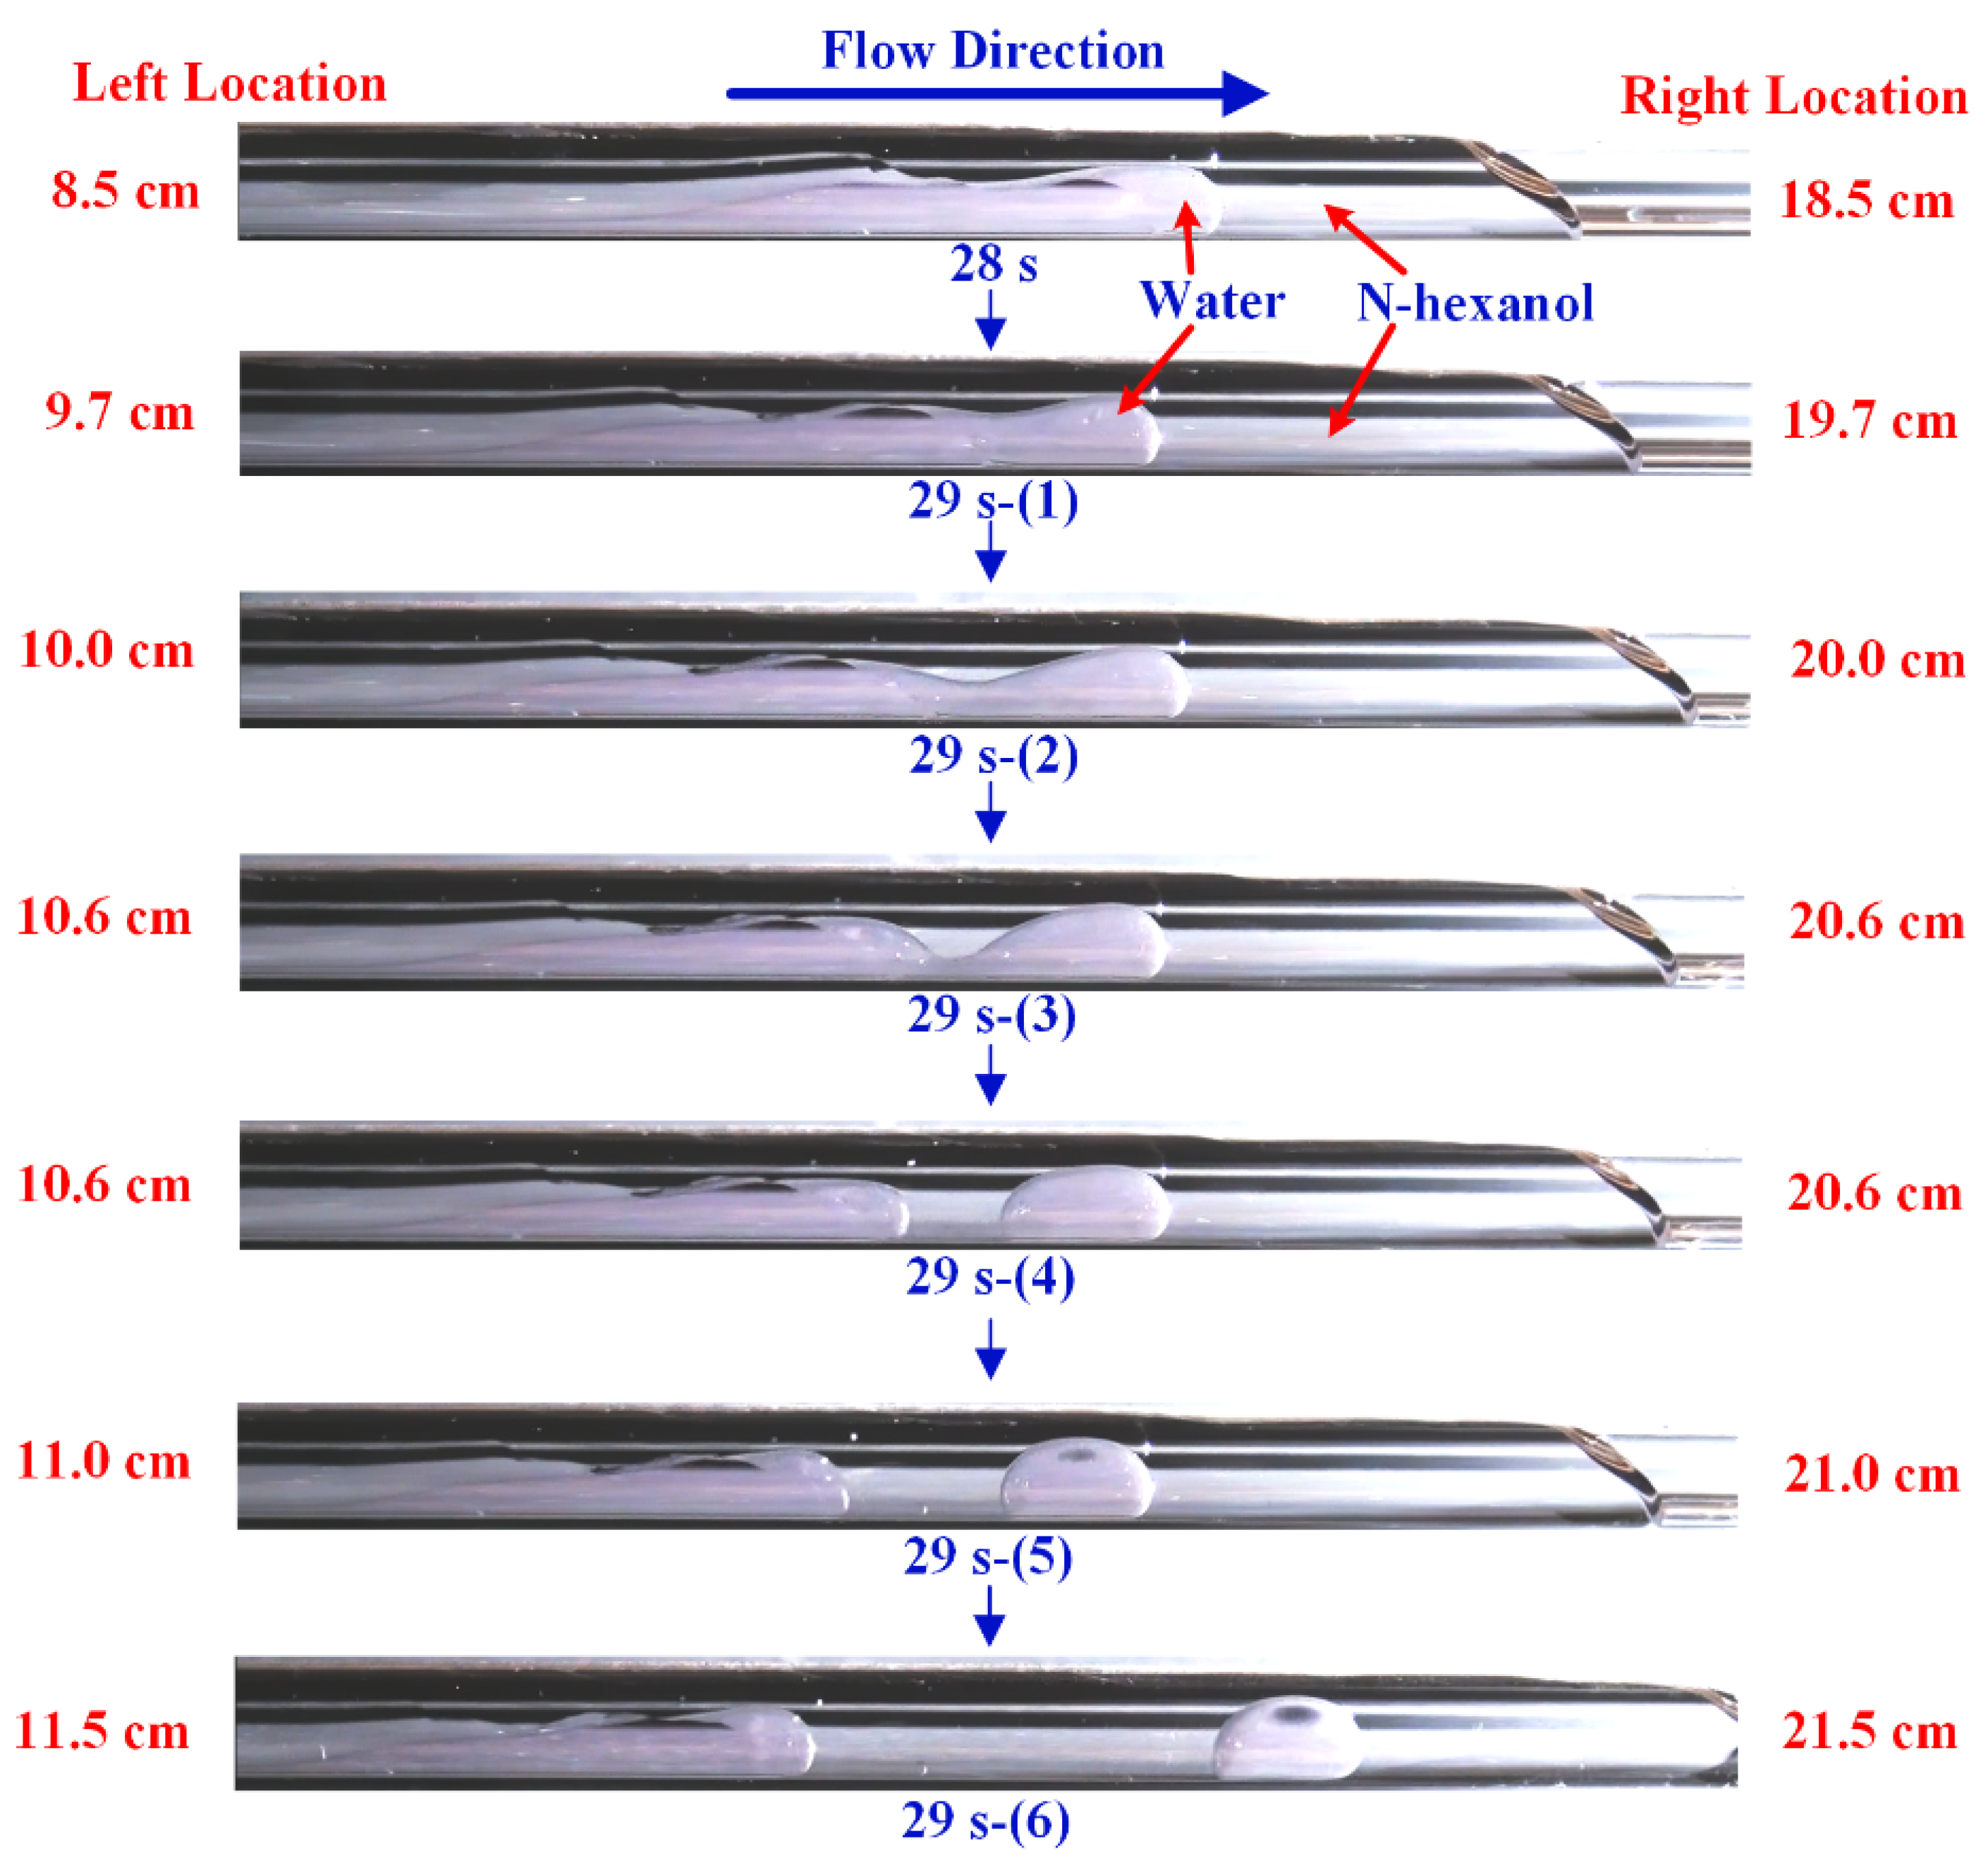
The analysis of the overtaking phenomenon indicates that there is a non-uniform velocity distribution within the water region from the beginning of the displacement process, leading to a “stretched” state of the water phase throughout the entire displacement process. Separation would occur at the locations where the tensile limit is exceeded and the single water phase would split into two or more smaller pieces, as shown in Figure 5. The scattered distribution of water shown in Figure 6 is actually induced by the water separation during the displacement process.
Similar to the overtaking process, separation of water phase could also happen during the actual cryogenic fracturing process and would finally lead to a scattered distribution of pore water within the reservoir. The occurrence of the separation process should be carefully considered in the future studies as well.

4.2. The Propagation of the Freezing-Accompanied Displacement Flow

The analysis and discussion on the freezing-accompanied displacement process in Group B is carried out around the following aspects: water freezing, the influence of ice phase on the fluid flow (ice blockage) and heat transfer.

4.2.1. Freezing Process

The freezing process observed in Cases B1, B2 and Case B23 could be explained based on the classical nucleation theory (CNT) [23,24,25,
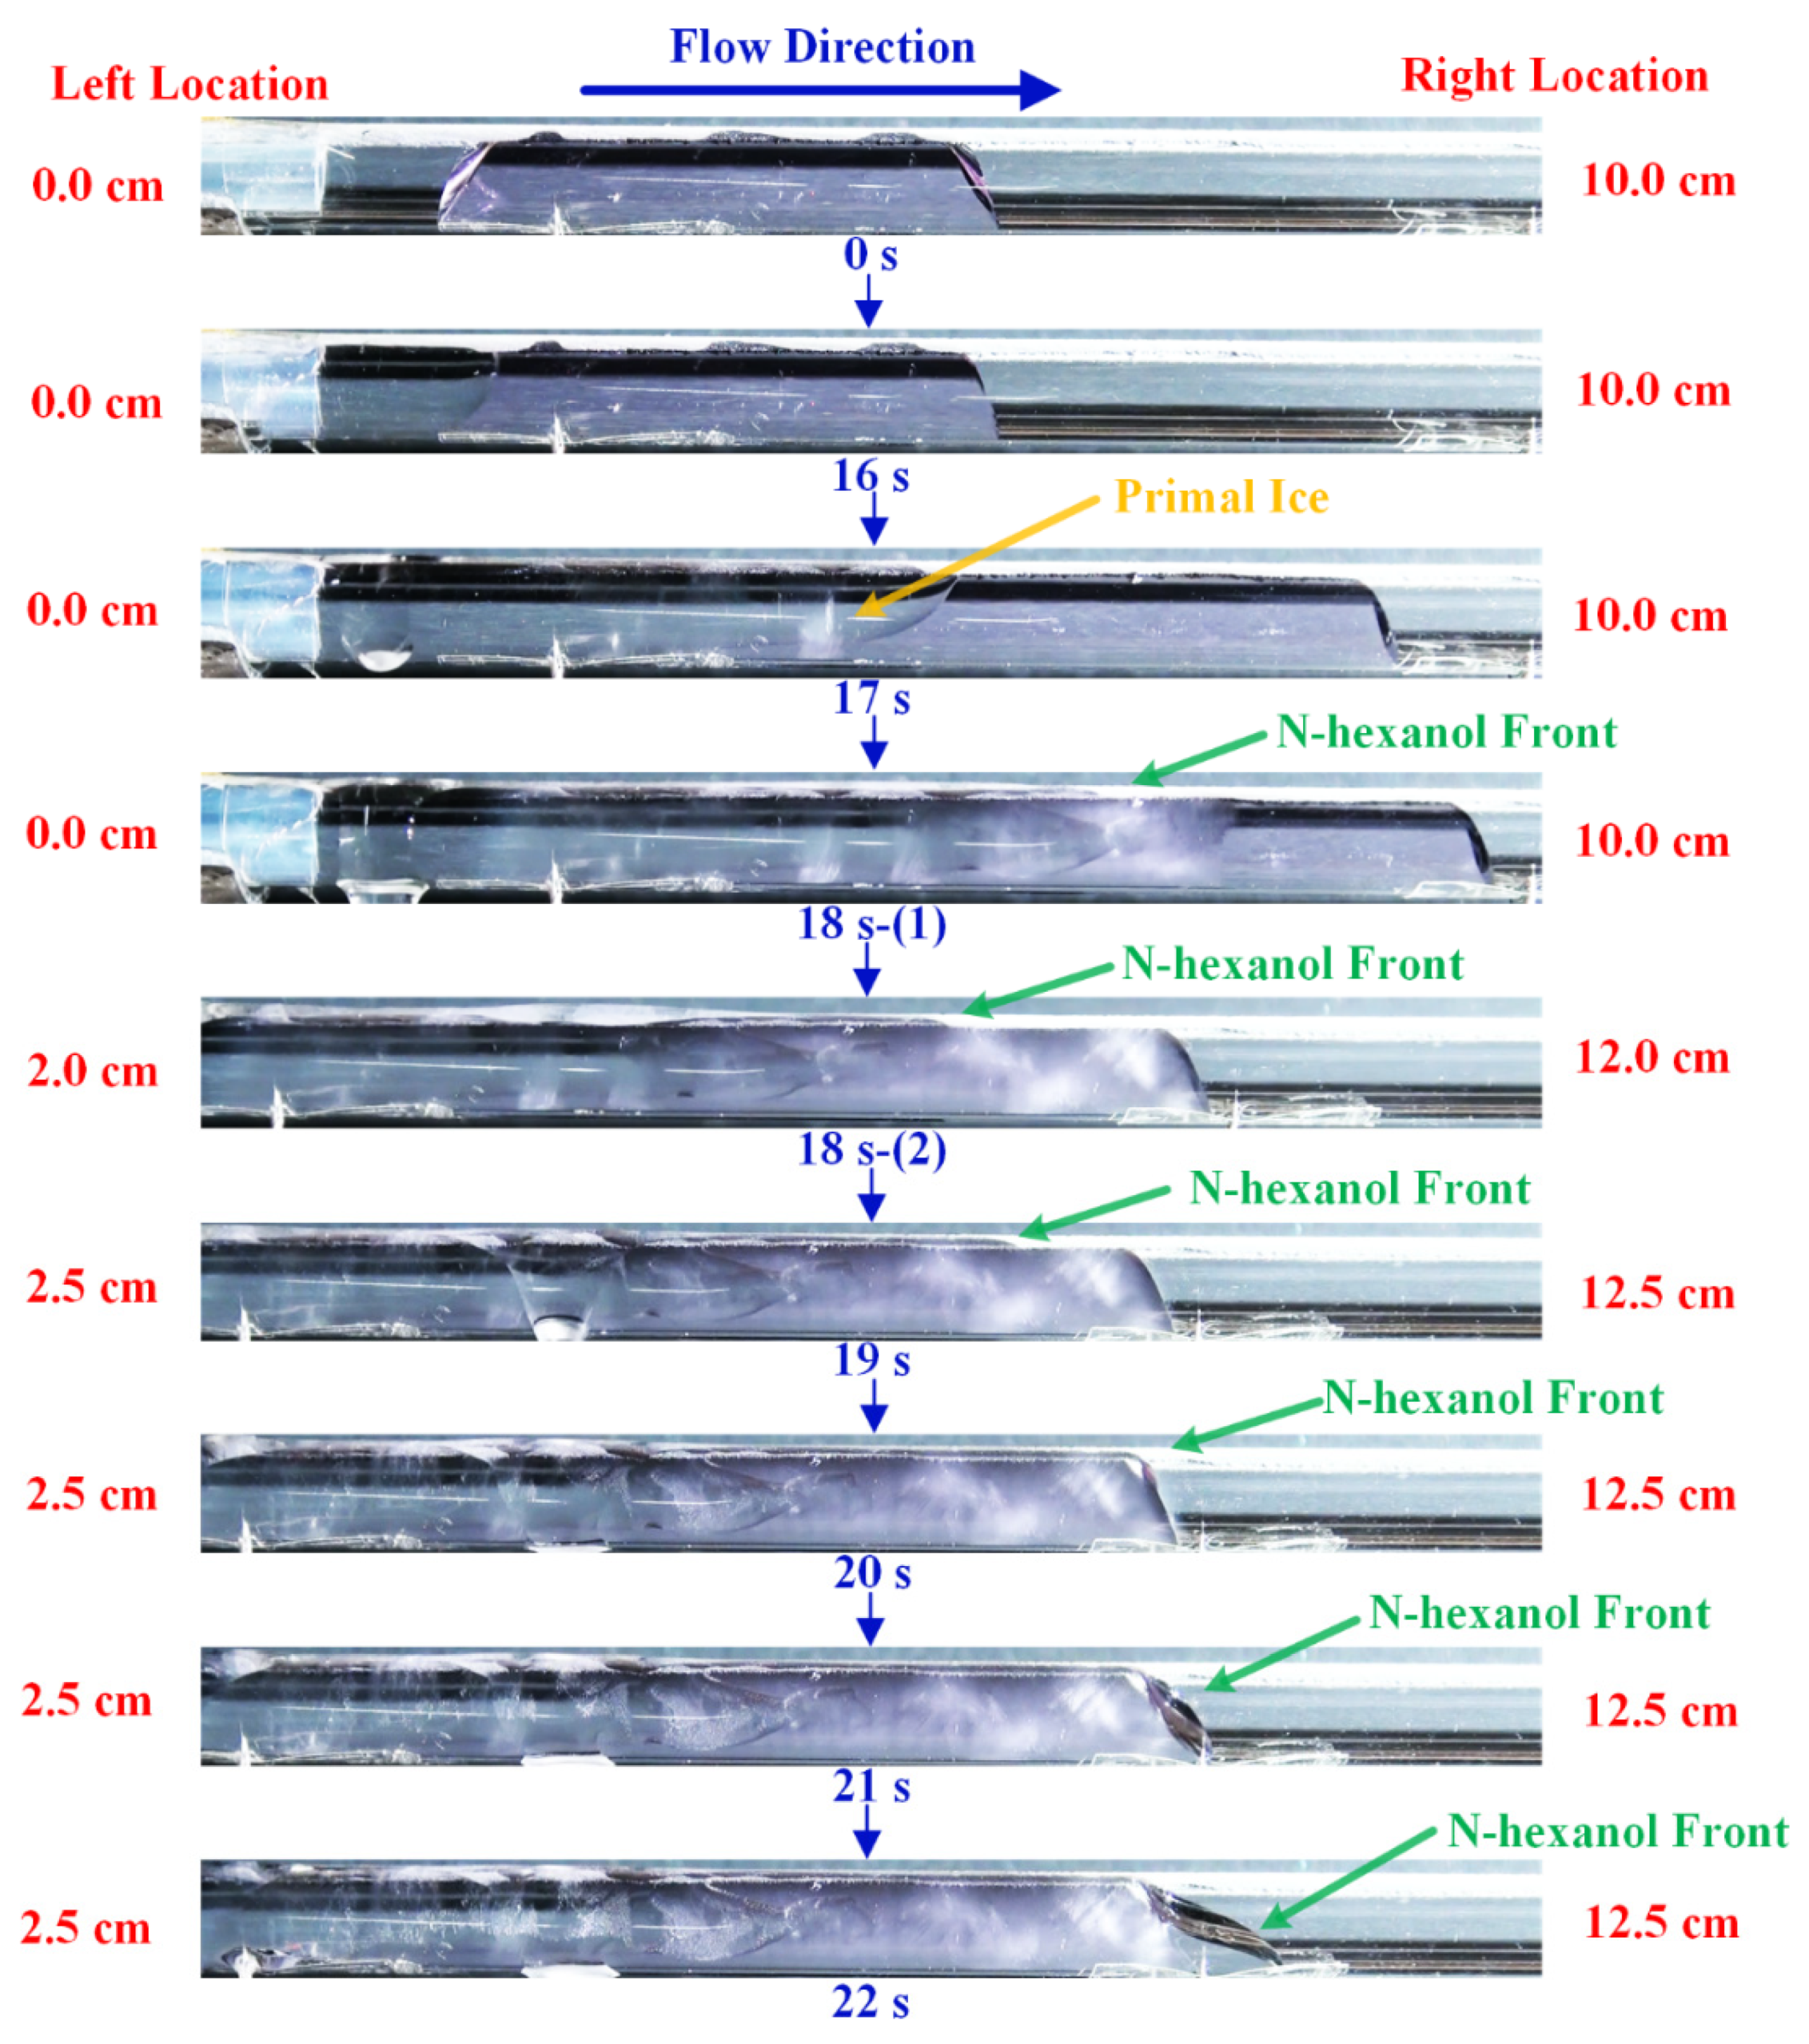
26]. In CNT, a certain degree of energy barrier is required to be overcome to induce the nucleation/freezing process. By reducing the water temperature or adding nucleating agent into the water, the energy barrier could be lowered, which enhances the nucleation/freezing process. In Cases B1, B2 and B23, the displaced water was supercooled at the initial state with a supercooling degree of 5, 5 and 7 °C, which is not enough to induce the nucleation process. Thus, no ice is observed in the sighting tube at this moment. As the displacement process begins, according to the analysis in 
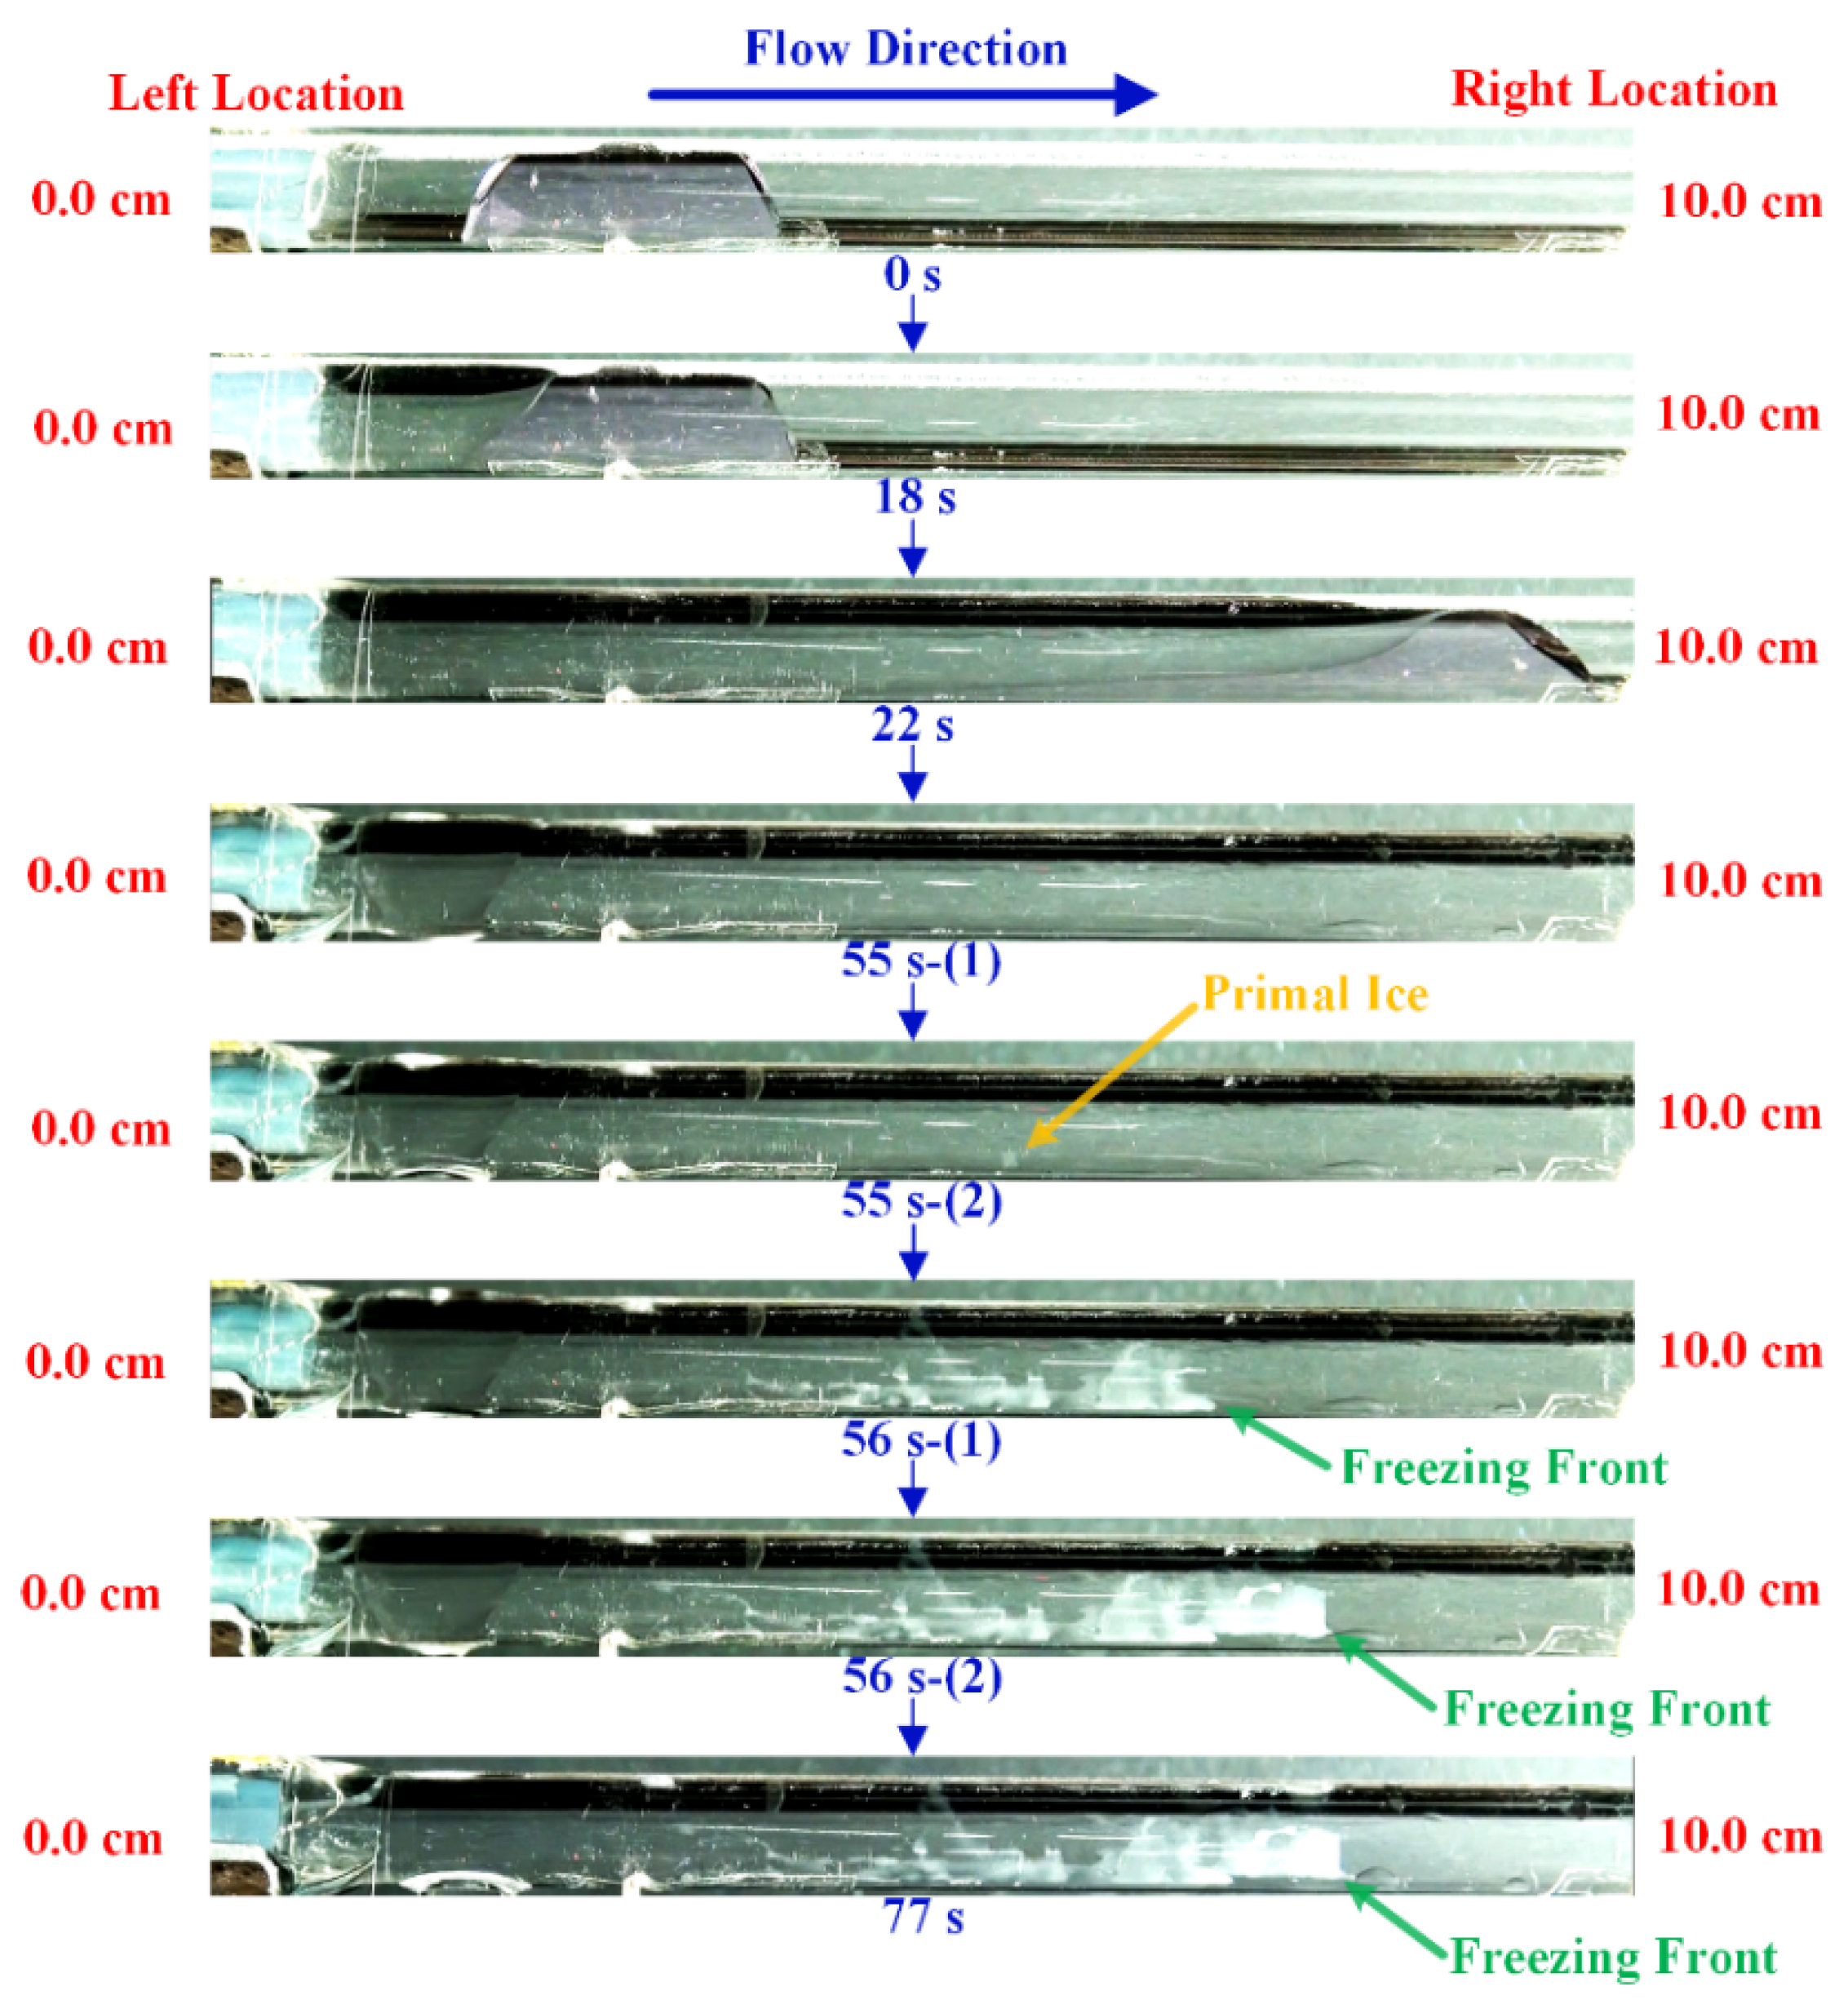
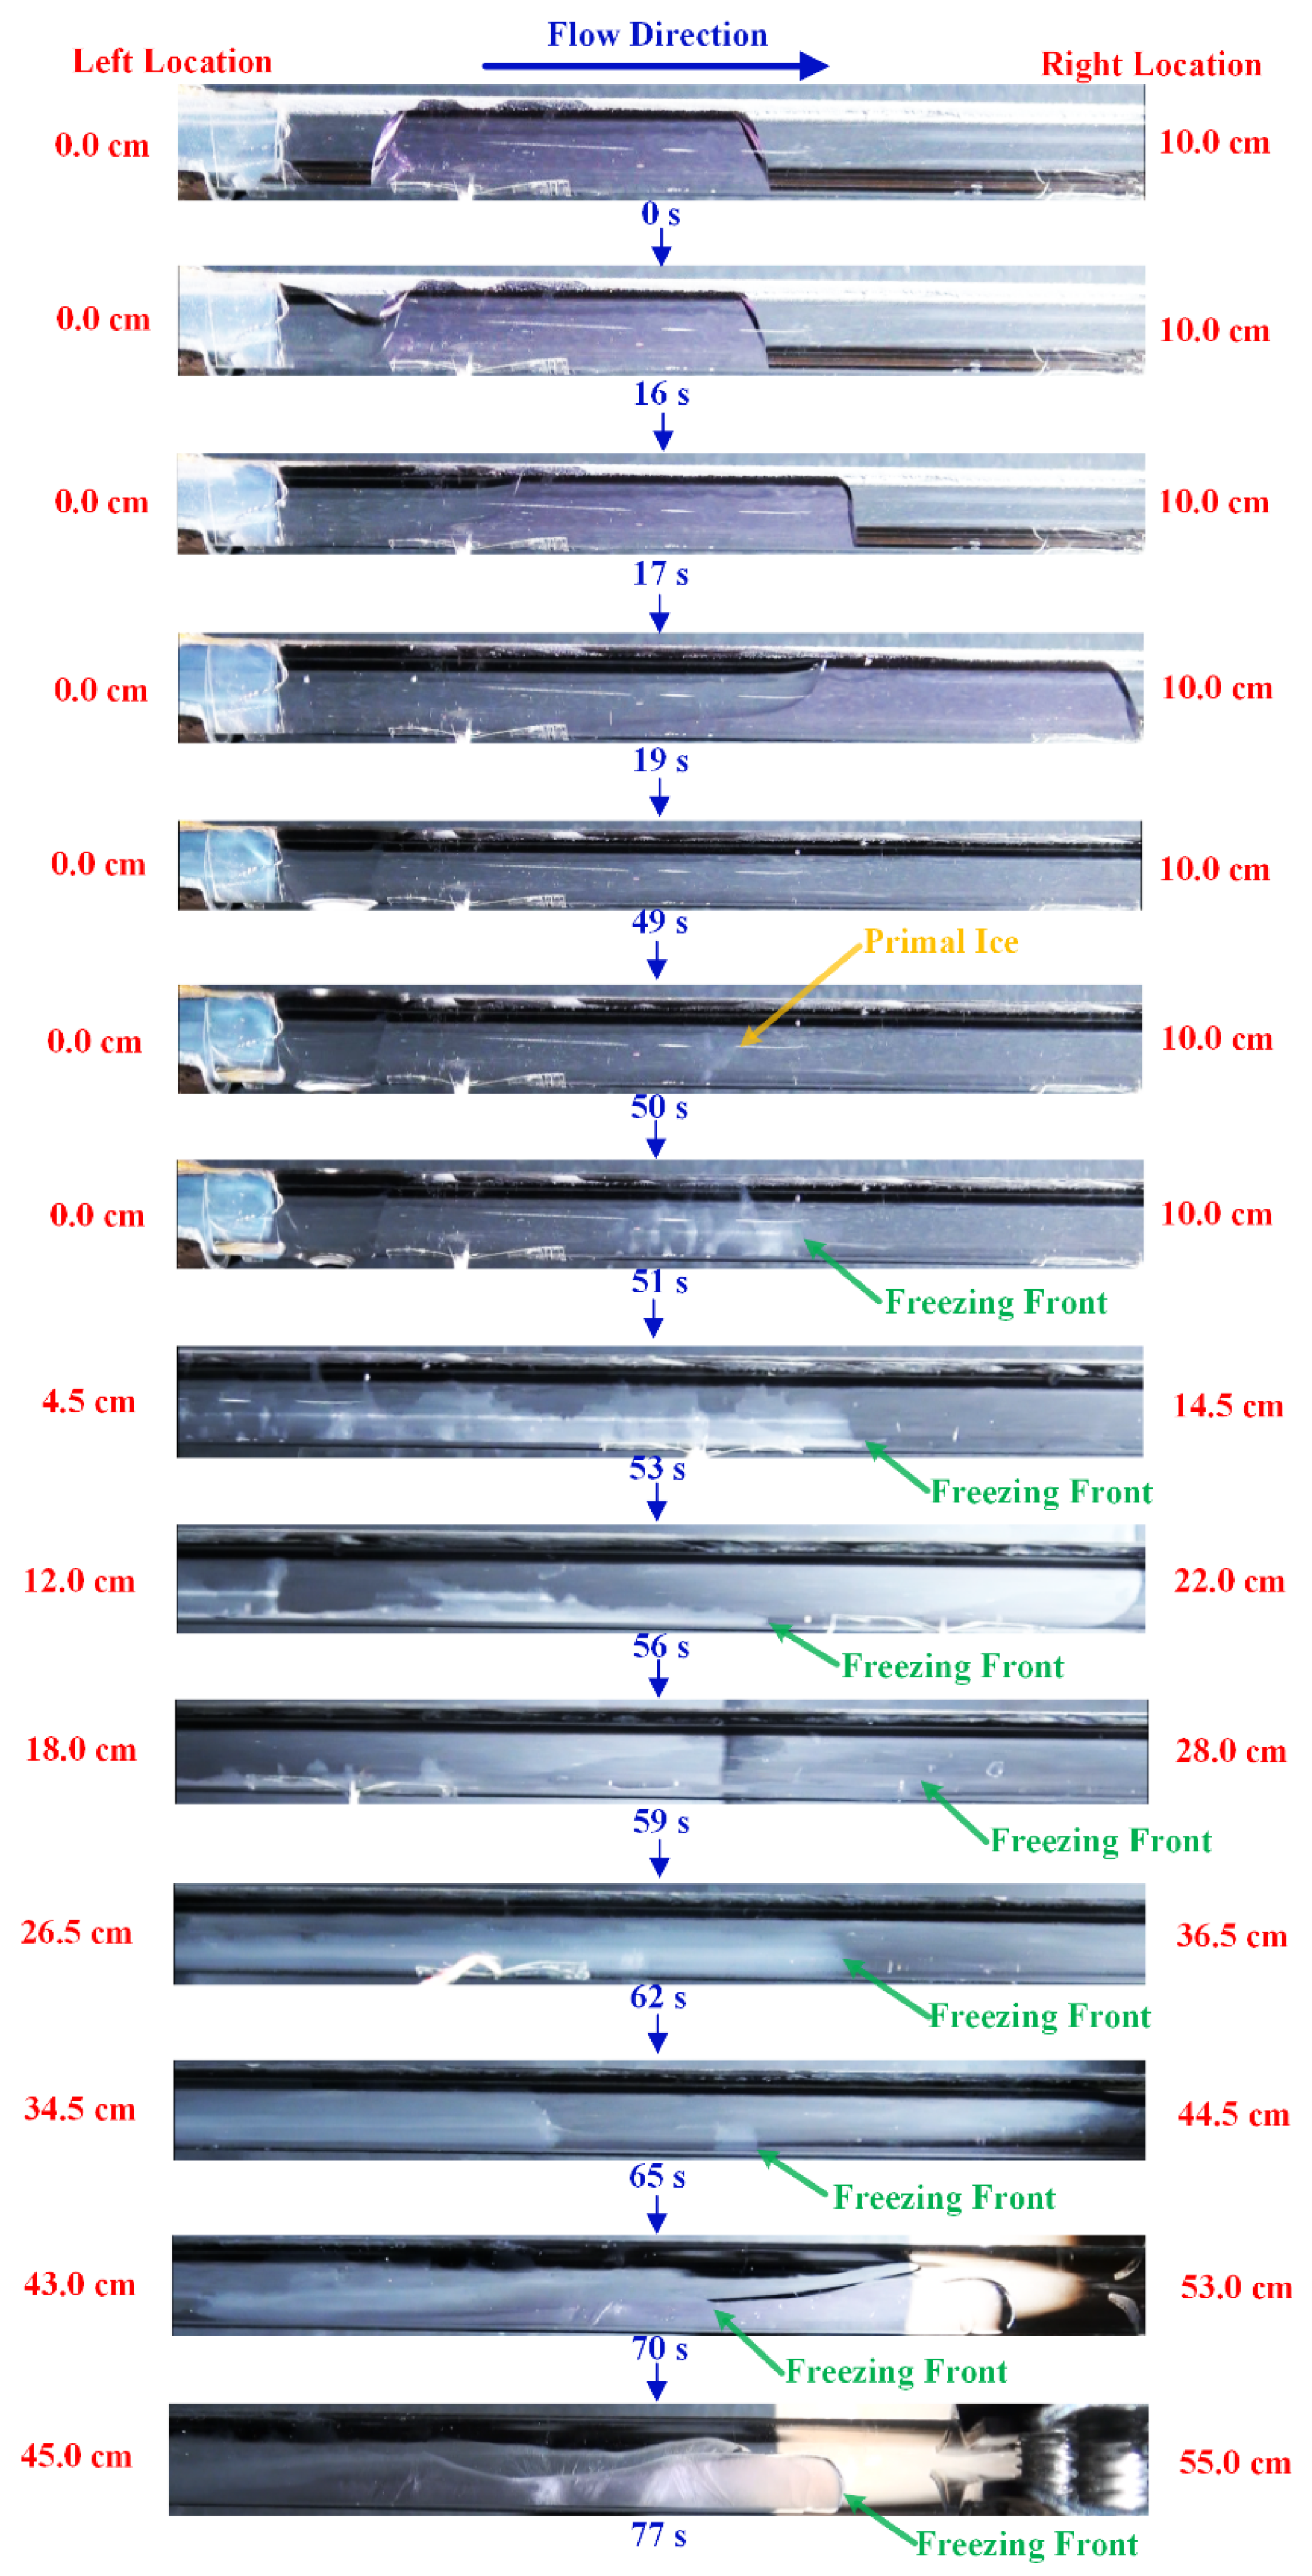
Section 4.1, part of the displaced water at the near-wall region of the tube would stay at (or stay near) its initial position due to wall friction. Since the flow direction of n-hexanol is from left to right in the tube, the water distributed near the left end of the sighting tube could receive the cooling effect from the n-hexanol earlier than the water at other locations, which makes the temperature of water near the left end of the tube drop faster. Consequently, the water near the left end of the tube could firstly satisfy the temperature condition for nucleation, resulting in the formation of the primal ice phase. The appearance of the primal ice introduces new solid phase into the water region, which creates favorable conditions for heterogeneous nucleation. The supercooling degree for nucleation is then lowered in the water surrounding the primal ice. In other words, the newly-formed ice enhances the nucleation probability in the water vicinity, which leads to the subsequent continuous freezing (the recalescence stage of the freezing process). It should be noted that the occurrence of continuous freezing requires the entire water region reaching a certain supercooling degree as a premise. If the overall supercooling degree of the water region is not sufficient, continuous freezing could not be triggered even after the appearance of primal ice.
To further discuss the freezing process in the tests of Group B, two parameters i.e., trigger-time of freezing and freezing rate, are introduced. The trigger-time of freezing is defined as the time interval between the beginning of the displacement process and the initiation of the freezing of the displaced water. The trigger-time is closely related to the following moments: (1) the moment when the n-hexanol contacts the water in the tube; and (2) the moment when the freezing process initiates. The freezing rate is defined as the moving rate of the freezing front during the freezing process. The freezing front refers to the rightmost border between the frozen zone and the unfrozen zone of the displaced water, which is indicated with green arrows in Figure 7, Figure 10 and Figure 12. The freezing rate of each test is obtained based on the locations of the freezing front at various moments. The freezing trigger-time and the average freezing rate obtained from the tests in Group B are listed in Table 5 and Table 6, respectively.
Table 5 shows that the trigger-time would decrease with the increase of n-hexanol flow rate and the decrease of the initial water temperature. Increasing the flow rate of n-hexanol could reduce the cold energy loss of n-hexanol before it enters the sighting tube. The n-hexanol thus contacts the water in the tube at an earlier timing and lower temperature, which can significantly improve the cooling efficiency. On the other hand, decreasing the initial water temperature would lower the energy barrier of nucleation, which also promotes the occurrence of freezing. The trigger-time of freezing is found to change irregularly with the initial length of water column: In the test groups that the n-hexanol flow rate is 39.7 mL/min and initial water temperature is −6 °C, the trigger-time of freezing decreases as the initial length of water column increases. In the tests that the n-hexanol flow rate is 24.9 mL/min and the initial water temperature is −7 °C, the minimum trigger-time of freezing is found in the test that the initial length of water column is set as 4 cm. However, in the tests that the n-hexanol flow rate is 54.1 mL/min and the initial water temperature is −5 °C, the maximum trigger time of freezing is found in the test that the initial length of water column is set as 4 cm. These changes indicate that there is a connection between the trigger-time of freezing and the initial length of water column. More tests could be conducted in the future to figure out this relationship. Table 6 shows that the freezing rate would increase along with the decrease of initial water temperature, which is in consistent with the analysis based on classical nucleation theory (CNT) that a lower temperature (higher super-cooling degree) could accelerate the nucleation process.
The water distribution in the sighting tube is another influencing factor for the freezing process. It is found from the observation results (Figure 7, Figure 8, Figure 10 and Figure 12) that only a part of the water is finally frozen in Case B1, which is different from those in Cases B2 and B23. This disparity is mainly caused by the difference of water distribution when the freezing process initiates. At the moment when the primal ice appears, the water in Cases B2 and B23 still holds its continuous distribution state. However, the water in Case B1 is split into several separate parts by the displacement process. Consequently, the freezing process in Case B1 is interrupted due to the discontinuity of water distribution, leaving part of the water in the tube unfrozen. To make this unfrozen part of water solidify, further cooling (supply of cold n-hexanol) is necessary to satisfy the temperature condition for nucleation, which would take extra time. It indicates that the separation of water phase during the displacement process is actually obstructing the freezing process by destroying the continuity of water distribution.
It is thought that the continuous freezing process observed in the current study may influence the actual cryogenic fracturing process. When a wide range of pore water in the reservoir is connected together by the pore network and they are supercooled, a rapid freezing process could be triggered as the cryogenic fracturing fluid begins to cool down a portion of the pore water and the entire pore water zone could be frozen within a short period. The trigger conditions may be kind of rigorous, considering the complicated heat and mass transfer situation in the reservoir. Therefore, the possibility of the occurrence of the continuous freezing should not be discarded.

4.2.2. The Influence of the Ice Phase on the Flow State

As stated in Section 3.2, two typical patterns of the ice blockage were observed in the tests of Group B, which are termed as “incomplete ice blockage” and “complete ice blockage”. It is seen that different blockage patterns could lead to different flow situations in the sighting tube. The analysis of these blockage patterns is introduced in the following.
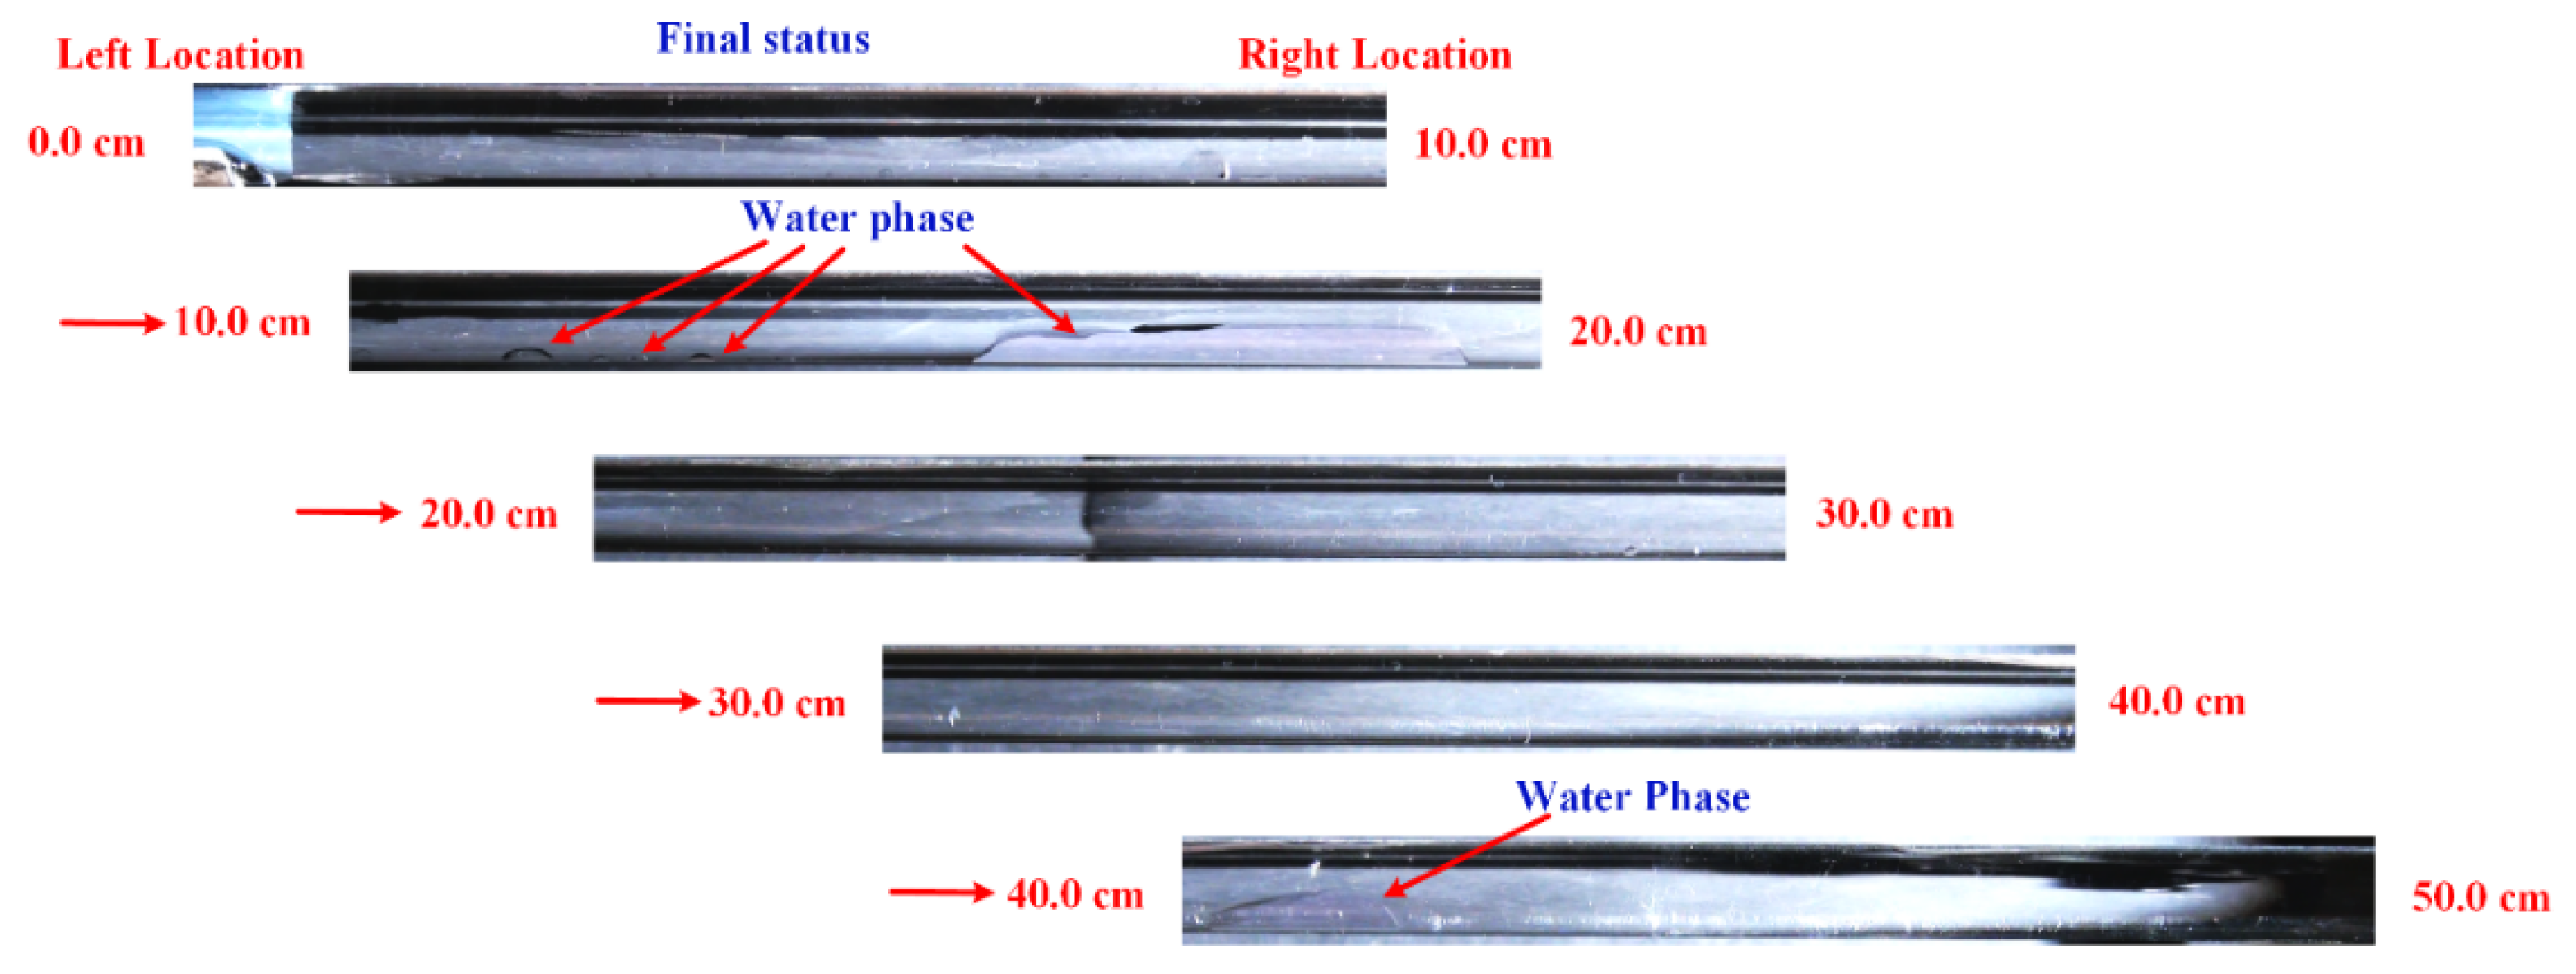
Incomplete blockage refers to the pattern where the cross section of the flow channel is partly occupied by the ice phase after the freezing process, which is shown in Figure 7, Figure 8 and Figure 10. It is noted that the ice phase shown in Figure 7 (Case B1) and Figure 10 (Case B2) is a range of thin ice layers attached to the inner wall of the sighting tube. The central part of the tube is free for the fluid to get through after the freezing process. As the flow channel is not totally blocked up, fluid flow is able to continue after the freezing process with the flow rate altered, which is the main feature of this blockage pattern.
Complete blockage refers to the pattern where the cross section of the flow channel is fully occupied by the ice phase after the freezing process, which is shown in Figure 12 (the region of 7–10 cm in the tube is completely occupied by the ice). As the flow channel is totally blocked, fluid flow in the original direction is interrupted and fluids are forced to change their flow direction in order to continue the flow behavior, which is the main feature of this blockage pattern. Compared with the incomplete ice blockage, complete ice blockage is more significant for the flow situation since both the flow rate and the flow direction are altered.
The pattern of ice blockage closely depends on the final ice distribution in the tube. The final ice distribution in the tube is actually determined by the distribution of the water in the tube at the initial freezing stage. Since the water distribution changes with the displacement process, it can be found that both freezing process and the displacement process are key factors which directly determine the ice blockage pattern. The characterization of the occurrence of the two ice blockage patterns can be summarized as follows. For the incomplete ice blockage, the water in the upper portion of the tube is totally driven away (the displacement process steps into the later stage) by the moment that the freezing process initiates. For the complete ice blockage, there is still a certain amount of water in the upper portion of the tube (the earlier stage of the displacement process is continued) by the moment that the freezing process initiates. The overall blockage patterns occurred in the tests of Group B are listed in Table 7.
The influencing factors for the displacement process and the freezing process can affect the occurrence of the ice blockage as well. Based on Table 7 and the above analysis, the influence of the initial water column length, initial water temperature and the n-hexanol flow rate on the ice blockage pattern could be basically understood.
(1)
The initial length of the water column
According to the analysis on the overtaking rate in Section 4.1, the overtaking rate decreases with the increase of the initial length of water column, which extends the duration of the earlier stage of the displacement process and enhances the occurrence of complete blockage. Table 7 shows that complete ice blockage preferably occurs in the cases that the initial water column length is 7 cm (six out of nine) compared to those with the initial water column of 4 cm (three out of nine) and 2 cm (two out of nine), indicating the initial water column length is one of the main influencing factor for the ice blockage.
(2)
Initial water temperature
According to the analysis of the trigger-time of freezing and the freezing rate in the current section, initial water temperature could significantly affect the freezing process. The decrease of initial water temperature could lead to the decrease of the trigger-time of freezing and accelerate the freezing rate, which can further promote the occurrence of complete blockage. Table 7 shows that the numbers of complete ice blockage in the cases of −7 °C are more than those in the cases of −5 and −6 °C, indicating a lower water temperature could facilitate the occurrence of complete ice blockage.
(3)
N-hexanol flow rate
According to the analysis in Section 4.1 and the current section, n-hexanol flow rate would play an important role on both displacement process and freezing process. The increase of n-hexanol flow rate leads to the increase of the overtaking rate and the decrease of the trigger-time of freezing, while the increase of overtaking rate could enhance the occurrence of incomplete ice blockage and the decrease of the trigger-time of freezing could enhance the occurrence of complete ice blockage. It suggests that the change of n-hexanol flow rate would bring two conflicting effects on the occurrence of ice blockage. Therefore, the influence of n-hexanol flow rate on ice blockage pattern depends on which of the above two effects dominates the displacement process. No definite link between n-hexanol flow rate and the occurrence of ice blockage was found from the results in Table 7, indicating that the current result is not sufficient to draw a reliable conclusion on this point, which is expected to be further discussed and improved in the future work.
It is deduced that both incomplete ice blockage and complete ice blockage are important for the actual cryogenic fracturing process. The occurrence of complete ice blockage is supposed to significantly affect the cryogenic fracturing progress as it can largely alter the flow state (flow rate and flow direction) of the fracturing fluid within the reservoir, which also changes the transport of cold energy. The prediction of ice blockage is supposed to be a vital task in configuring the cryogenic fracturing process in the future, which requires a deeper understanding on the occurrence of the ice blockage pattern.

4.2.3. Heat Transfer

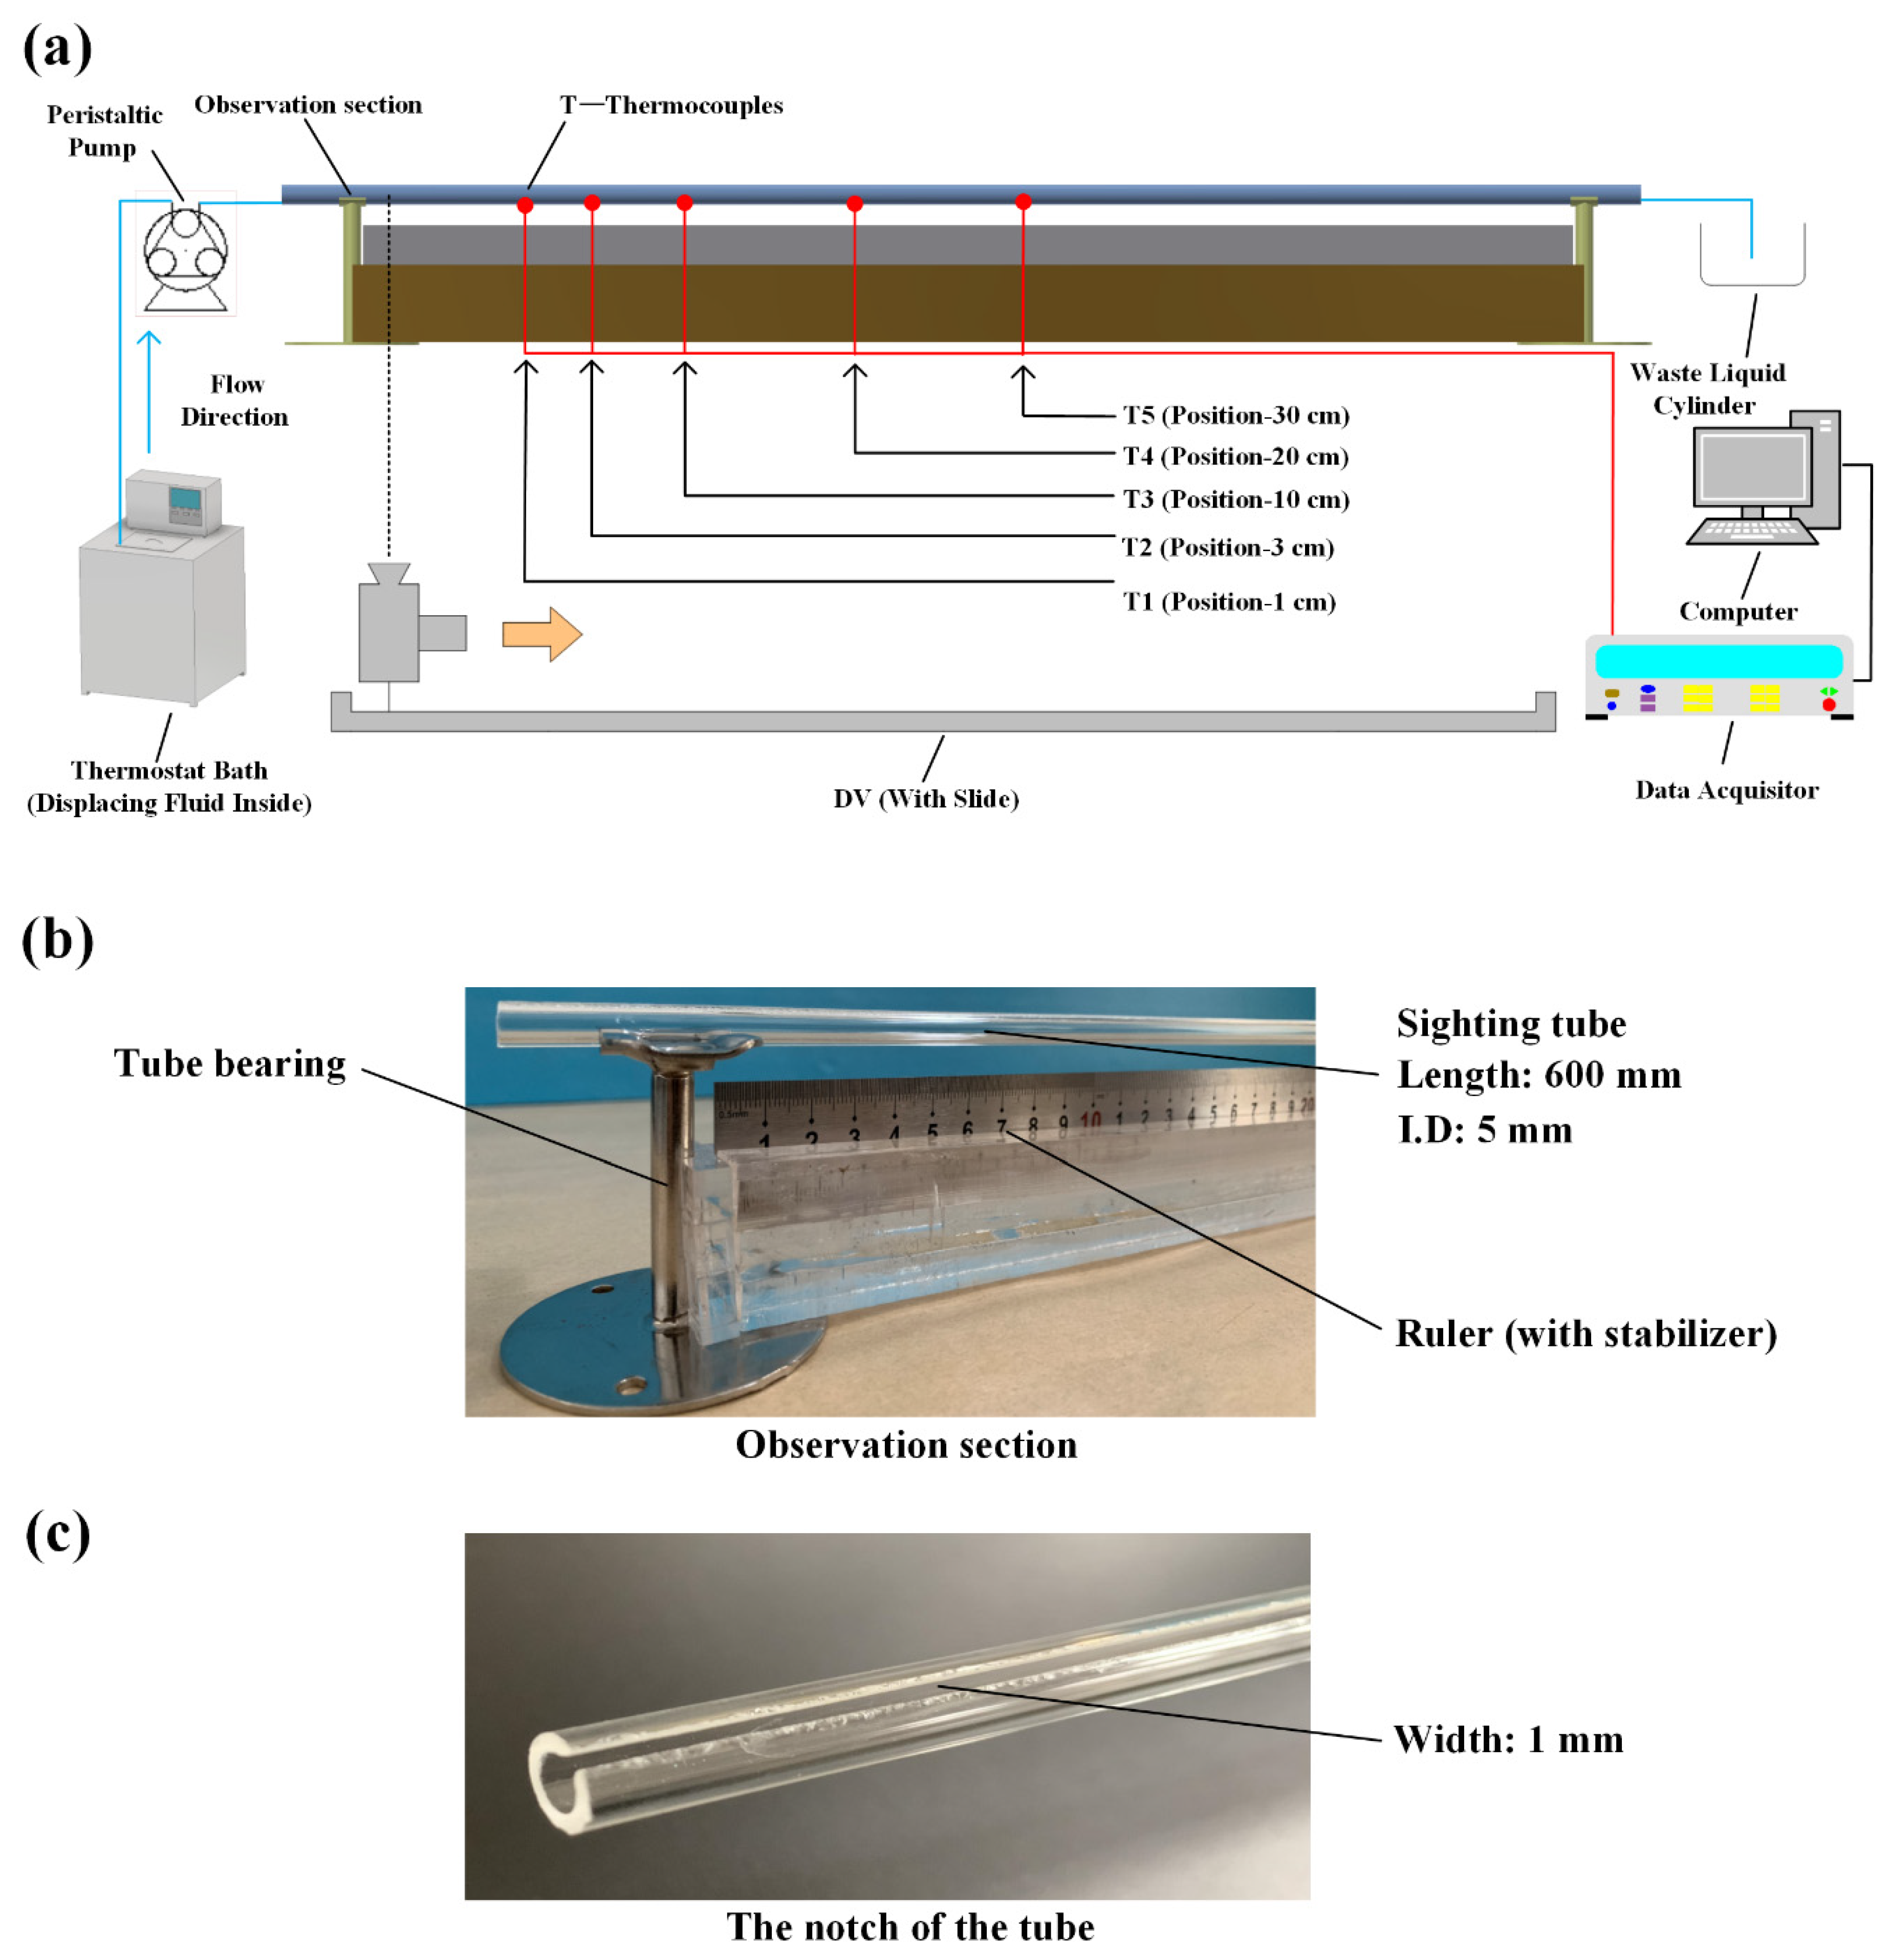
The estimated values of Biot number of the sighting tube in all the cases of Group B are less than 0.1, which means the lumped parameter method is valid in heat transfer analysis. Accordingly, the temperature of the tube outer wall measured by the thermocouples could reflect the temperature variations of the fluid in the tube.
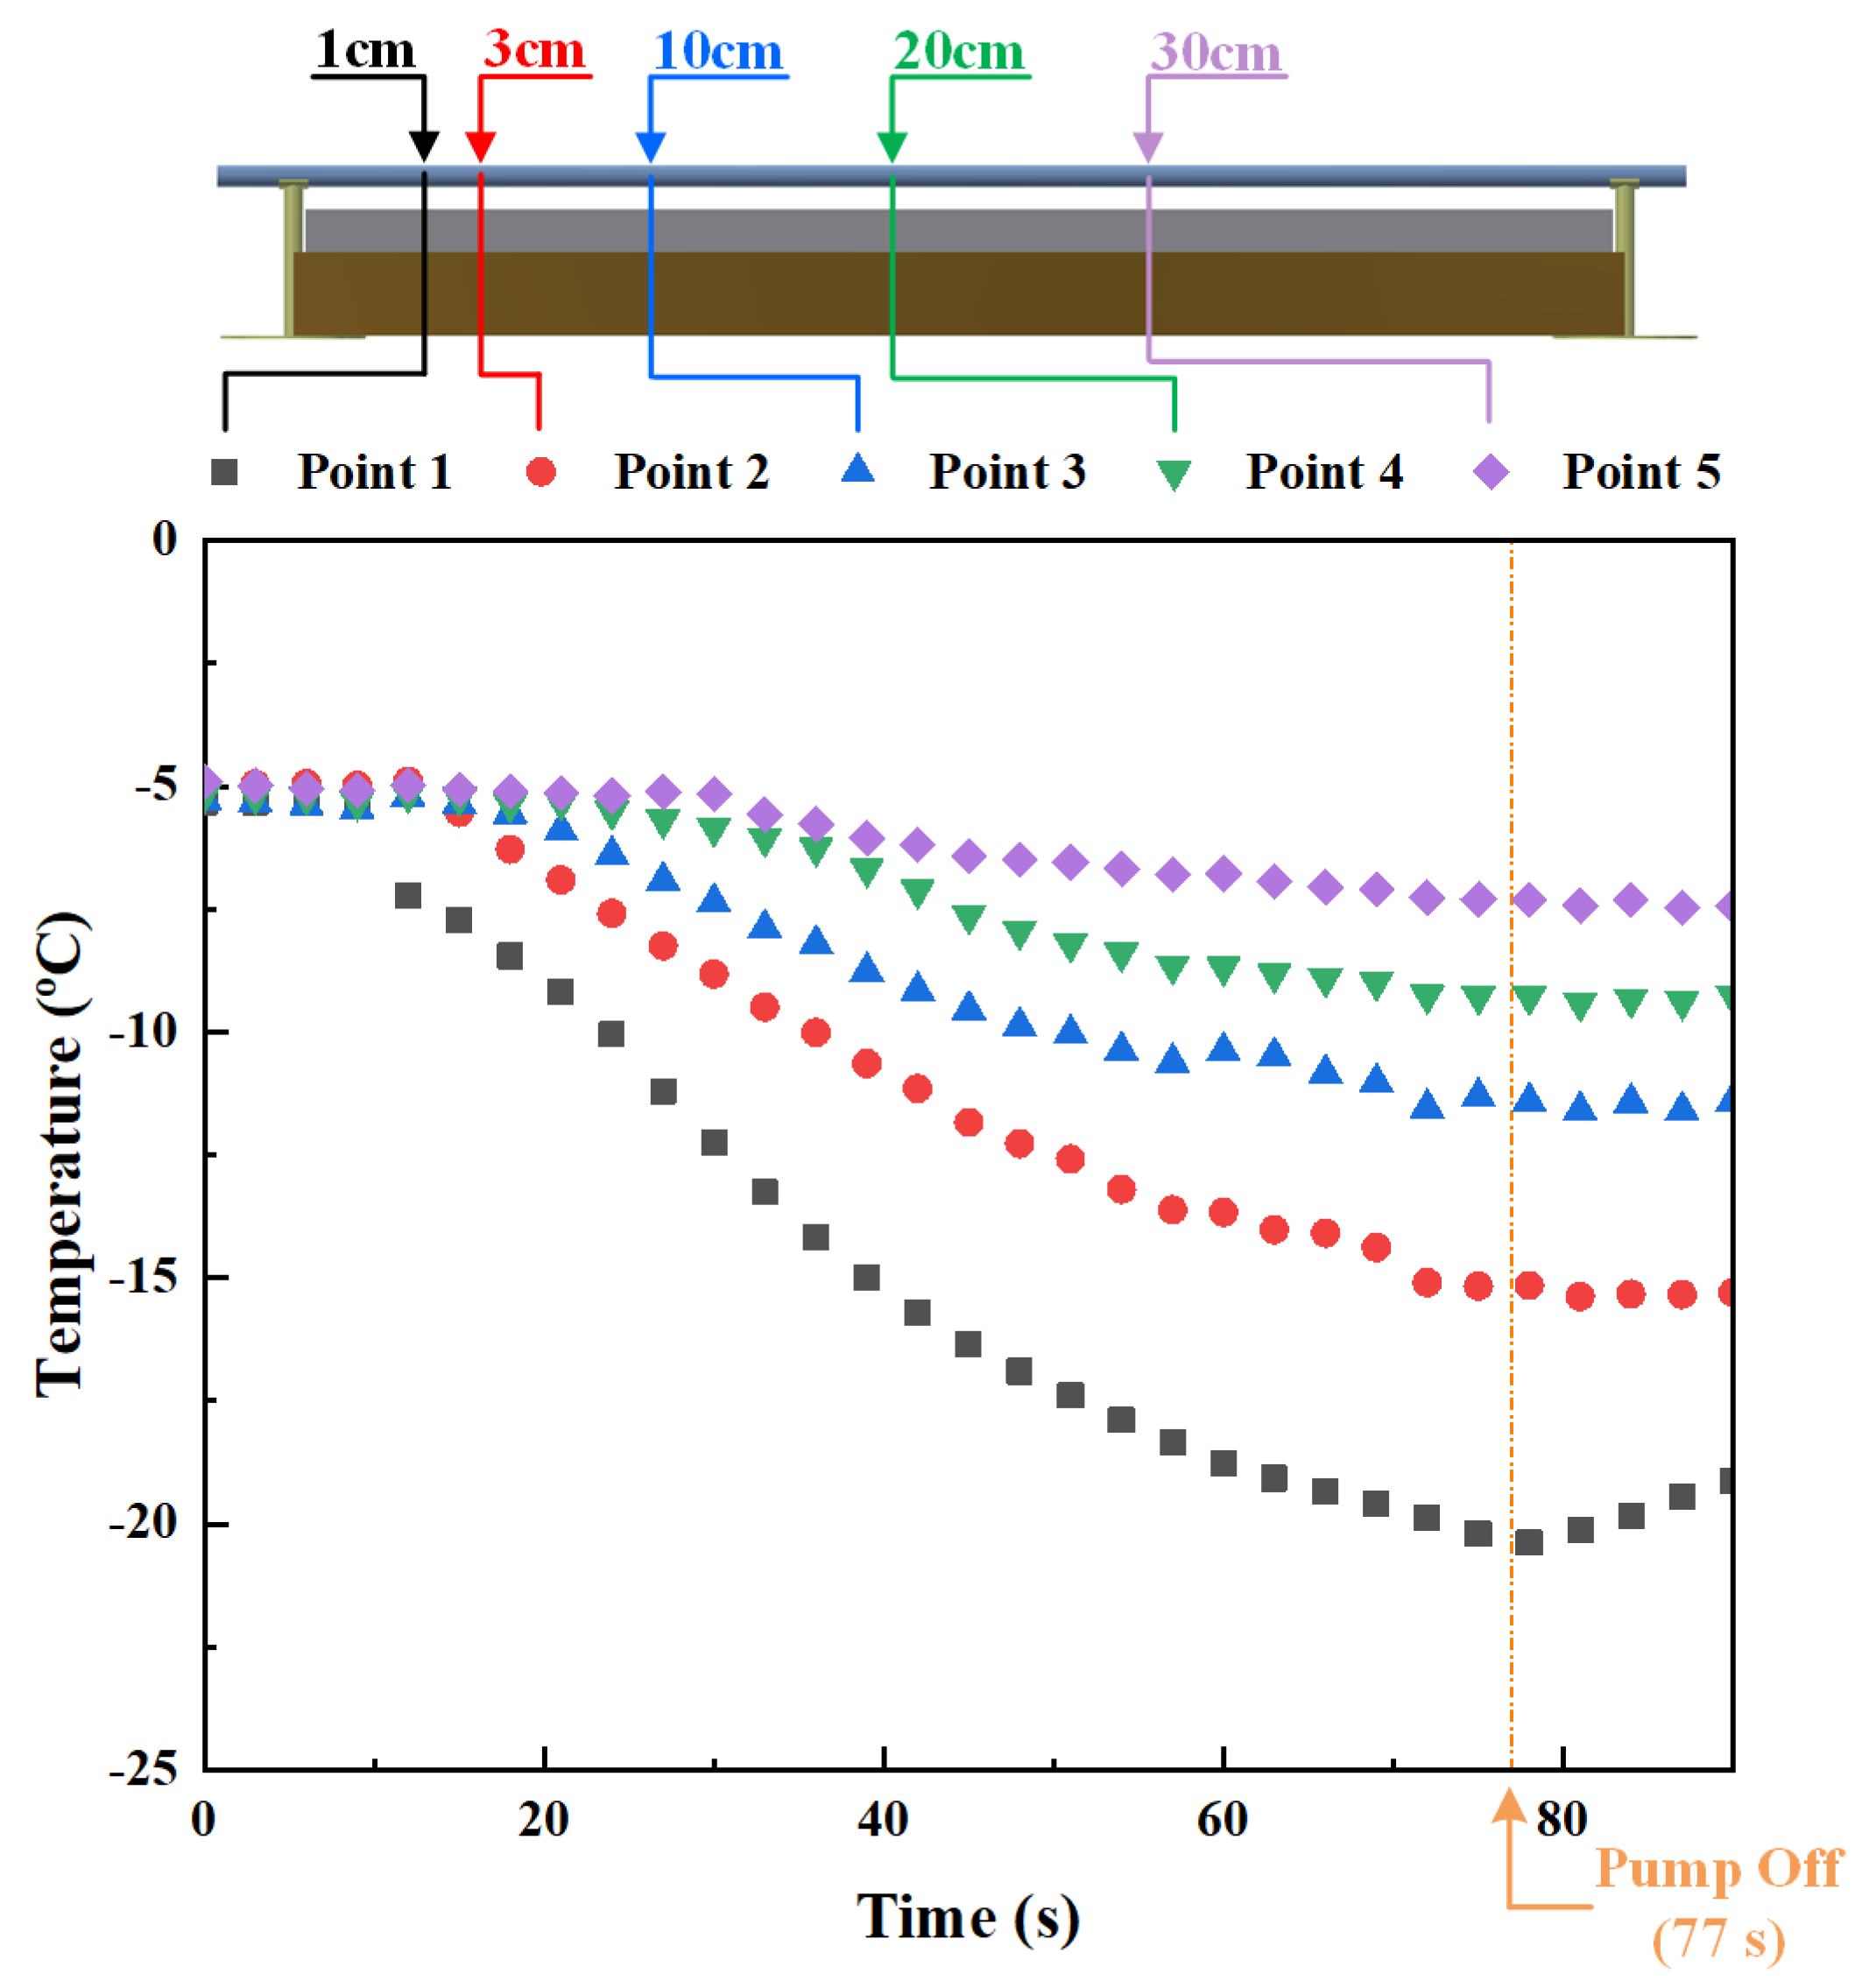
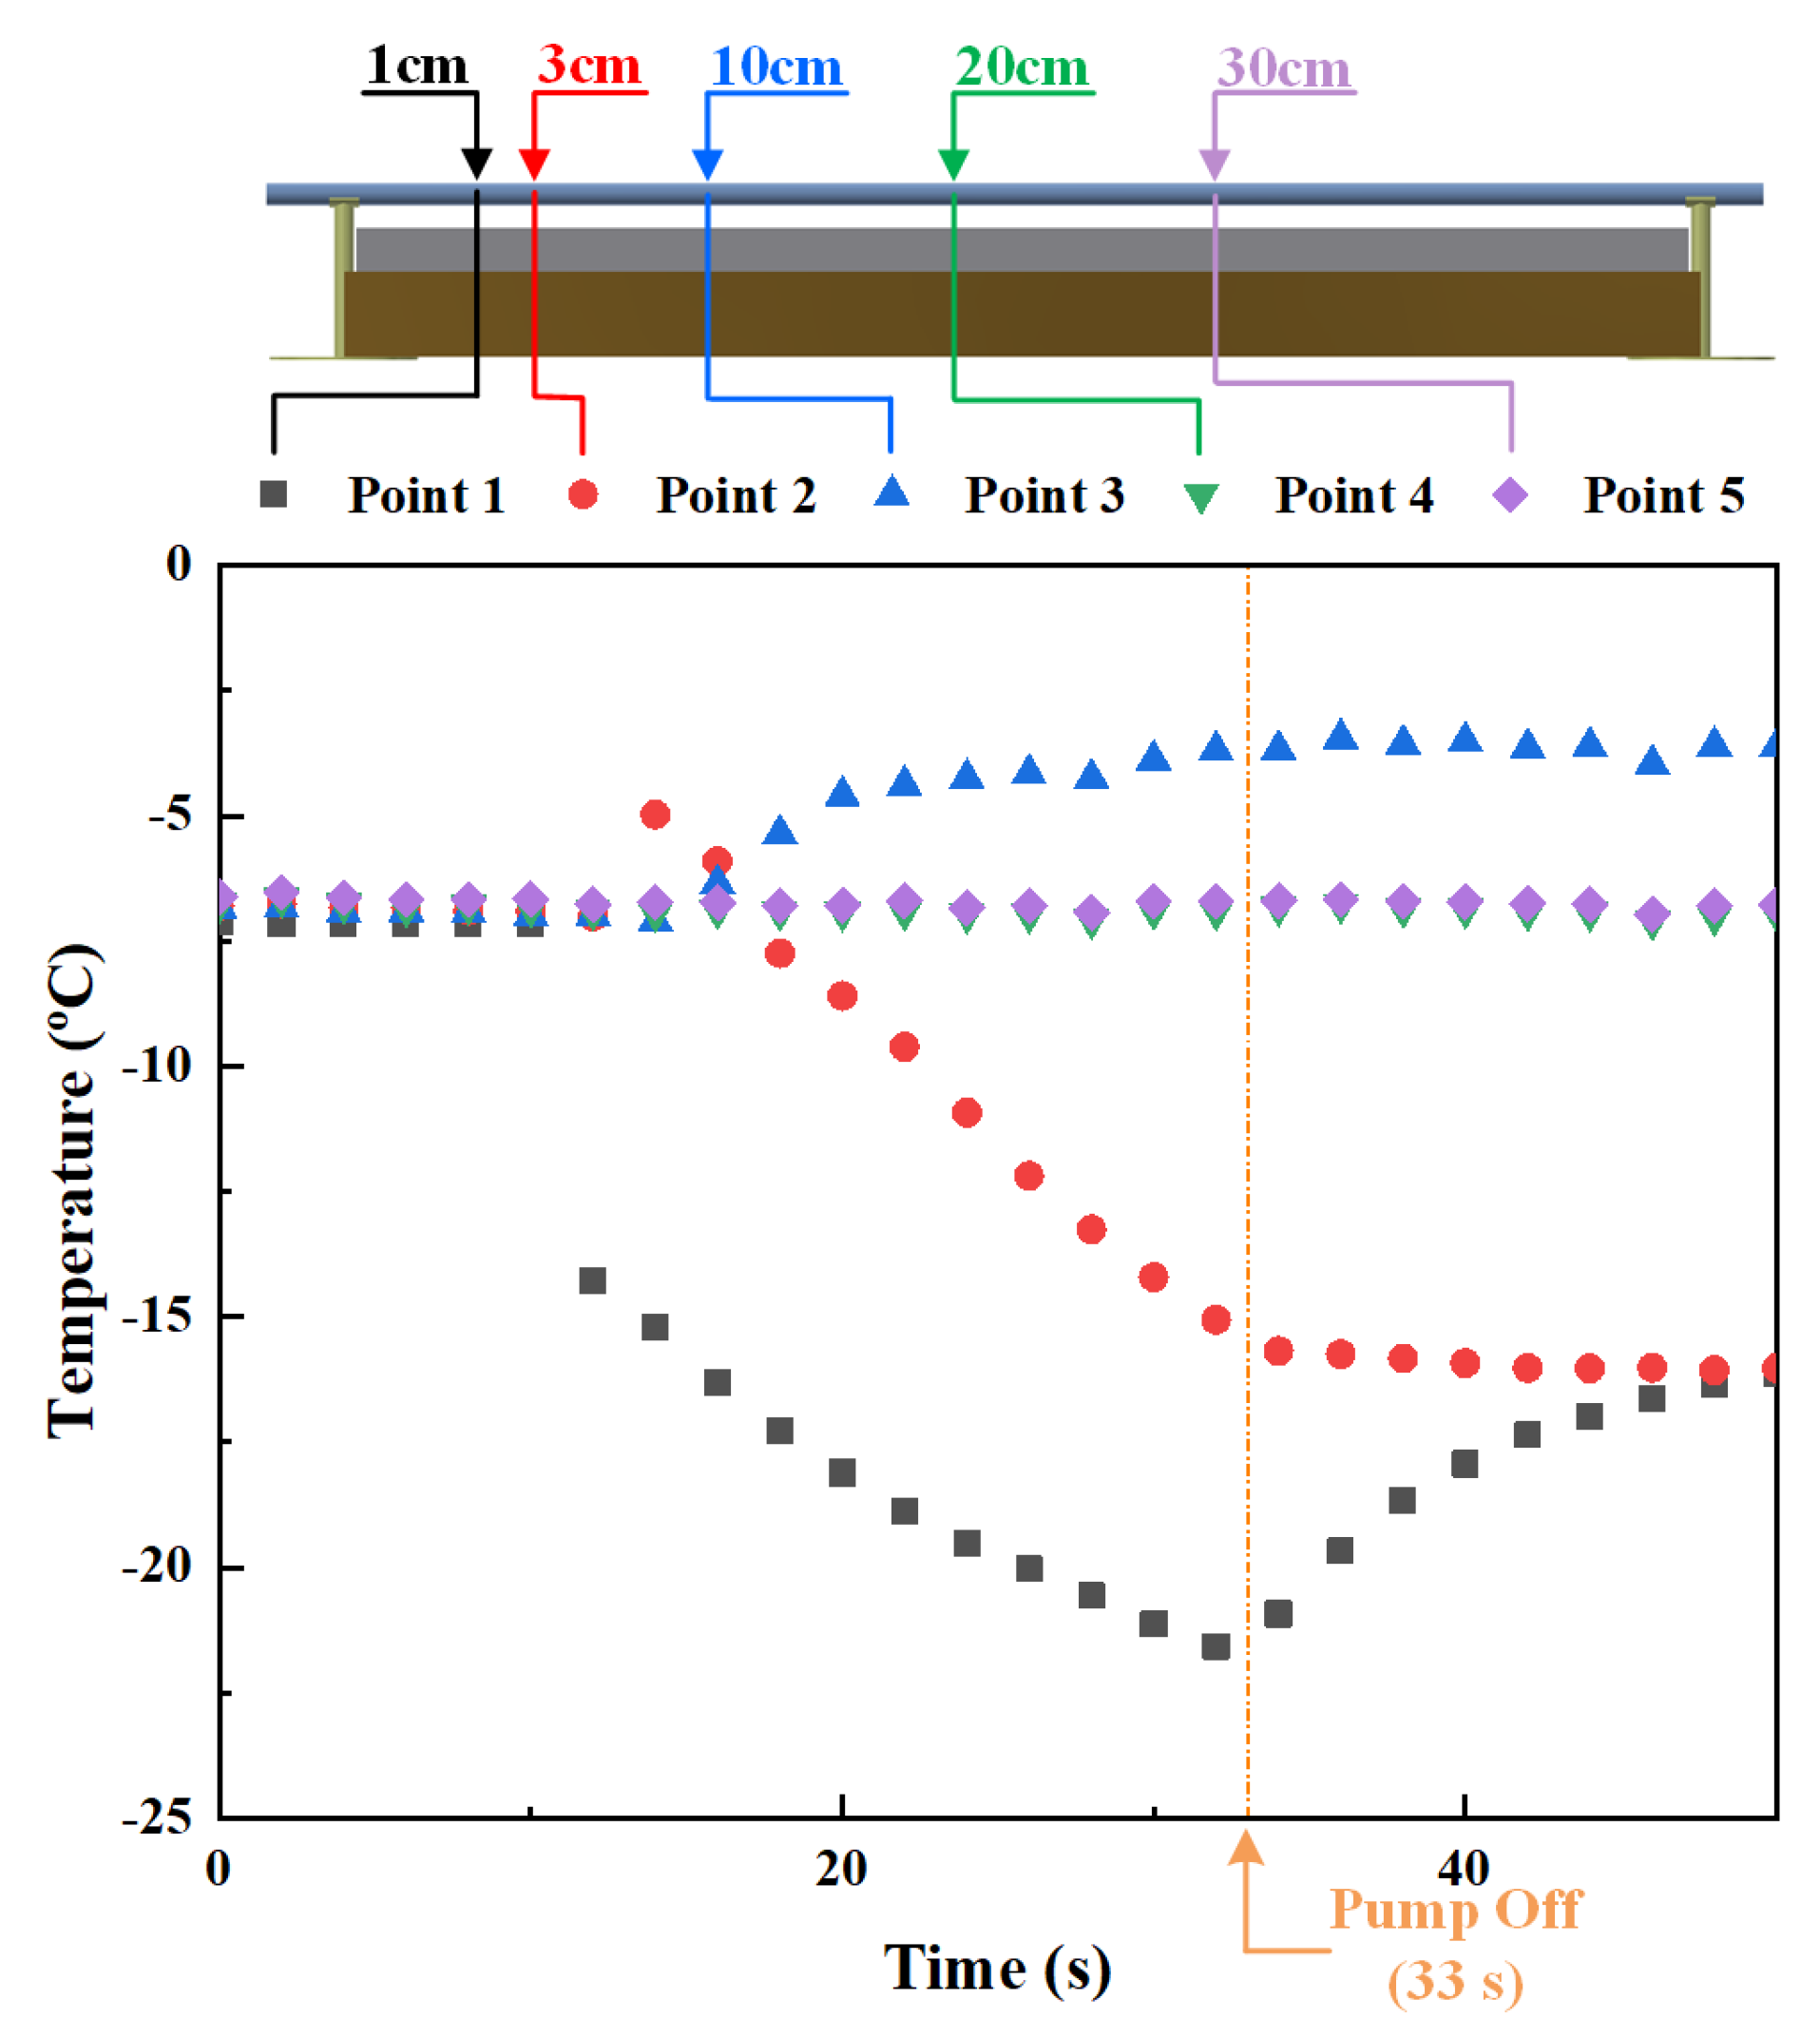
The temperature variations in the tests of Group B are mainly controlled by the supplement of the cold n-hexanol and latent heat release due to water freezing. In Case B1, the n-hexanol passes Point 1 at 10 s, leading to the first intense temperature drop at Point 1 (Figure 9). The sequent decrease of the wall temperature at the five measurement points is in agreement with the order of the n-hexanol passing through. As the temperature of n-hexanol rises while the n-hexanol is flowing in the tube, the heat exchange between the fluid and the surroundings is weakened, leading to a gentler temperature change at the points on the right side compared to the points on the left side. As the pump is turned off at 77 s, the cold n-hexanol supply is cut off and the temperatures of Points 1–5 stop decreasing. The significant temperature difference between the tube wall and its surroundings at Point 1 results in a fierce heat exchange, which induces the temperature of Point 1 to increase immediately after the cold energy supply stops. It is found that the influence of latent heat release is barely reflected in the temperature variations in Case B1, which can be explained as follows. As shown in Figure 7, water freezing is limited in the region of 0–10 cm in the tube. Since the displaced water is initially set in the region of 2 cm, Point 2 is the only measurement point that can be affected by water freezing in Case B1. By the moment the freezing process begins, most of the water near Point 2 has been driven away. As a result, quite limited latent heat was released around Point 2, which is insufficient to raise the temperature at Point 2.
In Case B2, the temperature rise at Points 3–5 is induced by the latent heat release of water freezing. As shown in Figure 11, the three curves show increasing trends (the freezing process begins) and then go down (the freezing process ends) in the order of Points 3–5, which is in accordance with the freezing trend (freezing proceeds from left to right) shown in Figure 10. No temperature rise of Point 2 induced by freezing is observed, the reason for which is the same as that in Case B1.
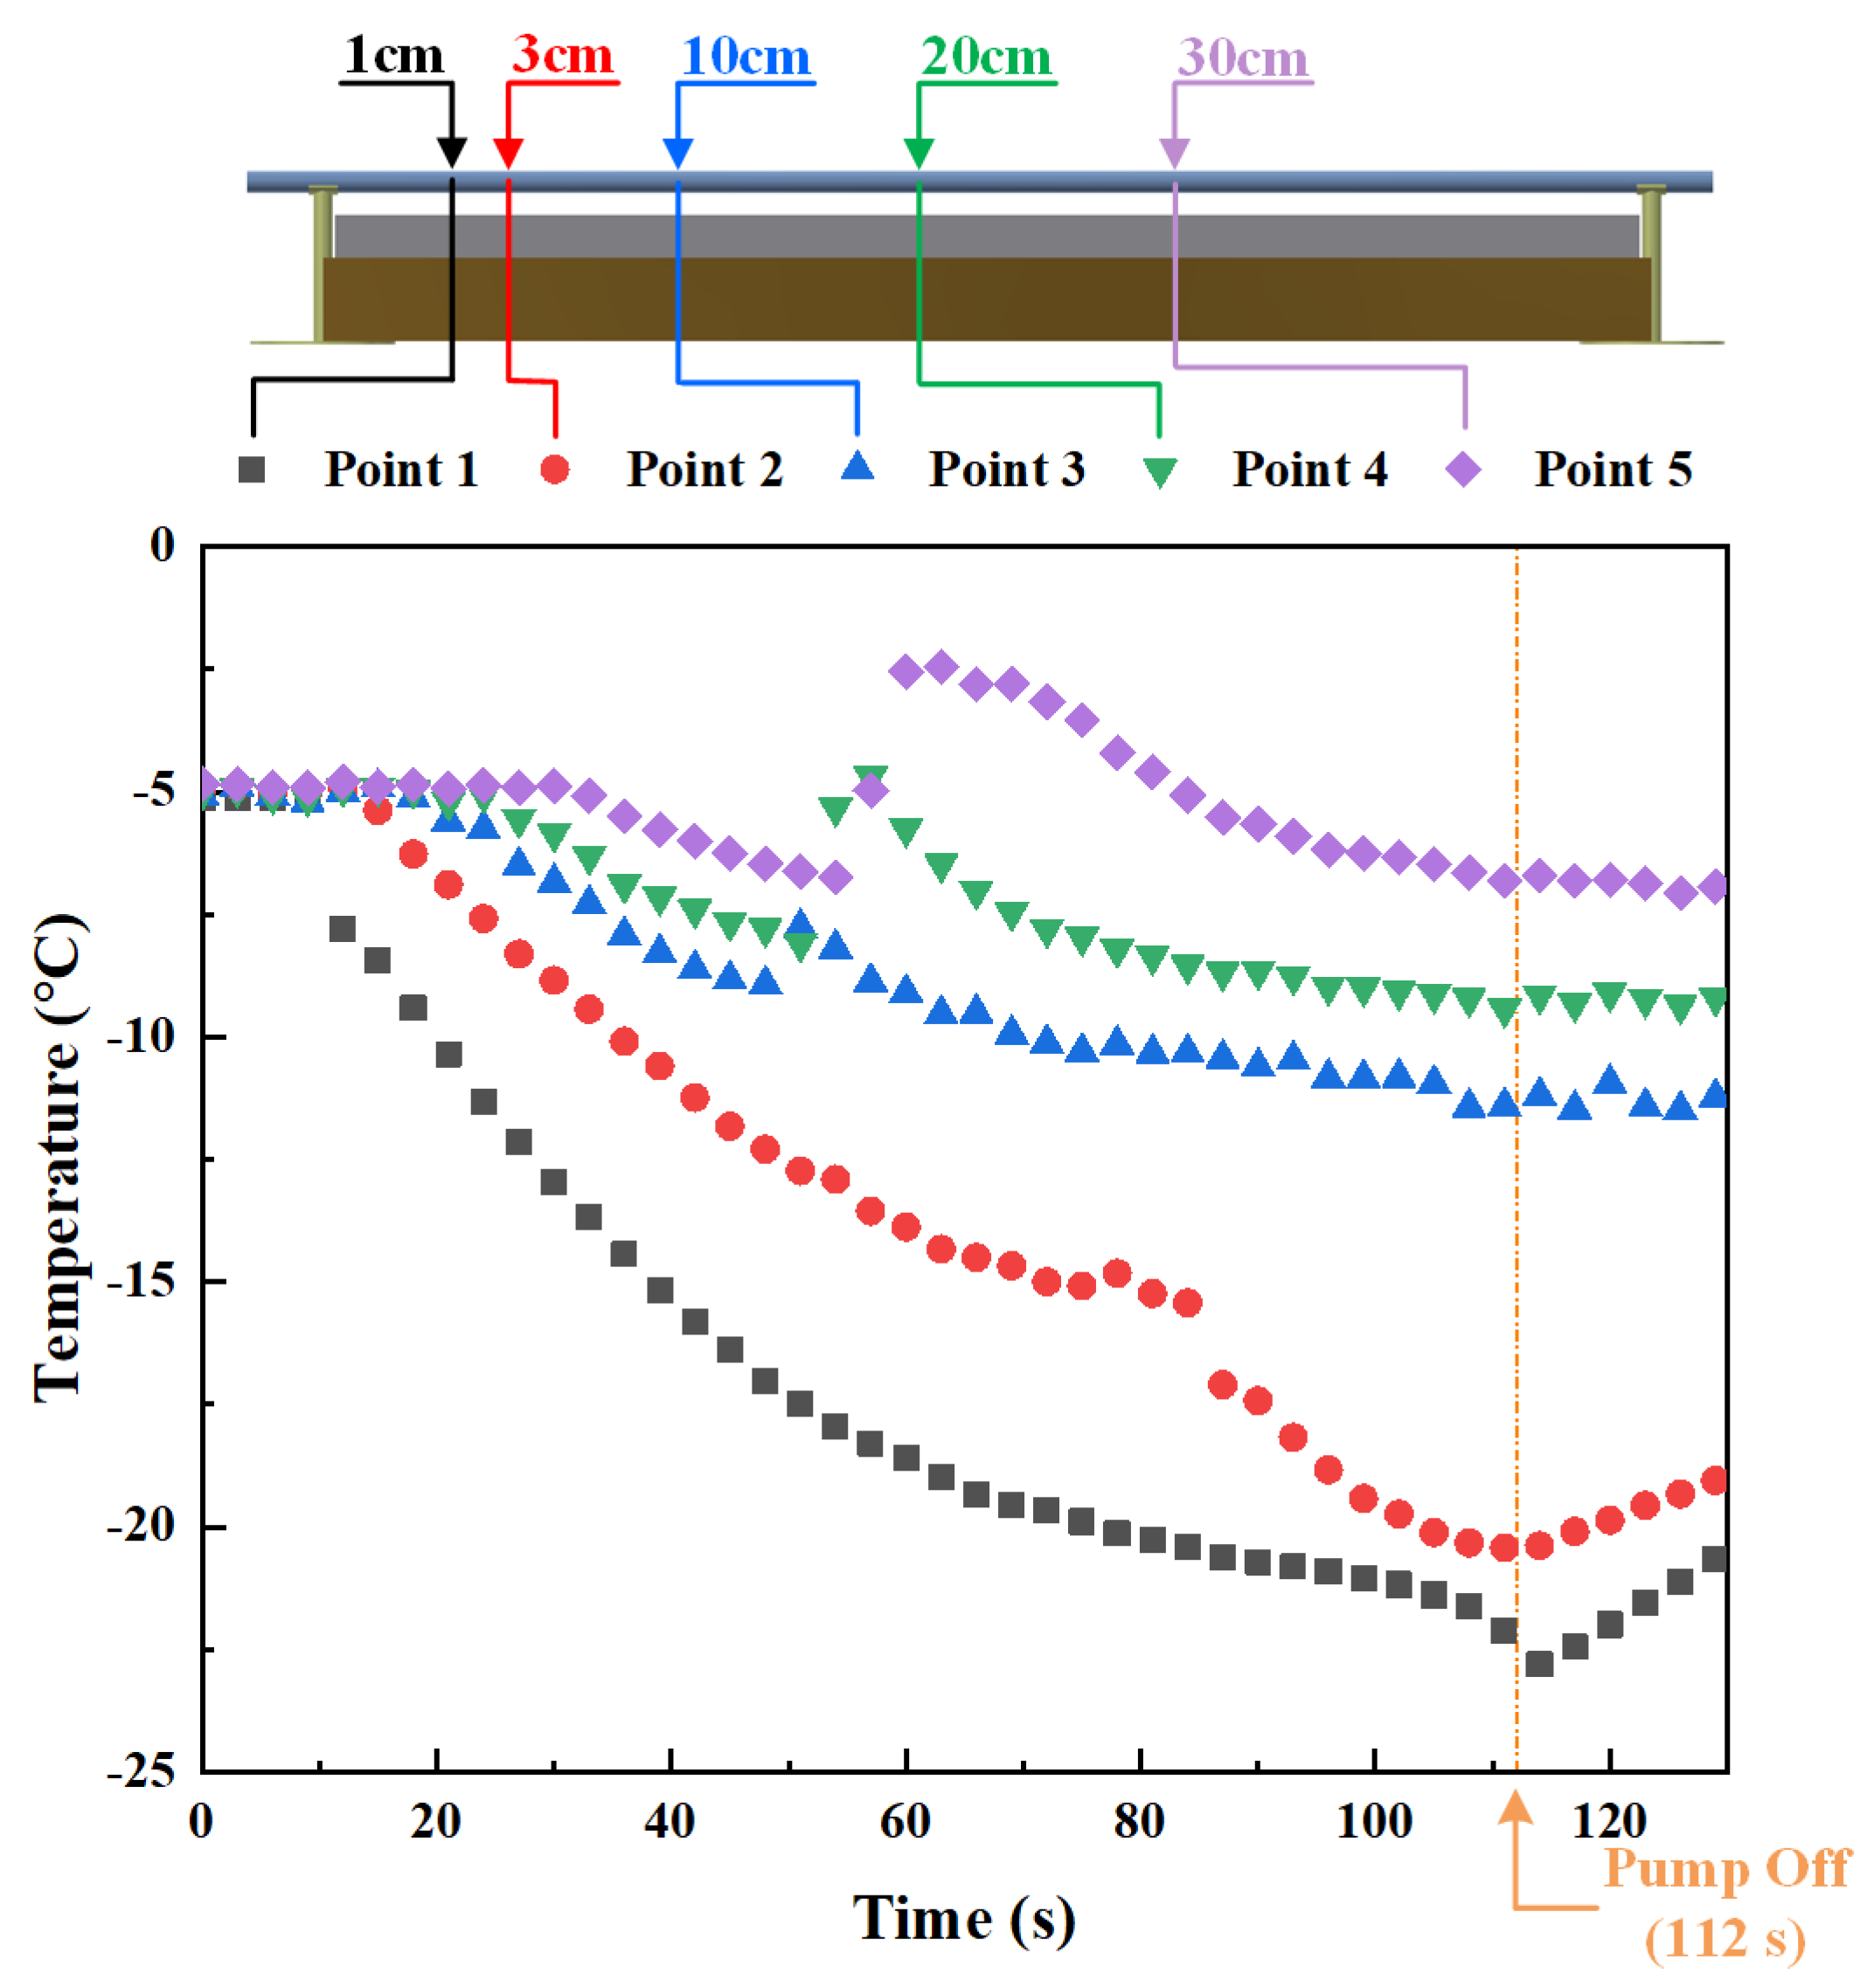
In Case B23, as shown in Figure 13, the influence of latent heat release is reflected in the temperature variation at Points 2 and 3. As the freezing process initiated soon after the displacement process began in this case, plenty of water froze into ice, which released considerable latent heat in the vicinity of Point 2, making the temperature of Point 2 rise. The temperature of Point 2 began to decrease again as the freezing process near the point finalized. On the other hand, the curve of Point 3 kept at a steady level after rising to a certain value (about −3.7 °C). It suggests a balance is reached between the cooling down of water by n-hexanol and the latent heat release due to water freezing. The temperature variation at Point 3 indicates that the freezing process at Point 3 continued throughout the entire test process of Case B23. Since the peristaltic pump was turned off at quite an early time and no fluid (either water or n-hexanol) reached these points during the test, no temperature changes were observed at Points 4 and 5 from beginning to end.
Temperature variation in the above three cases could reflect the general characteristics of heat transfer in the tests of Group B. Latent heat released during the freezing process could significantly affect the temperature distribution in the sighting tube. The measured temperature variation could provide reliable information to estimate the freezing process. As the amount of latent heat depends on amount of water solidifies, the water distribution could become another important influencing factor for temperature distribution during the displacement process.
The heat transfer results indicate that during the actual cryogenic fracturing process, pore water in the reservoir could remarkably influence the heat transfer progress. Temperature drop in the water-rich region lags behind that in dry region. As the water distribution and temperature distribution are closely related, high temperature gradient could be induced in the region where the water content difference is fierce, leading to thermal stress, which is desirable for the fracturing purpose.

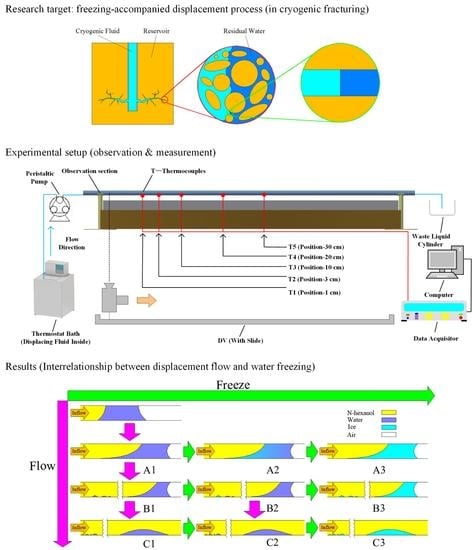
4.3. Interrelationship between Displacement Flow and Water Freezing

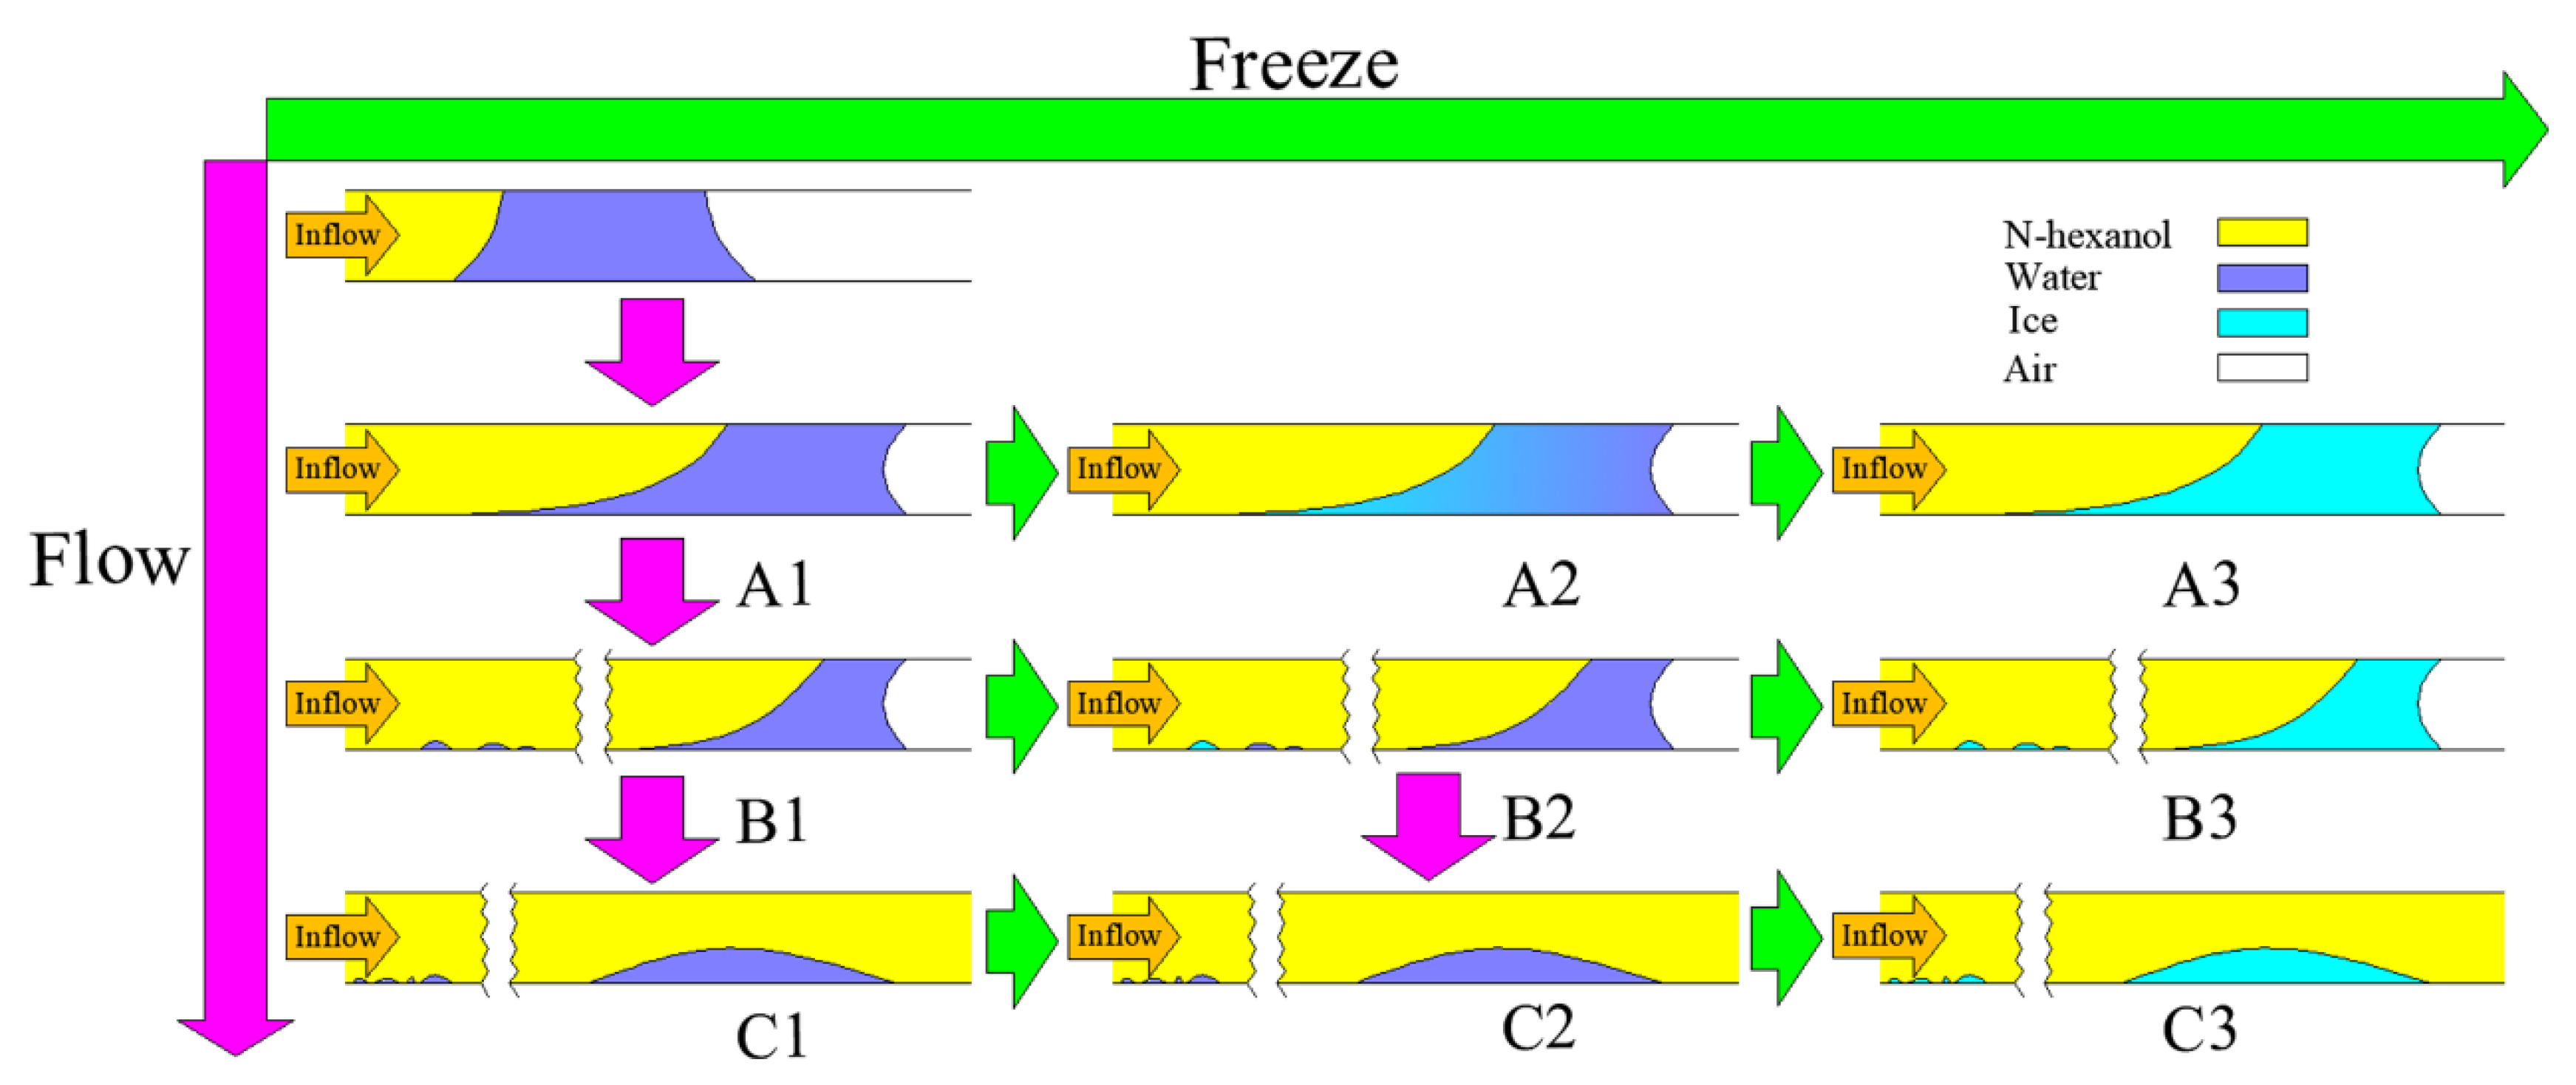
From the above discussions, the development of the displacement flow in company with water freezing could be schematically summarized in Figure 14. The development of the flow situation is displayed by the images arranged along the vertical direction (from top to bottom), with the change trend indicated by purple arrows. Meanwhile, the development of the freezing situation is displayed by the images arranged along the horizontal direction (from left to right) with the change trend indicated by green arrows.
Based on Figure 14, the interrelationship between displacement process and freezing process could be basically understood from the following three aspects.
(1) Displacement process alters the water distribution in the flow passage. In Figure 14, the flow situation during the displacement process is divided into three phases according to the water distribution in the flow passage, which are marked as “A1”, “B1” and “C1”. It should be noted that this phase division plotted in Figure 14 is different from that in Section 3.1, because the separation of water phase is also regarded as a phase (B1) of the flow situation development here. As stated in Section 4.1, the separation of water phase could occur anywhere in the water region, either before or after the displaced water is completely overtaken by the n-hexanol. In Figure 14, the pattern where water separation occurs before the water is completely overtaken by the n-hexanol is displayed. The other similar patterns are omitted for simplicity. Details of the three phases are described as follows.
Phase A1: In this phase, the entire water region is still in a continuous state. With the proceeding of the displacement process, the initial water in the center region of the flow passage is gradually driven to the edge area. On the other hand, due to the effect of wall friction, water in the edge region of the flow passage is hard to be completely driven away, thus a part of the water in this region remains in the initial position during the displacement process.
Phase B1: In this phase, several smaller isolated water regions begin to form due to the separation of water phase.
Phase C1: In this phase, the water in the center region of the flow passage has been totally driven away. Moreover, the displaced water is also completely overtaken by the n-hexanol.
(2) A continuous freezing process could be triggered in a continuous water region with a certain overall supercooling degree. The continuous freezing process can lead the entire water region to be frozen in a short period. Discontinuity in water distribution, which is caused by the separation of water phase during the displacement process, would interrupt the continuous freezing process, slowing down the progress of water freezing. In Figure 14, the freezing processes of “B1–B3” and “C1–C3” are supposed to take more time in comparison with those of “A1–A3”.
(3) Freezing process occurring at different moments in the displacement process (A1, B1 and C1) could result in different distributions of ice in the flow passage (A3, B3 and C3), which further leads to the occurrence of two typical ice blockage patterns, i.e., incomplete ice blockage (C3) and complete ice blockage (A3 and B3), in the flow passage. In the incomplete ice blockage pattern, fluid flow is allowed to continue after the freezing process. In the complete ice blockage pattern, however, flowing process in the original direction is cut off after the freezing process. The fluids are forced to change their flow direction. The ice blockage pattern is determined by both the displacement process and freezing process. Factors that affect these two physical processes, i.e. initial water column length, initial water temperature and n-hexanol flow rate, could also influence the occurrence of ice blockage.

5. Conclusions

1. The displacement process could induce the changes of the water distribution in the flow passage. Water in the central region of the passage is driven away by the displacing fluid (n-hexanol in the current study) while a part of the water in the edge region of the passage is left in the initial position due to the wall friction effect. Meanwhile, the initially continuous water phase separates into several isolated zones, which distribute dispersedly in the flow passage. The water is gradually overtaken by the displacing fluid with the proceeding of the displacement process. Water distribution could influence the freezing process. A discontinuous distribution of water interrupts the continuous freezing process, slowing the progress of water freezing. Moreover, water distribution affects the latent heat release during the freezing process, which determines the temperature distribution along the flow passage.
2. Water freezing during the displacement process could result in two typical patterns of ice blockage in the flow passage, i.e., incomplete ice blockage and complete ice blockage. In the incomplete ice blockage pattern, the flow rate of the fluid is mainly affected, while, in the complete ice blockage pattern, both the flow rate and the flow direction of the fluid could be altered. Initial length of water column, initial water temperature and the flow rate of the displacing fluid were found to have significant influences on the occurrence of ice blockage pattern. Reducing the initial length of water column and increasing the initial water temperature could inhibit the occurrence of complete ice blockage. The influence of the flow rate of the displacing fluid depends on the specific situation (either inhibits or promotes the occurrence of complete ice blockage). Separation of water phase could resultantly inhibit the occurrence of complete ice blockage.

Author Contributions

Conceptualization, C.H.; Methodology, C.H.; Writing—original draft preparation, C.H.; Writing—review and editing, W.W., Y.X. and W.L.; and Project administration, W.L. All authors have read and agreed to the published version of the manuscript.

Funding

This research was funded by: The National Natural Science Foundation of China, grant number 51776031; The Key Project of Natural Science Foundation of Liaoning Province of China, grant number 20170540182; and China Postdoctoral Science Foundation, grant numbers 2019TQ0049 and 2019M661101.

Conflicts of Interest

The authors declare no conflict of interest.

References

  1. Li, Z.; Xu, H.; Zhang, C. Liquid nitrogen gasification fracturing technology for shale gas development. J. Pet. Sci. Eng. 2016, 138, 253–256. [Google Scholar] [CrossRef]
  2. Zhang, Y. Study on Liquid Nitrogen Fracturing in Coalbed Gas Well. Master’s Thesis, Southwest Peroleum University, Chengdu, China, 2015. [Google Scholar]
  3. Wang, L.; Yao, B.; Cha, M.; Alqahtani, N.B.; Patterson, T.W.; Kneafsey, T.J.; Miskimins, J.L.; Yin, X.; Wu, Y.-S. Waterless fracturing technologies for unconventional reservoirs-opportunities for liquid nitrogen. J. Nat. Gas Sci. Eng. 2016, 35, 160–174. [Google Scholar] [CrossRef] [Green Version]
  4. Huang, C.; Wang, W.; Li, W. A Novel 2D Model for Freezing Phase Change Simulation during Cryogenic Fracturing Considering Nucleation Characteristics. Appl. Sci. 2020, 10, 3308. [Google Scholar] [CrossRef]
  5. Grundmann, S.R.; Rodvelt, G.D.; Dials, G.A.; Allen, R.E. Cryogenic nitrogen as a hydraulic fracturing fluid in the Devonian shale. In Proceedings of the [A]/SPE Eastern Regional Meeting, Pittsburgh, PA, USA, 9–11 November 1998. [Google Scholar]
  6. McDaniel, B.W.; Grundmann, S.R.; Kendrick, W.D.; Wilson, D.R.; Jordan, S.W. Field applications of cryogenic nitrogen as a hydraulic-fracturing fluid. J. Pet. Technol. 1998, 50, 38–39. [Google Scholar]
  7. Cha, M.; Yin, X.; Kneafsey, T.; Johanson, B.; Alqahtani, N.; Miskimins, J.; Patterson, T.; Wu, Y.-S. Cryogenic fracturing for reservoir stimulation-Laboratory studies. J. Pet. Sci. Eng. 2014, 124, 436–450. [Google Scholar] [CrossRef] [Green Version]
  8. Qin, L.; Zhai, C.; Liu, S.; Xu, J.; Yu, G.; Sun, Y. Changes in the petrophysical properties of coal subjected to liquid nitrogen freeze-thaw-A nuclear magnetic resonance investigation. Fuel 2017, 194, 102–114. [Google Scholar] [CrossRef]
  9. Zhao, B.; Zhang, G.Q.; Zhao, P.-y.; Wang, L.L.; Lin, Y.; Lv, Y.J. Experimental study of mechanics and seepage characteristics of sandstones after liquid-nitrogen stimulation. J. Nat. Gas Sci. Eng. 2017, 47, 11–21. [Google Scholar] [CrossRef]
  10. Li, R.; Huang, Z.; Wu, X.; Yan, P.; Dai, X. Cryogenic quenching of rock using liquid nitrogen as a coolant: Investigation of surface effects. Int. J. Heat Mass Transf. 2018, 119, 446–459. [Google Scholar] [CrossRef]
  11. Yin, G.; Shang, D.; Li, M.; Huang, J.; Gong, T.; Song, Z.; Deng, B.; Liu, C.; Xie, Z. Permeability evolution and mesoscopic cracking behaviors of liquid nitrogen cryogenic freeze fracturing in low permeable and heterogeneous coal. Powder Technol. 2018, 325, 234–246. [Google Scholar] [CrossRef]
  12. Gao, F.; Cai, C.; Yang, Y. Experimental research on rock fracture failure characteristics under liquid nitrogen cooling conditions. Results Phys. 2018, 9, 252–262. [Google Scholar] [CrossRef]
  13. Yao, B. Experimental Study and Numerical Modeling of Cryogenic Fracturing Process on Laboratory-scale Rock and Concrete Samples. Master’s Thesis, Colorado School of Mines, Golden, CO, USA, 2015. [Google Scholar]
  14. Alqahtani, N.B. Experimental Study and Finite Element Modeling of Cryogenic Fracturing in Unconventional Reservoirs. Ph.D. Thesis, Colorado School of Mines, Golden, CO, USA, 2015. [Google Scholar]
  15. Cai, C.; Li, G.; Huang, Z.; Shen, Z.; Tian, S.; Wei, J. Experimental study of the effect of liquid nitrogen cooling on rock pore structure. J. Nat. Gas Sci. Eng. 2014, 21, 507–517. [Google Scholar] [CrossRef]
  16. Cai, C.; Li, G.; Huang, Z.; Shen, Z.; Tian, S. Rock pore structure damage due to freeze during liquid nitrogen fracturing. Arab. J. Sci. Eng. 2014, 39, 9249–9257. [Google Scholar] [CrossRef]
  17. Jiang, L.; Cheng, Y.; Han, Z.; Gao, Q.; Yan, C.; Wang, H.; Fu, L. Effect of liquid nitrogen cooling on the permeability and mechanical characteristics of anisotropic shale. J. Pet. Explor. Prod. Technol. 2018, 1–14. [Google Scholar] [CrossRef] [Green Version]
  18. Wu, X.; Huang, Z.; Song, H.; Zhang, S.; Cheng, Z.; Li, R.; Wen, H.; Huang, P.; Dai, X. Variations of physical and mechanical properties of heated granite after rapid cooling with liquid nitrogen. Rock Mech. Rock Eng. 2019, 52, 1–17. [Google Scholar] [CrossRef]
  19. Han, S.; Cheng, Y.; Gao, Q.; Yan, C.; Han, Z. Experimental study of the effect of liquid nitrogen pretreatment on shale fracability. J. Nat. Gas Sci. Eng. 2018, 60, 11–23. [Google Scholar] [CrossRef]
  20. Wu, X.; Huang, Z.; Zhang, S.; Cheng, Z.; Li, R.; Song, H.; Wen, H.; Huang, P. Damage analysis of high temperature rocks subjected to LN2 thermal shock. Rock Mech. Rock Eng. 2019, 1–19. [Google Scholar] [CrossRef]
  21. Huang, Z.; Zhang, S.; Yang, R.; Wu, X.; Li, R.; Zhang, H.; Hung, P. A review of liquid nitrogen fracturing technology. Fuel 2020, 266, 117040. [Google Scholar] [CrossRef]
  22. Hassanpouryouzband, A.; Joonaki, E.; Farahani, M.V.; Takeya, S.; Ruppel, C.; Yang, J.; English, N.J.; Schicks, J.M.; Edlmann, K.; Mehrabian, H.; et al. Gas hydrates in sustainable chemistry. Chem. Soc. Rev. 2020, 49, 5225–5309. [Google Scholar] [CrossRef]
  23. Ickes, L.; Welti, A.; Hoose, C.; Lohmann, U. Classical nucleation theory of homogeneous freezing of water: Thermodynamic and kinetic parameters. Phys. Chem. Chem. Phys. 2015, 17, 5514–5537. [Google Scholar] [CrossRef] [PubMed]
  24. Němec, T. Estimation of ice–water interfacial energy based on pressure-dependent formulation of classical nucleation theory. Chem. Phys. Lett. 2013, 583, 64–68. [Google Scholar] [CrossRef]
  25. Sear, R.P. Nucleation: Theory and applications to protein solutions and colloidal suspensions. J. Phys. Condens. Matter 2007, 19, 33–101. [Google Scholar] [CrossRef]
  26. Wilson, P.W.; Heneghan, A.F.; Haymet, A.D.J. Ice nucleation in nature: Super cooling point (SCP) measurements and the role of heterogeneous nucleation. Cryobiology 2003, 46, 88–98. [Google Scholar] [CrossRef]
Figure 1. Schematic diagram of cryogenic fracturing process: (a) practical condition in reservoir; (b) the simplified model of the reservoir; and (c) the local area of the simplified model (considered in this paper).
Energies 13 05409 g001
Figure 2. Schematic diagram of the experimental system: (a) the arrangement of the test setup; (b) the initial section of the test setup; and (c) the notch on the sighting tube.
Energies 13 05409 g002
Figure 3. Schematic diagram of the test procedure: (a) the injection of the displaced fluid; and (b) the injection of the displacing fluid.
Energies 13 05409 g003
Figure 4. The propagation of the displacement in Case A1 (0–27 s).
Energies 13 05409 g004
Figure 5. The propagation of the displacement in Case A1 (28–29 s).
Energies 13 05409 g005
Figure 6. The distribution of the water phase at the end of the test (Case A1).
Energies 13 05409 g006
Figure 7. The displacement and freezing processes in Case B1.
Energies 13 05409 g007
Figure 8. Distribution of the water and ice in the tube after shutting off the pump (0–30 cm, Case B1).
Energies 13 05409 g008
Figure 9. Time dependence of the temperature changes at different tube location.
Energies 13 05409 g009
Figure 10. The displacement and freezing processes in Case B2.
Energies 13 05409 g010
Figure 11. Time dependence of the temperature changes at different tube locations (Case B2).
Energies 13 05409 g011
Figure 12. The displacement and freezing processes in Case B23.
Energies 13 05409 g012
Figure 13. Time dependence of the temperature changes at different tube locations (Case B23).
Energies 13 05409 g013
Figure 14. Development of displacement-freezing process.
Energies 13 05409 g014
Table 1. The physical properties of n-hexanol.
Physical PropertiesDescription
Flash Point (°C)63
Freezing Point (°C)−44.6
Boiling Point (°C)157
Water-solubility0.59 g/100 g, 20 °C (Slightly soluble)
Table 2. Condition settings (Group A).
Column Length2 cm4 cm7 cm
Flow Rate
24.9 mL/minCase A1Case A4Case A7
39.7 mL/minCase A2Case A5Case A8
54.1 mL/minCase A3Case A6Case A9
Table 3. Condition Settings (Group B).
Water Temperature−5 °C−6 °C−7 °C
Flow Rate, Column Length
24.9 mL/min, 2 cmCase B1Case B10Case B19
24.9 mL/min, 4 cmCase B2Case B11Case B20
24.9 mL/min, 7 cmCase B3Case B12Case B21
39.7 mL/min, 2 cmCase B4Case B13Case B22
39.7 mL/min, 4 cmCase B5Case B14Case B23
39.7 mL/min, 7 cmCase B6Case B15Case B24
54.1 mL/min, 2 cmCase B7Case B16Case B25
54.1 mL/min, 4 cmCase B8Case B17Case B26
54.1 mL/min, 7 cmCase B9Case B18Case B27
Table 4. Overtaking rate (cm s−1, Group A).
2 cm4 cm7 cm
24.9 mL/min0.3580.1820.123
39.7 mL/min0.5900.2060.146
54.1 mL/min1.1760.2400.169
Table 5. Trigger-time of freezing (s).
−5 °C−6 °C−7 °C
24.9 mL/min, 2 cm37357
24.9 mL/min, 4 cm34232
24.9 mL/min, 7 cm38298
39.7 mL/min, 2 cm27361
39.7 mL/min, 4 cm33162
39.7 mL/min, 7 cm1042
54.1 mL/min, 2 cm862
54.1 mL/min, 4 cm1522
54.1 mL/min, 7 cm422
Table 6. Average freezing rate (cm s−1).
−5 °C−6 °C−7 °C
24.9 mL/min, 2 cm2.182.772.99
24.9 mL/min, 4 cm2.102.923.63
24.9 mL/min, 7 cm2.243.063.93
39.7 mL/min, 2 cm2.562.883.82
39.7 mL/min, 4 cm2.132.644.61
39.7 mL/min, 7 cm2.473.103.53
54.1 mL/min, 2 cm3.123.393.57
54.1 mL/min, 4 cm2.922.843.75
54.1 mL/min, 7 cm2.442.863.57
Table 7. Ice blockage situation.
−5 °C−6 °C−7 °C
24.9 mL/min, 2 cmIncomplete blockageIncomplete blockageComplete blockage
24.9 mL/min, 4 cmIncomplete blockageIncomplete blockageComplete blockage
24.9 mL/min, 7 cmIncomplete blockageIncomplete blockageComplete blockage
39.7 mL/min, 2 cmIncomplete blockageIncomplete blockageComplete blockage
39.7 mL/min, 4 cmIncomplete blockageIncomplete blockageComplete blockage
39.7 mL/min, 7 cmComplete blockageComplete blockageComplete blockage
54.1 mL/min, 2 cmIncomplete blockageIncomplete blockageIncomplete blockage
54.1 mL/min, 4 cmIncomplete blockageIncomplete blockageComplete blockage
54.1 mL/min, 7 cmIncomplete blockageComplete blockageComplete blockage
Publisher’s Note: MDPI stays neutral with regard to jurisdictional claims in published maps and institutional affiliations.

