Abstract
The accurate determination and dynamic adjustment of key control parameters are challenges for equivalent consumption minimization strategy (ECMS) to be implemented in real-time control of hybrid electric vehicles. An adaptive real-time ECMS is proposed for hybrid heavy-duty truck in this paper. Three efforts have been made in this study. First, six kinds of typical driving cycle for hybrid heavy-duty truck are obtained by hierarchical clustering algorithm, and a driving condition recognition (DCR) algorithm based on a neural network is put forward. Second, particle swarm optimization (PSO) is applied to optimize three key parameters of ECMS under a specified driving cycle, including equivalent factor, scale factor of penalty function, and vehicle speed threshold for engine start-up. Finally, combining all the above two efforts, a novel adaptive ECMS based on DCR and key parameter optimization of ECMS by PSO is presented and validated through numerical simulation. The simulation results manifest that proposed adaptive ECMS can further improve the fuel economy of a hybrid heavy-duty truck while keeping the battery charge-sustainability, compared with ECMS and PSO-ECMS under a composite driving cycle.
1. Introduction
1.1. Literature Review
Heavy-duty trucks play an important role in the modernization of the national infrastructure. In the context of current heavy-duty truck market demand and strict fuel consumption and emission limits, energy saving and emissions reduction are of great significance to the development of heavy-duty trucks. In addition, the increasingly strict fuel consumption standard of the vehicle also makes it difficult to effectively resolve the contradiction between economic demands and power demands of traditional heavy-duty trucks [1,2]. The development of an efficient hybrid power system is an effective way to meet the above challenges, and has become a common demand for the development of the world’s heavy-duty truck industry. Establishing an appropriate energy management strategy (EMS) is the core difficulty of the design and development of hybrid heavy-duty trucks, and it is also the key to achieving strong power, low energy consumption, and low emissions of a hybrid power system [3,4]. Therefore, the design and optimization of EMS have been a research hotspot of hybrid heavy-duty trucks in recent years.
Existing EMS include rule-based EMS and optimization-based EMS. Considering the implementation of energy management strategies in engineering practice, rule-based EMS is generally adopted [5,6]. The rule-based EMS is to artificially formulate a series of pre-set operating rules to distribute engine torque and motor torque in real time. Although the control rules of this method are relatively simple, the formulation of control rules requires a lot of time and effort, and it is constrained by the calibration engineers’ debugging experience, which cannot achieve the optimal performance of hybrid power system.
The optimization-based EMS is to solve the problem of the optimal control sequence at a given optimization goal through various optimization algorithms, and it can be classified into offline global optimization algorithm and online instantaneous optimization algorithm. Global optimization algorithms include dynamic optimization and static optimization. Dynamic programming (DP) [7,8] and Pontryagin’s minimum principle (PMP) [9,10] are the two most representative dynamic global optimization algorithms. Based on the Bellman principle, DP transforms multi-stage decision problems into a series of single-stage problems, and finds the optimal control sequence one by one. Based on the variational method, PMP transforms global optimization problems into local optimization problems, and the calculation speed is faster than DP. The above two dynamic global optimization algorithms can obtain theoretical optimal control sequence under the premise of known driving condition information, but the calculation amount is large and cannot be applied to real vehicle controller. As a result, the fuel economy obtained by the global optimal algorithm usually may be used as a benchmark for other EMS. At the same time, the optimization rules extracted from global optimal algorithm can be applied to other EMS for further improvement of fuel economy [11]. The static global optimization algorithms generally find optimal solution by iterative method, including particle swarm optimization (PSO) [12], genetic algorithm (GA) [13], and so on. Like dynamic optimization algorithms, static optimization algorithms are sensitive to driving conditions. Hence, driving condition recognition (DCR) is also necessary for improving the adaptability of this kind of algorithm.
Equivalent consumption minimization strategy (ECMS) is a well-known real-time optimization algorithm which has the potential of engineering applications [14,15]. ECMS converts the electric consumption into the equivalent fuel consumption by introducing equivalent factor (EF), and obtains optimal candidates via minimizing the total fuel consumption. Therefore, EF is the significant factor which determines optimization performance of ECMS, many scholars have made great efforts to obtain exact EF. In traditional ECMS, a fixed EF was often adopted under the specific driving condition [16], and some optimization algorithms were employed to optimize the EF under predefined driving condition, involving improved shooting algorithm [17], DP [18] and GA [19]. In view of sensitivity of EF to driving condition, adaptive ECMS (A-ECMS) was introduced to further improve the performance of ECMS under real driving condition. Yang et al. [20] proposed a novel A-ECMS comprising offline optimization and online optimization, offline optimization algorithm was used to obtain the optimal EF with different initial SOC by PSO while online optimization algorithm adjust EF according to 2D look-up table acquired from above offline optimization result. Lei et al. [21] designed a fuzzy PI controller to regulate EF according to SOC reference resolved by DP, based on initial optimized EF with different initial SOC and distance through GA. Apart from the dynamic adjustment of EF, some scholars also focus on DCR. K-means clustering was widely used to classify driving condition whilst machine learning algorithms were employed to perform DCR [22,23].
1.2. Motivation
Despite that the energy management strategies discussed above have been proved to be effective in certain conditions, ECMS has attracted extensive attentions from both the academia and the industry due to its real-time. The accuracy and adaptivity of EF for ECMS remains to be optimized to control energy flow better. The motivation of this paper includes two main aspects. On one hand, for hybrid heavy-duty truck, inappropriate vehicle speed threshold for engine start-up and charge-sustainability of the battery will cause unnecessary fuel consumption, therefore, battery state of charge (SOC) and engine state should be considered. On the other hand, EF is affected by driving conditions, EF should vary in accordance with actual driving conditions, DCR algorithm should be studied. This paper tries to improve the control performance and real-time of ECMS by integrating the above two aspects, which makes this paper different from the previous contribution.
1.3. Contributions
The primary purpose of this paper is to propose a novel A-ECMS by combining DCR and optimization of three key factors for improving control performance of ECMS. Three main contributions have been made in this paper. (1) Based on driving cycles for heavy-duty vehicles applied in China and other countries, the typical sample database of driving cycles for heavy-duty truck is constructed by a hierarchical clustering algorithm, and a neural network is presented to recognize the above typical driving cycles, in preparation for incorporating driving conditions into ECMS. (2) Considering the effect of EF, battery SOC, and engine state on the control performance of ECMS, PSO is applied to optimize EF, scale factor of penalty function, and vehicle speed threshold for engine start-up simultaneously. (3) A novel A-ECMS composed of key parameters optimization and DCR is proposed, the A-ECMS can achieve better fuel economy as well as keeping battery SOC fluctuate more smoothly.
1.4. Outline
This paper is organized as follows. The Section 2introduces the structure and system model of hybrid heavy-duty truck which is the basis of subsequent simulation. The Section 3 describes driving cycle generations based on hierarchical clustering algorithm and DCR derived from neural network. Section 4 conducts the optimization of three key parameters for ECMS by PSO. A novel A-ECMS combining above DCR and parameter optimization is presented in the Section 5. Conclusions are given in the sixth section.
2. Powertrain Structure and System Model
The heavy-duty truck investigated in this paper is a P2 hybrid powertrain configuration shown in Figure 1. The specifications of the hybrid heavy-duty truck are listed in Table 1.
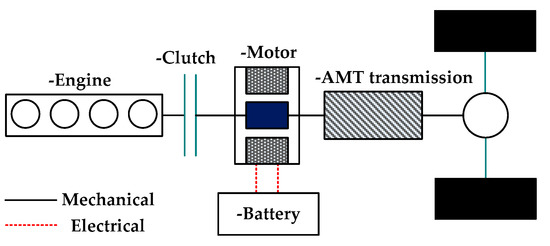
Figure 1.
Structure of P2 hybrid heavy-duty truck.

Table 1.
Vehicle specifications.
2.1. Vehicle Model Based on AMESim
Simulation plays an important role in the verification and adjustment of energy management strategies for HEVs. An accurate vehicle model is the basis for simulations. Based on AMESim, a quasi-static backward simulation model of hybrid heavy-duty vehicle is established using a combination of theoretical modeling and experimental modeling. The modeling process of key components is described below.
2.1.1. Engine Model
The energy management strategy of hybrid heavy-duty vehicle is concerned with engine fuel consumption, thus transient characteristics of the engine is not the research focus of this paper. A quasi-static engine model is established by a look-up table based on experimental data from bench test. The engine fuel consumption contour map and engine maximum torque curve are shown in Figure 2. The engine fuel consumption rate is usually described as a function of engine speed and torque, as shown in Equation (1).
where and denote the engine torque and engine rotational speed respectively, and is the brake-specific fuel consumption (BSFC) in g/kWh.
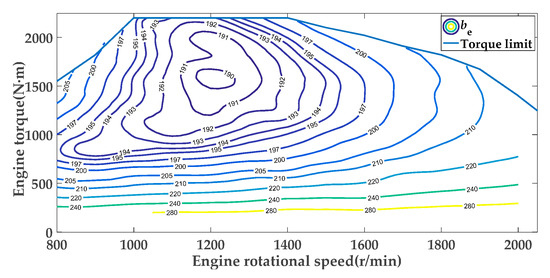
Figure 2.
Fuel consumption contour map of the engine.
2.1.2. Motor Model
The electric motor is a permanent magnet synchronous motor (PMSM) in this paper. Similar to the engine model, the dynamic characteristics of the PMSM are also neglected here, and a quasi-static PMSM model is obtained based on the PMSM efficiency map derived from bench test data. The efficiency map and external characteristic curve of PMSM are presented in Figure 3. The PMSM efficiency can be expressed as Equation (2), which is a function of torque and speed.
where is the efficiency of the motor, is the angular velocity of the motor in rad/s, is the rotation speed of the motor in r/min, is the desired torque of the motor, is the maximum output torque of the motor at the current speed when the motor operates as a traction motor, is the maximum output torque of the motor at the current speed when the motor operates as a generator, and is the terminal battery power in kW.
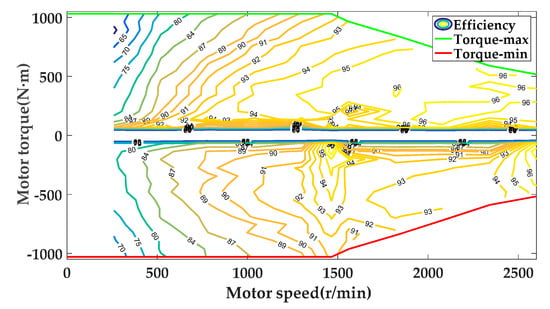
Figure 3.
Motor efficiency map
2.1.3. Battery Model
The battery is a complex nonlinear system which may be influenced by temperature, voltage, internal resistance and state of charge (SOC), thus it is difficult to establish a battery model with high accuracy. For the study of energy management strategy, complicated battery model is neither essential nor practical, a simplified control-oriented model with adequate accuracy is adopted in this paper. Rint model, RC model, Thevenin model, and PNGV model are four categories of simplified battery model that have been widely employed in the area of energy management. The Rint model is used in this paper due to its acceptable precision and simplicity. The Rint model is an internal resistance model based on experimental data, which consists of an ideal voltage source and an internal resistor consisted in series. The current and SOC of the battery can be formulated as follows:
where is the battery open circuit voltage; is the battery internal resistance; is the battery current; denotes the battery power; and are the battery initial SOC and battery capacity, respectively.
2.1.4. Vehicle Longitudinal Dynamic Model
Given that the fuel economy is mainly associated with longitudinal motion of the vehicle, only longitudinal dynamics are considered in this paper, without involving vertical dynamics and lateral dynamics of the vehicle. It is assumed that the vehicle operates on a horizontal road, the longitudinal dynamics model can be described as Equation (7).
where m is the mass; is the rolling resistance coefficient; is the rotating mass coefficient; is the air density; is the wind resistance coefficient; A is the frontal area; a is the acceleration; v is the vehicle speed; is the wheel radius.
The relationship between wheel driving torque and coupling torque produced by the engine and motor can be expressed by Equation (8).
where is the total transmission ratio of the transmission and the final drive, is the transmission efficiency, and is the total required torque of the engine and motor.
3. DCR of Hybrid Heavy-Duty Vehicle Based on Neural Network
3.1. Construction of Typical Sample Database of Driving Cycles
Constructing a typical sample database of driving cycles is the basis of improve robustness of ECMS for hybrid heavy-duty truck. This paper presents a novel design method of driving cycles. First, the driving cycles for heavy-duty truck applied by China and other countries in Table 2 are chosen as sample database of driving cycle, which covers different driving scenarios including urban, suburban and highway. Second, in order to decrease the types and difficulty of DCR, clustering analysis is utilized to classify above sample database of driving cycles by selecting appropriate characteristic parameters. Maximum speed, average speed, average operating speed, maximum acceleration, minimum acceleration, average acceleration of acceleration segment, average deceleration of deceleration segment, acceleration proportion, deceleration proportion, parking proportion, uniform proportion, and relative positive acceleration are chosen as characteristic parameters in this paper.
Table 2.
Sample database of driving cycles for hybrid heavy-duty truck.
The effectiveness of above 12 characteristic parameters are verified by a significance test called Kruskal-Wallis test [24]. Before carrying out the Kruskal–Wallis test, enough samples are necessary for it. There are only ten driving cycles in sample database of driving cycles, the samples are too small when single driving cycle is selected as the sample. Therefore, driving samples are generated by truncating randomly from above standard driving cycle in Table 2 to enlarge sample database in this paper. Based on the driving cycles in Table 2, 200 new short driving cycles are generated randomly for each driving cycle in Table 2. The generation of driving samples can be stated as follow. Given a long driving cycle of length n. Firstly, a starting position is selected randomly.
Then, the truncated segment will be
where t is driving period. When the driving period of HEV approaches or exceeds three minutes, it can reflect the characteristic of current driving condition [25]. As a result, the length of each sample is defined as 200 s. 200 samples under each standard driving cycle in Table 2 are generated by repeating the method for the Kruskal-Wallis test. Taking the average speed for an example, the significance test can be stated as follow.
Step 1: State the hypotheses.
The Null Hypothesis 1 ()
The distribution of the average speed samples coming from multiple driving cycles has no significant difference.
The Alternative Hypothesis ()
The distribution of the average speed samples coming from multiple driving cycles has significant difference.
Step 2: Calculate the test statistic.
where N is the total number of values in all samples; k is the number of sample groups; is the number of values contained in the ith sample; is the sum of ranks in ith sample.
Step 3: Calculate the result. The significance level in this paper is 0.05. The p-value corresponds to the test statistic, which turns out to be 1.1×10−290. Since the p-value is less than 0.05, the null hypothesis is rejected and the distribution of the average speed samples coming from multiple driving cycles has significant difference.
Also, the box plots of average speed for each sample is shown in Figure 4. The middle line of a box indicates the median of sample data under every driving cycle, as well as revealing significant differences of average speed under different driving cycle, while the upper edge and the lower edge of a box indicate the upper quartile and the lower quartile respectively. The significance test of other characteristic parameters can also be conducted by Kruskal–Wallis test like above average speed, and the p-value of other characteristic parameters is far less than 0.05, indicating that the characteristic parameters selected in this paper have significant differences under different driving cycles and can be used to represent the driving cycle.
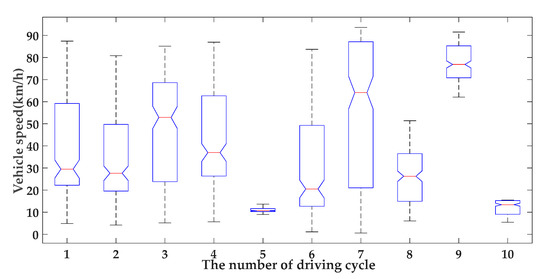
Figure 4.
Box diagram of average speed in Kruskal-Wallis test.
Misclassification will happen when a single driving cycle is identified together with a composite one, therefore it is necessary to divide composite driving cycles in sample database of driving cycles into a single driving cycle by construction method and components specified by China automotive test cycle–Part 2: Heavy-duty commercial vehicles (GB/T 38146.2-2019), and fuel consumption test methods for heavy-duty commercial vehicles (GB/T 27840-2011). The updated sample database of driving cycles is shown in Table 3. The hierarchical clustering analysis is used to cluster the sample database of driving cycles, and the process of hierarchical clustering analysis can be shown in Figure 5. First, the 12 characteristic parameters of each driving cycle are transformed to no-dimensional forms by Z-score standardized method. Then, the similarity among different driving cycles is characterized by angle cosine distance. As a result, the sample database of driving cycles is categorized into six types by angle cosine distance as presented in Table 4. Taking China automotive test cycle for heavy-duty commercial vehicles as priority principle, six driving cycles are chosen as representative of typical driving cycles to form each of the above six types, respectively. The curves of six typical driving cycles are shown in Figure 6.
Table 3.
Updated sample database of driving cycles for hybrid heavy-duty truck.
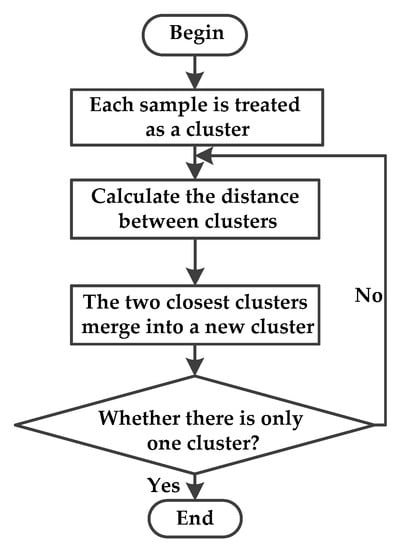
Figure 5.
The process of the hierarchical clustering analysis.
Table 4.
Six types for sample data of driving cycles.

Figure 6.
Curves of six typical driving cycle.
3.2. Algorithm Design of DCR Base on Neural Network
Based on above clustering analysis result, back propagation (BP) neural network is adopted to design driving condition recognizer. The on-line recognition process of driving conditions is illustrated in Figure 7.
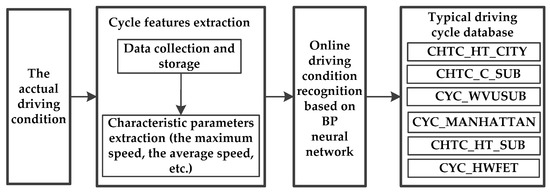
Figure 7.
On-line recognition process of driving conditions.
The neural network structure is composed of input layer with 12 neurons denoting 12 characteristics mentioned above, hidden layer with 10 neurons and output layer with 6 neurons denoting six typical driving cycles. The maximum number of iterations is 100. Further, seventy percent of sample data is used for learning and training, fifteen percent of sample data is used to validate, and remaining fifteen percent of sample data is used to test. And the training result is shown in Figure 8. After 88 iterations, the error is reduced to less than 0.0018 and the neural network can be used to identify the driving conditions online.
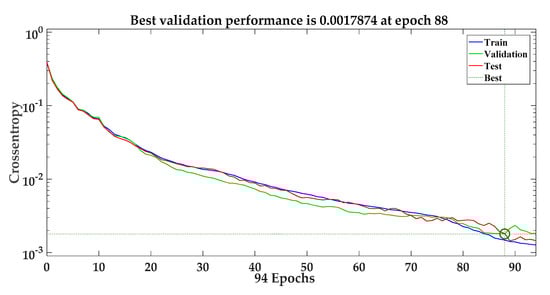
Figure 8.
Training process of the BP neural network.
Based on the assumption that driving conditions will not change suddenly in a short period of time, on-line recognition of driving conditions predicts driving condition for the foreseeable future by extracting information from driving condition in the past. The principle of on-line recognition is shown in Figure 9. Sampling period and prediction period are the two most important parameters for on-line recognition process. The recognition accuracy is determined by BP neural network error, the recognition accuracy is high when the error is low. According to the relation between sampling period and recognition accuracy as shown in Figure 10, the maximum recognition accuracy is 99.99% when sampling period is 275 s. However, the amount of computations will increase while the sampling period is set to larger. When the sampling period is 200 s, there is a turning point. Based on this, sampling period is set to 200 s and recognition accuracy is 99.7% in this paper. The prediction period can be set to 1 s, 3 s, 5 s, 10 s, 15 s, 20 s, and so on, the length of prediction period will influence on-line recognition accuracy. By a novel method of determining prediction period proposed by He [26], the relation between prediction period and on-line recognition accuracy can be found in Figure 11. According to Figure 11, the prediction period is set to 5 s considering both computation time and recognition accuracy.
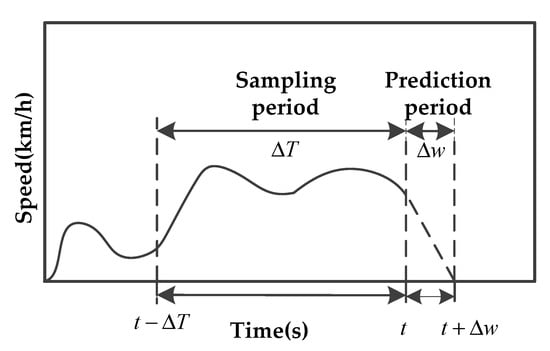
Figure 9.
The principle of on-line recognition.
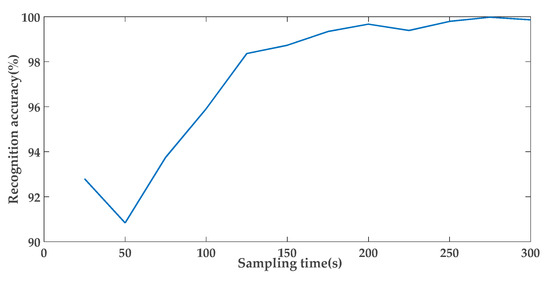
Figure 10.
The relation between sampling period and recognition accuracy.
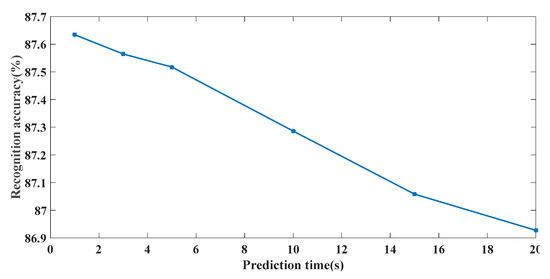
Figure 11.
The relation between prediction period and recognition accuracy.
In this paper, the test driving condition is a composite driving cycle composed of ‘CHTC_HT_CITY + CHTC_HT_SUB + CYC_WVUSUB + CYC_MANHATTAN+CHTC_C_SUB + CYC_HWFET’, the recognition result of test driving condition with an recognition accuracy of 86.8% is shown in Figure 12 below.
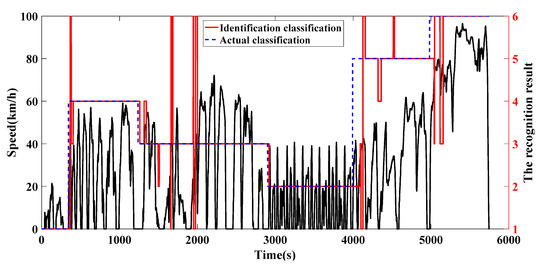
Figure 12.
The recognition result of test driving condition.
4. Key Parameter Optimization of ECMS Based on PSO
4.1. Principles of ECMS
The key function of ECMS is given by Equation (12):
where denotes total fuel consumption; denotes instantaneous fuel consumption of the engine; denotes equivalent fuel consumption of the battery as expressed in Equation (13).
where denotes lower heating value of the fuel; denotes battery power; and are discharge efficiency and charge efficiency of the battery, respectively; denotes EF.
A penalty function is used to keep battery charge-sustainability as shown in Equation (14).
where is target value of battery SOC, which is 50% in this paper; is scale factor of penalty function. As a result, the key function of ECMS can be determined as Equation (15).
Considering normal operation range of the powertrain, constraint conditions are given by (16).
where and denote engine maximum torque and engine minimum torque, respectively; and denote engine maximum speed and engine minimum speed, respectively; and are motor maximum torque and motor minimum torque, respectively; and are motor maximum speed and motor minimum speed, respectively; and are battery maximum SOC and battery minimum SOC, respectively.
According to the principle of ECMS shown in Figure 13 and key functions of ECMS, EF, scale factor of penalty function, and vehicle speed threshold for engine start-up are the three most parameters affecting control performance of ECMS, which should be optimized for further improvement of ECMS.
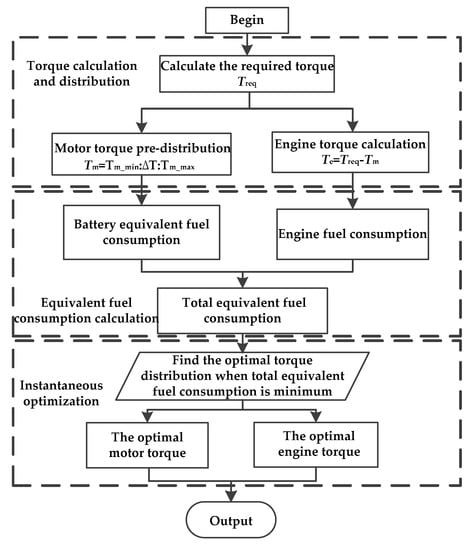
Figure 13.
The principle of ECMS.
4.2. Parameter Optimization of ECMS Based on PSO
In this paper, PSO is introduced to optimize above three key parameters. The optimization process of PSO based on co-simulation platform combined with AMESim and Matlab/Simulink (R2016a, MathWorks, Natick, MA, USA) is shown in Figure 14.
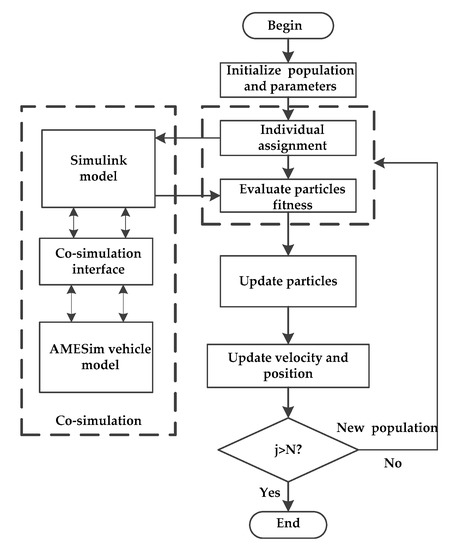
Figure 14.
The optimization process of PSO based on co-simulation platform.
Considering the SOC balance and engine state, state variables and fitness function are regarded as Equation (17) during the optimization process.
where , and respectively represent EF, scale factor of penalty function, and vehicle speed threshold for engine start-up; is terminated SOC; f(x) denotes fitness function; is the weighting factor, which decides the SOC penalty term.
Based on the co-simulation platform, the three key parameters of ECMS are optimized under CHTC_HT, C_WTVC, combined driving cycle of CHTC_HT and C_WTVC. The simulation results are illustrated in Figure 15. The specific optimization results for above three driving cycle can be found in Table 5.
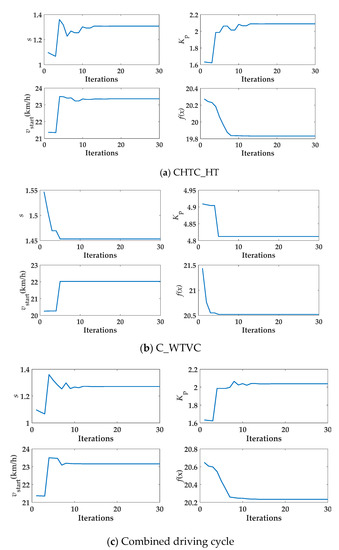
Figure 15.
The parameter optimization results of ECMS under various driving cycles.
Table 5.
The optimal parameters of ECMS under three driving cycles.
4.3. The Simulation and Discussion of PSO-ECMS
The flow chart of PSO-ECMS is shown in Figure 16, which can be divided into offline part and online part. Firstly, the PSO is used to optimize EF, scale factor of penalty function, and vehicle speed threshold for engine start-up offline under specific driving cycle. Secondly, parameter optimization results are applied to real-time ECMS. Finally, optimal torque distribution is solved by ECMS.
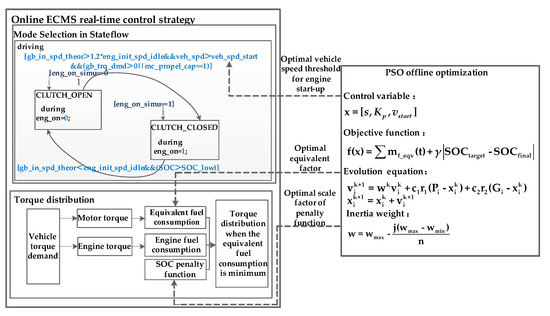
Figure 16.
The flow chart of PSO-ECMS.
In order to verify the effectiveness of proposed PSO-ECMS, the simulation analysis is carried out based on co-simulation platform under the CHTC_HT, C_WTVC and combined driving cycle respectively. The initial SOC is set to 50%, and the simulation results are illustrated in Figure 17 and Figure 18. Figure 17 shows that actual vehicle speed can keep track of target vehicle speed under combined driving cycle. Figure 18 show that PSO-ECMS can reasonably allocate engine torque and motor torque under various driving cycles, as well as ensuring that initial SOC and terminated SOC are equal within the limits of the vehicle’s components.
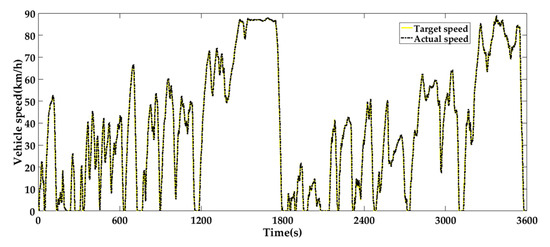
Figure 17.
The actual speed and target speed under combined driving cycle.
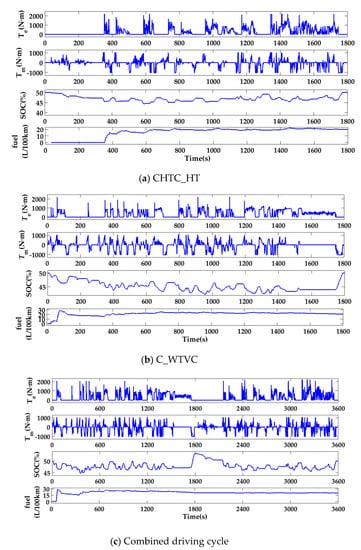
Figure 18.
State change of main components under various driving cycle.
5. A-ECMS Based on DCR and Key Parameter Optimization
5.1. The Principle of A Novel A-ECMS
Combing above DCR and key parameter optimization of ECMS, a novel A-ECMS is presented in this paper. The principle of proposed A-ECMS is shown in Figure 19. Firstly, the PSO is used to solve optimal parameters of EF, scale factor of penalty function, and vehicle speed threshold for engine start-up under six typical driving cycles. The results are shown in Table 6 below. Secondly, actual driving conditions will be categorized as one of six typical driving cycles by applying a driving condition recognizer based on the BP neural network, and the identification results are one of six typical driving cycle. Then the corresponding three optimal parameters of ECMS are determined according to recognized driving condition. Finally, the optimal torque distribution of hybrid heavy-duty truck can be obtained by ECMS under actual driving conditions.
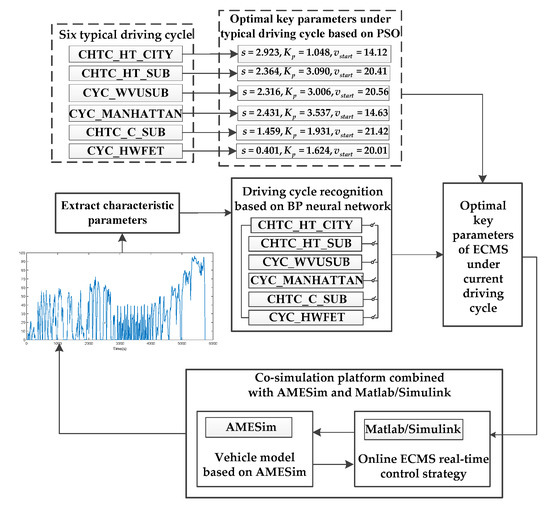
Figure 19.
The principle of proposed A-ECMS.
Table 6.
Three kinds of optimal parameters for ECMS under six typical driving cycles.
5.2. Comparison Analysis
The PSO-ECMS combines the PSO with the original ECMS introduced in the fourth section, which will determine the key parameters of ECMS. The A-ECMS combined the key parameters optimization and the DCR introduced in the fifth section, which will adapt to the real driving condition. Based on co-simulation platform, comparison analysis is performed between PSO-ECMS and A-ECMS under composite driving cycle composed of six typical driving cycles. The three key parameters of PSO-ECMS under the composite cycle can be attained according to Figure 16, and the equivalent factor, scale factor of penalty function, and vehicle speed threshold for engine start-up are 2.001, 2.738, and 20.096, respectively. The three key parameters of A-ECMS vary with the current driving conditions which can adapt to the composite cycle, as shown in Table 6, and the specific process can be attained in Figure 19. The simulation results are as follows.
Figure 20 demonstrates that A-ECMS can keep battery SOC stable around 50% without large fluctuations compared with PSO-ECMS. Moreover, due to the lack of historical information, the same SOC are obtained at the beginning 200 s of composite driving cycle for A-ECMS and PSO-ECMS. CHTC_HT_CITY is a kind of urban driving cycle and the vehicle speed is relatively low, thus battery SOC begins to slow down with motor-only drive mode at the begin. Battery SOC begins to rise when the truck runs under CHTC_HT_SUB. During CYC_MANHATTAN, the truck controlled by PSO-ECMS tends to work in motor-only drive mode, resulting in a large drop of battery SOC. However, A-ECMS has optimal key parameters of ECMS under the current driving cycle, so the battery SOC of the truck controlled by A-ECMS can be stable near target SOC of the battery and fluctuate more smoothly.
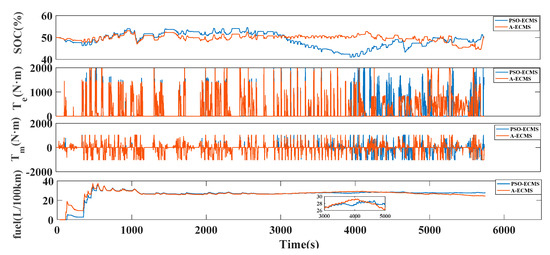
Figure 20.
The simulation results of PSO-ECMS and A-ECMS under composite cycle.
Due to variable key parameters of A-ECMS, the engine state and motor state controlled by A-ECMS are different from that controlled by PSO-ECMS. Taking the time range of 3000 s–4000 s for an example, A-ECMS tends to make the truck work in engine drive mode while PSO-ECMS tends to make the truck work in motor-only drive mode, leading to different fuel consumption of the truck as illustrated in Figure 20. The comparison of fuel consumption for hybrid heavy-duty truck under ECMS, PSO-ECMS and A-ECMS are shown in Table 7, indicating the great potential of A-ECMS in terms of energy saving.
Table 7.
Fuel consumption of hybrid heavy-duty vehicle under ECMS, PSO-ECMS and A-ECMS.
5.3. Discussion
In order to further verify the effectiveness and adaptivity of proposed A-ECMS, a verification driving cycle composed of ‘C_WTVC + CYC_UDDSHDV + CYC_WVUINTER’ is presented, which has not been trained by the BP neural network. For the verification driving cycle, the recognition result is shown in Figure 21, and the recognition accuracy of driving condition is 80.1%. Figure 21 shows that a majority of driving conditions can be recognized as one of six typical driving cycles, indicating the effectiveness of DCR for unknown driving conditions. The results of PSO-ECMS and A-ECMS under the verification driving cycle are shown in Figure 22. The fuel consumption of A-ECMS is 21.92 L/100 km with an improvement of 12.9%, compared to PSO-ECMS with the fuel consumption of 25.19 L/100 km.
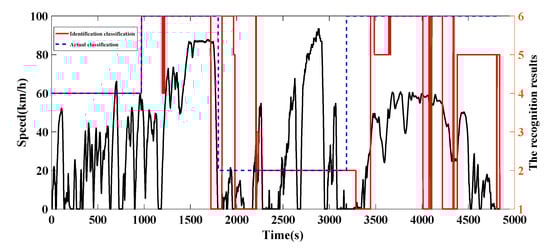
Figure 21.
The recognition result of the verification driving cycle.
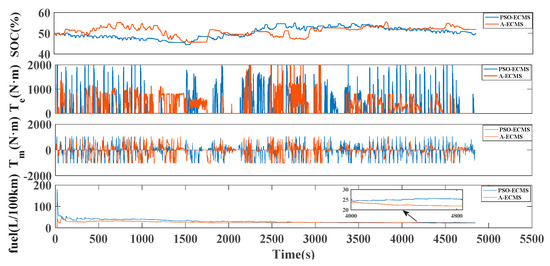
Figure 22.
The simulation results of PSO-ECMS and A-ECMS under verification driving cycle.
6. Conclusions
In this paper, a novel A-ECMS for hybrid heavy-duty truck is proposed based on DCR and key parameter optimization of ECMS. The industrial and academic contributions of this paper can be summarized as follows: (1) Six kinds of typical driving cycle are obtained by hierarchical clustering analysis, and the neural network recognizer of driving condition has been developed on this basis, simulation results indicate that real driving condition can be accurately recognized with an accuracy of 86.8%. (2) PSO is applied to optimize three key parameters of ECMS under different driving cycles, including equivalent factor, scale factor of penalty function, and vehicle speed threshold for engine start-up, and the effectiveness of PSO is verified through simulation analysis under three different driving cycles based on co-simulation platform with AMESim and Matlab/Simulink. (3) A-ECMS combining driving condition recognition and PSO has been presented. The simulation results under composite driving cycle show that proposed A-ECMS and PSO-ECMS can achieve fuel economy improvement of 14.81% and 3.05%, respectively, compared to ECMS. The next step is to conduct hardware-in-the-loop test and real vehicle test validation of proposed strategy, as well as improving control performance further. The effect of driving style and driving behavior on A-ECMS will be considered in a future study. Furthermore, the recognition accuracy of driving conditions is no more than 90%, so improving the accuracy of DCR is another difficult task for us in the future.
Author Contributions
Conceptualization, P.Z.; Methodology, P.Z.; Software, X.W.; Validation, C.D. and H.X.; Formal analysis, P.Z.; Investigation, X.W.; Resources, C.D.; Data curation, X.W. and H.W.; Writing—original draft preparation, P.Z. and X.W.; Writing—review and editing, P.Z., C.D., and H.X.; Visualization, X.W.; Supervision, C.D.; Project administration, P.Z.; Funding acquisition, C.D. and H.W. All authors have read and agreed to the published version of the manuscript.
Funding
This research was funded by National Key Research and Development Program of China under Grant 2017YFB0103900 and the Natural Science Foundation of China under Grant 51775393.
Conflicts of Interest
The authors declare no conflict of interest.
References
- Zhao, Y.; Onat, N.C.; Kucukvar, M.; Tatari, O. Carbon and energy footprints of electric delivery trucks: A hybrid multi-regional input-output life cycle assessment. Trans. Res. D-Transp. Environ. 2016, 47, 195–207. [Google Scholar] [CrossRef]
- Quiros, D.C.; Smith, J.; Thiruvengadam, A.; Huai, T.; Hu, S. Greenhouse gas emissions from heavy-duty natural gas, hybrid, and conventional diesel on-road trucks during freight transport. Atmos. Environ. 2017, 168, 36–45. [Google Scholar] [CrossRef]
- Feng, Y.; Dong, Z. Optimal energy management with balanced fuel economy and battery life for large hybrid electric mining truck. J. Power Sources 2020, 454, 227948. [Google Scholar] [CrossRef]
- Xu, C.; Guo, K.; Yang, F. A Comparative study of different hybrid electric powertrain architectures for heavy-duty truck. IFAC-Pap. OnLine 2018, 51, 746–753. [Google Scholar] [CrossRef]
- Sorrentino, M.; Rizzoni, G.; Arsie, I. Analysis of a rule-based control strategy for on-board energy management of series hybrid vehicles. Control Eng. Pract. 2011, 19, 1433–1441. [Google Scholar] [CrossRef]
- Liu, Y.; Gao, J.; Qin, D.; Zhang, Y.; Lei, Z. Rule-corrected energy management strategy for hybrid electric vehicles based on operation-mode prediction. J. Clean. Prod. 2018, 188, 796–806. [Google Scholar] [CrossRef]
- Engbroks, L.; Görke, D.; Schmiedler, S.; Strenkert, J.; Geringer, B. Applying forward dynamic programming to combined energy and thermal management optimization of hybrid electric vehicles. IFAC-Pap. OnLine 2018, 51, 383–389. [Google Scholar] [CrossRef]
- Zhou, W.; Yang, L.; Cai, Y.; Ying, T. Dynamic programming for new energy vehicles based on their work modes part I: Electric vehicles and hybrid electric vehicles. J. Power Sources 2018, 406, 151–166. [Google Scholar] [CrossRef]
- Schmid, R.; Bürger, J.; Bajcinca, N. A comparison of PMP-based energy management strategies for Plug-in-hybrid electric vehicles. IFAC-Pap. OnLine 2019, 52, 592–597. [Google Scholar] [CrossRef]
- Ou, K.; Yuan, W.; Choi, M.; Yang, S.; Jung, S.; Kim, Y. Optimized power management based on adaptive-PMP algorithm for a stationary PEM fuel cell/battery hybrid system. Int. J. Hydrogen Energ. 2018, 43, 15433–15444. [Google Scholar] [CrossRef]
- Peng, J.; He, H.; Xiong, R. Rule based energy management strategy for a series–parallel plug-in hybrid electric bus optimized by dynamic programming. Appl. Energy 2017, 185, 1633–1643. [Google Scholar] [CrossRef]
- Chen, S.; Hung, Y.; Wu, C.; Huang, S. Optimal energy management of a hybrid electric powertrain system using improved particle swarm optimization. Appl. Energy 2015, 160, 132–145. [Google Scholar] [CrossRef]
- Chen, Z.; Mi, C.C.; Xiong, R.; Xu, J.; You, C. Energy management of a power-split plug-in hybrid electric vehicle based on genetic algorithm and quadratic programming. J. Power Sources 2014, 248, 416–426. [Google Scholar] [CrossRef]
- Ju, F.; Zhuang, W.; Wang, L.; Zhang, Z. Optimal sizing and adaptive energy management of a novel four-wheel-drive hybrid powertrain. Energy 2019, 187, 116008. [Google Scholar] [CrossRef]
- Payri, F.; Guardiola, C.; Pla, B.; Blanco-Rodriguez, D. On a stochastic approach of the ECMS method for energy management in hybrid electric vehicles. IFAC Proc. Vol. 2012, 45, 341–348. [Google Scholar] [CrossRef]
- Simmons, K.; Guezennec, Y.; Onori, S. Modeling and energy management control design for a fuel cell hybrid passenger bus. J. Power Sources 2014, 246, 736–746. [Google Scholar] [CrossRef]
- Yang, Y.; Zhang, Y.; Tian, J.; Li, T. Adaptive real-time optimal energy management strategy for extender range electric vehicle. Energy 2020, 197, 117237. [Google Scholar] [CrossRef]
- Han, J.; Parkand, Y.; Kum, D. Optimal adaptation of equivalent factor of equivalent consumption minimization strategy for fuel cell hybrid electric vehicles under active state inequality constraints. J. Power Sources 2014, 267, 491–502. [Google Scholar] [CrossRef]
- Liu, X.; Qin, D.; Wang, S. Minimum energy management strategy of equivalent fuel consumption of hybrid electric vehicle based on improved global optimization equivalent factor. Energies 2019, 12, 2076. [Google Scholar] [CrossRef]
- Yang, C.; Du, S.; Li, L. Adaptive real-time optimal energy management strategy based on equivalent factors optimization for plug-in hybrid electric vehicle. Appl. Energy 2017, 203, 883–896. [Google Scholar] [CrossRef]
- Lei, Z.; Qin, D.; Hou, L.; Peng, J.; Liu, Y.; Chen, Z. An adaptive equivalent consumption minimization strategy for plug-in hybrid electric vehicles based on traffic information. Energy 2020, 190, 116409. [Google Scholar] [CrossRef]
- Li, S.; Hu, M.; Gong, C.; Zhan, S.; Qin, D. Energy management strategy for hybrid electric vehicle based on driving condition identification using KGA-Means. Energies 2018, 11, 1531. [Google Scholar] [CrossRef]
- Deng, T.; Luo, J.; Han, H.; Wang, M.; Cheng, D. Adaptive energy management strategy based on driving cycle identification for hybrid electric vehicles. J. Xi’an Jiaotong Univ. 2018, 52, 77–83. [Google Scholar] [CrossRef]
- Guo, S.; Zhong, S.; Zhang, A. Privacy-preserving Kruskal–Wallis test. Comput. Methods Programs Biomed. 2013, 112, 135–145. [Google Scholar] [CrossRef]
- Huang, X.; Tan, Y.; He, X. An intelligent multi-feature statistical approach for discrimination of driving conditions of hybrid electric vehicle. In Proceedings of the International Joint Conference on Neural Networks, Atlanta, GA, USA, 14–19 June 2009. [Google Scholar] [CrossRef]
- He, B. Driving Pattern Recognition and Energy Management Strategy Optimization of Hybrid Electric Heavy Truck; Wuhan Technology University: Wuhan, China, 2020. [Google Scholar]
Publisher’s Note: MDPI stays neutral with regard to jurisdictional claims in published maps and institutional affiliations. |
© 2020 by the authors. Licensee MDPI, Basel, Switzerland. This article is an open access article distributed under the terms and conditions of the Creative Commons Attribution (CC BY) license (http://creativecommons.org/licenses/by/4.0/).