Article

Safe and Efficient Polymer Electrolyte Membrane Fuel Cell Control Using Successive Linearization Based Model Predictive Control Validated on Real Vehicle Data

Institut für Mechanik und Mechatronik, Technische Universität Wien, Getreidemarkt 9, 1060 Vienna, Austria
*
Author to whom correspondence should be addressed.
Energies 2020, 13(20), 5353; https://doi.org/10.3390/en13205353
Submission received: 9 September 2020 / Revised: 6 October 2020 / Accepted: 8 October 2020 / Published: 14 October 2020
(This article belongs to the Section A5: Hydrogen Energy)

Abstract

:
In this paper, a polymer electrolyte membrane fuel cell (PEMFC) stack control study is presented. The goal is to track the transient power demand of a real fuel cell (FC) vehicle while ensuring safe and efficient operation. Due to the dynamically changing power demand, fast transients occur in the internal states of the fuel cell (e.g., pressure, humidity, reactant mass) leading to degradation effects (e.g., high/low membrane overpressure, reactants starvation) which are avoided by imposing safety constraints. Efficiency is considered in terms of internal voltage losses minimization as well as minimization of the power of the compressor used to pressurize the cathode. For solving the optimization problem of power demand tracking, adhering to safety constraints, and maximizing efficiency, model predictive control (MPC) has been chosen. Due to the nonlinearity of the FC system, a successive linearization based MPC (SLMPC) is used to control the FC throughout its operating region. Simulation results show that the power demand can be fulfilled while at the same time ensuring safe operation in terms of adhering to constraints and that the minimization of internal voltage losses and compressor power lead to an approximate 9.5% less hydrogen consumption than in the actual reference vehicle.

Graphical Abstract

1. Introduction

In the ongoing world-scale mission of replacing fossil fuels with clean energy, the technology of hydrogen-powered fuel cells (FC) may come as a promising candidate for supplying power in both stationary and automotive applications [1], the latter being in the focus of this work. Quite a few types of fuel cells exist, but the polymer electrolyte membrane fuel cell (PEMFC) seems to be the technology of choice when it comes to automotive application. This is because PEMFCs have a high power density, high efficiency, and fast start-up ability [1]. Obviously, for the fuel cell technology to compete with combustion engines, it must perform at least as good as them. This requirement poses several challenges in terms of FC stack lifetime and safety restrictions [2]. To increase the lifetime of the stack as well as operate it safely, an appropriate control strategy is of crucial importance. Throughout the last years and even decades, the topic of fuel cell control has inspired the work of many scientists and engineers.
Different approaches can be found in literature dealing with the challenge of fuel cell modeling and control. One can reduce the complex problem and control only one subsystem of the fuel cell (e.g., cathode or anode) [3,4,5,6] or examine the whole system [7,8], depending on the problem that needs to be solved. An important and commonly encountered issue that needs to be addressed in fuel cell control is starvation avoidance, usually formulated as imposing a limit on the stoichiometry of hydrogen and/or oxygen [4]. A common way of controlling the fuel cell system is by setting reference values for the cathode/anode pressure, hydrogen/oxygen stoichiometries, voltage, etc. as seen in [4,9,10].
To increase the practical usability of the fuel cell control test results in an automotive application, it is important to conduct the research on a vehicle drive cycle. Much of the research considering power demand tracking done in the past is not based on a vehicle drive cycle, but instead, on a step reference power trajectory generated to demonstrate a certain effect of the control task (e.g., stoichiometry control, pressure constraints, battery/FC interaction, etc.) [11,12].
In the context of this study, the control of the fuel cell subject to a dynamic drive cycle is of much greater practical relevance. Various test scenarios have recently been reported which rely on the New European Driving Cycle (NEDC) as the validation drive cycle for the control of a fuel cell vehicle [13,14,15]. The Worldwide Harmonised Light Vehicles Test Procedure (WLTP) also developed in 2015 has been used as the validation drive cycle for several studies concerning fuel cell control [16,17].
In this work, the power demand measured from a real fuel cell vehicle (The vehicle has been built by AVL List GmbH as part of the Keytech4EV project (no. 855237) funded by the Austrian Research Promotion Agency (FFG).) has been used for validation of the proposed control concept. A simulation study has been conducted on the measured power demand using a nonlinear mass-driven zero-dimensional transient fuel cell model. The control goal is to track the power demand from the acquired data of the real vehicle while ensuring safe operation in terms of starvation avoidance as well as respecting the cathode and anode pressure safety limits along with the pressure difference across the membrane safety limit. Also, efficiency is to be maximized by minimizing the internal voltage drop due to the activation, ohmic, and concentration losses, as well as the power, needed to run the compressor used to provide air for the cathode. To fulfill the goals of power tracking and efficiency maximization, while adhering to the mentioned constraints, the model predictive control (MPC) approach has been chosen which is quite popular in fuel cell control [18,19,20,21,22], mainly because of its ability to handle constraints. A common approach of using MPC is to linearize the system around a steady-state operating point (OP) and use one of the few simple standard formulations of MPC for linear systems. This method works fine for regions relatively close to the OP around which the model has been linearized, but fails if the system operates in a region too far from the OP. The power demand used in the study ranges from 0 to 60 kW so an MPC developed for the system linearized around a single OP would fail to fulfill all the control goals. To cope with the nonlinearity, a successive linearization based MPC (SLMPC) [23,24,25,26] is used meaning that the system is continuously linearized every time step during the simulation and a linear MPC developed for that particular point in the state-space ensuring the validity of the MPC at all times. However, the linearization point is not a steady-state one and the treatment of this is described in Section 4. In terms of PEMFC vehicle control, to the best of the authors’ knowledge, there is no research conducted on a real data drive cycle using successive linearization based model predictive control.
The paper is organized as follows: In Section 2 the zero-dimensional model used for the simulation study is presented. In Section 3 the vehicle description is brought forth while in Section 4 the methodology of the SLMPC is shown. The results consisting of the simulation outcome and its comparison with the data measured from the real vehicle are presented in Section 5. Finally, Section 6 brings the conclusions of this paper along with the direction of future research.

2. Fuel Cell Model

In this section, the FC model used for the control study is presented. The schematics are shown in Figure 1. The focus of the work is not in the model itself, therefore, not all the details will be brought forth, but rather the model structure. For further information on the model equations, the reader is referred to [27].
Modeling assumptions:
  • The operating temperature is assumed constant at a value of 70 °C.
  • The anode is operated in “dead-end” mode, no recirculation is considered in the present model setup.
  • Inlet humidities are assumed to be constant.
  • The effect of liquid water on the voltage is not considered.
The whole system model can be viewed as a collection of submodels describing different parts of the fuel cell:
  • Cathode
  • Anode
  • Gas diffusion layer (GDL) on the cathode side
  • Electrochemical model

2.1. Cathode Submodel

The cathode side of the fuel cell is assumed to be a series of 3 interconnected zero-dimensional (0D) volumes meaning that there is no spatial distribution along or across the channel leading to valuable numerical benefits while maintaining a decent level of accuracy. Air supply coming from the compressor enters the first volume referred to as the cathode supply manifold (sm) and its state is described by the cathode supply manifold pressure ( p s m c a ) which is modeled using the ideal gas law. The second volume is the cathode main manifold. The flow of air from the supply manifold to the cathode main manifold is described using a linearized nozzle equation. In the second volume, the states describing the system are the masses of oxygen, nitrogen, water vapor, and liquid water ( m O 2 c a , m N 2 c a , m v a p c a , m l i q c a ). Finally, the third volume is the cathode exit manifold (em) described by the corresponding cathode exit manifold pressure ( p e m c a ) which leads the exhaust air into the atmosphere. At the end of the exit manifold, there is a backpressure valve. On the cathode side, the actuating variables used by the controller during operation are the mass-flow of air entering the supply manifold ( W i n c a ) and the backpressure valve opening ( α c a ).

2.2. Anode Submodel

Just like the cathode side, the anode is modeled as a series of three interconnected 0D volumes. The states describing the supply and exit manifold of the anode are analogously the supply and exit manifold pressures ( p s m a n and p e m a n ). The anode is supplied by hydrogen coming from a highly pressurized tank. In the main manifold, the states describing the system are the masses of hydrogen, nitrogen, water vapor, and liquid water ( m H 2 a n , m N 2 a n , m v a p a n , m l i q a n ). The valve connecting the exit manifold to the ambient is called the purge valve and it is normally closed during operation leading to a so-called “dead-end anode” operating mode. In real systems, the unused hydrogen is usually recirculated and fed back to the anode inlet. In this simulation study, the anode is modeled as dead-end. The actuating variable on the anode side is the hydrogen mass-flow entering the anode supply manifold ( W i n a n ) whereas the opening of the purge valve ( α p u r g e ) is considered to be a disturbance.

2.3. Gas Diffusion Layer Submodel

In this model, the GDL on the cathode side is viewed as an additional 0D volume containing the masses of oxygen, nitrogen, and water vapor ( m O 2 G D L , m N 2 G D L and m v a p G D L ). The dynamics of the oxygen mass in the GDL is due to the diffusion of oxygen from the cathode, as well as the consumption of oxygen due to the reaction. The nitrogen mass in the GDL changes because of the nitrogen diffusion from the cathode as well as the permeation of nitrogen through the membrane to the anode side. As for the water vapor mass, there is the diffusion from the cathode, water formation from the reaction, membrane water flux (electroosmotic drag and backdiffusion), and water condensation. On the anode side, the GDL proved to be unnecessary to include in the model as hydrogen is very diffusive so the dynamics of the potential hydrogen mass in the GDL could be neglected.

2.4. Electrochemical Model

To couple the thermodynamical part of the model described in the above subsections to the actual output of the system that is of primal interest for this work (voltage and power), an electrochemical model is needed and its implementation is based on [28]. The actuating variable regarding the electrochemical part of the model is the stack current (I).

2.5. Power and Efficiency

The power produced by the fuel cell stack P s t = V I is defined as the product of the stack voltage V and the stack current I. The net system power is then defined as the difference between the stack power, compressor power P c p , and the power of all the other auxiliary components P a u x :
P n e t = P s t P c p P a u x .
As only the compressor power is part of the model and it is the dominant parasitic loss, the power of the other auxiliary components is neglected leading to P a u x = 0 :
P n e t = P s t P c p .
This assumption is justified by the fact that the difference between the measured net power and the net power calculated assuming P a u x = 0 is small, only 3%. Fuel cell efficiency is defined as the ratio between the power produced by the stack P s t and the power of the fuel P H 2 = E 0 N c e l l s I [1]:
η f c = P s t P H 2 = P s t E 0 N c e l l s I = V E 0 N c e l l s
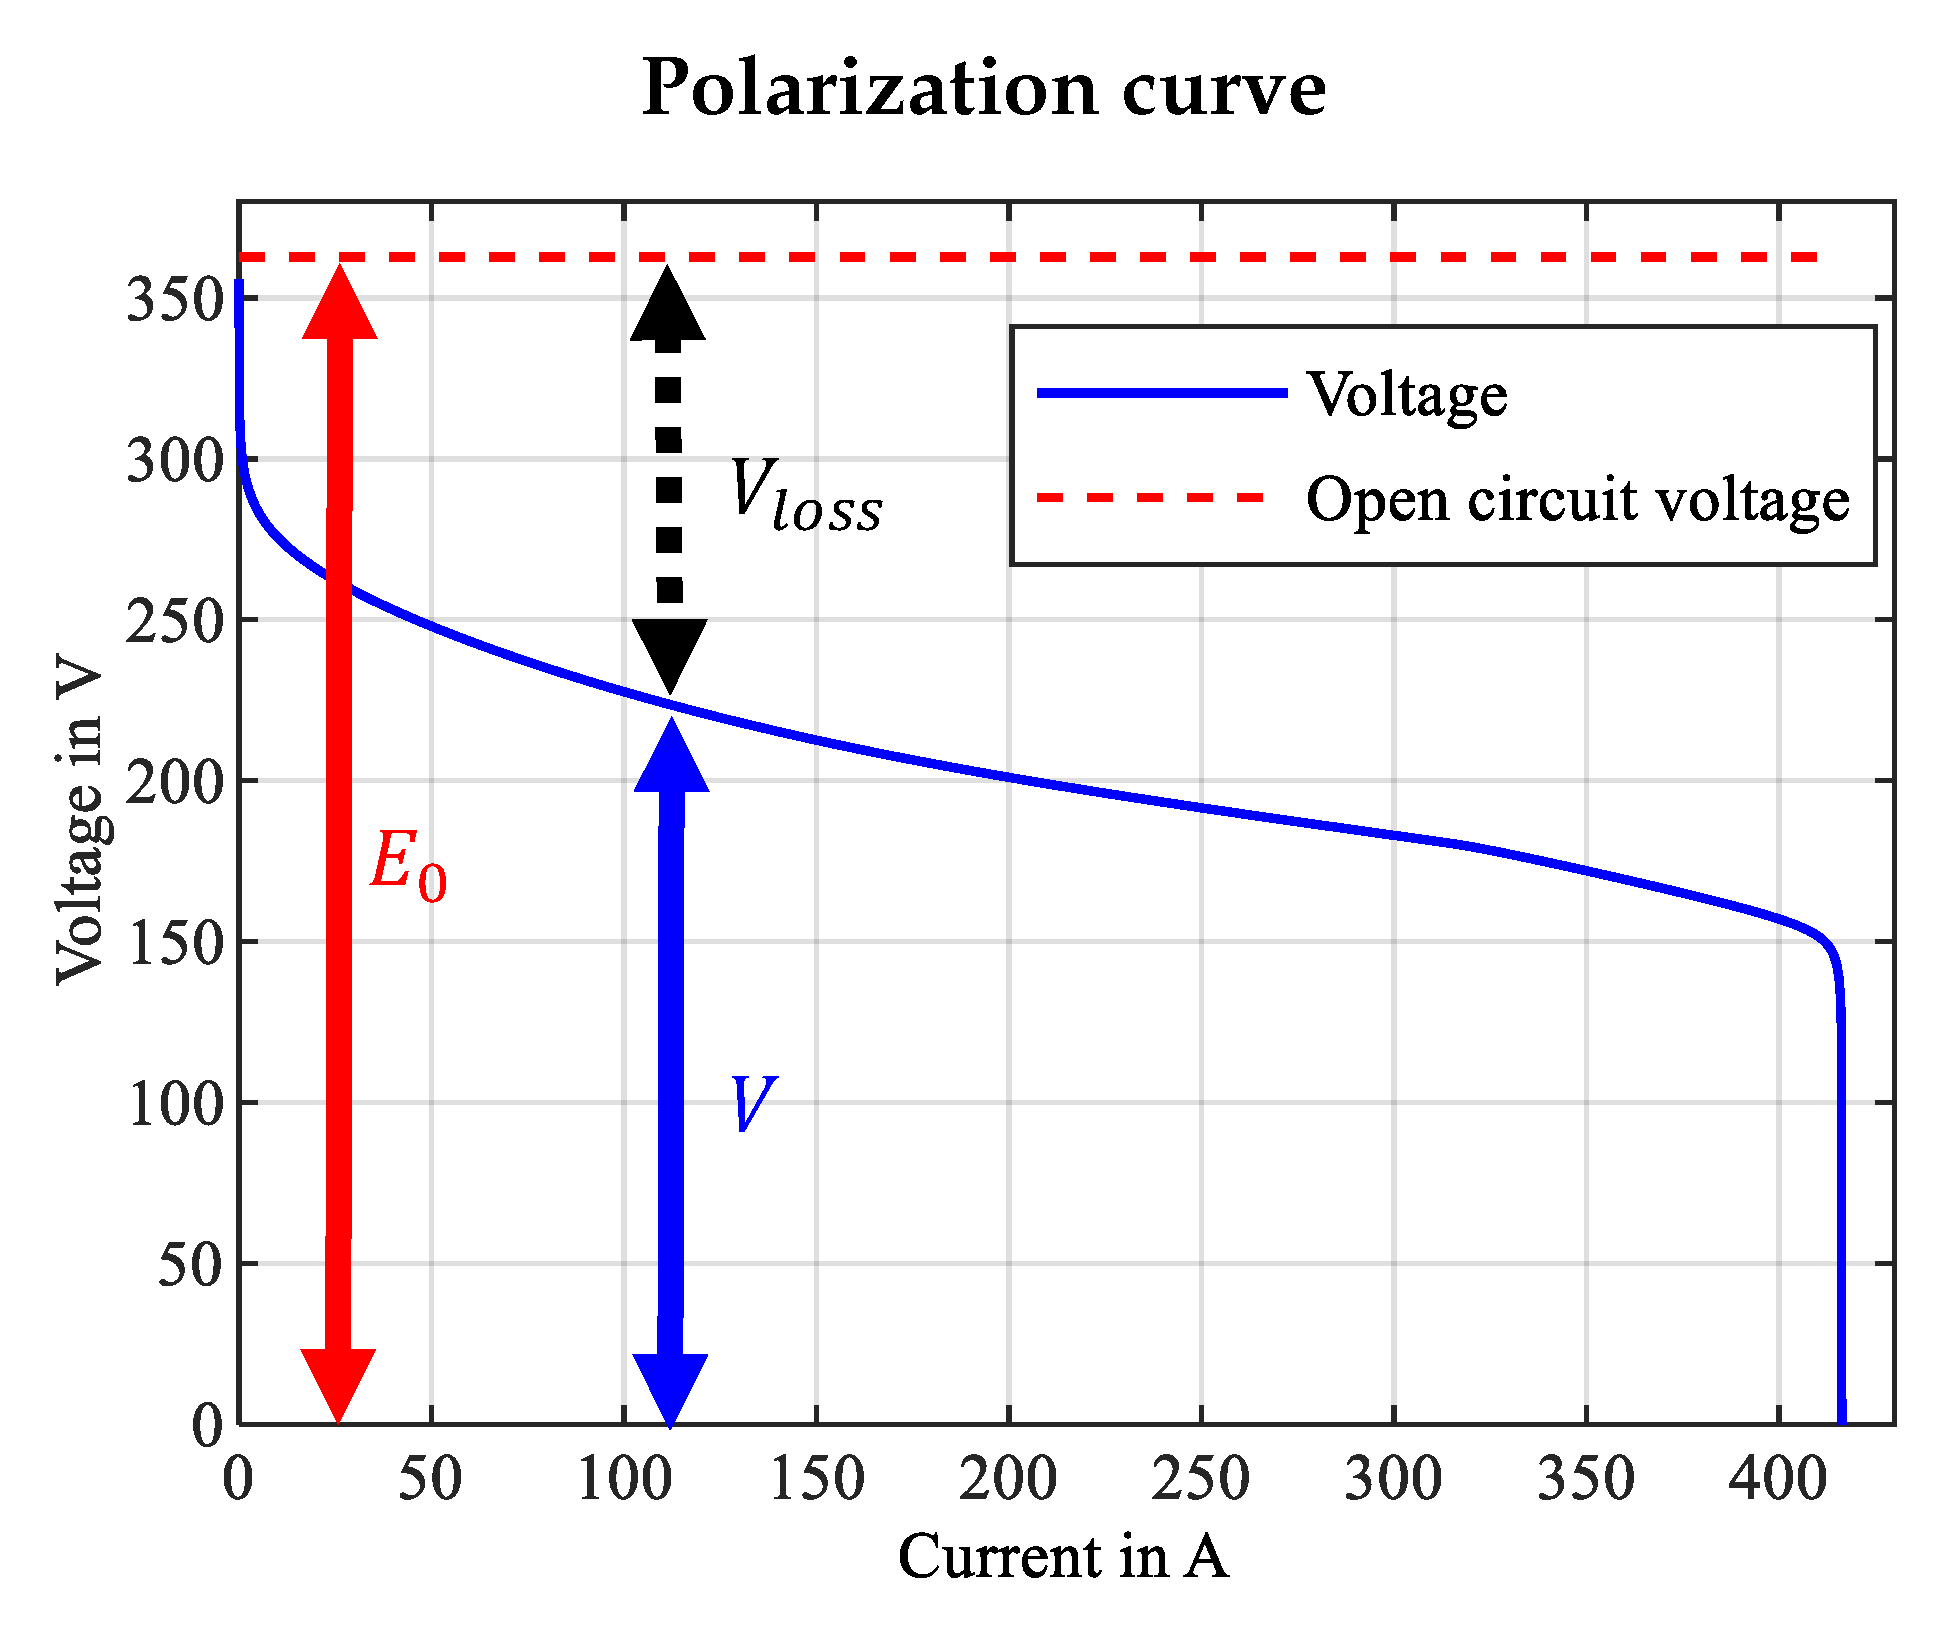
where E 0 is the open-circuit voltage (see Figure 2) and N c e l l s is the number of cells in the stack. However, as the compressor power must be taken into account, it makes sense to define the system efficiency η s y s :
η s y s = P n e t P H 2 = P s t P c p E 0 N c e l l s I = V I P c p E 0 N c e l l s I .

2.6. Overview

Combining all of the above-mentioned submodels in which the dynamics of the states are described using first-order differential equations, one obtains a nonlinear state-space model of the form:
x ˙ = f ( x , u )
y = h ( x , u )
with x being the state vector, u being the input vector and y being the output vector, as defined below:
x = p s m c a m O 2 c a m N 2 c a m v a p c a m l i q c a p e m c a p s m a n m H 2 a n m N 2 a n m v a p a n m l i q a n p e m a n a m , d m O 2 G D L m N 2 G D L m v a p G D L u = W i n c a W i n a n α c a I y = P n e t Δ p η s y s
where a m , d is an additional state describing the dynamic membrane wetting and drying, whereas the outputs of the system are
  • Net power of the system ( P n e t )
  • Pressure difference across the membrane
    ( Δ p = p s m a n p s m c a )
  • System efficiency ( η s y s )

3. Vehicle as Validation Data Generator

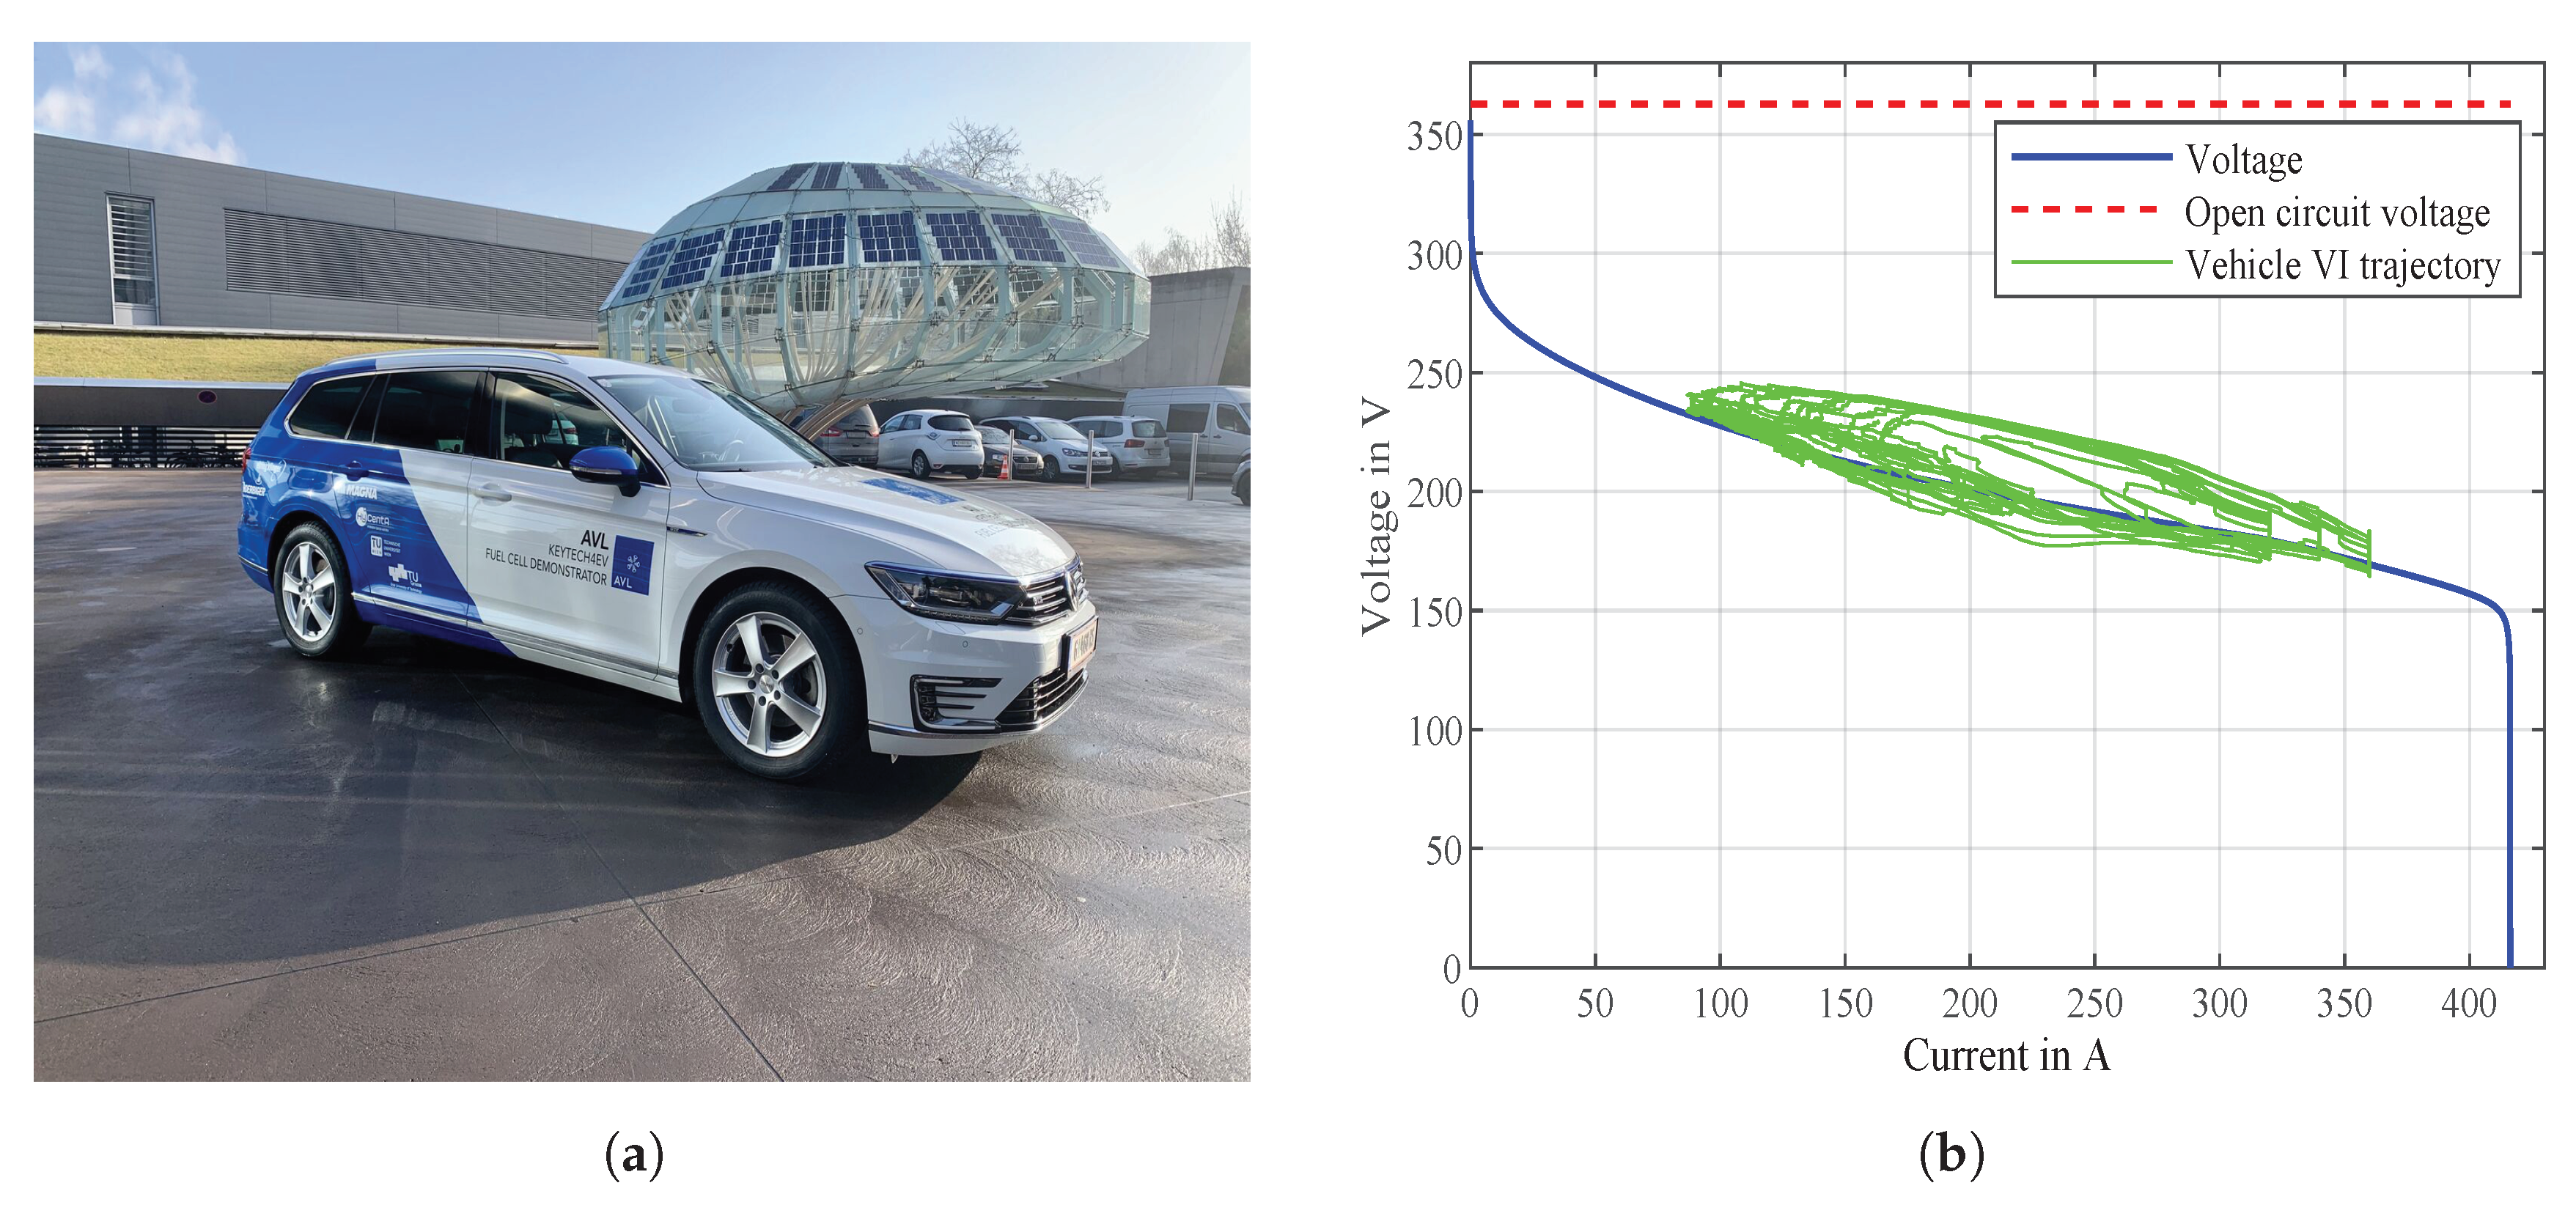
In this section, the vehicle from which the validation data for the controller has been obtained is presented. To realize the goal of building an FC car, an already existing hybrid construction has been used. The combustion engine from the vehicle was removed and replaced with the fuel cell system while the battery is kept from the original configuration. For the new architecture, an electric motor from another vehicle was used. The vehicle is powered by a 300 cell fuel cell stack with a maximum power output of 68.4 kW. There are three hydrogen tanks in the vehicle that provide the necessary fuel. The actual vehicle is shown in Figure 3a. Its construction was part of the so-called Keytech4EV project, a collaboration initiated in the year 2016 between AVL List GmbH, ElringKlinger AG (Germany) (EK), Magna Steyr Engineering AG & Co KG (MAGNA), HOERBIGER Ventilwerke GmbH & Co KG (HOERBIGER), HyCentA Research GmbH (HyCentA), Institute of Mechanics and Mechatronics, Vienna University of Technology (IMM), Institute of Chemical Engineering and Environmental Technology, Graz University of Technology (CEET) and Institut für Innovative Energie- & Stoffaustauschsysteme (IESTA) with a successful conclusion in 2020 [29].
For demonstration purposes, the vehicle V-I trajectory has been shown in Figure 3b superimposed to the polarization curve obtained by simulation from Figure 2. The vehicle seems to operate in the linear part of the V-I curve, avoiding regions close to the open-circuit voltage or the limiting current.

4. SLMPC Design

In this section, the controller design will be presented, however, a few key-points are to be mentioned before presenting the mathematical formalism of the SLMPC.
It is important to clearly visualize the end goal of this study which is:
  • Fulfill the power demand trajectory from the real vehicle shown in Figure 3a
  • Safe operation
  • Efficient operation
Each of these points is explained as follows:
Fulfill the power demand
In a fuel cell–battery hybrid configuration, there always exists a so-called energy management system (EMS) which splits the power demand between the battery and the fuel cell stack always following certain rules (e.g., respecting the limit on the state of charge (SoC) of the battery, etc.). The power demand for each of the components gets forwarded to their respective low-level controllers which then generate the signal for the actuators such as the inlet mass-flows of air and hydrogen or the position of the backpressure valves. The measured power demand for the fuel cell coming from the EMS of the vehicle is used to validate the control concept shown in this paper.
Safe operation
There is a number of conditions that degrade and/or destroy the fuel cell system. In this paper, some of them are directly considered:
  • Cathode/Anode absolute pressure—During operation, the pressures might rise or drop to a value which would, in a real setup, cause irreversible damage. If the pressure in either channel is too high, the components experience mechanical stress which can lead to fuel cell destruction. On the other hand, if the pressure is too low, starvation may occur, which is described in more detail below. Naturally, the controller must “know” that it cannot allow the system to operate outside the safe pressure range.
  • Starvation—Power is mainly provided by drawing a certain amount of current from the fuel cell stack. Current is generated by the reaction of hydrogen and oxygen, the basic principle of how does a fuel cell work. The higher the current, the faster the reactants get consumed. The task of the controller becomes obvious—a sufficient amount of reactant mass must be supplied at all times. If that would not be the case, the electrons which create the current would then come from the platinum in the catalyst layer or the carbon from the gas diffusion layer. Because of starvation, the catalyst or the GDL can be consumed in a matter of seconds destroying the fuel cell [30]. In our setup, a minimum amount of oxygen/hydrogen mass is required to always be present to avoid starvation.
  • Pressure difference across the membrane—Similar to the problem of absolute pressures, it is crucial to control the pressure difference between the anode and cathode at all times. Too big of a pressure difference causes stress on the membrane and if the pressure difference becomes negative i.e., the pressure on the cathode side becomes greater than on the anode side, other unfavorable effects can occur, such as pushing the water (generated on the cathode side) over to the anode.
  • Purging—As there is air on the cathode side instead of pure oxygen, the effect of nitrogen which does not participate in the reaction must be taken into account. It diffuses through the membrane to the anode side, accumulating and effectively lowering the availability of hydrogen for the reaction potentially causing local starvation. If, in turn, the controller would want to keep a sufficient reserve of hydrogen, it would pump in more and more hydrogen, potentially violating the pressure restriction. Therefore, the necessity of clearing (purging) the anode of nitrogen is obvious. Purging is done by opening the purge valve for a short period of time and then closing it again to not waste hydrogen into the environment. The opening is commonly triggered by a Coulomb counting strategy.
Efficient operation
Two effects should be minimized to achieve efficient operation: voltage losses and compressor power.
  • Voltage losses—Due to the reaction kinetics, there are inevitable voltage losses in fuel cell operation [1]. To increase efficiency, these voltage losses should be minimized which suggests operating at higher voltages as it is obvious from Equation (3) and Figure 2.
  • Compressor power—To supply the air needed for the operation, a compressor is used which uses the power generated by the fuel cell. One of the goals of the controller is to minimize the usage of the compressor which would increase system efficiency as is visible from Equation (4).
Summary
Control engineering-wise, the above restrictions on the system are formulated as state constraints for the SLMPC. The fact that having constraints provides safe operation is one of the reasons for choosing an MPC approach since coping with constraints is one of the strong points of the model predictive control concept in general. The purge signal is considered to be a disturbance sent to the MPC.
Since the fuel cell system summarized in Equation (7) is nonlinear, a simple linear method would not be sufficient to successfully control it, thus, in this work, a successive linearization based model predictive control approach is used. The advantage of the SLMPC over nonlinear MPC is in the guaranteed existence and uniqueness of a global minimum since the cost function is quadratic. The basic idea is to linearize and discretize the system every sample and develop a linear MPC for that particular instantaneously linearized system. That way, the linear model represents the nonlinear system well throughout the prediction horizon provided that the predicted sequence of optimal control moves does not take the system too far from the linearization point. However, the mentioned problem was not observed in this research. The steps of developing the SLMPC can be found in detail in [23] and here we bring forth the most important components of the algorithm.

4.1. Linearization of the Nonlinear System

At each sample, the model is linearized around the current point ( x k , u k ). The current sample instant is denoted by the index k. The linearization is carried out by evaluating the Jacobian matrix of the function f defined as
A c = f x = f 1 x 1 f 1 x 2 f 1 x n x f 2 x 1 f 2 x 2 f 2 x n x f n x x 1 f n x x 2 f n x x n x
at every point. With an equivalent notation, we define B c = f u , C c = h x and D c = h u and arrive at the definition of the linearized system:
x ˙ = f ( x k , u k ) + A c ( x x k ) + B c ( u u k )
y = h ( x k , u k ) + C c ( x x k ) + D c ( u u k )
Since the linearization point is not a steady-state one, the expression f ( x k , u k ) is different from zero. By introducing the following definition:
K x = f ( x k , u k ) A c x k B c u k
K y = h ( x k , u k ) C c x k D c u k
the linearized system can be written as follows:
x ˙ = A c x + B c u + K x
y = C c x + D c u + K y

4.2. Discretization of the Linearized System

After the system has been linearized, it is discretized using zero-order hold discretization as shown below. Let A be defined as A = A c B c K x 0 0 , then
A d B d K x d 0 I = e A T s
holds with T s being the sampling time and I being the identity matrix of appropriate size. Here,
C d = C c
D d = D c
K y d = K y
also holds. By appropriately extracting the system matrices A d , B d , C d , and D d as well as the equilibrium offset terms K x d and K y d , one obtains the system:
x i + 1 = A d x i + B d u i + K x d
y i = C d x i + D d u i + K y d
for which the system matrices A d , B d , C d and D d obtained at every sample instant k are assumed constant throughout the prediction. Here the index i is used to denote the prediction steps. It ranges from 1 to N p with N p being the prediction horizon. By taking a difference operation on both sides of Equation (19), one obtains
x i + 1 x i = A d ( x i x i 1 ) + B d ( u i u i 1 ) + K x d K x d .
By defining Δ x i = x i x i 1 and Δ u i = u i u i 1 , then Equation (21) becomes:
Δ x i + 1 = A d Δ x i + B d Δ u i
It has to be noted that the affine term K x d vanishes when the difference operator is applied since the linearized model used for prediction is unchanged throughout the prediction. Standard procedure for linear MPC is now applied and after the control move Δ u has been calculated, the process of linearization, discretization, and linear MPC formulation is reiterated. This formulation is not bound to the system configuration at hand and can be generally applied.

4.3. Control Goals

The goal is to track the power demand from the vehicle while ensuring safe and efficient operation. Outputs to be controlled:
y = P n e t Δ p η s y s
Reference values:
  • The reference value for the power is actually the power demand acquired from the vehicle.
  • The membrane pressure difference is, if possible, kept at 200 mbar.
  • The efficiency is maximized, having a reference value of 1.
In the SLMPC formulation, the controller minimizes the cost function:
J = i = 1 N p | | y r e f ( k + i ) y ^ ( k + i ) | | Q y 2 + + j = 1 N c | | Δ u ( k + j ) | | R 2
with Q y and R being the output and input weighting matrices, respectively. N c is the control horizon, y ^ ( k + i ) is the output prediction.

4.4. Constraints

To ensure safe operation, the following state constraints are applied
m O 2 c a 1 g
m H 2 a n 0.5 g
1 bar p c a 2.4 bar
1 bar p a n 2.4 bar
100 mbar Δ p 300 mbar
Because of physical limitations, constraints on the actuating variables have to be imposed as well:
W i n c a 0
W i n a n 0
I 0
0 α c a 1
The vector of control moves
Δ U = Δ u k + 1 Δ u k + 2 Δ u k + N c
is the solution of the optimization
Δ U = arg min Δ U J s . t . Equations ( 25 ) ( 33 )
Following the receding horizon principle, only the first step Δ u k + 1 is applied to the system.

4.5. SLMPC Numerical Values

The sampling time for the SLMPC was T s = 20 ms and the prediction horizon was N p = 50 (1 s). The control horizon was N c = 25 . The output weighting matrix has been brought in Equation (36).
Q y = 1 0 0 0 0.01 0 0 0 0.01
The weighting matrix shows that the controller tries to follow the power demand and to keep the pressure difference at 200 mbar as well as operate efficiently. To solve the optimization problem (Equation (35)) at every time step, qpOASES was used, an open-source QP solver. Software info: qpOASES v3.0, Hans Joachim Ferreau et al., ABB Corporate Research, Switzerland [31].

5. Results and Discussion

In this section, the vehicle power demand tracking while ensuring safe and efficient operation is presented.

5.1. Power Demand Tracking

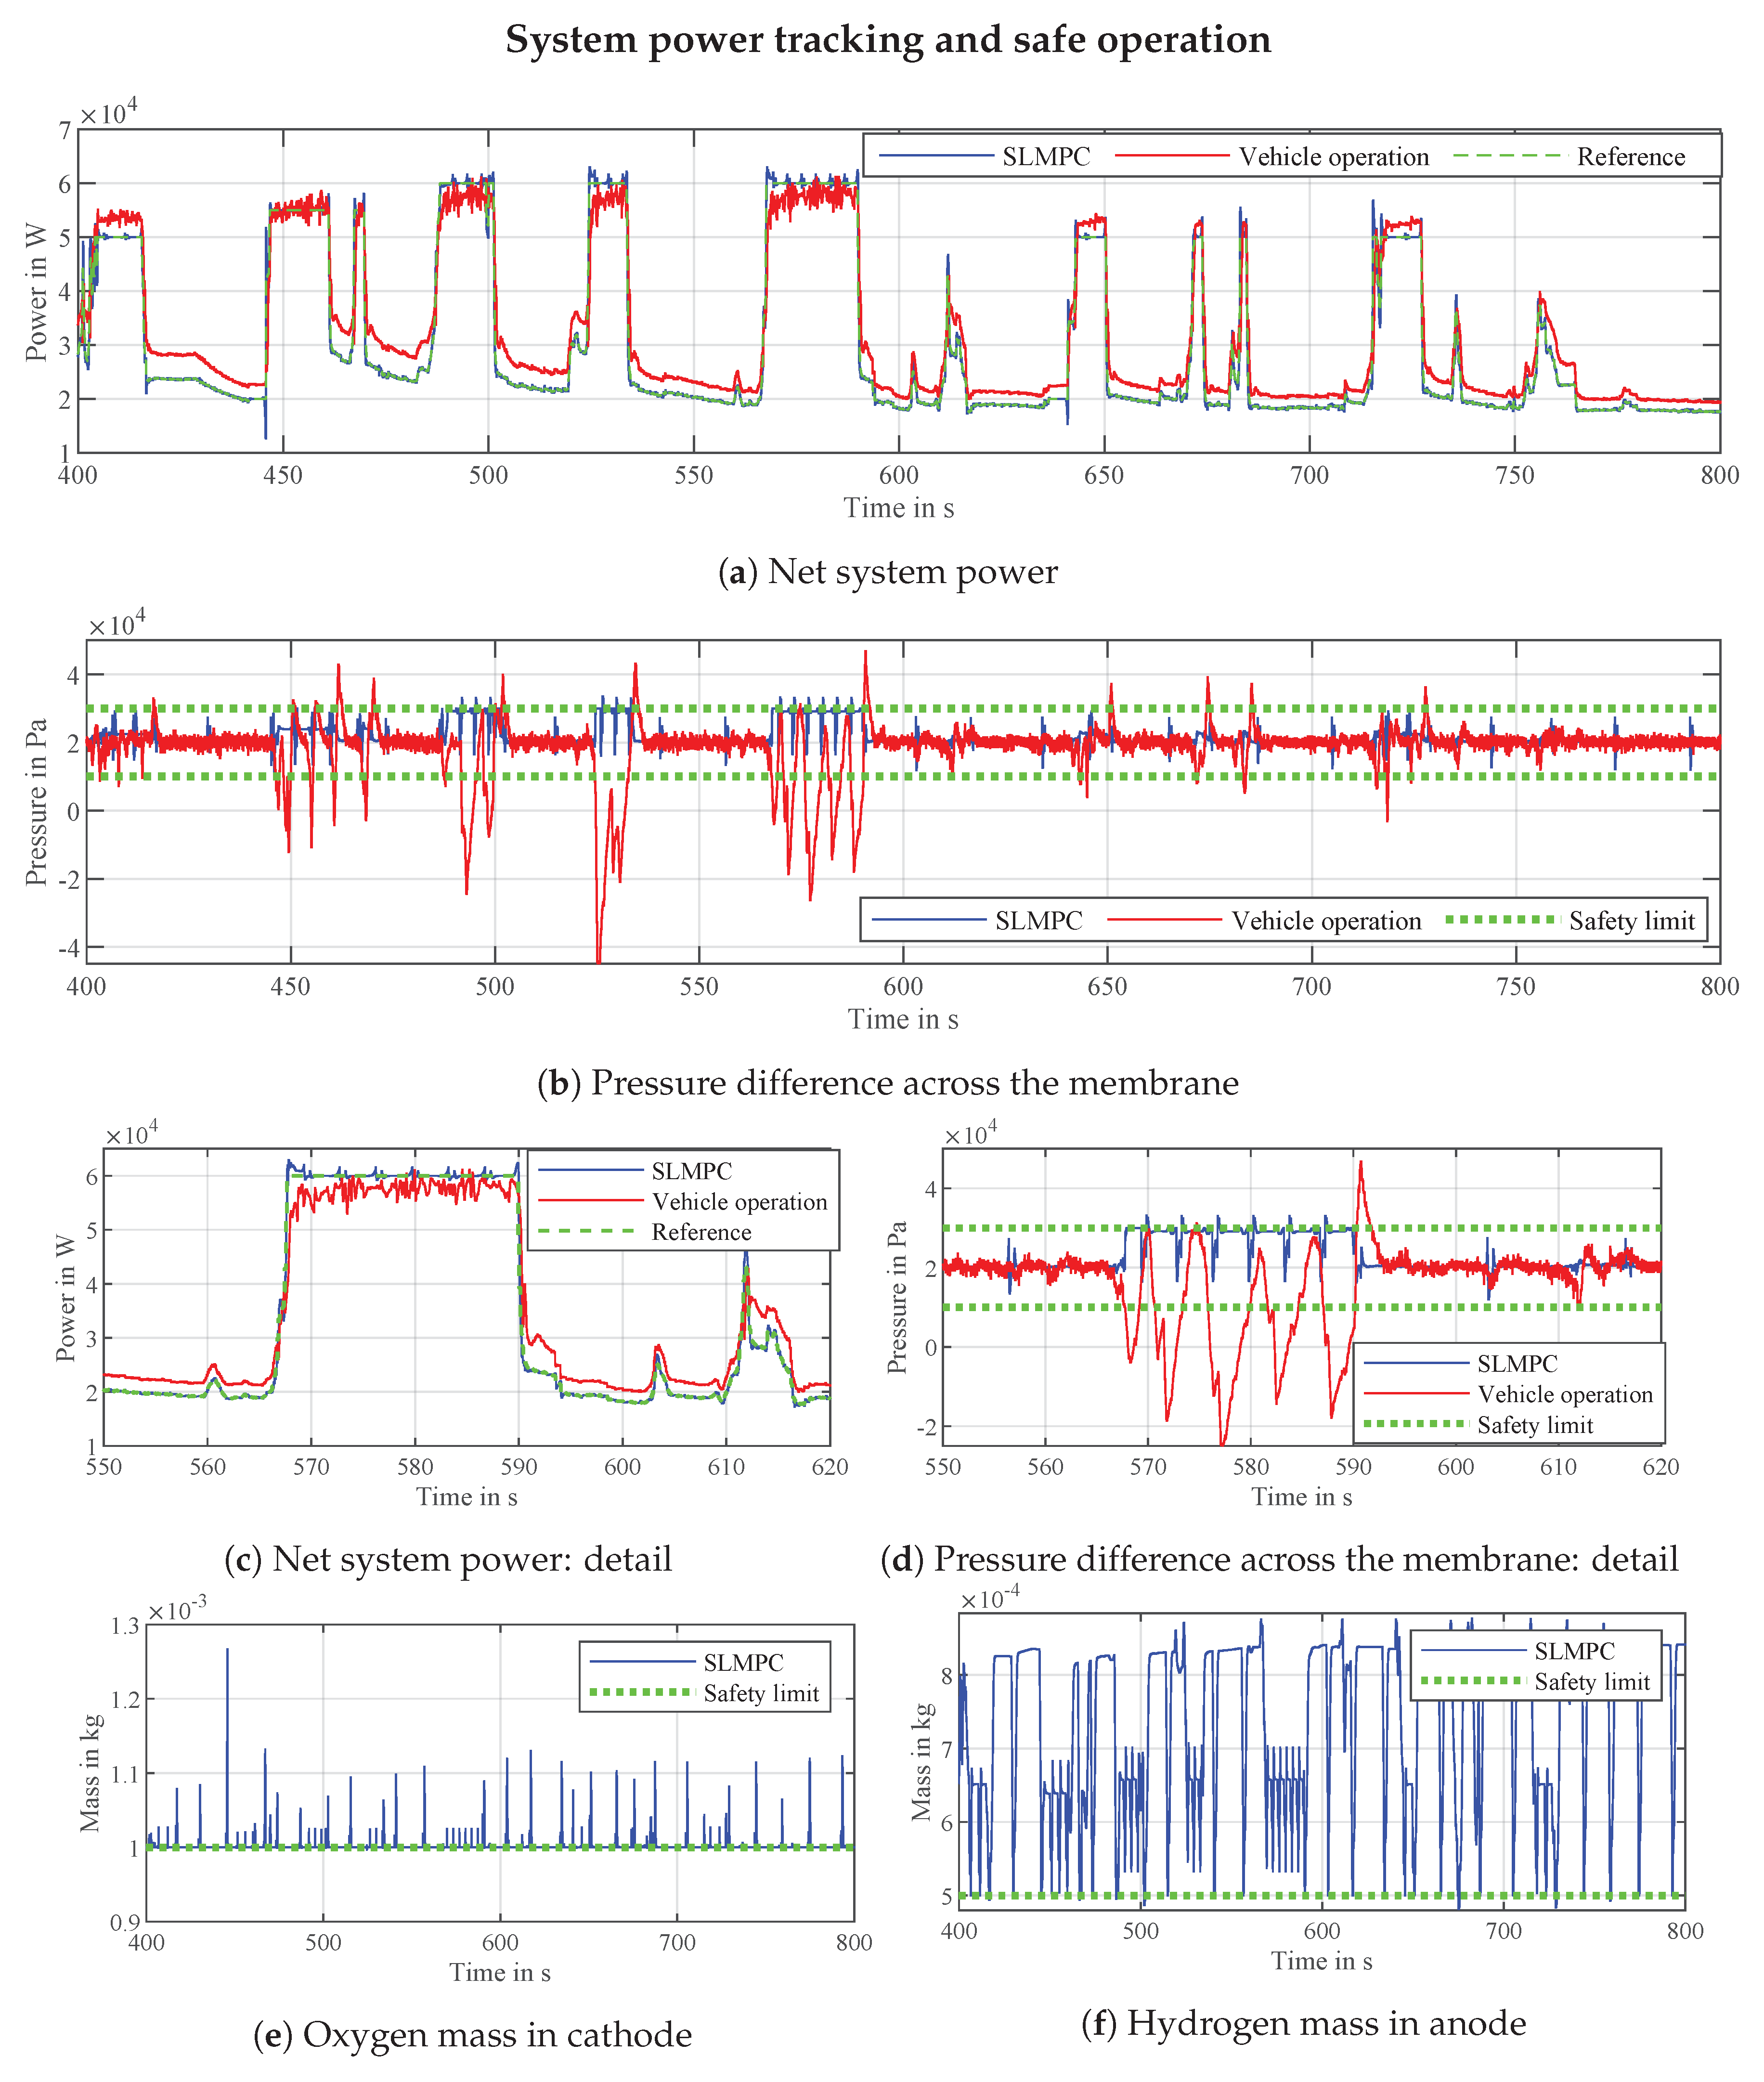
In Figure 4a the tracking of the system power demand is shown along with the actual net power measured from the vehicle. The part of the drive cycle before 400 s is omitted because the vehicle was not in its normal operating state during that time, but rather, it experienced a few emergency shut-down events which are not representable by the model at this point. From the presented drive cycle fraction, it is obvious that the controller can fulfill the power demand as shown in Figure 4a. In Figure 4c a detail of the power demand tracking is brought for demonstration purposes.

5.2. Safe Operation

The controller shows its capability of ensuring safe operation in various aspects. Firstly, it cankeep the pressure difference across the membrane between its bounds Equation (29) as shown in Figure 4b. Examining the segment of the drive cycle shown in Figure 4d, a few key points should be mentioned. The power demand during the shown segment is the highest (60 kW) so purging events happen more often than at other instances. The SLMPC can react and keep the pressure difference within the safety limits due to the knowledge of the upcoming purging event and thus proving to be a promising concept for fuel cell dynamic control. The conventional control procedure in the vehicle was not able to maintain the pressure difference value within the safety range. Secondly, the controller can keep the system from operating in starvation conditions by always having a reserve of reactant mass as shown in Figure 4e,f. It is worth noting that the oxygen and hydrogen masses shown in Figure 4e,f are not measured, but are the internal states of the fuel cell given by the model. In future work, if the model is validated and proven to represent reality accurately, the knowledge of internal states can be of great importance, as shown in this work.
No results were shown regarding the absolute pressure safety limits (Equations (27) and (28)) as they were not at risk of being violated throughout the simulation.

5.3. Efficient Operation

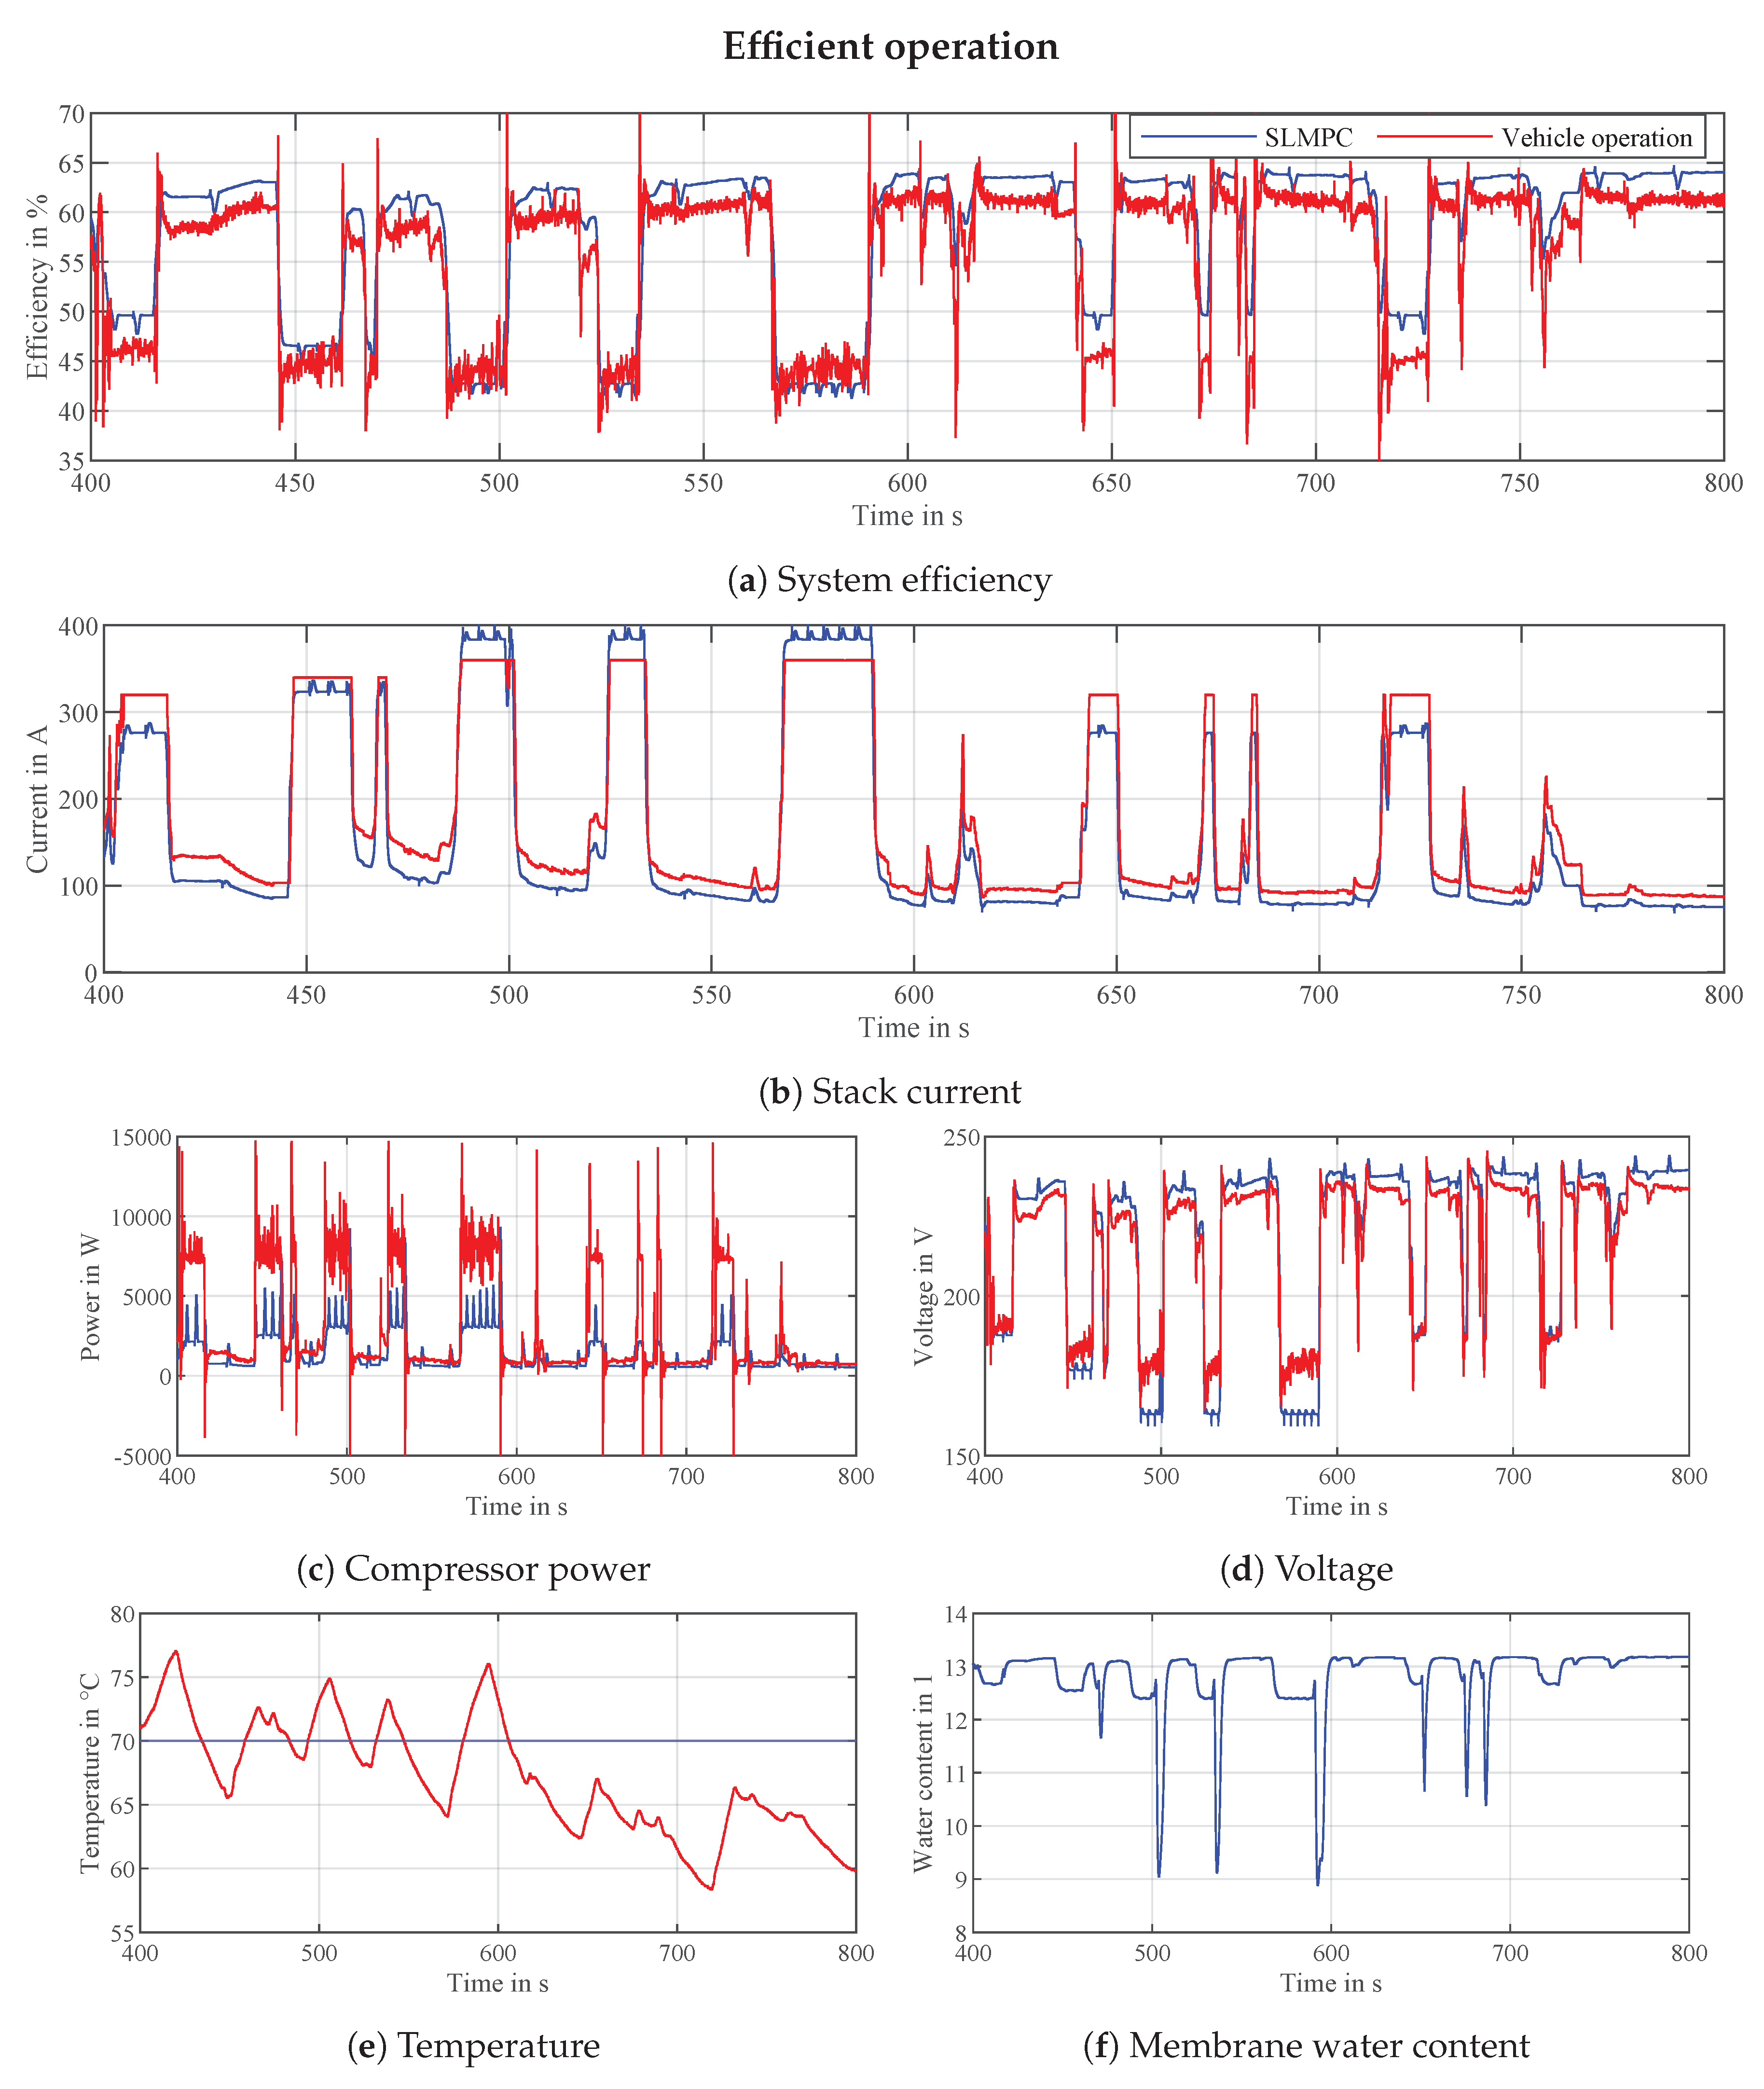
The system efficiency comparison between the proposed control concept and the actual vehicle operation is shown in Figure 5a. The SLMPC operates usually at higher efficiencies, except during the periods of high power demand where both cannot be achieved. The authors acknowledge that the reason for higher efficiency in most of the drive cycle is partly due to the predictive capability of the controller which is not available in real life as the future power trajectory is generally not known. Further investigation considering that fact is currently underway.
Examining Equation (4), one can deduce that increasing efficiency implies operation at lower currents as well as higher voltages. In addition, the compressor power should be as small as possible. As already mentioned, except for the high power demand periods, i.e., from 565 s to 590 s, the current (Figure 5b) and compressor power (Figure 5c) are lower and the voltage (Figure 5d) is higher, as it should be. The temperature is not controlled in this simulation study and is assumed constant with a value of 70 °C. The measured stack temperature in the vehicle has been observed to be between 60 °C and 75 °C as seen in Figure 5e. The voltage of the fuel cell is increased when the ohmic losses are decreased. The ohmic resistance is inversely proportional to the protonic conductivity σ :
σ ( T , λ m ) = ( e 0 λ m + e 1 ) exp e 2 1 303 1 T
which increases with the membrane water content λ m :
λ m = 0.043 + 17.18 a m , d 39.85 a m , d 2 + 36 a m , d 3 .
The values of e 0 , e 1 , and e 2 are parameters taken from the literature and through fitting. The effect of the membrane water content is included in the electrochemical model, thus, the SLMPC “knows” that efficiency is high under conditions of higher humidity and acts accordingly. Even though humidity is not actively manipulated, it is controlled with the available control inputs presented in Equation (7). To increase the membrane water content and by extension, the efficiency, the controller can, for example, close the cathode backpressure valve and/or reduce the air inflow to keep the water vapor from flowing out, preventing membrane dryout. The explained implicit consideration of the membrane water content is exactly what happens as seen in Figure 5f, keeping the membrane hydrated. The problem of flooding is currently not included in the model, but research in that respect is underway. However, as visible from the measured voltage in Figure 5d, no serious breakdown happened which could be attributed to the effects of liquid water. The authors have also been informed by the vehicle manufacturers that draining events happen quite often, thus, the quantity of liquid water present during operation is minimized.
Hydrogen saving
The rate of hydrogen consumption m ˙ H 2 is given by Faraday’s law:
m ˙ H 2 = I 2 F N c e l l s M H 2
with I being the stack current, F the Faraday constant, N c e l l s the total number of cells, and M H 2 the hydrogen molar mass. As already described above, from the equation alone is obvious that saving hydrogen implies operation at lower currents as is exactly the case as shown in Figure 5b. To calculate the actual consumed hydrogen, it is necessary to integrate Equation (39) over time. The results are shown in Table 1:
The results indicate potential hydrogen savings of 9.54%.

6. Conclusions

In this paper, a simulation study using successive linearization based model predictive control has been presented. The proposed control concept was able to track the power demand of a hydrogen-powered fuel cell vehicle while ensuring safe and efficient operation. Comparison with the actual vehicle controlled by a set of PI controllers showed that the SLMPC approach is a promising one in the future of control of fuel cells in automotive applications.

Author Contributions

Conceptualization and methodology, M.V., D.R. and S.J.; software development and investigation, M.V., D.R.; data curation and visualization, M.V.; writing—original draft, M.V.; writing—review and editing, D.R., S.J.; supervision and project administration, S.J. All authors have read and agreed to the published version of the manuscript.

Funding

This research was funded by the Austrian Research Promotion Agency (Österreichische Forschungsförderungsgesellschaft) grant number 865181. The APC was funded by TU Wien Bibliothek.

Acknowledgments

Special thanks to the engineers from AVL List GmbH for providing the data of the vehicle drive cycle as well as for all the useful advice and explanations. The authors acknowledge TU Wien Bibliothek for financial support through its Open Access Funding Program.

Conflicts of Interest

The authors declare no conflict of interest.

References

  1. Barbir, F. PEM Fuel Cells: Theory and Practice, 2nd ed.; Elsevier Inc.: Amsterdam, The Netherlands, 2013. [Google Scholar]
  2. Pukrushpan, J.T.; Peng, H.; Stefanopoulou, A.G. Control-oriented modeling and analysis for automotive fuel cell systems. J. Dyn. Syst. Meas. Control. Trans. ASME 2004, 126, 14–25. [Google Scholar] [CrossRef]
  3. Danzer, M.A.; Wilhelm, J.; Aschemann, H.; Hofer, E.P. Model-based control of cathode pressure and oxygen excess ratio of a PEM fuel cell system. J. Power Sources 2008, 176, 515–522. [Google Scholar] [CrossRef]
  4. Da Fonseca, R.; Bideaux, E.; Gerard, M.; Jeanneret, B.; Desbois-Renaudin, M.; Sari, A. Control of PEMFC system air group using differential flatness approach: Validation by a dynamic fuel cell system model. Appl. Energy 2014, 113, 219–229. [Google Scholar] [CrossRef]
  5. Chen, J.; Member, S.; Liu, Z.; Wang, F.; Ouyang, Q.; Su, H. Optimal Oxygen Excess Ratio Control for PEM Fuel Cells. IEEE Trans. Control. Syst. Technol. 2018, 26, 1711–1721. [Google Scholar] [CrossRef]
  6. Ebadighajari, A.; Devaal, J.; Golnaraghi, F. Multivariable control of hydrogen concentration and fuel over-pressure in a polymer electrolyte membrane fuel cell with anode re-circulation. In Proceedings of the 2016 American Control Conference, Boston, MA, USA, 6–8 July 2016; pp. 4428–4433. [Google Scholar] [CrossRef]
  7. Pukrushpan, J.T.; Stefanopoulou, A.G.; Peng, H.; Berlin, S.; Newyork, H.; Kong, H.; Milan, L.; Tokyo, P. Control of Fuel Cell Power Systems Principles, Modeling, Analysis, and Feedback Design-Monograph; Springer: Berlin/Heidelberg, Germany, 2004. [Google Scholar]
  8. Li, Q.; Chen, W.; Wang, Y.; Jia, J.; Han, M. Nonlinear robust control of proton exchange membrane fuel cell by state feedback exact linearization. J. Power Sources 2009, 194, 338–348. [Google Scholar] [CrossRef]
  9. Liu, Z.; Chen, J.; Chen, H.; Yan, C. Air supply regulation for PEMFC systems based on uncertainty and disturbance estimation. Int. J. Hydrog. Energy 2018, 43, 11559–11567. [Google Scholar] [CrossRef]
  10. Vahidi, A.; Stefanopoulou, A.; Peng, H. Current management in a hybrid fuel cell power system: A model-predictive control approach. IEEE Trans. Control. Syst. Technol. 2006, 14, 1047–1057. [Google Scholar] [CrossRef]
  11. Meidanshahi, V.; Karimi, G. Dynamic modeling, optimization and control of power density in a PEM fuel cell. Appl. Energy 2012, 93, 98–105. [Google Scholar] [CrossRef]
  12. Hähnel, C.; Aul, V.; Horn, J. Power Control for Efficient Operation of a PEM Fuel Cell System by Nonlinear Model Predictive Control. IFAC PapersOnLine 2015, 48, 174–179. [Google Scholar] [CrossRef]
  13. Han, X.; Li, F.; Zhang, T.; Zhang, T.; Song, K. Economic energy management strategy design and simulation for a dual-stack fuel cell electric vehicle. Int. J. Hydrog. Energy 2017, 42, 11584–11595. [Google Scholar] [CrossRef]
  14. Luna, J.; Usai, E.; Husar, A.; Serra, M. Enhancing the efficiency and lifetime of a proton exchange membrane fuel cell using nonlinear model-predictive control with nonlinear observation. IEEE Trans. Ind. Electron. 2017, 64, 6649–6659. [Google Scholar] [CrossRef]
  15. Rodatz, P.; Paganelli, G.; Sciarretta, A.; Guzzella, L. Optimal power management of an experimental fuel cell/supercapacitor- powered hybrid vehicle. Control Eng. Pract. 2005, 13, 41–53. [Google Scholar] [CrossRef]
  16. Shen, D.; Lim, C.C.; Shi, P. Robust fuzzy model predictive control for energy management systems in fuel cell vehicles. Control Eng. Pract. 2020, 98, 104364. [Google Scholar] [CrossRef]
  17. Kerviel, A.; Pesyridis, A.; Mohammed, A.; Chalet, D. An evaluation of turbocharging and supercharging options for high-efficiency Fuel Cell Electric Vehicles. Appl. Sci. 2018, 8, 2474. [Google Scholar] [CrossRef]
  18. Arce, A.; Del Real, A.J.; Bordons, C.; Ramírez, D.R. Real-time implementation of a constrained MPC for efficient airflow control in a PEM fuel cell. IEEE Trans. Ind. Electron. 2010, 57, 1892–1905. [Google Scholar] [CrossRef]
  19. Gruber, J.K.; Doll, M.; Bordons, C. Design and experimental validation of a constrained MPC for the air feed of a fuel cell. Control Eng. Pract. 2009, 17, 874–885. [Google Scholar] [CrossRef]
  20. Gruber, J.K.; Bordons, C.; Oliva, A. Nonlinear MPC for the airflow in a PEM fuel cell using a Volterra series model. Control Eng. Pract. 2012, 20, 205–217. [Google Scholar] [CrossRef]
  21. Amin; Bambang, R.T.; Rohman, A.S.; Dronkers, C.J.; Ortega, R.; Sasongko, A. Energy management of fuel cell/battery/supercapacitor hybrid power sources using model predictive control. IEEE Trans. Ind. Informatics 2014, 10, 1992–2002. [Google Scholar] [CrossRef]
  22. Puig, V.; Feroldi, D.; Serra, M.; Quevedo, J.; Riera, J. Fault-tolerant MPC control of PEM fuel cells. IFAC Proc. Vol. (IFAC Papers Online) 2008, 17, 11112–11117. [Google Scholar] [CrossRef]
  23. Zhakatayev, A.; Rakhim, B.; Adiyatov, O.; Baimyshev, A.; Varol, H.A. Successive linearization based model predictive control of variable stiffness actuated robots. In Proceedings of the IEEE/ASME International Conference on Advanced Intelligent Mechatronics, Munich, Germany, 3–7 July 2017; pp. 1774–1779. [Google Scholar] [CrossRef]
  24. Ławryńczuk, M. Nonlinear predictive control of a boiler-turbine unit: A state-space approach with successive on-line model linearisation and quadratic optimisation. ISA Trans. 2017, 67, 476–495. [Google Scholar] [CrossRef]
  25. Bamimore, A.; Taiwo, O.; King, R. Comparison of two nonlinear model predictive control methods and implementation on a laboratory three tank system. In Proceedings of the IEEE Conference on Decision and Control, Orlando, FL, USA, 12–15 December 2011; pp. 5242–5247. [Google Scholar] [CrossRef]
  26. Goshtasbi, A.; Ersal, T. LQ-MPC design for degradation-conscious control of PEM fuel cells. In Proceedings of the American Control Conference, Philadelphia, PA, USA, 10–12 July 2019; pp. 1555–1560. [Google Scholar] [CrossRef]
  27. Ritzberger, D.; Hametner, C.; Jakubek, S. A real-time dynamic fuel cell system simulation for model-based diagnostics and control: Validation on real driving data. Energies 2020, 13, 3148. [Google Scholar] [CrossRef]
  28. Kravos, A.; Ritzberger, D.; Tavcar, G.; Hametner, C.; Jakubek, S.; Katrasnik, T. Thermodynamically consistent reduced dimensionality electrochemical model for proton exchange membrane fuel cell performance modelling and control. J. Power Sources 2020, 454. [Google Scholar] [CrossRef]
  29. KEYTECH4EV Development and Demonstration of Key Technologies for Low-Cost Electric Vehicle Platforms. Available online: http://iesta.at/keytech4ev/ (accessed on 13 August 2020).
  30. Yousfi-Steiner, N.; Moçotéguy, P.; Candusso, D.; Hissel, D. A review on polymer electrolyte membrane fuel cell catalyst degradation and starvation issues: Causes, consequences and diagnostic for mitigation. J. Power Sources 2009, 194, 130–145. [Google Scholar] [CrossRef]
  31. Ferreau, H.J.; Kirches, C.; Potschka, A.; Bock, H.G.; Diehl, M. qpOASES: A parametric active-set algorithm for quadratic programming. Math. Program. Comput. 2014, 6, 327–363. [Google Scholar] [CrossRef]
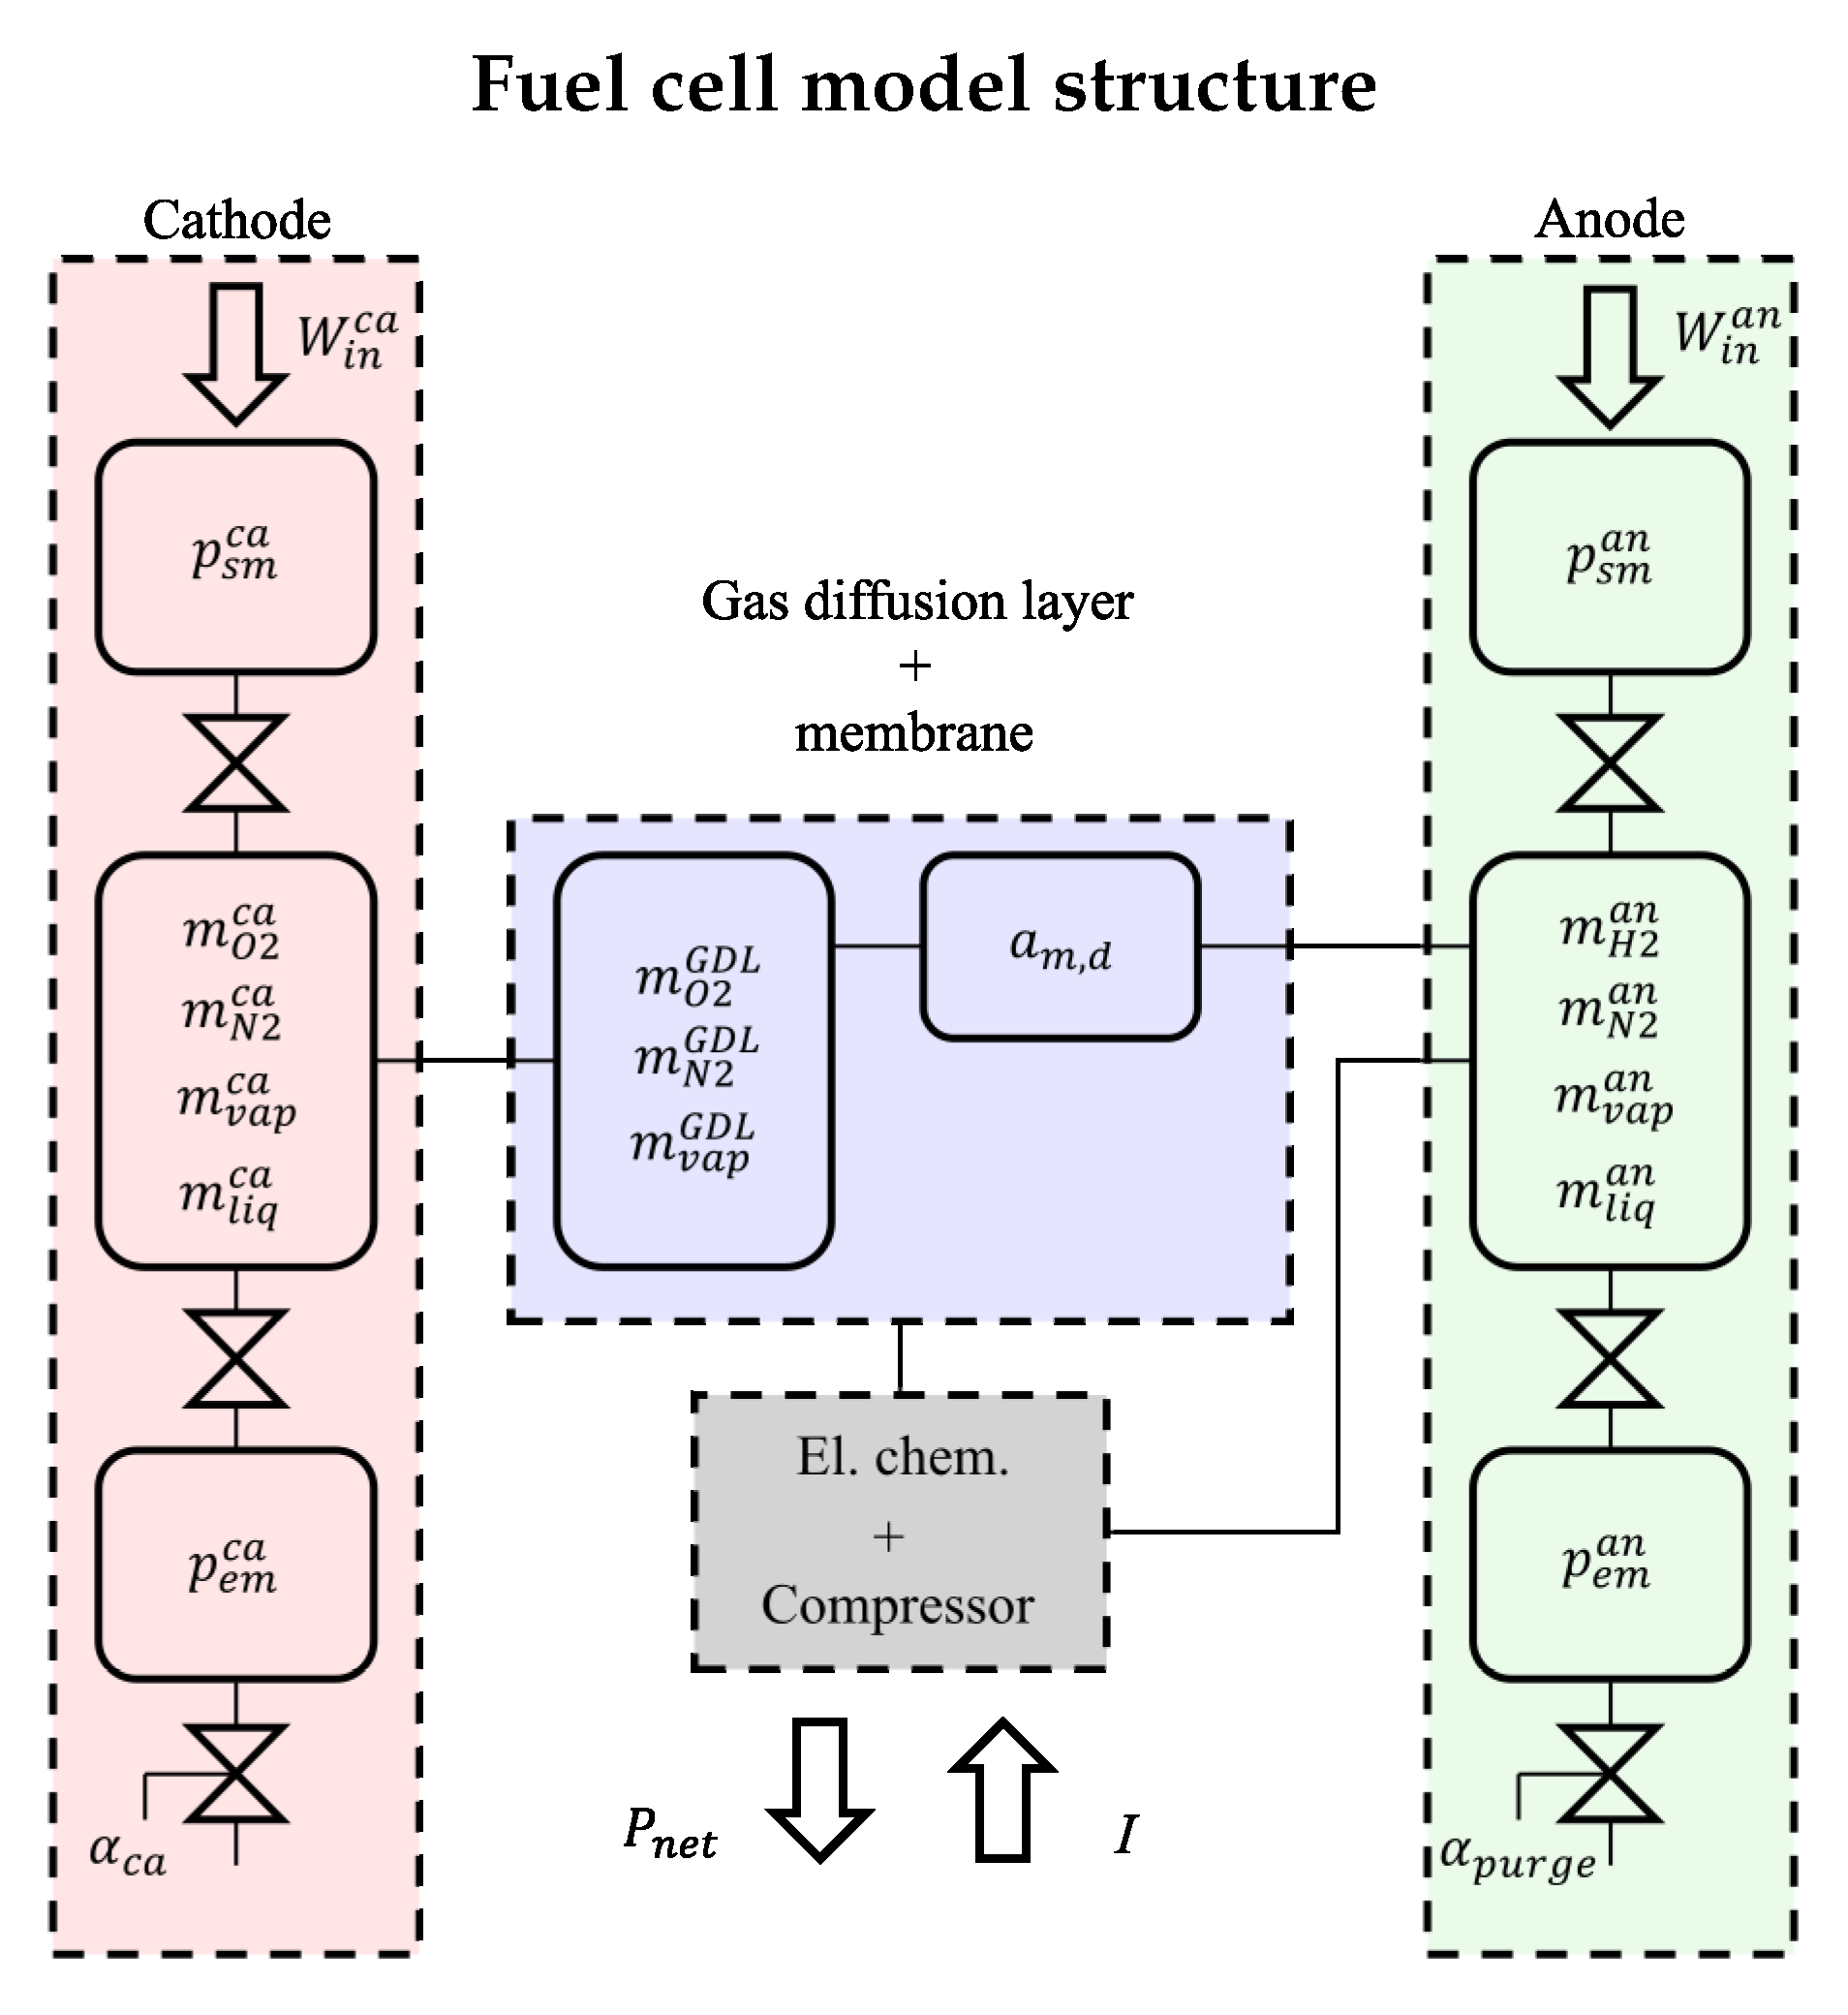
Figure 1. Structure of the fuel cell model. All the submodels(cathode, anode, electrochemical model, compressor, gas diffusion layer, and membrane) are enclosed in dashed lines.
Energies 13 05353 g001
Figure 2. Polarization curve obtained by simulation. The current is ramped up from zero until voltage breakdown. The red dashed line shows the open-circuit voltage, the blue solid line shows the operating voltage. The difference between the two are the losses due to reaction kinetics (activation, ohmic, and concentration) V l o s s .
Energies 13 05353 g002
Figure 3. Keytech4EV research vehicle and its measured V-I trajectory superimposed to the simulated polarization curve brought for visualization of the operating range. (a) Vehicle developed by AVL List GmbH from which the data has been acquired for the validation of this study. (b) Measured V-I trajectory of the vehicle.
Energies 13 05353 g003
Figure 4. The blue line shows the successive linearization based model predictive control (SLMPC) performance, whereas the red line shows the vehicle operation. In plots (a,c) the green line shows the reference power while in plots (b,df) it shows the safety limit for the presented variables.
Energies 13 05353 g004
Figure 5. The blue line shows the SLMPC performance, whereas the red line shows the vehicle operation.
Energies 13 05353 g005
Table 1. Consumed hydrogen.
Vehicle operation218.60 g
Simulation197.70 g
Publisher’s Note: MDPI stays neutral with regard to jurisdictional claims in published maps and institutional affiliations.