Abstract
This paper addresses the optimization of the compensation networks of a wireless power transfer system. Optimization is performed by means of a genetic algorithm that looks for the reactances of the elements of the compensation networks that maximize the power transfer efficiency and the power transferred to the load. In addition, the algorithm selects the solutions that are less sensitive to the difference between the theoretical and actual reactances. The last part of the paper describes the prototypal setup used for the tests and supports the theoretical findings by reporting experimental results.
1. Introduction
Electrical vehicles require the periodic recharge of their on-board battery [1]. In general, recharging begins when a cable from a power station is plugged into the socket of the vehicle. One alternative solution for electrical vehicles is wireless recharging obtained by means of induction based on the Faraday–Neumann law [2]. This solution is realized by means of two coils: the pickup is placed under the chassis of the car and the transmitting coil is located in the soil of the parking lot. When the coils are aligned by correct parking of the car, power transfer is performed by supplying the ground coil using a high frequency inverter (HFI) and conditioning the voltage induced across the pickup using a high frequency diode rectifier (HFDR). The rectifier is followed by a DC/DC converter (DC-DC) that charges the battery by adjusting the current injected in the battery according to its terminal voltage, following the charge profiles defined by the battery manufacturer. These devices are referred to as inductive wireless power transfer systems (WPTSs) [3,4]. A WPTS can be decomposed into three sections: the input section comprises a grid rectifier (GR) followed by the HFI and supplies the transmitting coil; the output section is formed by the HFDR and DC-DC, and by the vehicle battery; the coupling section is formed by the transmitting coil, the pickup, and the relevant compensation networks (CNs), whose automatic optimization constitutes the topic of this paper.
The CNs play a fundamental role in determining the overall performance of the WPTS from the perspectives of both the power transfer efficiency, which is mostly affected by the pickup side CN, and the sizing of the HFI, which is mostly affected by the transmitting side CN [5]. Each CN is constructed from one or more reactive elements whose reciprocal connections have a strong effect on the overall system performance, and characterize the different topologies of CNs described and analyzed in the literature. Following the selection of the CN’s topology, the conventional design method determines the values of the CN’s elements by inverting the mathematical system of equations that relate the CN’s reactances to the WPTS performance [6]. This operation is difficult when complex CN topologies are considered, unless simplifying hypotheses are introduced to solve the system of equations. To face this problem, in [6] an automated method for sizing CNs with a T-topology was presented; however, this paper reports only simulation results to support its findings.
Another shortcoming of the analytical approach to CN design is its focus on finding the solution to a specific design problem, which is fixed when the required performance of the WPTS is given. Consequently, the system designer is not aware of the full potential of the system he is investigating, which could, for example, deliver more power if efficiency requirements were slightly relaxed. Generally speaking, automatic optimization methods undertake a form of reversal of the problem set out above. The optimization methods provide a number of optimal solutions and allow the designer of the WPT system to choose the one that best suits his needs; for example, it is not necessary to supply the precise values of the maximum transferred power or of the minimum required efficiency as inputs to the algorithm that implements the selected optimization method, rather it is sufficient to supply it with a description of the topology of the compensation networks. The optimization algorithm explores the full potentiality of the considered system so that if none of the optimal solutions is capable of transferring the required power, this performance is beyond the possibility of the system. This conclusion also holds for the efficiency. All of the solutions found by the optimization algorithms are optimal because they characterize a system in which it is not possible to further enhance one of the system’s features without degrading another.
In contrast to [6], in which only two features of the WPTS are optimized, the algorithm proposed in the current paper simultaneously optimizes three features: power transfer efficiency, transferred power, and sensitivity of the considered solution to the variation of the reactances of the CN’s elements with respect to the designed elements. Sensitivity is not directly related to WPTS system performance, but must be considered because the reactances of the CN’s elements are inevitably affected by the production tolerances of the capacitors and inductors used to realize them.
The focus of the current paper is the description of an innovative methodological strategy based on a popular genetic optimization algorithm [7] modified to improve the Pareto front [8]. This strategy is proposed to be used generally in the field of power circuit sizing. A case study is considered of CNs with the well-known series–series (SS) compensation topology, each of which is formed by a capacitor connected in series with the relevant coil. This arrangement was selected because it has been comprehensively analyzed in the literature [9,10,11] and because it aids the experimental verification of the obtained results in the available WPTS prototype. The performance obtained with resonant SS CNs is used as a reference for the performance obtained using the optimized CNs. The same optimization algorithm can also be used for significantly more complex CNs; for example, in [6,12] it was applied to CNs having a T-topology, encompassing a total of six reactances. In this case, a Pareto front was also obtained and the CNs pertaining to the front exhibited the expected performance.
This paper is organized as follows: Section 2 describes the architecture of the WPTS considered as a case study and provides insight into the CNs that will be optimized, describing the features obtained when they are designed using the conventional approach. Moreover, it describes two types of optimization algorithms. Section 3 reports and compares the results obtained by applying the algorithms to the sizing of the CNs; finally, it illustrates the experimental setup and the results of the experiments performed to check the optimized sizing solutions. Section 4 concludes the paper.
2. Materials and Methods
2.1. WPTS Architecture
The architecture of a generic WPTS is shown in Figure 1, in which the three sections are delimited by dashed boxes. In the figure and following discussion, lower case letters are used to denote alternate quantities, upper case letters refer to constant or nearly constant quantities, or to the peak amplitude of alternate quantities, and capital letters with a superscript bar denote phasors.
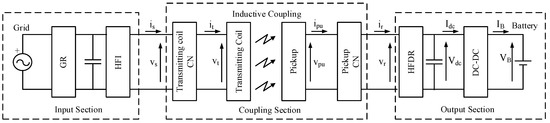
Figure 1.
Circuital scheme of a wireless power transfer systems (WPTS).
The nominal frequency of the voltage vs at the output of the HFI is fixed at 85 kHz by the Society of Automotive Engineers (SAE) document J 2954 [13] and can range in the interval [79 kHz, 90 kHz]. The HFI is usually controlled with the phase shift technique and generates a three-level square wave voltage; nevertheless, in most cases both it and ipu are nearly sinusoidal because the CNs in combination with the inductance of the coupled coils exert a filtering action on the current harmonics. Consequently, the transferred power is unaffected by the higher order voltage harmonics applied across the coil’s terminals. Hence, given the linear behavior of the CNs, it is common practice to study the WPTS behavior considering only the first harmonic of vs.
The presence of the HFDR as the first stage of the output section entails that the average power absorbed by the latter stage in one period of vs is purely active. For this reason, the cascade of the HFDR, the DC-DC, and the vehicle battery can be represented by an equivalent resistor RL. The expression of RL is first determined by defining the equivalent resistance of the battery as:
During the charging process, VB increases by some tenths of its initial value, whereas IB decreases from the maximum initial value to a small fraction of it. As a consequence, depending on the battery characteristics, RB ranges in a wide interval which, in the prototype used for the experiments and described in Section 3.2, extends from a few Ω to few hundreds of Ω [10]. Neglecting the losses in the DC-DC converter, the equivalent resistance seen at its input is:
In contrast to RB, which depends on the state of charge of the battery, Rdc can be controlled to some extent, because it is proportional to RB, with a ratio that can be adjusted by selecting a suitable value of Vdc. During the constant current mode of the battery charging process, if Vdc is kept constant, RB increases with VB while Rdc decreases; once VB reaches the full charge value, the charging process continues with the constant voltage mode and RB increases substantially while IB decreases to a small fraction of its nominal charging value. In addition, Rdc increases proportionally to RB.
Under the hypothesis of ir being sinusoidal and Vdc constant or slowly variable, and neglecting the voltage drop across the HFDR components, the current Idc at the input of the DC-DC is the average component of a rectified sinusoid having amplitude ir and the voltage vr at its input is a square wave having amplitude Vdc.
From these last considerations, the equivalent resistance seen at the input of the rectifier, which constitutes the equivalent load of the coupled coils, is:
Like in the case of Rdc, RL can be adjusted by properly designing the voltage of the DC bus at the input of the DC-DC converter.
2.2. Compensation Networks
Following from the previous discussion, the scheme of a WPTS can be simplified as shown in Figure 2 in which the output of the WPTS is connected to the equivalent load resistance at the terminals Apu and Bpu, and to the voltage supply at the terminals At and Bt. In addition to their self-inductances Lt and Lpu, the coupled coils are modelled by their mutual inductance M and by their parasitic resistances Rt and Rpu.
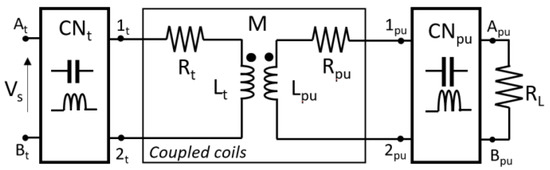
Figure 2.
Circuit scheme of the coupling section of a WPTS.
The compensation network CNt is inserted between the voltage supply and the transmitting coil, and the CN denoted CNpu is connected between the pickup coil and the equivalent load. With SS compensation, both CNt and CNpu have the simple scheme shown in Figure 3; usually they work in a resonance condition so that the capacitances Ct and Cpu are sized according to:
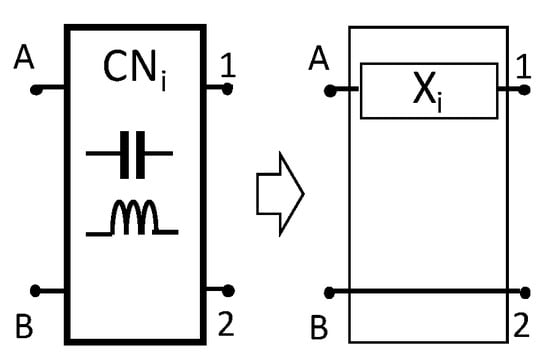
Figure 3.
Example of a Series–Series (SS) compensation network.
These CNs perform a strong bandpass action and, as stated in Section 2.1, only the first harmonic of vs can be considered in the theoretical analysis. There is no guarantee that all CNs designed automatically by the proposed procedure will enforce some kind of resonance; for this reason, as described in the next Section, in the automatic design procedure only the CNs with an overall bandpass action will be selected. This condition allows vs to be considered as sinusoidal in computing the objective functions.
2.3. Optimization Algorithm
The aim of this paper is to describe an automated tool for the design of CNs in which more objective functions are simultaneously improved, as shown in [6,12]. The optimization algorithm used in the design of the CNs searches for design variable sets, constituted by the reactances of the compensation networks, that minimize two objective functions related to the WPTS efficiency and to the power transmitted to the load. A third objective function is also minimized that is related to the sensitivity to the design variables themselves, as shown in [14]. Sensitivity is evaluated on the objective functions and is a test for the solution robustness. Thus, a three-objective function problem is generated, comprising two main objectives and a secondary objective, so that a Pareto front of non-dominated solutions is obtained. Moreover, the improved solutions are checked to discard non-practical solutions with low impedance at high frequency that would lead to the circulation in the CNs of currents with high harmonic order. The case study considers the simplest CNs, formed by a series connected reactance, and the optimization algorithm then incorporates two design variables and three objective functions.
2.3.1. NSGA-II Algorithm
The optimization algorithm belongs to a class of genetic algorithm. It is a modification of the classical non-dominated-sorting genetic algorithm (NSGA-II) [7,15,16], including the migration concept (M-NSGA), proposed in [17]. In this paper the improved version is used. In the NSGA-II algorithm a population of N father individuals generates up to N sons which, after a selection step, produce a new population of N individuals. In the M-NSGA version [8,17], a new population formed by a variable number of individuals ranging from 5 to N immigrates after the generation step, so improved individuals can modify the genetic heritage of the original population. In the new version of the M-NSGA algorithm, migration parents-NSGA (MP-NSGA) [18], the immigration occurs before the generation step, so the genetic heritage of the new population can affect the generation of new individuals. Moreover, in this case the size of the immigrated population is variable between 5 and N/2. The differences between the original and the new version of M-NSGA are schematized in Figure 4. In both cases, the initial population is formed by a random set of N individuals of reactances related to the compensation network circuit [6,12].
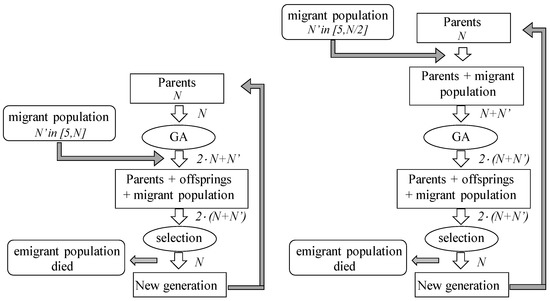
Figure 4.
Optimization flow chart (left) Migration Non-Dominated-Sorting Genetic Algorithm (M-NSGA) and (right) Migration Parents-NSGA (MP-NSGA).
In the CN topology considered, two unknown variables exist in each individual extracted from a uniform distribution defined in the range [Xmin, Xmax]. In this case, the boundaries of this interval are set to one order of magnitude higher than the resonating reactance, allowing the design variables to take both positive and negative values.
The new generation is obtained by applying the genetic operator to the parent population of the previous step: in general, for a pair of individuals, one or two sons are generated by means of cross-over genetic rules [8]; the new generation is the result of the selection of the individuals that best fit with a selection criterion, i.e., the one that minimizes the objective functions. The algorithm stops after a fixed number of generations.
2.3.2. Objective Functions
Because vs is hypothesized to be sinusoidal, it is possible to redraw the scheme of Figure 2 in the form of Figure 5, in which the phasors of the quantities involved in the operation of the WPTS are considered.
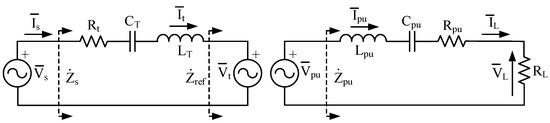
Figure 5.
WPTS with SS topology.
The computation of the efficiency η and of the transferred power PL is performed at each step of the optimization algorithm and starts by finding the impedance , i.e., the equivalent impedance seen by the voltage source constituted by the induced voltage .
As shown in Figure 5, depends on the optimized value of Cpu; on Lpu, Rpu, and RL, which are the given parameters of the WPTS; and on the supply angular frequency ω, which is equal to 2π f rad s−1, f = 85 kHz. Then, the reflected impedance is determined; its expression does not depend on the topology of the CNs, but is a function of , M, and ω according to:
obtained from Equation (5) and:
which relate the voltages and currents of the transmitting coil and of the pickup. Finally, the impedance seen by the voltage supply is computed using , the optimize design variable Ct, and the given parameters Lt and Rt.
In deriving η and PL, the magnitude of is conveniently set to 1 V, so that the reciprocal of corresponds to the supply current . In the considered case study, which has a series compensation, coincides with the current flowing in the transmitting coil. From the latter, the induced voltage is computed according to the first of Equation (7). The current is readily found by dividing by the previously computed ; because of the series compensation, it coincides with the current flowing in the load. Then the power transferred to the load is:
where is the magnitude of .
The active power delivered by the voltage supply is obtained as:
where the operator computes the real part of its argument.
Finally, the power transfer efficiency is computed using:
The first two objective functions are obtained from Equations (8) and (10); the optimization algorithm searches for their minimal values so that they are conveniently expressed in the form of Equations (11) and (12) to optimize the WPTS performance:
The third objective function is related to the sensitivity of the WPTS efficiency to the design variable variation. It is computed by means of the Design Of Experiments method described in [19,20], and according to the method described in [21,22] in which values of the actual design variables x are moved in the uncertainty range Δx = ±1%, and can be symbolically expressed as:
Equation (7) highlights the dependence of the operation of the WPTS on the mutual inductance M between the coils, which in turn is affected by the relative coils’ positions. Two of the objective functions of the optimization algorithm are derived from Equation (7) according to the described procedure so that the optimization results depend on the coil positioning. This issue is considered in [6], in which optimization is performed for different values of M, thus finding that variations of the mutual inductance mainly affect the design of the CN of the pickup, whereas the optimal solutions relevant to the CN of the transmitting coil change less as a result of changes in M.
2.3.3. Selection of RL
The values of the objective functions for a given set of design variables depend on RL. Hence, it is important that RL takes a value that allows the WPTS to achieve good performance.
In the resonant SS compensation, i.e., if Equation (4) is satisfied, the analytical expression of the efficiency is:
and its graph as a function of RL is shown in Figure 6. Examination of the plot shows that maximum efficiency is reached when RL takes an optimal value RL,opt, which lies in the interval [10 Ω, 20 Ω]. Table 1 gives RB,N = 5.6 Ω as the nominal value of the battery equivalent resistance; it is the ratio given in Equation (1) computed at the end of the constant current mode of the charging process, when both the battery voltage and charging current are maximal and the peak of transferred power is reached. It is convenient that the maximum efficiency is enforced in this condition, because a given decrease in the efficiency entails a larger increase in absolute power losses when high power is transferred than when it is low. The equivalent battery resistance and the load resistance are linked by Equation (3), from which the operating voltage of the DC bus required to operate at the maximum efficiency, i.e., with RL = RL,opt, can be derived by Equation (15) when the peak power is transferred and RB = RB,N.
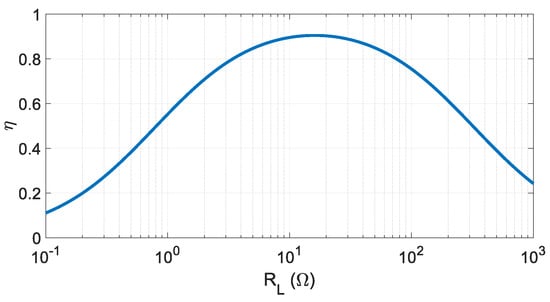
Figure 6.
Power transfer efficiency vs. equivalent load resistance.

Table 1.
WPTS parameters.
During the constant current mode, the equivalent battery resistance increases by a factor equal to about 3/2 while it varies from its minimum RB,m, relevant to the condition of injecting the maximum charging current in the fully discharged battery, to its nominal value RB,N. Maintaining a constant Vdc given by Equation (15), according to Equation (3) RL reduces to 2/3 of the initial value, but the effect of its variation on the power transfer efficiency is marginal, as can be seen in Figure 6. It should be noted that Vdc can be adjusted within a reasonably wide interval during the WPTS operations so that the maximum efficiency can be maintained over the full constant current mode of the charging process.
During the constant voltage mode, RB increases considerably beyond RB,N while the charging current decreases. It is reasonable to stop the charging process when the current falls below 1/20 of its maximum value. In this condition, the transferred power is 1/20 of the peak power, whereas both RB and RL are 20 times higher than their nominal values; at the same time, according to Figure 6, the efficiency decreases from about 0.9 to 0.7. Despite the worsening of the efficiency performance, the lost power is about 1/7 of that lost while operating at the peak power because the transferred power is sensibly lower. This condition justifies the design choice of sizing the resonant CNs considering RB constant and equal to RB,N.
For this reason, in this paper the equivalent load resistance RL is considered to be constant and equal to that of the experimental setup, which optimizes the efficiency performance of the SS resonant CNs. When the CNs do not resonate, Equation (14) does not hold and the maximum efficiency can be reached with a different value of RL. However, maintaining RL at a fixed value results in a more realistic comparison of the optimized CNs with the resonant CNs because the CNs are the only elements of the WPTS to be changed.
A different approach could maximize the energy transfer efficiency rather than the power transfer efficiency. In this case, if the exact profiles of the charging current and battery voltage during the charging process are known, the instantaneous RL(t) is computed in each time instant, and PL(t) and Ps(t) are obtained from it following the procedure described in Section 2.3.2. Then, by time integration, the energy transfer efficiency is derived as:
where T represents the duration of the charging process.
Using instead of to define the objective function f1 would lead to different optimized solutions, but would not require any change to be made to the optimization algorithm used to derive the solutions or in the procedure used for their implementation, as described in the next sections.
3. Results
3.1. Optimization Results
Two runs of the genetic algorithm were performed; the first, denoted Opt1, considers the three objective functions, f1, f2, and f3; the second, denoted Opt2, considers only f1 and f2. In both cases the optimization algorithm started with N = 60 individuals in the initial population and ran for 250 iterations.
Figure 7 reports the starting population (red crosses) and the Pareto fronts in terms of the efficiency, η, and the power transferred to the load, PL, obtained with Opt1 (blue circles) and Opt2 (green triangles). It appears that the two Pareto fronts are partially superposed except for a few points in the front related to the optimization Opt1. This is a three-objective optimization and the Pareto front is a 3D-surface so that the represented points are the projections on the η-PL plane of the (f1, f2, f3) points. Table 2 reports the values of the design variables and the relevant η, PL, and f3 related to some relevant points in the Opt1 front in Figure 7. Analysis of the figure and the table shows that the best solutions for f1 and f2 are in contrast, and tentative improvement of one of the objectives drastically worsens the other, as can be derived by comparing the extreme points in the Pareto fronts.
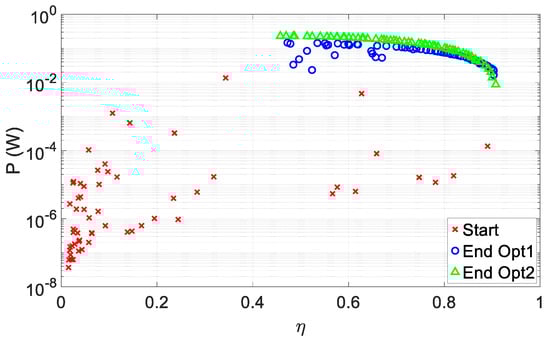
Figure 7.
Improved Pareto front: individuals of the starting population (red crosses), the Pareto front of Opt1 (blue circles), and the Pareto front related to Opt2 (green triangles).
Table 2.
Values of design variables, η, and PL, and sensitivity of some points in the front obtained with the Opt1 run (blue circles in Figure 7).
For the considered case study, the improved solutions can be identified among those that allow a large efficiency, e.g., larger than 0.8, and improve the transferred power. Indeed, the experimental tests described in the following section were performed considering the solutions that lie in the rightmost region of the Pareto front Opt1, represented in the upper-right corner of Figure 7.
3.2. Validation Experiments
The WPTS available in the laboratory was designed around the characteristics of a small city car, whose battery operates at a nominal voltage of 48 V and can be charged with a maximum power of 560 W [23]; the schematic of the prototypal WPTS is shown in Figure 8 and the values of its components are reported in Table 3.
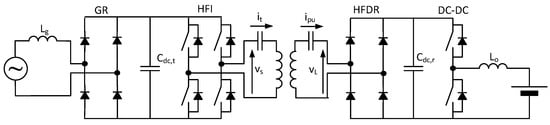
Figure 8.
Schematic of the prototypal WPTS.
Table 3.
Values of the components of the prototypal WPTS.
The parameters of the WPTS relevant to the coil coupling and power transfer are listed in Table 1. The HFI is controlled with the phase shift technique and generates a three-level square wave; the rectifier, the DC-DC converter, and the battery are represented by the resistance connected at the terminals of the series constituted by the pickup and the compensating capacitor, i.e., the terminals denoted Apu and Bpu in Figure 2. The prototype was designed to operate with SS resonance so that Ct and Cpu values comply with Equation (4) and are equal to 29 nF. In practice they were synthetized by combining commercially available capacitors with a capacitance of 15 nF and a suitable voltage rating. In particular, two equal printed circuit boards (PCB) were arranged, containing eight rows of capacitors connected in parallel, each made of four elements connected in series, obtaining a nominal capacitance of 30 nF for both. The rating of the available capacitors and the layout of the PCBs allow any combination formed by 6 to 10 rows to be set up, in which each row comprises three or four capacitors, to implement different CNs derived from the optimization algorithm. The experimental setup is shown in Figure 9a. The coils, together with their relevant ferrite plates, are protected by the red plastic enclosures fitted on top and below the wooden box used to keep the coils at the right distance. Each coil has an outer diameter of 38 cm, an inner diameter of 18.5 cm, and is made of 15 turns of Litz wire covered with an insulating sheath. The coils are deployed on two square ferrite plates having a dimension of 40 × 40 × 0.6 cm, each formed by 16 square tiles. The layout of a coil without one of the protective plastic sheets is shown in Figure 9b.
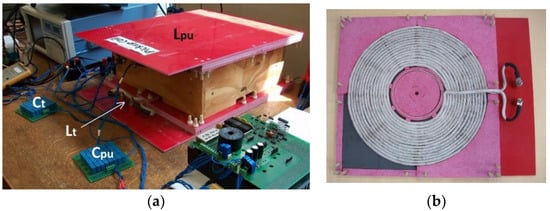
Figure 9.
(a) Experimental setup. (b) Coil layout.
Considering the limitation in the values of the capacitors, the first step of the validation experiments was selecting, among the pairs Ct-Cpu that can actually be synthetized, those that best fit with any of the individuals of Table 2. In performing this selection, individuals obtained from the Opt1 front were considered because they should be characterized by lower sensitivity of η and PL to differences between the designed and the actual values of Ct and Cpu. The selected Ct-Cpu pairs and those obtained from the optimization are visualized in Figure 10 using red circles and blue crosses, respectively. The outcome of the figure analysis is disappointing because the correspondence between the selected and optimized capacitances in many cases is not very good, especially in the region with higher Ct and Cpu.
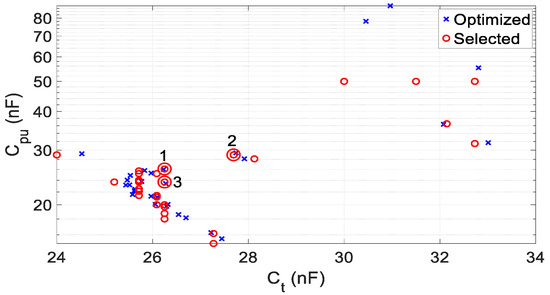
Figure 10.
Optimized (blue crosses) and selected (red circles) Ct-Cpu pairs.
For each of the selected pair of capacitances, the quantities η and PL were computed using the same algorithms used to derive the objective functions during the optimization. The obtained values are plotted in Figure 11 with red circles, with those coming from Table 2 denoted by blue crosses. It can be seen that, with the exception of a few cases, the selected pairs originate points lying on the Pareto front even if their match with the optimized counterparts is not perfect. As a comparison, the η-PL pair relevant to a resonant SS compensation, which lies at the right end of the front, is reported in the figure using a magenta star denoted by the letter R. This point lays on the Pareto front, thus demonstrating that it is actually optimized, whereas the presence of other solutions around it confirms that the presented optimization algorithm can be considered a generalization of the analytical process used to design the CNs. Indeed, it provides a full range of different solutions that achieve a transferred power that is about seven times higher than that of the resonant CNs, even if at the expense of a lower efficiency.
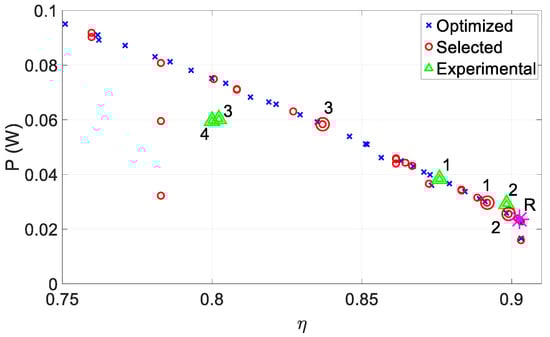
Figure 11.
η-PL pairs relevant to optimized (blue crosses), selected (red circles), and experimental (green triangles) Ct-Cpu pairs.
Finally, experiments were performed by inserting in the WPTS three different Ct-Cpu pairs and connecting a variable resistor across the terminals of the pickup to implement RL; the variable resistor was set to 13 Ω. The expected η-PL pairs are highlighted in Figure 11 with the large red circles numbered from 1 to 3. The actual η-PL pairs were measured by means of a WT1800 wattmeter manufactured by Yokogawa, Tokyo, Japan, thus obtaining the results highlighted by the green triangles numbered from 1 to 3. Experiment 3 was performed two times to check the repeatability of the results, thus obtaining the two nearly matching triangles marked by numbers 3 and 4. Table 4 reports the capacitances used in the experiments, the power on the load, the efficiency computed by means of Equations (9) and (10), and the corresponding measured quantities. Moreover, the measured rms voltages and currents applied to the coils are listed; by manipulating these data and the measured η-PL pairs, the power factors at the terminals of the transmitting coil and the pickup were determined. In both Figure 11 and Table 4, the measured power is divided by the square of the first harmonic amplitude of vs to compare the actual power with the power computed by Equation (10), which refers to a sinusoidal supply voltage with an amplitude equal to 1 V.
Table 4.
Measured values in experimental validation.
Analysis of Figure 11 reveals that the match between the theoretical and experimental values is good, but not perfect. The theoretical and the measured points relevant to experiments 1 and 2, characterized by high efficiency, are close to each other, and the measured quantities are close to those of the optimized sets reported in rows 9 and 10 in Table 2, respectively. The difference between theoretical and measured quantities is greater in experiment 3. This behavior can be explained, at least partially, as a consequence of the higher sensitivity of the corresponding point with respect to the variation of the capacitances of the CNs. Indeed, it is not possible to nullify this variation because of the inherent impossibility of precisely establishing the optimized reactances and due to the tolerance of the available capacitors, which is ±5%. Another possible cause of this difference is the simplified model used to evaluate f1 and f2, which does not account accurately for the voltage drops across the inverter switches. Furthermore, voltage vL at the input of the HFDR, shown by the blue plot in Figure 12, is not exactly a square wave, as hypothesized in Equation (3). The waveforms of vL and vs, and those of it and ipu, which are reported in Figure 13, are relevant to experiment 2 and were acquired using a TDS5034 oscilloscope manufactured by Tektronik, Bracknell, Berkshire, UK, equipped with voltage and current probes. As reported in Figure 13, both of the currents are nearly perfectly sinusoidal despite the high harmonic content of the supply voltage. This result confirms the effectiveness of the selection performed among the optimized solutions to discard those that would lead to a distorted current, and justifies the procedure used in computing the objective functions, which relies on the hypothesis of operating with sinusoidal quantities.
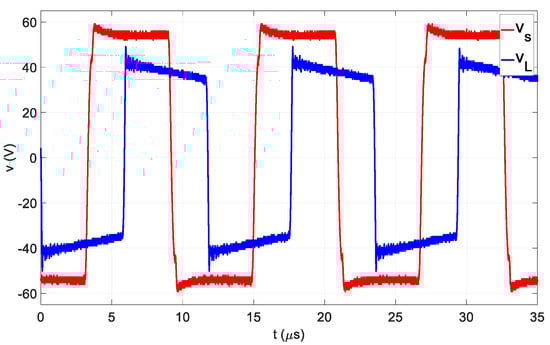
Figure 12.
Voltage vs at the output of the high frequency inverter (HFI) (red) and voltage vL at the input of the high frequency diode rectifier (HFDR) (blue) during experiment 2.
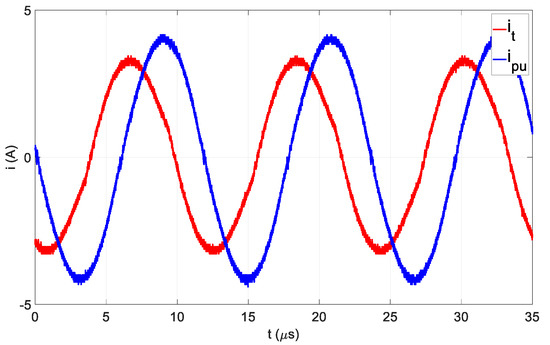
Figure 13.
Current it in the transmitting coil and current ipu in the pickup during experiment 2.
4. Discussion
The paper presented a genetic algorithm devoted to the optimization of the performance of a WPTS by determining the reactance of its CNs. From a methodological perspective, the genetic optimization techniques allow the evaluation of a large number of different solutions in which two or more objective functions are considered that are often in contrast to a large number of design variables. The generated solutions outline a Pareto front that encompasses all of the solutions that are the best compromise for all of the objective functions. The Pareto front helps designers to determine the best combinations of design variables that improve the goals’ configurations. In the simple case study that was presented, the algorithm offered a large number of optimal solutions to the problem; some of these were implemented in an experimental setup to check the effectiveness of the algorithm. The obtained results confirm that the individuals selected by the algorithm succeed in supplying the load with higher power than the conventional resonant CNs, and that the general form of the Pareto front is respected despite the unavoidable differences between the numeric and the experimental results.
Future development of this work will consist of inserting the optimization of the equivalent load resistance into the genetic algorithm to determine the extent to which WPTS performance can be further enhanced.
Author Contributions
Conceptualization, E.S. and M.B.; methodology, E.S. and M.B.; software, E.S.; validation, M.B., E.S. and S.G.; formal analysis, E.S.; investigation, E.S. and M.B.; writing—Original draft preparation, M.B, E.S. and S.G.; writing—Review and editing, M.B., E.S. and S.G.; visualization, M.B., E.S. and S.G.; supervision, M.B., E.S. All authors have read and agreed to the published version of the manuscript.
Funding
This research received no external funding.
Conflicts of Interest
The authors declare no conflict of interest.
References
- Bertoluzzo, M.; Zabihi, N.; Buja, G. Overview on Battery Chargers for Plug-in Electric Vehicles. In Proceedings of the 2012 15th International Power Electronics and Motion Control Conference (EPE/PEMC), Novi Sad, Serbia, 4–6 September 2012. [Google Scholar]
- Choi, S.Y.; Gu, B.W.; Jeong, S.Y.; Rim, C.T. Advances in Wireless Power Transfer Systems for Roadway-Powered Electric Vehicles. IEEE J. Emerg. Sel. Top. Power Electron. 2014, 3, 18–36. [Google Scholar] [CrossRef]
- Covic, G.A.; Boys, J.T. Inductive power transfer. Proc. IEEE 2013, 101, 1276–1289. [Google Scholar] [CrossRef]
- Covic, G.A.; Boys, J.T. Modern Trends in Inductive Power Transfer for Transportation Applications. IEEE J. Emerg. Sel. Top. Power Electron. 2013, 1, 28–41. [Google Scholar] [CrossRef]
- Feng, H.; Cai, T.; Duan, S.; Zhang, X.; Hu, H.; Niu, J. A Dual-Side-Detuned Series–Series Compensated Resonant Converter for Wide Charging Region in a Wireless Power Transfer System. IEEE Trans. Ind. Electron. 2017, 65, 2177–2188. [Google Scholar] [CrossRef]
- Bertoluzzo, M.; Forato, M.; Sieni, E. Optimization of the Compensation Networks for WPT Systems. In Proceedings of the IECON 2018—44th Annual Conference of the IEEE Industrial Electronics Society, Washington, DC, USA, 21–23 October 2018; pp. 4828–4833. [Google Scholar]
- Deb, K.; Pratap, A.; Agarwal, S.; Meyarivan, T. A fast and elitist multiobjective genetic algorithm: NSGA-II. IEEE Trans. Evol. Comput. 2002, 6, 182–197. [Google Scholar] [CrossRef]
- Sieni, E.; Di Barba, P.; Dughiero, F.; Forzan, M. Self-adaptive migration NSGA and optimal design of inductors for magneto-fluid hyperthermia. Eng. Comput. 2018, 35, 1727–1746. [Google Scholar] [CrossRef]
- Zhang, W.; Wong, S.-C.; Tse, C.K.; Chen, Q. Design for Efficiency Optimization and Voltage Controllability of Series–Series Compensated Inductive Power Transfer Systems. IEEE Trans. Power Electron. 2013, 29, 191–200. [Google Scholar] [CrossRef]
- Jha, R.K.; Buja, G.; Bertoluzzo, M.; Giacomuzzi, S.; Mude, K.N. Performance Comparison of the One-Element Resonant EV Wireless Battery Chargers. IEEE Trans. Ind. Appl. 2018, 54, 2471–2482. [Google Scholar] [CrossRef]
- Wang, S.; Chen, J.; Hu, Z.; Rong, C.; Liu, M. Optimisation design for series–series dynamic WPT system maintaining stable transfer power. IET Power Electron. 2017, 10, 987–995. [Google Scholar] [CrossRef]
- Bertoluzzo, M.; Sieni, E. Optimal design of the compensation networks of an inductive wireless power transfer system. COMPEL Int. J. Comput. Math. Electr. Electron. Eng. 2019, 39, 231–238. [Google Scholar] [CrossRef]
- Schneider, J. Wireless Power Transfer for Light-Duty Plug-in/Electric Vehicles and Alignment Methodology; SAE International J2954 Taskforce: Warrendale, PA, USA, 2016. [Google Scholar]
- Di Barba, P.; Dughiero, F.; Forzan, M.; Sieni, E. SELF-adaptive Migration-NSGA algorithm: An application in uncertainty-tolerant magnetic field synthesis for MFH inductor design. Int. J. Appl. Electromagn. Mech. 2018, 56, 17–32. [Google Scholar] [CrossRef]
- Di Barba, P.; Mognaschi, M.E.; Lowther, D.A.; Sykulski, J.K. A Benchmark TEAM Problem for Multi-Objective Pareto Optimization of Electromagnetic Devices. IEEE Trans. Magn. 2017, 54, 1–4. [Google Scholar] [CrossRef]
- Di Barba, P.; Dughiero, F.; Forzan, M.; Mognaschi, M.E.; Sieni, E. New solutions to a multi-objective benchmark problem of induction heating: An application of computational biogeography and evolutionary algorithms. Arch. Electr. Eng. 2018, 67, 139–149. [Google Scholar] [CrossRef]
- Sieni, E.; Di Barba, P.; Forzan, M. Migration NSGA: Method to improve a non-elitist searching of Pareto front, with application in magnetics. Inverse Probl. Sci. Eng. 2015, 24, 543–566. [Google Scholar] [CrossRef]
- Di Barba, P.; Mognaschi, M.E.; Sieni, E. Many Objective Optimization of a Magnetic Micro–Electro–Mechanical (MEMS) Micromirror with Bounded MP-NSGA Algorithm. Mathematics 2020, 8, 1509. [Google Scholar] [CrossRef]
- Plackett, R.L.; Burman, J.P. The Design of Optimum Multifactorial Experiments. Biometrika 1946, 33, 305–325. [Google Scholar] [CrossRef]
- Design and Analysis of Experiments: Amazon.it: Douglas C. Montgomery: Libri in Altre Lingue. Available online: http://www.amazon.it/Design-Analysis-Experiments-Douglas-Montgomery/dp/1118146921 (accessed on 28 November 2014).
- Di Barba, P.; Dughiero, F.; Forzan, M.; Sieni, E. A Paretian Approach to Optimal Design with Uncertainties: Application in Induction Heating. IEEE Trans. Magn. 2014, 50, 917–920. [Google Scholar] [CrossRef]
- Di Barba, P.; Forzan, M.; Sieni, E.; Dughiero, F. Sensitivity-based optimal shape design of induction-heating devices. IET Sci. Meas. Technol. 2015, 9, 579–586. [Google Scholar] [CrossRef]
- Buja, G.; Bertoluzzo, M.; Mude, K.N. Design and Experimentation of WPT Charger for Electric City Car. IEEE Trans. Ind. Electron. 2015, 62, 7436–7447. [Google Scholar] [CrossRef]


© 2020 by the authors. Licensee MDPI, Basel, Switzerland. This article is an open access article distributed under the terms and conditions of the Creative Commons Attribution (CC BY) license (http://creativecommons.org/licenses/by/4.0/).