Article

International Trade Disputes over Renewable Energy—the Case of the Solar Photovoltaic Sector

by
Agnieszka Hajdukiewicz
and
Bożena Pera
*
Department of International Trade, Cracow University of Economics, ul. Rakowicka 27, 31-510 Kraków, Poland
*
Author to whom correspondence should be addressed.
Energies 2020, 13(2), 500; https://doi.org/10.3390/en13020500
Submission received: 13 December 2019 / Revised: 2 January 2020 / Accepted: 14 January 2020 / Published: 20 January 2020
(This article belongs to the Special Issue Political Economy of Energy Policies)

Abstract

:
The development of the renewable energy industry is a priority of economic policies in many countries, since it is viewed as one of the key growth sectors in the economy, playing also a very important role in mitigating climate change. At the international level, renewable energy is an issue of international cooperation but also an area of high trade tensions between countries. The main goal of this paper is to examine the nature and sources of recent trade disputes in the solar photovoltaic sector, which is the most dynamically growing sector in the green energy industry. In particular, the paper explores the links between the contemporary trade disputes and modern protectionism and between protectionist policies and practices and the export competitiveness in the growing sector of the economy. To achieve the aim of the study we explore in detail the WTO trade disputes over photovoltaic (PV) products, which occurred in the years 2007–2018. The products covered by the analysis were solar modules and cells classified under the HS code 854140. In our research we also used measures of descriptive statistics, hierarchical cluster analysis and revealed comparative advantage indexes. Our key results demonstrate the existence of links between protectionist policy causing trade conflicts and the export competitiveness. The research has also allowed us to identify problems of future studies concerning the association between trade protectionism and global value chains in the solar energy sector.

1. Introduction

The development of renewable energy industry is a priority of economic policies in many countries, including the world’s largest economies and top global players in the international trade —the US, China and the European Union. The renewable energy is often viewed as one of key growth sectors in the global economy [1,2,3,4,5]. New renewable energy technologies are also crucial in mitigating catastrophic climate change and achieving sustainable development goals [6,7,8,9,10].
Renewable energy development requires huge investment in research and development as well as in production capacity, which often exceeds the possibilities of a private sector. Therefore, governments play an important role in the growth of this industry, aiming through their economic policies to increase the international competitiveness of domestic producers. This is clearly the case in the solar photovoltaic (PV) sector, which drew our attention, because it is the most dynamically developing sector of the renewable energy industry. The growth rate of solar energy generation in 2018 was almost twice as high as the growth rate of renewable energy in total [11]. At the same time, due to the fact that this sector is at the relatively early stage of its development and it is an innovative one, it is characterized by growing competition and intensified technological struggle. Moreover, the cost of solar energy continues to plummet, and the improving price-performance ratio of solar technologies increases consumer demand, causing solar to be one of the most preferred energy sources. This in turn leads to the emergence of new export opportunities and increased competition for shares in global markets.
Facing enhanced foreign competition, solar manufacturers in many countries have been lobbied, with some success, for financial support and for barriers to free trade on solar products [12]. (Growing protectionism in the sector makes trade disputes a likely result both in bilateral relations as well as at the multilateral forum. While countries declare internationally the need for the energy collaboration, since almost a decade the key players in the industry have engaged in trade disputes over solar energy that have been brought to the World Trade Organization (WTO) and subject to the WTO dispute settlement mechanism (DSM).
Apart from trade disputes between countries initiated and settled in the WTO, there are numerous international investments disputes that have been recently spread in the renewable energy industry, affecting investment funds and companies in many countries, and being resolved through international arbitration [13,14].
The development of the solar panel sector has recently attracted the attention of many economists and researchers. The existing literature focuses mainly on the issues of solar panel technology and its economic efficiency, energy security as well as the ecological aspects of the development of renewables. Meanwhile, the trade-related aspects of renewable energy seem to be an under-explored area of research. In this paper we are going to look at the problems of development of this sector from the perspective of international trade, since we think this is a crucial determinant of the development of renewable energy adoption and transition to clean energy.
The main aim of the study is to examine the economic causes and nature of recent trade disputes over solar photovoltaic products, which are one of the main renewable energy sources. More specifically we would like to answer the following questions:
  • What trade disputes occurred in the solar energy sector in the years 2007–2018 (when solar power started to grow rapidly) and which countries participated in them?
  • What trade actions and protectionists measures have been applied in relation to these conflicts?
  • What was the competitive position of the countries involved in trade disputes?
  • Is there any correlation between the protectionist measures, trade disputes and the international competitiveness of the countries involved in trade conflicts?
First, in order to achieve the goals listed above, we will explore in detail trade disputes between the WTO members that arouse in the PV sector in the analyzed period of time. While we acknowledge the growing importance of investor-state disputes, arising from investors’ complaints over poor treatment in their host countries, yet in this paper we will focus our attention on conflicts between countries, being resolved, or at least partly addressed, at the multilateral forum of the WTO. We will analyze the type and nature of protectionist measures applied by trading partners in connection to these conflicts, at various stages of these conflicts. Then we will examine the trade performance and export competitiveness of the leading producers of solar panels and the connection between the international trade competitive position and their trade policies and practices. Finally, we will discuss the results of the analysis in the context of prospects and challenges for renewable energy development.

2. Literature Review
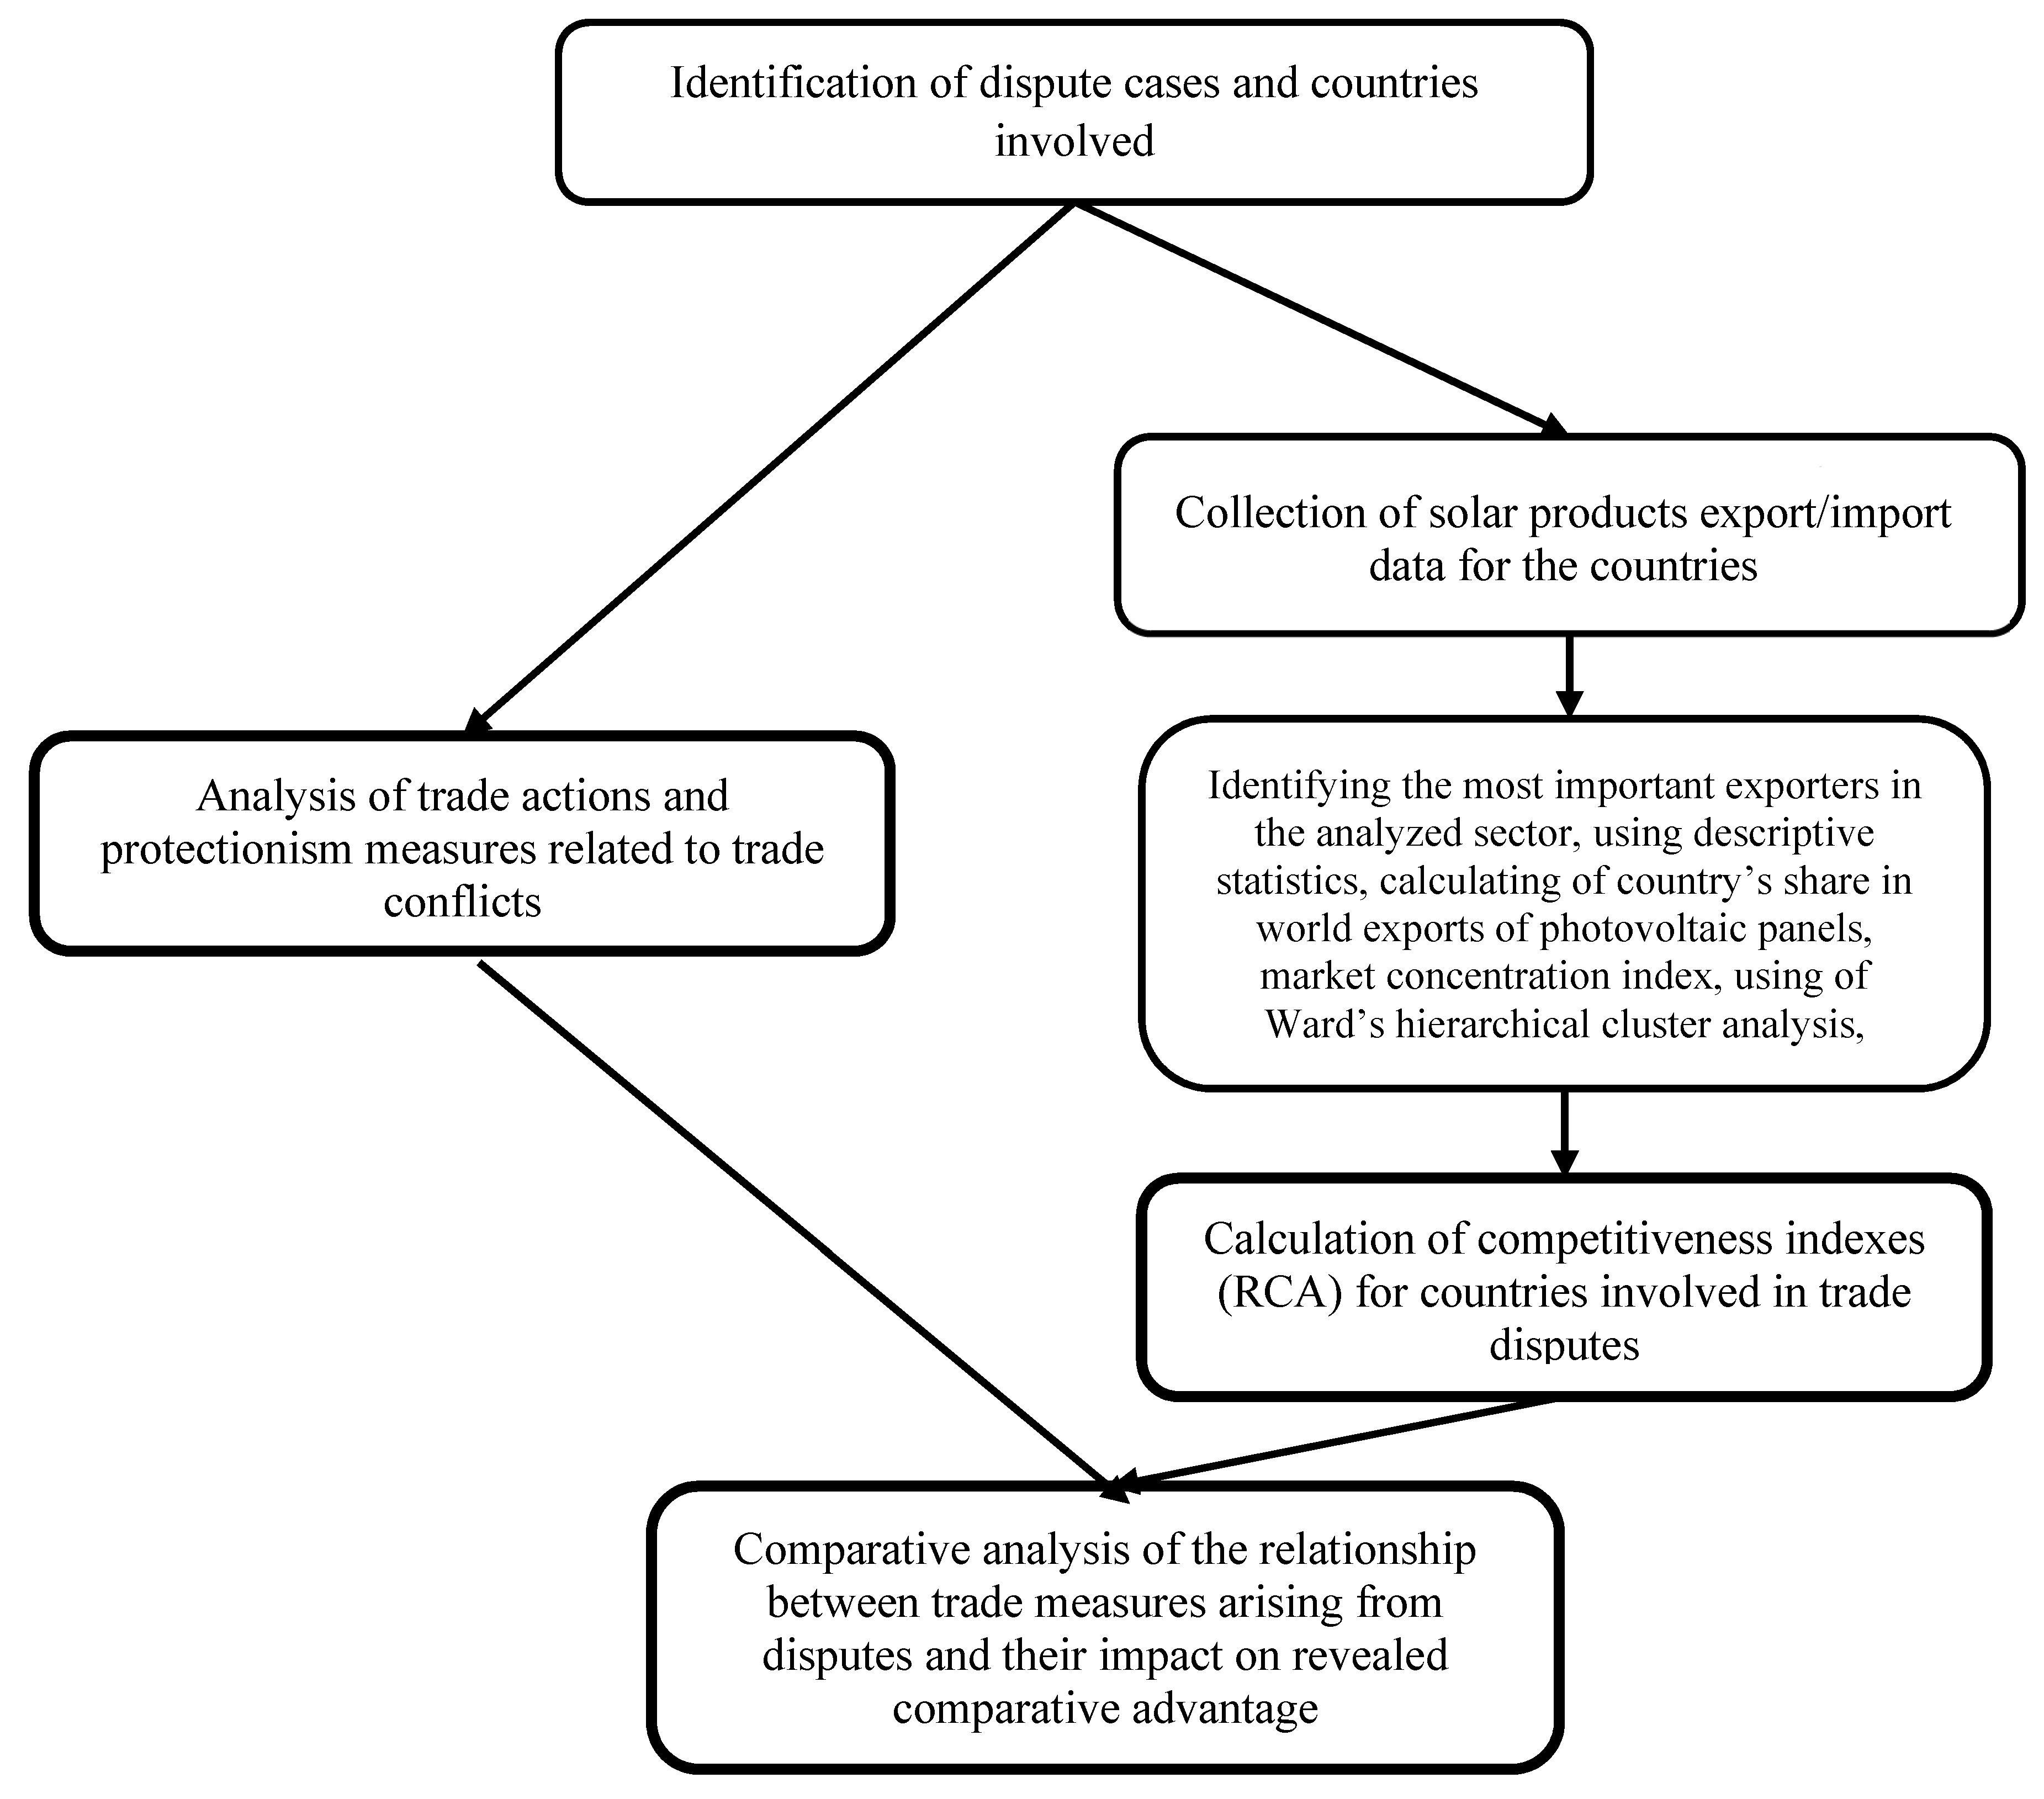
In general, the term “conflict” has two widely accepted meanings [15]. The first refers to overt conflict that is conceived as an argument, fight, or struggle. The second refers to subjective conflict-perception of one party that other party has opposing beliefs or interests, or that other has deprived or annoyed party in some way. The concept of subjective conflict seems to be very relevant for studying sources of trade conflicts, since international trade is an arena of clashing interests of various interest groups, associated with the international rivalry and cooperation.
According to the WTO, trade disputes which are subject to the rules and procedures of the WTO Dispute Settlement Understanding refer to situations in which a WTO member considers that any benefits accruing to it directly or indirectly under the covered agreements are being impaired by measures taken by another member [16]. Trade dispute arises when a WTO member adopts a trade policy or measure, or takes action in relation to one or more of its member(s), which may be considered as a breach or failure to fulfil its obligations under the WTO Agreements, and when a country takes possible action to resolve the situation (e.g., negotiations) [17]. Trade conflicts are closely linked to trade interests [18]. Trade disputes may have different trade effects for the complainant in relation to other exporters. The position of the complainant exporting country may affect the litigation allegiance of countries not involved in trade disputes [19]. Gordeeva [20] clearly distinguish trade conflicts from trade disputes. Trade conflicts escalate degree of tension and intensification of trade policy measures and trade measures are taken by both countries against each other, which is not the case in trade disputes. Trade conflicts can lead to trade war which is the highest degree of tension in relations between countries. The latter is associated with the application of prohibitive trade policy measures or placing other restrictions on the opposing country’s imports. Trade wars can result in large financial losses for the country against which they are applied and cause serial political consequences [20,21,22].
The numerical and computational methods are used to carry out economic analysis of trade conflicts. They can be based on two-player non-cooperative game in which countries choose their optimal tariffs as an instrument of retaliation [23,24]. Ossa [25] provided comprehensive quantitative analysis of cooperative and non-cooperative trade policies considering three types of tariffs: optimal tariffs used without fear of retaliation, Nash tariffs that could be imposed in trade war, and cooperative tariffs. The analysis revealed the potential gain from multilateral trade negotiations as well as results of worldwide trade war. Medium-run macroeconomic, sectoral production effects of a possible global trade conflicts using the WTO Global Trade Model were estimated by Bekkers and Teh [26]. They also considered large swings in sectoral production leading to substantial labour displacement.
International trade disputes are noted in solar energy field as well as in other renewables [27]. However, trade tensions in the solar sector seem to be stronger than in the wind power case between the US and China, which was the earliest signal of growing bilateral disagreements over green energy [28].
Nowadays, countries are not the only players involved in international disputes; apart from country-country conflicts, there has been a growing number of investor-country disputes arising in the solar sector. We observe several disputes in which host countries are being accused by investors of the rollback of the renewables regulations, which generate additional costs and inefficiencies for investors, in countries such as Spain, Italy or the Czech Republic [13,14]. According to Cosbey [14] the investor-state dispute settlement (ISDS) mechanisms in international treaties like The Energy Charter Treaty (ECT) may be good for renewable energy investors, but it may also hinder states in their broader pursuit of environmental objectives like addressing climate change.
We believe that in the solar energy sector, the global interest differences leading to trade conflicts have not been sufficiently investigated. The studies published so far focused primarily on issues of technology development [29,30,31,32,33], domestic policies in energy sector and their effects on the implementation of the sustainable development strategy [34,35,36,37,38,39,40,41,42,43]. Existing research on trade disputes in solar sector usually focus on a single case of conflict in bilateral relations only, for example between the EU and China [44,45] or the US and China [28,46,47,48], while in this paper we attempt to analyze a broader range of trade disputes.
According to Horn and Mayroidis [49] claims in disputes often relate to WTO rules and are closely bound up with protectionism. Trade concerns are often raised with regard to anti-dumping agreements, subsidies and countervailing duties and safeguard clauses [49,50]. Implementing trade measures can be also explained by infant industry argument and strategic trade policy theory. Emerging new industry (infant industry) is protected by the application of production subsidies on domestic production, as well as by imposing tariffs on imports and import quotas which should be reduced over the time [51,52,53,54,55,56]. Strategic interactions between the firms influence on active government intervention and create an opportunity for the government’s action. Moreover, specific and sensitive details of the market, supported by thorough quantitative knowledge of the relevant industries affect modifying the conditions of interaction considered in strategic trade policy [57]. This approach to the implementation of trade policy measures shows the government as the key player that can actively promote the strategic industries, shape the market by strategic action to enable domestic firms to gain the rents on the imperfectly competitive market and stimulate industrial sector to the growth in order to increase national income [58]. Etro [59] stressed dissemination of direct and indirect export subsidies in order to turn the domestic firm into an aggressive leader under both competition in price and quantities.
On the one hand protectionism applied to solar panels and renewable energy sector is viewed from the perspective of international law regulations [27,50] but on the other hand its economic impact is emphasized [60,61]. Studies indicate that protectionist measures may affect not only the countries involved in the dispute, but also other parties [47,62].
According to McCarthy [44] the trade restrictions imposed by the EU on Chinese solar photovoltaic (PV) manufacturers were both inefficient, since protectionist measures hurt the companies they aimed to protect, and ineffective, as those it sought to punish may have circumvented them. Hughes and Meckling [47] argue the US government’s decision to impose, and then expand, tariffs on a number of Chinese solar producers can be explained through a model of domestic politics, in which a coalition of domestic manufacturers and congressional interests formed a protectionist coalition that utilized US trade law to their advantage. In doing so they dominated and weakened a free trade coalition representing the majority of US solar photovoltaic companies. The studies carried out by Kuik, Branger and Quirion [63] using the gravity model of international trade show that the effect of domestic policy supporting renewable energy on competitive advantage in solar industry is significant (positively correlated) but brief.
Measures that are introduced to protect the domestic market often lead to trade-inhibiting protectionism [60,64]. They can affect trade flows [21], consumer demand [65], prices and welfare [22] thus having impact on global competition as well as on international competitiveness of market players. As Krugman [66] noticed the growing concern over competitiveness could lead to protectionism and trade conflicts or even trade wars. Therefore, further in our paper we would like to analyze the link between competitiveness, protectionism and trade disputes based on more than one case.

3. Research Method

The goal of the article is to examine the sources and nature of recent trade dispute over solar photovoltaic products. The years 2007–2018 were defined as the period of research.
The studies were carried out following the diagram provided below (Figure 1).
First, the trade disputes and conflicts over photovoltaic panels and main players (countries) involved in them were identified. For this purpose, we used the WTO Dispute Settlement Database. Then we deeply explored the WTO trade disputes, which occurred in solar energy sector over last decade, including those that have evolved into open conflicts that go beyond the WTO dispute settlement framework. We have also considered types of trade policy measures related to trade in solar panels. Research methods used in this study phase include: the literature review, official documents analysis, as well as case studies of selected trade disputes.
Secondly, statistical data on trade with solar panels from a range of sources were collected. We used the statistical data from International Trade Center Statistics (Trade Map) database and calculated Country’s Shares of World Exports Index of photovoltaic panels for the most important exporting countries in 2007–2018:
q i j   =   X i j X w j
where qij is the share of country i’s exports of product j in world exports of product j.
Then, analysis of changes in countries export’s share, supported by measures of descriptive statistics, was carried out. In order to better illustrate the changes in countries export shares of photovoltaic panels, three sub-periods were distinguished over the whole period considered (2007–2010, 2011–2014 and 2015–2018). Then Ward’s partitioning and squared Euclidean distance were used for hierarchical cluster analysis. Partitioning using Ward’s method enabled to maximize within-cluster homogeneity and between-cluster heterogeneity [67]. The analysis covered 19 countries with the largest export shares of photovoltaic panels in the world exports.
The commodity concentration index (Hn) for world exports of photovoltaic panels was also calculated.
H n   =   i   =   1 n ( x i j X w j ) 2
where xij is total value of country i’s exports of product j to the world and where Xwj refers to world exports of product j. In our case it can be defined as the square root of the sum of the squared share of exports to each destination as part of world exports of the products (industry). The value of the index ranges from 0 to 100. The lower is the value of the index, the less world exports is concentrated. A low value from 0 to 10 indicates a highly competitive industry with no dominant players. If countries have unequal share of exports and the value of index is 15–25 moderate concentration can be noted. Value exceeding 25 indicates high concentration.
Then Revealed Comparative Advantage Indexes (RCAs) for the countries involves in the disputes were calculated.
RCA indexes for their global trade were calculated by the product’s share in the country’s exports in relation to its share in world exports:
R C A i j   =   X i j X i t : X w j X w t
where Xij and Xwj are the values of country i’s exports of product j and world exports of product j and where Xit and Xwt refer to the country’s total exports and world total exports [68]. A value of less than unity implies that the country has a revealed comparative disadvantage in the product. Similarly, if the index exceeds unity, the country is said to have a revealed comparative advantage in the product.
The value of the index for bilateral revealed comparative advantage (BRCA) has the same meaning as the global RCA. The formula is expressed as:
B R C A i k j   =   X i k j X i k : X w k j X w k
where Xjik is exports of commodity j from country i to its partner country k, Xik is total exports from country i to country k, Xjwk is total world exports of commodity j to country k and Xwk is total world exports to country j.
The value of index varies from zero to infinity, where 0 means no exports in the group of products. If the value of RCA or BRCA index is over 1, a considered sector/industry is relatively competitive compared to the rest of economy [69]. The power of comparative advantage can be considered as four classes: (a) comparative disadvantage (0 < RCA   1 ), (b) a weak comparative advantage (1 < RCA 2 ), (c) moderate comparative advantage (2 < RCA   4 ). The value of RCA higher than 4 indicates the strong comparative advantage (class d) [70,71].
The products covered by the analysis are solar modules and cells classified under the code HS 854140. Finally, we looked for mutual link between protectionism, trade conflicts and the international competitiveness of the countries involved. We tried to find out, by comparative analysis of data in time series, if or how the rise in protectionism (evaluated on the basis of the application of new trade policy measures) was associated with the changes in competitiveness in the sector (measured by the international competitiveness indices), and how it could affect the number and the course of trade disputes over solar energy.

4. Results

4.1. Trade Disputes in the PV Industry in the Years 2007–2018

Between 2007 and 2018, 8 disputes in the PV sector were brought to WTO, of which 4 were initiated by China as a complainant, and the remaining ones by the US, Japan, India and the Republic of Korea, respectively. The US was the respondent in 5 disputes, while India, Canada and the European Union jointly with Italy and Greece were the respondents in one case each (Table 1). In all of these cases the direct reason of complaints was the imposition of trade measures related to the renewable energy sector.
In recent years, China has recorded tremendous growth both in total energy generation and the solar power generation, almost double the average for the world and significantly higher than in the EU and the US. On the supply side of the market, China is the world’s largest manufacturer of solar panel products. According to the International Energy Agency (IEA) more than 60% of the world’s solar panels are made in China. Currently the top 3 solar manufacturers in the world are Chinese companies: JinkoSolar, JA Solar, and Trina Solar. Government support, including generous subsidies and other forms of state incentives for high-technology research, development, and commercialization played an important role in promoting solar industry development in China [28].
China’s emergence as a major player in the global renewable energy industry has captured a lot of attention from the country’s trade partners, and especially from the main competitor within the industry—the United States. In March 2012, following four months of investigations, the US Commerce Department imposed countervailing duties on Chinese manufacturers of solar cells on the grounds that they had continued to receive subsidies from the Chinese government. Four months later, the United States decided to impose antidumping measures on Chinese solar panels in a separate investigation. The imposition of countervailing and antidumping tariffs by the United States on Chinese products in turn led China to filing the WTO complaint (DS DS437) against US countervailing duties. China challenged several aspects of countervailing duty investigations, including their opening, conduct and the preliminary and final determinations that led to the imposition of restrictive measures [72]. China also challenged the “rebuttable presumption” allegedly established and applied by the US Department of Commerce that majority government ownership is sufficient to consider an enterprise as a “public body” [73]. The dispute went through subsequent stages of the WTO dispute settlement: consultations, panel proceedings, appellate proceedings, arbitration, the recourse by China and again appellate proceedings but it has not been resolved and its current status is still “pending”.
The pending conflict and the continuation of subsidization of solar panel industry by China appear to suggest that the United States has been far from successful in addressing China’s alleged protectionist measures in this sector within the WTO dispute settlement mechanism and was not able to persuade China to modify its policy and practices. On January 22nd, 2018, the US Administration decided to act quickly and unilaterally, imposing as high as 30% safeguard tariff on solar imports to the United States [74]. The tariff covers both imported solar cells, a key input to manufacturing solar panels, and solar modules. The tariff will last for four years and will fall by 5% annually, dropping to a 15% tariff in 2021 [48]. This move was recommended by the United States International Trade Commission (USITC) based on the petitions from the domestic manufacturers (such as Suniva and SolarWorld) and a USITC investigation under Section 201 of the Trade Act of 1974. The investigation found that, between 2012 and 2017, twenty-five companies based in the US declared bankruptcy and withdrawn from the market. Meanwhile, imports of solar cells and modules had increased 500% and prices had fallen around 60%. The ITC connected these conclusions to the results of Department of Commerce investigation that reported that China had been continuously providing subsidies to their solar manufacturers to overcome existing US restrictions [75]. The ITC investigation’s conclusion was that solar products were being imported into the United States in such increased quantities that it caused substantial cause of serious injury, or the threat thereof, to the domestic industry, giving the US President the right to impose protective tariffs on imports of solar panels, in compliance with the US trade law.
China responded filing the complaint to the WTO (DS562, DS563). In a separate case also Republic of Korea filed a similar complaint (DS545), as it was also hit by increased tariffs. Both US trade partners claimed that the trade measures applied by the US in solar sector appear to be inconsistent with the WTO rules. China’s Ministry of Commerce stated that the imposition of these measures by the US is a serious problem for the trading system. According to China’s officials such a measure undermines the predictability and certainty the multilateral system seeks to provide to all trading countries [77].
The conflict between the US and China has undoubtedly captured considerable external attention but it is worth noting that there are many other tensions over solar energy in bilateral relations between other countries (e.g., US—India and China—the EU). In the case brought to the WTO by the US against India (DS456) the United States challenged elements of India’s program, known as India’s Jawaharlal Nehru National Solar Mission (“JNNSM”) Programme, because it allegedly accorded less favorable treatment to imported solar cells and modules as compared to cells and modules manufactured in India. Imported products are prevented from competing under the same conditions as domestically produced cells and modules due to existing domestic content requirement (DRC) in government purchases of solar energy from solar power developers. As such, according to the US administration, the JNNSM Programme measures and incentives are inconsistent with India’s WTO obligations [78]. The conflict is still pending. India filed its own complaint in 2016 (DS510) regarding certain measures of the United States implemented at the state and local level relating to alleged domestic content requirements and subsidies in the energy sector. In the still pending dispute the US argue that India has failed to provide evidence that any of the measures at issue in this dispute are inconsistent with WTO rules.
In another separate dispute, Japan filed a complaint against Canada (DS412) regarding Feed-in Tariff Program of the Province of Ontario (the FIT Programme), claiming that the measures under the programme were inconsistent with Canada’s obligations under WTO as they accorded less favorable treatment to imported equipment than that offered to like products originating in Ontario and that they created illegal subsidy, contingent upon the use of domestic over imported goods. It is worth mentioning that in this case the complaint went through panel investigation and appellation and ended with the adoption of the DSB recommendations by Canada in June 2014. Canada had adopted its regulations to the DSB decision by removing domestic requirements in large renewable electricity procurements and significantly lowered the domestic content requirements for small and micro procurement of wind and solar electricity under the FIT Program [79].
Another conflict over several issues regarding the trade with solar panels also occurred in bilateral relations between the European Union and China, but for the most part it has been resolved through bilateral consultation and negotiation. In the case brought to the WTO by China in 2012, Beijing targeted mainly (but not only) Italy and Greece, for using certain measures, including domestic content restrictions [80]. However, the dispute did not move beyond the first phase of consultations at the WTO. After a fifteen-month investigation for the anti-dumping case and thirteen month investigation for the anti-subsidy case, on 5 June 2013, the European Commission imposed provisional anti-dumping duties on imports of solar panels, cells and wafers from China, averaging 47.7%. During these investigations the Commission found that Chinese companies were selling solar panels in Europe at the price level far below their normal value and were receiving illegal subsidies. According to the EC’s findings that caused significant harm to EU solar panel producers. The Commission’s assessment indicated that imposing provisional measures would not only secure the existing 25,000 jobs in EU solar production, but would also create new jobs in the sector [81]. However, soon after that, on 2 August 2013 the Commission accepted a voluntary undertaking offered by the majority of Chinese solar panel exporters in which they committed to stop dumping and keep prices above a certain level. In return, those companies who participate in the undertaking (representing about 75% of Chinese solar panel exports to the EU) were not subject the anti-dumping duties. The rest of Chinese export as well as exports above certain levels were covered by the average anti-dumping duty [82]. As it was in the case of the US—China disputes some researchers criticized the import restrictions, arguing that imposing trade barrier policy was both inefficient, as it both hurt the companies it aimed to protect due to destruction of market value, and ineffective, as the Chinese producers might have circumvented it through the reorganization of their operations [44]. In 2018 European Union decided to end anti-dumping measures on China’s products that were in place since 2013 after considering the needs of producers and taking into account the community’s renewable energy targets [83].
The analysis showed that countries with conflicting interests over solar panels used to address their trade concerns at the WTO forum. However, since some of the countries are currently locked in a broader trade dispute, it would be difficult to settle the conflicts in solar sector without sorting out other trade differences. Therefore, the WTO is not the only forum to search for resolution of trade tensions. The role of plurilateral forums such as G20 summits, Energy Charter conferences as well as bilateral meetings has been growing in importance in mitigating trade disputes. For instance, in the case of the ongoing US—China trade war the main dialog seems to take place during G20 summits and through bilateral negotiations outside the WTO.
As shown in Table 1, there are mainly two types of measures challenged in trade disputes over solar panels: remedy measures, such as countervailing duties or safeguards measures in the form of increased import tariffs, and domestic content requirements which belong to non-tariff measures and are related to governmental subsidies within programmes aimed at boosting solar panel installations, but in several cases have been criticized by trade partners for according less favorable treatment to imported solar cells and modules as compared to domestically produced solar products. Thus, domestic content requirements were mainly questioned as being not in compliance with the Art. X: 3 GATT 1994 (national treatment). In case of remedy measures their use was preceded by some actions taken by a partner party, which may be considered as a breach or failure to fulfil its obligations under the WTO Agreements or which caused, or which was threatening to cause, serious injury to the industry. While we do not intend and we are not able (due to lack of information) to judge if the application of these measures was justified and with the compliance with the WTO rules, we will try to look at them from the perspective of a country’s international competitiveness and to investigate whether the country which introduced such a measure has previously experienced erosion of its competitive advantage.

4.2. International Competitiveness in Trade with Solar Panels of Selected Countries

The analysis on international competitiveness of the countries involved in trade disputes will be preceded by looking at selected characteristics of the top exporters of photovoltaic panels in the world.
On the basis of descriptive statistics, it can be noticed that there is a very wide variation within the group of countries which were the 19 top exporters (initially, the analysis was planned to cover 20 top countries and zones; however, one of the less significant entities, i.e., free zones, was excluded from further research.) in 2018. The study group was heterogeneous. During the period considered, this variation remained at a similar level. It was confirmed by coefficient variation. Although export shares in world exports of photovoltaic panels increased over 2007–2018, the group included countries whose export share of photovoltaic panel amounts less than 0.01%, while on the other hand, there was a country exporting more than 1/3 of the world’s exports. When considering groups of countries, most of them recorded share of exports of photovoltaic panels below 5%, which was confirmed by the mean value and median and skewness index (Table 2).
The European Union and 18 countries covered by the analysis accounted for almost 100% of world exports of photovoltaic panels, while the share of entities involved in trade disputes were over 78% at the beginning of the analyzed period, but finally decreased by about 10 percentage points in 2018. However, over the period considered, the importance of countries not involved in trade disputes has increased. Nothing the huge significance of 19 countries/group of countries in world exports, the global market for solar energy panels seems to be relatively highly concentrated, as the value amounted to 41 in 2018 (the value exceeds 25) (Figure 2).
A more detailed study enabling us to identify the countries will be carried out using the hierarchical cluster analysis (Ward clustering).
Only in the first sub-period China and the European Union noted the similar shares of more than 20% of the world’s exports. During the same period, there was also a tremendously increase in the Chinese share of the 19.2% in 2007 to almost 35% of world export in 2010. Since that year China has become the largest exporter of photovoltaic panels with more than 30% of world exports and a separate cluster in the next two sub-periods. The EU share in world exports decreased by around 2.5 p.p. during 2007 and 2010. In the next sub-period EU share fell drastically from 21.8% in 2011 to 13.6% in 2014. In 2015–2017, it has slightly declined by about 1.0 percentage point in comparison with 2014, while in the last year of analysis EU share increased to 13.4% of the global exports. In the last sub-period, the EU, similar to China, was a separate cluster. However, their share of world exports varied considerably. There has also been a sharp decline in the Japanese share of photovoltaic exports from 20% in 2007 to around 9% of world exports in 2010. Between 2011 and 2014 the EU and Japan, together with Taipei belonged to one group. The average share of these countries was about 10% of global exports the further weakening of the Japanese position (by more than 1 p.p.) has brought it into the cluster together with the USA and South Korea. Both countries (South Korea and the US) belonged to the same cluster throughout the period considered. The average US share between 2007 and 2010 was around 5.8% and 3% of world exports in the case of South Korea. However, in subsequent sub-periods there were changes in their export share. In case of Korea, the share increased to around 8%, while US share decreased to 4.85% of world exports in 2018. Malaysia and Singapore (with the exception of 2007–2010) belonged to the same group as South Korea and the US. Their market share in the world photovoltaic solar panel exports showed an increasing trend. At the end of the period covered by analysis Malaysia reached 8.5% market share, while Singapore had around 4% of world exports between 2015–2017, but only 3.2% in 2018 (similarly to 2011–2014). This group of countries was relatively homogenous in the years 2011–2014 and 2015–2018 in relation to other multi-objects clusters. The highest level of heterogeneity can be observed in the case of cluster formed by countries with relatively low share in the world exports of photovoltaic panels. Only India and Canada belonged to it among all the countries involved in trade disputes over solar energy. Throughout the period considered (2007–2018), Canada and India were included in the cluster of countries with relatively minor shares (mean for the cluster below 1% of world exports). The analysis of descriptive statistics for particular clusters of countries confirmed the differences among the countries in terms of share in world exports (Table 3).
The analysis on international competitiveness of the countries involved in trade disputes (both as complainants and respondents) over solar energy, showed that Asian countries, except India, maintained a revealed comparative advantage in this group of products. Two Asian countries: Malaysia and Singapore, which are not involved in trade disputes, were also included in the survey. They are benchmarks for changes in export competitiveness of countries taking part in the WTO disputes as complainants or respondents.
The Figure 3 distinguishes China as the lonely export leader on the photovoltaic panel market, having stable position in the share of world market and maintaining a revealed comparative advantage. Not surprisingly, China revealed the highest comparative advantage in global trade in solar panels, with the RCA index reaching the peak in the year 2011, after which it started to slightly decline and rose again in in years 2017 and 2018. Malaysia, not being involved in any trade disputes, can be classified as an effective captor of market opportunities. Japan, South Korea and Singapore (the latter country is not involved in any trade disputes) can be considered followers. Republic of Korea developed international competitiveness, with the RCAs only slightly lower than China. Japan possessed a comparative advantage as well, albeit it has considerably decreased over the analyzed period, showing again an upward trend only from 2017. The European Union in particular, but also the United States can be viewed as losers. Neither of them have taken advantage of their position in the global market. India and Canada are insignificant players. For all those countries, including the EU and the US, the data indicate that they did not have a comparative advantage in the global trade with this group of products, reporting a further decline of competitive position over the years (Figure 3 and Table 4).
With regard to trade disputes the results of the study seem to suggest that the restrictions imposed on the Chinese import can be explained by the willingness of other exporting countries to counteract the trend of widening the international competitiveness gap. However, it should be noted that the comparative advantage for such global players as the EU and the US did not exist throughout the analyzed period of time, so the argument of “losing” competitiveness, often used by domestic politicians, does not seem to be precise or relevant in this case. Moreover, their trade remedies actions do not seem to affect the China’s competitiveness, which is still very high.
The analysis of modified RCA indexes for selected bilateral trade flows shows a more detailed picture of the international competition in the sector. China had a comparative advantage in trade with the US until 2015. But the data showed a decline in RCA values, leading finally to the loss of China’s comparative advantage in exporting to the US market. In 2018 more rapid decrease of RCA value was observed for the China’s bilateral trade with the US, which might indicate that the protectionist measures imposed by the US began to take effect on their bilateral trade results. China revealed a comparative advantage in relations with the EU, albeit it has also showed a downward trend in recent years. Both the US and the EU did not have comparative advantage in their bilateral relations with China, and no bigger changes have been observed in the level of RCA throughout the years (Table 4).
Regarding other bilateral trade flows of the analyzed countries, the following observations have been made:
-
The RCA values for the US trade with India have been fluctuating, with the US gaining, then losing a comparative advantage and obtaining it again in 2018. India did not have a competitive advantage in its trade with the US over the analyzed period of time (Table 4);
-
Japan possessed a comparative advantage in its trade with Canada in the analyzed years (except 2011). Canada, on the other hand, did not have a comparative advantage in solar products trade with Japan (Table 4);
-
Republic of Korea developed a strong comparative advantage in bilateral trade with the US in the second part of the analyzed period of time; the RCA values showed a strong upward trend, reaching a peak in 2017. The US did not have a comparative advantage in trade exchange with Rep. of Korea, with the RCA values decreasing steadily over the years (Table 4);
-
Malaysia, the only country covered by the analysis, which has not been directly involved in trade disputes, recorded high values of indexes and a growing trend in competitiveness, both globally and in bilateral relations (Table 4). However, according to the USTR Office, Chinese producers moved a big part of their production capacities to Malaysia to avoid antidumping and countervailing duties launched by the US administration in 2012 [75].
Based on the results of the data analysis, it was found that all the countries which filed a WTO complaint after being targeted by remedy measures faced some deterioration of their export competitiveness in their bilateral trade with countries who were respondents in the disputes. However, this did not always lead to a loss of comparative advantage nor cause the loss of global competitiveness measured by RCA with the rest of the world (Table 4).
It is difficult to foreseen if the bilateral tensions and trade war between the US and China would affect international competition and trade in PV sector in future. Recent reports show that China managed to redirect a part of it exports to new markets such as Mexico and Australia [85], which may counteract export losses in the US market. Despite the rise of protectionism, the level of the China’s exports remains high and the export growth rate only slightly decreased in 2018 as compared to 2017.
However, the data on world’s trade in solar panels show a sharp decline of global exports value in 2018 to 21, 3 billion USD, after being stable in previous years around the level of 50 billion USD. It may indicate that the current trade conflict between world’s superpowers started to strongly affect global and sectoral trade, which may hinder the sector’s growth.

5. Discussion

In all of the analyzed cases, the application of certain protectionist measures by major players in the solar panel sector was the main reason for submitting a complaint to the WTO. According to the complaining parties the questioned trade measures were of protectionist nature, violating the WTO rules and created a market barrier restricting imports of solars and protecting domestic industries from foreign competitors. Thus, it allegedly effected competition, causing market distortions.
The most obvious limitation in this research is that due to the complex nature of protectionist measures, which include not only tariffs but also non-tariff measures, it is difficult to measure their direct impact on the global market. Since our study is an introductory one, and we faced some data constraints, we used only qualitative methods to explore the potential links between protectionism, trade conflicts and international competitiveness.
Also, the study does not investigate the implications of global value chains for a country’s export competitiveness in solar energy sector.
Our analysis showed, that protectionist policies in the sector are closely related to the current situation in the renewable energy industry, which is characterized by fast growing demand and supply, a tough competition for market shares in the expanding market, the domination of China on the supply side and it’s quickly growing solar energy consumption. China’s emergence as a major player in the global renewable energy industry and its sectoral policies have captured considerable attention of its main trade partners, several of them accusing China of alleged unfair practices in solar panel trade. This led to raising trade tensions, especially in the bilateral relations with the US. The analysis of conflicts between the US and China in the solar panel sector has shown the changing policy approach of the US to the trade tensions and the ways of settling the disputes, from relying for the most part on the WTO Dispute Settlement procedures to unilateral trade remedies actions based on the Trade Act of 1974.
New tariffs raise market barriers to foreign competition, mainly from China and Korea, in the United States for manufactured solar cells and modules. The purpose of the new import restrictions is to protect domestic manufacturers with the aim to revive the rising US solar panel production industry. However, a number of experts and supporters of freer trade argue [3,86,87], that while the tariffs may protect the US solar panel producers, most jobs in the US solar industry are in supporting industries like installation rather than in panel manufacturing. This means more US jobs could be threatened from this new policy rather than would be protected. According to The Solar Energy Industries Association (SEIA), around 23,000 jobs may be lost due to new tariffs, as with hardware costs increased as a result of import duties, many solar projects will be delayed or cancelled [88]. Reuters reports that US companies have stopped or suspended $2.5 billion in large PV installation projects due to the increased tariffs on solar panels [89].
So far, the trade remedies actions did not seem to threaten global competitiveness of Chinese solar producers. Nor they seem to persuade China to modify its policy and practices, including massive subsidies. On one hand, it raises questions about the effectiveness of trade remedies measures, especially when taking into account the role of global value chains in the sector, in which imported intermediate goods are often used in domestic production. When these goods are subject to tariffs, domestic producers and consumers in the country imposing the tariffs may also suffer. Thus, it can impede the efforts towards transition of the economies to clean energy.
On the other hand, it rises doubts regarding the role of the WTO in resolving conflicts, as most of the conflicts are still pending and the parties involved did not seem to be successful in addressing other countries’ alleged protectionist measures. At the same time according to the WTO Director-General Roberto Azevedo “actions taken outside these collective processes greatly increase the risk of escalation in a confrontation that will have no winners, and which could quickly lead to a less stable trading system” [90].
More immediate effects of trade remedies actions on international competitiveness can be observed in bilateral relations of countries involved in disputes. China’s comparative advantage has eroded in its bilateral trade with the US, which may be partly explained by the imposition of new trade restrictions by the US. Also, the China’s RCA values in bilateral exchange with the EU showed a downward trend, even if China still has a strong comparative advantage in exporting into the European market. The question however remains, how these developments can affect the global China’s competitiveness in future and how they will affect the growth of the industry.
A number of scientists point out that a broad constellation of increasingly powerful political interests in the rising industry of renewable energy [36,91], leading to more protectionist trade policies and more conflicts in international trade, might not support the farsighted public policies needed for the world to achieve widely expected goals of deep decarbonization and sustainable development.
The negative effects of trade conflicts between WTO member countries on the solar sector and transition to clean energy can be reinforced by another type of conflicts, which have also spread in the renewable industry: country–investor disputes. Existing international investment law allows investors to sue governments for the loss of profits resulting from regulation changes, on the ground of the violation of the fair and equitable treatment (FET). This was the case in more than 30 arbitrations, which have been initiated against Spain by investors who owned photovoltaic installations in Spain, arguing that the evolution of the special regulatory framework created instability and lack of clarity which violated their legitimate expectations [14]. While the current ISDS regime provide foreign investors with broad protection, it may hinder states’ right to regulate to achieve sustainable development objectives.

6. Conclusions

The aim of this paper was to explore the sources and nature of contemporary trade conflicts between WTO members in the solar energy sector and to find out potential links between protectionism, WTO trade disputes and the export competitiveness of the countries involved. Several conclusions can be drawn from this study:
  • The WTO disputes over solar energy—in spite of being a relatively new area of trade conflicts (the first dispute was brought into the WTO in 2012)—already involve almost all of the leading producers and exporters of solar panels—the most active participants of these disputes were the USA and China. Moreover, with many other countries participating in the solar energy disputes as third parties, they became an issue of great interest and concern among the WTO membership. Most of them have not been resolved yet and their “pending” status may not be quickly changed, due to their complexity and the high level of global trade tensions. Disputes in this sector revealed highly divergent interests between global players in accordance with the theory of subjective conflicts. This is not the only type of contemporary conflicts in the solar sector, since apart from conflicts between countries, there are numerous investor-country disputes over the regulatory issues that have been recently spread in the renewable energy industry.
  • The results show that there are mainly two types of measures challenged in trade disputes over solar panels: remedy measures, such as countervailing duties, anti-dumping duties or safeguards measures (in the form of increased import tariffs); and domestic content requirements, which are often questioned as being a violation of national treatment obligations. The application of protectionist measures can be related to the situation in the sector, which is at the early stage of development, characterized by dynamic growth and strong rivalry between companies competing for export shares in the growing market, with a significant involvement of governments in supporting domestic renewable energy sectors. Protectionism in this sector can be explained on the grounds of the theory of infant industry and strategic trade policy arguments. Application of new trade measures seems to be motivated to a high extent by aiming to protect a new industry and to support domestic companies acting in the highly competitive market.
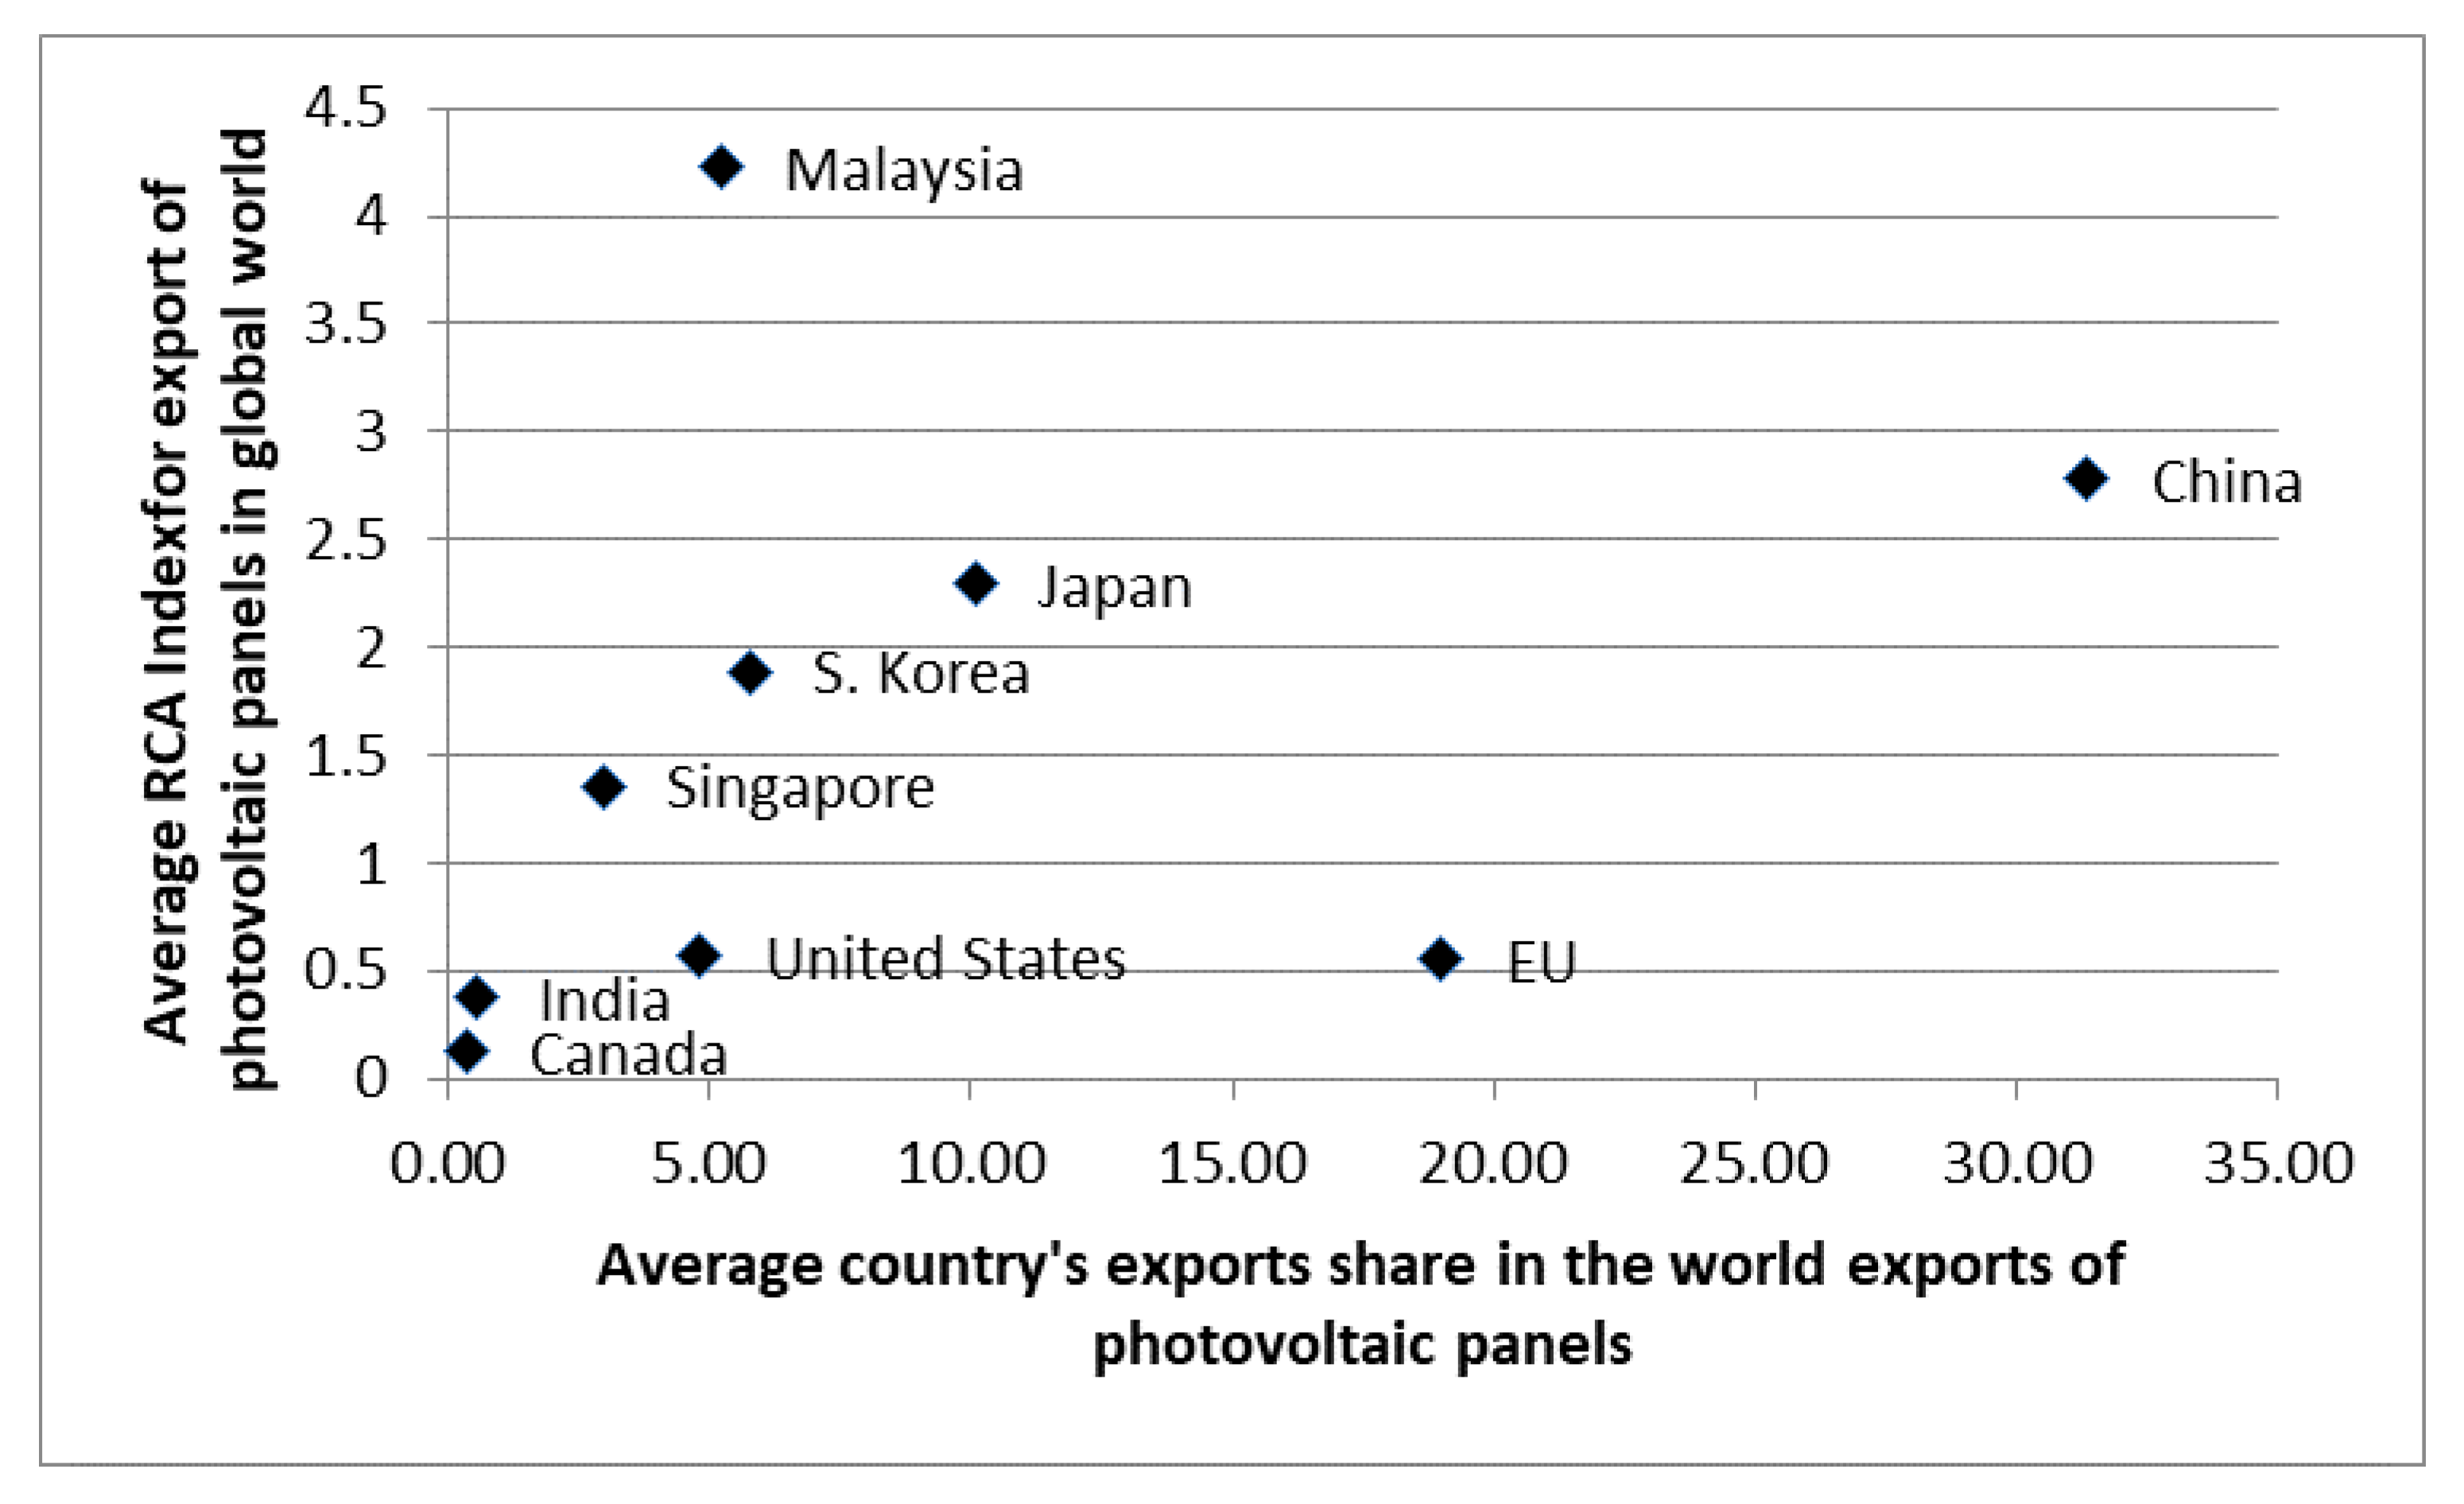
  • The analysis of the international trade competitiveness revealed that China had the highest and relatively stable comparative advantage in global trade in solar panels over the analyzed period, while other countries recorded lower or not existing (as in the case of the EU and the US) comparative advantage. The study also showed the US and the EU have been losing the distance to China prior to the conflicts.
  • The study confirmed the existing link between the application of new trade measures, the occurrence of trade disputes and changes in countries’ international competitiveness. The countries targeted by new measures filed the WTO complaints, claiming that they appear to be inconsistent with the WTO rules, while respondents indicated that they have right to protect their industry against the unfair trade practices causing losses to producers and that the measures used are in compliance with the WTO rule and that they do not infringe their WTO obligations. The link between trade disputes and competitiveness was partly confirmed through the research. Complainants in the disputes recorded some deterioration of their export competitiveness in their bilateral trade with countries who were respondents in the disputes. However, the interesting and somewhat unexpected finding is that this did not always result in a loss of comparative advantage of the complaining party (e.g., China) nor cause the loss of its global competitiveness measured by RCA with the rest of the world.
Despite the existing limitations, this study makes some contributions to the current state of research, shedding more light on the differences of trade interests between global players in the solar energy sector leading to trade conflicts, arguments used to justify protectionism in solar panels trade and some ways of settling international trade disputes.
The findings of our research contribute to a deeper understanding of the causes and scale of contemporary trade conflicts over solar energy and has practical implications for governments, institutions and businesses that need to take into account the negative implications of trade disputes for the development of renewable energy technology and transition to clean energy. The achievement of some ambitious sustainable development goals may be threatened by rising trade protectionism in the solar sector. Therefore, the decision-making bodies should understand the need for undertaking actions towards settling the international trade disputes and for closer cooperation on sustainable development and its energy dimension.
Based on the current situation in the global solar sector and our findings, we suggest that future research can focus on the effectiveness of protectionist measures and their impact on global value chains in this sector as well as on the implications of trade protectionism for the future development of renewable energy industry.

Author Contributions

This paper is a result of the full collaboration of the authors. The contribution of co-authors is equal and amounts 50% for each of them. Conceptualization, A.H. and B.P.; Methodology A.H. and B.P. Formal analysis and investigation A.H. and B.P.; writing the literature review, introduction and conclusions–A.H. and B.P. All authors have read and agreed to the published version of the manuscript.

Funding

This publication is financed with the subsidy granted to the Cracow University of Economics.

Acknowledgments

This publication is financed from the funds allocated to the Cracow University of Economics in the framework of grants for maintaining research potentials.

Conflicts of Interest

The authors declare no conflict of interest.

Abbreviations

The following abbreviations are used:
BPBritish Petroleum
BRCABilateral Revealed Comparative Advantage
DSDispute
DSMDispute Settlement Mechanism
ECEuropean Commission
ECTEnergy Charter Treaty
EUEuropean Union
FETFair and Equitable Treatment
FITFeed-in Tariff
GATTGeneral Agreement on Tariffs and Trade
HSHarmonized System
IEAInternational Energy Agency
ISDSInvestor-state Dispute Settlement
JNNSMJawaharlal Nehru National Solar Mission
NTMsNon-tariff Measures
PVPhotovoltaic
RCARevealed Comparative Advantage
TRIMsTrade-Related Investment Measures
USUnited States
USITCUnited States Trade Representative
USTRUnited States Trade Representative
WTOWorld Trade Organization

References

  1. Gielena, D.; Boshella, F.; Sayginb, D.; Bazilianc, M.D.; Wagnera, N.; Gorinia, R. The role of renewable energy in the global energy transformation. Energy Strategy Rev. 2019, 24, 38–50. [Google Scholar] [CrossRef]
  2. Vasylieva, T.; Luylyuw, O.; Bilan, Y.; Streimikiene, D. Sustainable Economic Development and Greenhouse Gas Emmissions: The Dynamic Impact of Renewable Energy Consumption, GDP, and Corruption. Energies 2019, 12, 3289. [Google Scholar] [CrossRef] [Green Version]
  3. SolarPower Europe. Global Market Outlook for Solar Power, 2018-2022, Brussels, Belgium. Available online: http://www.solarpowereurope.org/global-market-outlook-2018-2022 (accessed on 21 May 2019).
  4. IRENA. Global Energy Transformation: A Roadmap to 2050, 2019th ed.; International Renewable Energy Agency: Abu Dhabi, UAE, 2019. [Google Scholar]
  5. Aleksandrow, S.; Staniszewska, M. The Importance of Renewable Energy Sources in a Global Economy and Their Impact on the Labour Market. Acta Innov. 2013, 6, 39–43. [Google Scholar]
  6. Kabira, E.; Kumarb, P.; Kumarc, S.; Adelodund, A.A.; Kim, K.-H. Solar energy: Potential and future prospects. Renew. Sustain. Energy Rev. 2018, 82, 894–900. [Google Scholar] [CrossRef]
  7. Sampaio, P.G.V.; González, M.O.A. Photovoltaic solar energy: Conceptual framework. Renew. Sustain. Energy Rev. 2017, 74, 590–601. [Google Scholar] [CrossRef]
  8. Doyle, E.; Perez-Alaniz, M. From the Concept to the Measurement of Sustainable Competitiveness: Social and Environmental Aspects. Entrep. Bus. Econ. Rev. 2017, 5, 35–59. [Google Scholar] [CrossRef] [Green Version]
  9. Kalogirou, S.A. Environmental benefits of domestic solar energy systems. Energy Convers. Manag. 2004, 45, 3075–3092. [Google Scholar] [CrossRef]
  10. Dincer, I. Renewable energy and sustainable development: A crucial review. Renew. Sustain. Energy Rev. 2000, 4, 157–175. [Google Scholar] [CrossRef]
  11. BP. BP Statistical Review of World Energy 2019, 68th ed.; BP: London, UK, 2019. [Google Scholar]
  12. Sivaram, V. The Dark Side of Solar. In How the Rising Solar Industry Empowers Political Interests that Could Impede a Clean Energy Transition; Brookings: Washington, WA, USA, 2018. [Google Scholar]
  13. Arcos-Vargas, A.; Nuñez, F.; Vivas, J. Efficiency improvements in the PV plants market: An application to the Spanish case. Int. J. Energy Sect. Manag. 2019, 13, 229–254. [Google Scholar] [CrossRef]
  14. Cosbey, A. Can Investor–State Dispute Settlement be Good for the Environment? IISD: Ottawa, ON, Canada, 2017; Available online: http://www.iisd.org/library/can-investor-state-dispute-settlement-be-good-environment (accessed on 29 December 2019).
  15. Pruit, D.G. Social Conflict: Some Basic Principles. J. Disput. Resolut. 2007, 151–156. Available online: https://scholarship.law.missouri.edu/jdr/vol2007/iss1/8 (accessed on 15 June 2019).
  16. WTO. WTO Dispute Settlement. 2019. Available online: https://www.wto.org/english/tratop_e/dispu_e/dispu_e.htm (accessed on 15 May 2019).
  17. WTO. WTO Understanding the WTO: Settling Disputes. A unique contribution. 2019. Available online: https://www.wto.org/english/thewto_e/whatis_e/tif_e/disp1_e.htm (accessed on 15 May 2019).
  18. Horn, H.; Mavroidis, P.C.; Nordström, H. Is the use of the WTO Dispute Settlement System Biased? In The WTO and International Trade Law/Dispute Settlement; Mavroidis, P.C., Sykes, A., Eds.; Edward Elgar: Cheltenham, Gloucestershire, UK, 2005; pp. 454–486. [Google Scholar]
  19. Bown, C.P.; Reynolds, K.M. Trade Flows and Trade Disputes. Rev. Int. Organ. 2015, 10, 145–177. [Google Scholar] [CrossRef]
  20. Gordeeva, T. International trade disputes in modern regulatory paradigm. Int. Econ. Policy 2013, 2, 96–118. [Google Scholar]
  21. Bellora, C.; Fontagné, L. Shooting Oneself in the Foot? Trade War and Global Value Chains, Presented at the 2nd Annual Conference on Global Economic Analysis, Warsaw, Poland, 19–21 June 2019; Global Trade Analysis Project (GTAP); Purdue University: West Lafayette, IN, USA, 2019. [Google Scholar]
  22. Amiti, M.; Redding, S.J.; Weinstein, D.E. The Impact of the 2018 Trade War on U.S. Prices and Welfare, CEPR Discussion Paper DP 13564. 2019. Available online: https://cepr.org/sites/default/files/news/FreeDP_Mar05.pdf (accessed on 15 June 2019).
  23. Abrego, L.; Riezman, R.; Whalley, J. How Reasonable are Assumptions used in Theoretical Models? Computational Evidence on the Likelihood of Trade Pattern Changes. Can. J. Econ. 2006, 39, 781–789. [Google Scholar] [CrossRef]
  24. Foreman-Peck, J.; Hallett, A.; Ma, Y. Trade Wars and the Slump. Eur. Rev. Econ. Hist. 2007, 11, 73–98. [Google Scholar] [CrossRef] [Green Version]
  25. Ossa, R. Trade Wars and Trade Talks with Data. NCBR Working Paper 17347. 2011. Available online: http://www.nber.org/papers/w17347 (accessed on 27 September 2019).
  26. Bekkers, E.; Teh, R. Potential Economic Effects of a Global Trade Conflict. Projecting the medium-run effects with the WTO Global Trade Model. WTO Staff Working Paper ERSD-2019-04. 2019. Available online: https://www.wto.org/english/res_e/reser_e/ersd201904e.pdf (accessed on 15 May 2019).
  27. Kulovesi, K. International Trade Disputes on Renewable Energy: Testing Ground for the Mutual Supportiveness of WTO Law and Climate Change Law. Rev. Eur. Comp. Int. Environ. Law. 2014, 23, 342–353. [Google Scholar] [CrossRef]
  28. Zeng, K. Domestic Politics and U.S.-China Trade Disputes over Renewable Energy, EAI Fellows Program Working Paper No. 44; University of Arkansas, East Asia Institute: Seoul, Korea, 2014; pp. 1–25. [Google Scholar]
  29. Barron, A.R. Cost reduction in the solar industry. Mater. Today 2015, 18, 2–3. [Google Scholar] [CrossRef] [Green Version]
  30. Urban, F.; Geall, S.; Wang, Y. Solar PV and solar water heaters in China: Different Pathways to low carbon energy. Renew. Sustain. Energy Rev. 2016, 64, 531–542. [Google Scholar] [CrossRef] [Green Version]
  31. Lee, J.H.; Hwang, S.G.; Lee, G.H. Efficiency Improvement of a Photovoltaic Thermal (PVT) System Using Nanofluids. Energies 2019, 12, 3063. [Google Scholar] [CrossRef] [Green Version]
  32. Lee, D.H.; Park, J.H. Developing Inspection Methodology of Solar Energy Plants by Thermal Infrared Sensor on Board Unmanned Aerial Vehicles. Energies 2019, 12, 2928. [Google Scholar] [CrossRef] [Green Version]
  33. Zukowski, M.; Radziejewska, P. A New Method to Determine the Annual Energy Output of Liquid-Based Solar Collectors. Energies 2019, 12, 4586. [Google Scholar] [CrossRef] [Green Version]
  34. Liu, W.; Lund, H.; Mathiesen, B.V.; Zhang, X. Potential of renewable energy systems in China. Appl. Energy 2011, 88, 518–525. [Google Scholar] [CrossRef] [Green Version]
  35. Chen, Y. EU-China Solar Panels Trade Dispute: Settlement and Challenges to the EU. EU-Asia at a Glance, European Institue for Asian Studies, Brussels, June. Available online: http://www.eias.org/wp-content/uploads/2016/02/EU-Asia-at-a-glance-EU-China-Solar-Panels-Dispute-Yu-Chen.pdf (accessed on 20 May 2019).
  36. Strielkowski, W.; Štreimikiene, D.; Bilan, Y. Networks charging and resedential tariffs: A case of household photovoltiaics in the United Kingdom. Renew. Sustain. Energy Rev. 2017, 77, 461–473. [Google Scholar] [CrossRef]
  37. Zhang, D.; Wang, J.; Lin, Y.; Si, Y.; Huang, C.; Yang, J.; Huang, B. Present situation and future prospects of renewable energy in China. Renew. Sustain. Energy Rev. 2017, 76, 865–871. [Google Scholar] [CrossRef]
  38. Burke, P.J.; Widnyana, J.; Anjum, Z.; Aisbett, E.; Resosudarmo, B.; Baldwin, K.G.H. Overcoming barriers to solar and wind energy adoption in two Asian giants: India and Indonesia. Energy Policy 2019, 132, 1216–1228. [Google Scholar] [CrossRef]
  39. Virupaksha, V.; Harty, M.; McDonnell, K. Microgeneration of Electricity Using a Solar Photovoltaic System in Ireland. Energies 2019, 12, 4600. [Google Scholar] [CrossRef] [Green Version]
  40. Gava Gastaldo, N.; Rediske, G.; Donaduzzi Rigo, P.; Brum Rosa, C.; Michels, L.; Siluk, J.L.M. What is the Profile of the Investor in Household Solar Photovoltaic Energy Systems? Energies 2019, 12, 4551. [Google Scholar] [CrossRef] [Green Version]
  41. Ko, W.; Al-Ammar, E.; Almahmeed, M. Development of Feed-in Tariff for PV in the Kingdom of Saudi Arabia. Energies 2019, 12, 2898. [Google Scholar] [CrossRef] [Green Version]
  42. Lyeonov, S.; Pimonenko, T.; Bilan, Y.; Štreimikiene, D.; Mentel, G. Assessment of Green Investments’ Impact on Sustainable Development: Linking Gross Domestic Product Per Capita, Greenhouse Gas Emissions and Renewable Energy. Energies 2019, 12, 3891. [Google Scholar] [CrossRef] [Green Version]
  43. Răbocă, M.S.; Badea, G.; Enache, A.; Filote, C.; Răsoi, G.; Rata, M.; Lavric, A.; Felseghi, R.-A. Concentrating Solar Power Technologies. Energies 2019, 12, 1048. [Google Scholar] [CrossRef] [Green Version]
  44. McCarthy, K.J. On the influence of the European trade barrier on the Chinese PV industry: Is the solution to the solar-dispute “successful”? Energy Policy 2016, 99, 154–157. [Google Scholar] [CrossRef] [Green Version]
  45. Meckling, J. Governing renewables: Policy feedback in a global energy transition. Politics Space 2019, 37, 317–338. [Google Scholar] [CrossRef]
  46. Dong, Y.; Whalley, J. Gains and losses from potential bilateral US China trade retaliation. Econ. Model. 2012, 29, 2226–2236. [Google Scholar] [CrossRef]
  47. Hughes, L.; Meckling, J. The politics of renewable energy trade: The US-China solar dispute. Energy Policy 2017, 105, 256–262. [Google Scholar] [CrossRef]
  48. Haider, S.; Zaidi, A.; Wang, X.-Y.; Sajid, M. US-China Trade Dispute and Its Implications. Am. J. Res. 2018, 11, 32–54. [Google Scholar] [CrossRef]
  49. Horn, H.; Mavroidis, P.C. WTO Dispute Settlement Data Set. 2008. Available online: http://www.worldbank.org/trade (accessed on 15 May 2019).
  50. Rubini, L. Ain’t Wastin’Time No More: Subsidies for Renewable Energy, The SCM Agreement, Policy Space, and Law Reform. J. Int. Econ. Law 2012, 15, 525–579. [Google Scholar] [CrossRef]
  51. Leahy, D.; Neary, P. Learning by doing, precommitment, and infant-industry protection. Rev. Econ. Stud. 1999, 66, 447–474. [Google Scholar] [CrossRef] [Green Version]
  52. Baldwin, R. Openness and Growth: What’s the Empirical Relationship? NBER WP9578. 2003. Available online: http://citeseerx.ist.psu.edu/viewdoc/download?doi=10.1.1.159.7249&rep=rep1&type=pdf (accessed on 30 May 2019).
  53. Miravete, E. Time-consistent protection with learning by doing. Eur. Econ. Rev. 2003, 47, 761–790. [Google Scholar] [CrossRef] [Green Version]
  54. Melitz, M.J. When and how should infant industries be protected? J. Int. Econ. 2005, 66, 177–196. [Google Scholar] [CrossRef] [Green Version]
  55. Petkov, V.P. Infant Firm Subsidization in Industries with Dynamic Structure. J. Int. Compet. Trade 2007, 7, 73–93. [Google Scholar] [CrossRef]
  56. Abboushi, S. Trade protectionism: Reasons and outcomes. Compet. Rev. 2010, 20, 384–394. [Google Scholar] [CrossRef]
  57. Orgun, B.O. Strategic Trade Policy versus Free Trade. Procedia Soc. Behav. Sci. 2012, 58, 1283–1292. [Google Scholar] [CrossRef] [Green Version]
  58. Silva, J.R.; Faustino, H.C. Strategic Trade Policy and the New WTO Round. ISEG/UTL. 2001, pp. 1–23. Available online: http://citeseerx.ist.psu.edu/viewdoc/download?doi=10.1.1.601.3460&rep=rep1&type=pdf (accessed on 31 May 2019).
  59. Etro, F. Endogenous market structures and strategic trade policy. Int. Econ. Rev. 2009, 52, 63–84. [Google Scholar] [CrossRef] [Green Version]
  60. Carbaugh, R.; St. Brown, M. Industrial Policy and Renewable Energy: Trade Conflicts. J. Int. Glob. Econ. Stud. 2012, 5, 1–16. [Google Scholar]
  61. Shadikhodjaev, S. Renewable Energy and Government Support: Time to “Green” the SCM Agreement? World Trade Rev. 2015, 14, 479–506. [Google Scholar] [CrossRef]
  62. Bougette, P.; Charlier, C.H. Renewable energy, subsidies, and the WTO: Where has the “green” gone? Energy Econ. 2015, 51, 407–416. [Google Scholar] [CrossRef] [Green Version]
  63. Kuik, O.; Branger, F.; Quirion, P.H. Competitive advantage in the renewable energy industry: Evidence from a gravity model. Renew. Energy 2019, 131, 472–481. [Google Scholar] [CrossRef]
  64. Wu, M.; Salzman, J.E. The Next Generation of Trade and Environment Conflicts: The Rise of Green Industrial Police. Northwestern Univ. Law Rev. 2014, 108, 401–474. [Google Scholar]
  65. Woo, W.T.; Xiao, G. Facing Protectionism Generated by Trade Disputes: China’s Post-WTO Blues. SSRN Electron. J. 2007, 4, 45–70. [Google Scholar] [CrossRef] [Green Version]
  66. Krugman, P. Competitiveness: A Dangerous Obsession. Foreign Aff. 1994, 73, 28–44. [Google Scholar] [CrossRef]
  67. Frohlich, M.T.; Dixon, J.R. A taxonomy of manufacturing strategies revisited. J. Oper. Manag. 2001, 19, 541–558. [Google Scholar] [CrossRef]
  68. Balassa, B. Trade Liberalization and “Revealed” Comparative Advantage. Manch. Sch. 1965, 33, 99–123. [Google Scholar] [CrossRef]
  69. Suwannarat, P. Ascertaining the competitiveness of Thai exports to PRC. Compet. Rev. 2017, 27, 275–299. [Google Scholar] [CrossRef]
  70. Hinloopen, J.; Van Marrewijk, C. On the empirical distribution of the Balassa index. Rev. World Econ. 2001, 137, 1–49. [Google Scholar] [CrossRef] [Green Version]
  71. Erkan, B.; Sariçoban, K. Comparative Analysis of the Competitiveness in Export of Science-Based Goods Regarding Turkey and the EU+13 Countries. Int. J. Bus. Soc. Sci. 2014, 5, 117–130. [Google Scholar]
  72. USTR. Countervailing Duty Measures on Certain Products from China. 2019. Available online: https://ustr.gov/node/1464 (accessed on 20 April 2019).
  73. WTO. DS437: United States—Countervailing Duty Measures on Certain Products from China. 2019. Available online: https://www.wto.org/english/tratop_e/dispu_e/cases_e/ds437_e.htm (accessed on 16 April 2019).
  74. USTR. President Trump Approves Relief for U.S. Washing Machine and Solar Cell Manufacturers. 2019. Available online: https://ustr.gov/about-us/policy-offices/press-office/press-releases/2018/january/president-trump-approves-relief-us (accessed on 20 April 2019).
  75. USTR. Section 201 Cases: Imported Large Residential Washing Machines and Imported Solar Cells and Modules. 2019. Available online: https://ustr.gov/sites/default/files/files/Press/fs/201%20FactSheet.pdf (accessed on 20 April 2019).
  76. WTO. WTO Dispute Settlement Gateway. 2019. Available online: https://www.wto.org/english/tratop_e/dispu_e/dispu_subjects_index_e.htm (accessed on 16 April 2019).
  77. Ministry of Commerce People’s Republic of China. Statement by China at the DSB Meeting. 2018. Available online: http://english.mofcom.gov.cn/article/newsrelease/counselorsoffice/bilateralexchanges/201908/20190802886550.shtml (accessed on 15 April 2019).
  78. USTR. Office of the US Trade Representative, Certain Measures Relating to Solar Cells and Solar Modules. 2019. Available online: https://ustr.gov/issue-areas/enforcement/dispute-settlement-proceedings/wto-dispute-settlement/pending-wto-dispute-10 (accessed on 20 May 2019).
  79. WTO. DS412: Canada—Certain Measures Affecting the Renewable Energy Generation Sector. 2019. Available online: https://www.wto.org/english/tratop_e/dispu_e/cases_e/ds412_e.htm (accessed on 16 April 2019).
  80. WTO. DS452: European Union and Certain Member States—Certain Measures Affecting the Renewable Energy Generation Sector. 2019. Available online: https://www.wto.org/english/tratop_e/dispu_e/cases_e/ds452_e.htm (accessed on 16 April 2019).
  81. European Commission, Press Release, EU Imposes Provisional Anti-Dumping Tariffs on Chinese solar Panels. 2013. Available online: http://europa.eu/rapid/press-release_IP-13-501_en.htm (accessed on 20 May 2019).
  82. European Commission, Press Release, EU Imposes Definitive Measures on Chinese Solar Panels, Confirms Undertaking with Chinese Solar Panel Exporters. 2013. Available online: http://europa.eu/rapid/press-release_IP-13-1190_en.htm (accessed on 19 May 2019).
  83. Plasschært, S. Assessing the Solar Energy Dispute between the European Union and the People’s Republic of China. ECIPE Work. Pap. 2016, 01, 1–42. [Google Scholar]
  84. ITC Trade Map Database. Available online: https://www.trademap.org/Index.aspx (accessed on 15 May 2019).
  85. Bloomberg News. Reforms Hit Home Market. 2018. Available online: https://www.bloomberg.com/news/articles/2018–12-06/china-ramps-up-solar-panel-exports-after-policy-hits-home-market (accessed on 21 May 2019).
  86. Shum, R.Y. The coming solar trade war: Obstacles to decarbonization from a political economy conflict. Electr. J. 2017, 30, 49–53. [Google Scholar] [CrossRef]
  87. Energy Sage. How the 2018 US Solar Tariff Will Impact the Price You Pay. 2019. Available online: https://news.energysage.com/2018-us-solar-tariff-impact-prices (accessed on 21 May 2019).
  88. SEIA. President’s Decision on Solar Tariffs Is a Loss for America. 2018. Available online: https://www.seia.org/news/presidents-decision-solar-tariffs-loss-america (accessed on 20 May 2019).
  89. Reuters. Billions in US Solar Projects Have been Shelved after Trump Panel Tariff. 2018. Available online: https://www.cnbc.com/2018/06/07/billions-in-us-solar-projects-have-been-shelved-after-trump-panel-tariff.html (accessed on 20 May 2019).
  90. WTO. Statement by Director-General Azevêdo in Relation to the Council on Trade in Goods. 2018. Available online: https://www.wto.org/english/news_e/news18_e/dgra_23mar18_e.htm (accessed on 16 April 2019).
  91. Sung, B.; Wen, C. Causal Dynamic Relationships between Political-Economic Factors and Export Performance in the Renewable Energy Technologies Market. Energies 2018, 11, 874. [Google Scholar] [CrossRef] [Green Version]
Figure 1. Research conceptualization (research strategy).
Energies 13 00500 g001
Figure 2. Share of analyzed countries in total exports and concentration of world’s photovoltaic panels exports in 2007–2018. Source: own elaboration based on the ITC Trade Map [84].
Energies 13 00500 g002
Figure 3. Revealed Comparative Advantage (RCA) index versus country’s exports share in the world exports of photovoltaic panels. Source: own elaboration.
Energies 13 00500 g003
Table 1. World Trade Organization (WTO) trade disputes over solar energy.
Number of CaseSubjectComplainantRespondent
(Trade Measures)
Third PartiesInitiation Date/
Status
Selected WTO Provisions Referred to
DS437Countervailing Duty Measures on Certain Products from ChinaChinaUnited States
(countervailing duties)
Australia; Brazil; Canada; European Union; India; Japan; Republic of Korea, Norway; Russian Federation; Turkey; Viet Nam; Saudi Arabia25 May 2012/
pending
Subsidies and Countervailing Measures: Art. 1.1, 1.1(a) (1), 1.1(b), 2, 10, 11, 11.1, 11.2, 11.3, 12.7, 14(d), 30, 32.1; GATT 1994: Art. VI, XXIII
DS456Certain Measures Relating to Solar Cells and Solar ModulesUnited StatesIndia
(domestic content requirements)
Brazil; Canada; China; European Union; Japan; Korea, Republic of; Malaysia; Norway; Russian Federation; Turkey; Ecuador; Saudi Arabia, Kingdom of; Chinese Taipei6 February 2013/
pending
GATT 1994: Art. III:4
Trade-Related Investment Measures (TRIMs): Art. 2.1
Subsidies and Countervailing Measures: Art. 3.1(b), 3.2, 5(c), 6.3(a), 6.3(c), 25
DS412Certain Measures Affecting the Renewable Energy Generation SectorJapanCanada
(domestic content requirements, subsidies)
Australia; Brazil; China; El Salvador; European Union; Honduras; India; Saudi Arabia; Republic of Korea; Mexico; Norway; Chinese Taipei; United States13 September 2010/
implementation notified by respondent
GATT 1994: Art. III: 4, III:5, XXIII:1; Subsidies and Countervailing Measures: Art. 1.1, 3.1(b), 3.2
Trade-Related Investment Measures (TRIMs): Art. 2.1
DS452Certain Measures Affecting the Renewable Energy Generation SectorChinaEuropean Union; Italy; Greece
(domestic content requirements, subsidies)
-5 November 2012/
resolved by consultations
GATT 1994: Art. I, III:1, III:4, III:5
Subsidies and Countervailing Measures: Art. 1.1, 3.1(b), 3.2
Trade-Related Investment Measures (TRIMs): Art. 2.1, 2.2
DS510Certain Measures Relating to the Renewable Energy SectorIndiaUnited States
(subsidies, domestic content requirements)
Brazil; China; European Union; Indonesia; Japan; Korea, Republic of; Norway; Russian Federation; Saudi Arabia, Kingdom of; Singapore; Chinese Taipei; Turkey9 September 2016/
pending
GATT 1994: Art. III:4, XVI:1
Subsidies and Countervailing Measures: Art. 3.1(b), 3.2, 5(a), 5(c), 6.3(a), 25
Trade-Related Investment Measures (TRIMs): Art. 2.1
DS545Safeguard measure on imports of crystalline silicon photovoltaic productsKorea, Republic ofUnited States
(safeguards - increased tariffs)
Brazil; Canada; China; European Union; Egypt; India; Japan; Kazakhstan; Malaysia; Mexico; Norway; Philippines; Russian Federation; Singapore; Chinese Taipei; Thailand; Viet Nam14 May 2018/
pending
GATT 1994: Art. X:3, XIII, XIX:1
Safeguards: Art. 1, 2.1, 3.1, 3.2, 4.1, 4.1(c), 4.2, 5.1, 5.2, 7.1, 7.4, 8.1, 12.1, 12.2, 12.3
DS562Safeguard Measure on Imports of Crystalline Silicon Photovoltaic ProductsChinaUnited States
(safeguards - increased tariffs)
-14 August 2018/
pending
GATT 1994: Art. X:3, XIII, XIX:1, XIX:2
Safeguards: Art. 2.1, 2.2, 3.1, 3.2, 4.1, 4.1(c), 4.2, 5.1, 7.1, 8.1, 12.1, 12.2, 12.3
DS563Certain Measures Related to Renewable EnergyChinaUnited States
(domestic content requirements)
-14 August 2018/
pending
GATT 1994: Art. III:4
Trade-Related Investment Measures (TRIMs): Art. 2.1, 2.2
Subsidies and Countervailing Measures: Art. 3.1(b), 3.2
Source: Adapted from WTO [76].
Table 2. Descriptive statistics for share of country’s total exports of photovoltaic panels of the 19 top exporters countries, in 2007–2018.
Measures20072010201420152018
Mean (Average Export Share)5.195.225.245.255.25
Maximum Export Share26.6734.6235.0336.6934.34
Minimum Export Share0.020.000.050.030.05
Coefficiant Variation (in %)151172155157149
Skewness Index1.622.272.272.882.67
Median0.780.982.472.833.15
Source: own elaboration based on ITC Trade Map [84].
Table 3. The share of country’s exports in world exports of photovoltaic panels for the top 19 countries, in 2007–2018.
ClustersMeasures
MeanMaximum Export’s ShareMinimum Export’s ShareCoefficient Variation (in %)Skewness IndexMedian
2007–2010
Cluster 1: {EU, China}27.0427.1926.890.5627.04
Cluster 2: {Japan, Taipei}12.0013.8210.1715.2412
Cluster 3: {Malaysia, Korea Rep. of, Hong Kong, United States}3.875.872.7330.791.423.47
Cluster 4: {Singapore, Mexico, India, Viet Nam, United Arab Emirates, Indonesia, Russian Federation, Thailand, Philippines Canada, Switzerland}0.471.750.01113.311.40.27
2011–2014
Cluster 1: {EU, Japan, Taipei}12.5317.419.2528.091.4410.93
Cluster 2: {China}33.8433.8433.8433.83
Cluster 3: {Malaysia, Hong Kong, Korea Rep. of, United States, Singapore, Philippines, Mexico}3.846.481.3444.95-0.074.19
Cluster 4: {Viet Nam, Canada, Switzerland, Indonesia, United Arab Emirates, Russian Federation, Thailand, India}0.180.350.0366.010.470.15
2015–2018
Cluster 1: {EU}12.7412.7412.7412.74
Cluster 2: {Malaysia, Korea Rep. of, Japan, Taipei, Hong Kong, United States of America, Singapore}6.488.434.1124.4−0.517.21
Cluster 3: {Viet Nam, Thailand, Philippines, Mexico, Canada, Switzerland, India, Indonesia, United Arab Emirates, Russian Federation}0.832.850.04110.51.190.36
Cluster 4: {China}33.0733.0733.0733.07
Source: own elaboration based on ITC Trade Map [84] (Countries in bold were involved in trade disputes over solar energy).
Table 4. RCA and export shares indexes for export of photovoltaic solar panels (covered by the code HS 854140) of selected countries, in their global and bilateral trade, in 2007–2018.
Countries200720082009201020112012201320142015201620172018
RCA Indexes for Export of Photovoltaic Panels in Global Trade
China2.1793.0312.8543.3123.5432.8692.6612.8422.6722.3502.3902.648
Canada0.1120.1320.0880.0500.0570.1200.0930.1120.2240.2160.1980.150
European Union0.7000.8020.7480.7190.6640.6230.4720.4190.3870.3600.3890.399
India0.7381.0730.7910.5520.2610.1300.2230.1890.1580.1440.1560.128
Japan3.8782.9242.5741.7381.9312.4552.4652.2561.8411.7931.8421.941
Republic of Korea0.7670.7041.1501.6941.6842.3802.5272.0491.9682.4872.6622.580
United States0.8330.6710.7320.5420.4820.5180.5310.4690.4610.4710.5150.560
Malaysia2,7111.3831.7002.7132.8903.7255.3725.0165.6036.8526.1506.613
RCA Indexes for Photovoltaic Panels in Bilateral Trade of Selected Pairs of Countries
Bilat China/ US1.0891.0431.2961.8552.5751.6721.5361.7591.2970.9780.7680.529
Bilat US/China0.3370.2980.3120.3300.2070.1930.1520.1780.1470.1720.2090.437
Bilat China/EU6.4627.7946.8647.5518.1487.7755.1523.7663.1992.6901.6052.339
Bilat EU/China0.3750.3850.5480.3180.3590.1870.1860.1340.1200.1690.1490.171
Bilat US/India0.1950.9592.4821.8763.2970.8730.3310.3960.1140.0350.0581.495
Bilat India/US0.9770.4510.3630.6300.4510.1050.0350.2880.0890.0380.2120.610
Bilat Japan/Canada3.3203.0912.1642.2830.7571.2961.4401.4801.3592.5432.5812.308
Bilat Canada/Japan0.0600.0620.0470.0190.0330.0320.0140.0100.0110.0190.0240.026
Bilat Rep. of Korea/US0.3280.4240.3600.4220.6481.8451.3411.6002.3853.9684.7924.012
Bilat US/Rep. of Korea0.8480.9950.6080.3000.1800.1060.0770.0940.0630.1070.1290.116
Bilat Malaysia/US5.7402.9163.0593.6268.59717.98424.88218.07122.48421.77721.21527.251
Bilat US/Malaysia0.4150.4050.2080.4480.5750.1090.1650.0640.1640.0920.1250.131
Bilat Malaysia/EU5.8382.7085.4989.1217.9533.80211.48013.11210.0669.43910.13820.877
Bilat EU/Malaysia0.9992.4251.9811.0340.9650.3560.4310.3500.3380.3710.2610.241
Source: Own elaboration based on ITC Trade Map [84].

